Detection of Virgin Olive Oil Adulteration Using Low Field Unilateral NMR


Abstract
: The detection of adulteration in edible oils is a concern in the food industry, especially for the higher priced virgin olive oils. This article presents a low field unilateral nuclear magnetic resonance (NMR) method for the detection of the adulteration of virgin olive oil that can be performed through sealed bottles providing a non-destructive screening technique. Adulterations of an extra virgin olive oil with different percentages of sunflower oil and red palm oil were measured with a commercial unilateral instrument, the profile NMR-Mouse. The NMR signal was processed using a 2-dimensional Inverse Laplace transformation to analyze the transverse relaxation and self-diffusion behaviors of different oils. The obtained results demonstrated the feasibility of detecting adulterations of olive oil with percentages of at least 10% of sunflower and red palm oils.1. Introduction
The detection of adulteration in high priced olive oils is a particular concern in the food industry. Virgin olive oil is simply pressed fruit without any additives and without the use of heat in the process; the best of these in terms of flavor are classified as extra virgin and must pass chemical tests in a laboratory and a sensory evaluation. The adulteration of extra virgin olive oil with other cheaper oils can lead to significant profits for the unscrupulous dealer. Laboratory-based methods have been extensively developed for the monitoring of adulteration of virgin olive oils with other edible oils [1–3]. Chromatographic methods [4] and mass spectrometry [5] have been used to study the adulteration of olive oil with hazelnut oil. Synchronous fluorescence spectroscopy was employed for quantitative determination of virgin olive oil adulteration with sunflower oil [6]. Priego Capote et al. developed an analytical method based on a gas chromatograph for the detection of extra virgin olive oil adulteration with four edible vegetable oils: sunflower, corn, peanut and coconut oils [7]. NMR spectroscopy was proven to be a much more effective method in the authentication of virgin olive oil based on their geographical origin [8]. For authentication purposes, several variables have been studied, including 1H, 13C-, and 31P-NMR analyses [9]. With more detailed NMR analyses, the diffusion coefficient of minor constituents of olive oil was chosen as a marker parameter [10,11]. All these methods have been employed with some success, but there are also some problems. Chromatographic methods of edible oil authentication have proved unable to detect adulterations at low concentrations [2]. Mass and NMR spectroscopy methods need large, expensive instrument, which are not suitable for screening. Fluorescence spectroscopy requires preprocessing operation to the samples and only Raman spectroscopy offers the possibility of a field portable instrument [12].
This article presents an alternative method, namely low field unilateral NMR, with the same potential as Raman for operation ‘in the field’. With this method, the transverse relaxation and self-diffusion of different adulterated oils have been studied. The samples can be measured without any preprocessing operation and the unilateral magnet structure means that the oils need not to be taken out from their original bottles, which can remain sealed.
2. Experimental Section
2.1. Samples
Sunflower oil (J. Sainsbury plc, Nottingham, UK) and red palm oil (Cebra Norfolk, Nottingham, UK) were used as the adulterations in the extra virgin olive oil (Napolina Ltd., Nottingham, UK). The samples were stored in the dark at room temperature until the day of analysis. Two mixtures of sunflower and extra virgin olive oils, with concentration of sunflower oil at two levels (10% and 20%), were prepared. The mixtures of sunflower and extra virgin olive oils were prepared using an Ultra-Turrax® (IKA, Staufen, Germany). The red palm was gently heated in warm water prior to mixing by hand with the olive oil.
2.2. Instrument
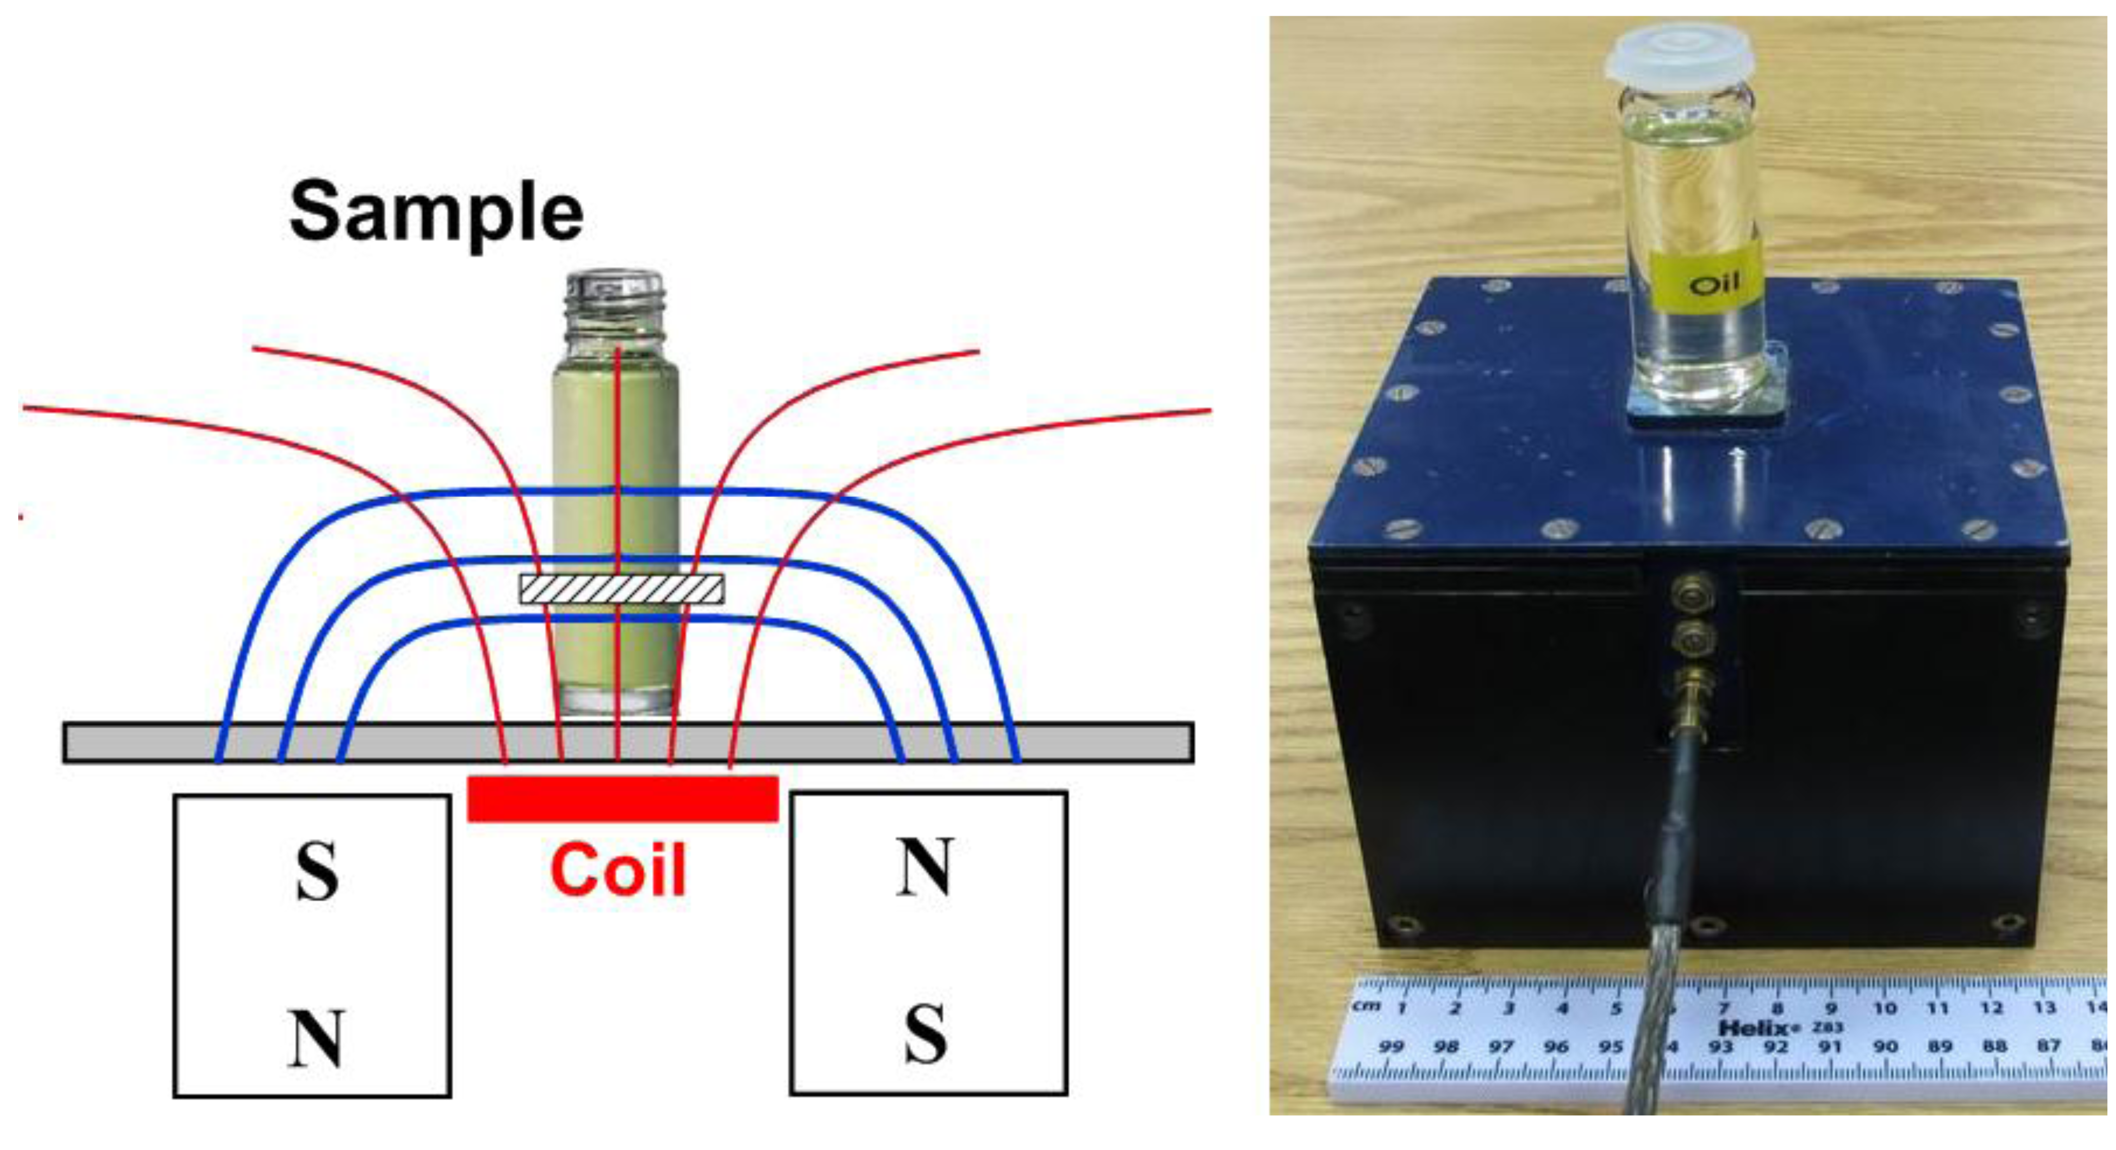
NMR signals were acquired by using a NMR portable Mouse [13] from AixNMR (Wellington, New Zealand) with a Tecmag NMR spectrometer (Houston, TX, USA). The NMR Mouse takes advantage of a unilateral permanent magnet geometry that generates a magnetic field with a uniform static gradient at a defined distance from the magnet surface (Figure 1). In the sensitive volume, the static magnetic field has a strength of 0.25 T, and the gradient of 11.38 T/m. The thickness of the sensitive volume is 100 μm. The sensitive volume is made to reside 5 mm above the coil so will probe well inside a glass container of typical wall thickness.
2.3. Measurement and Data Processing
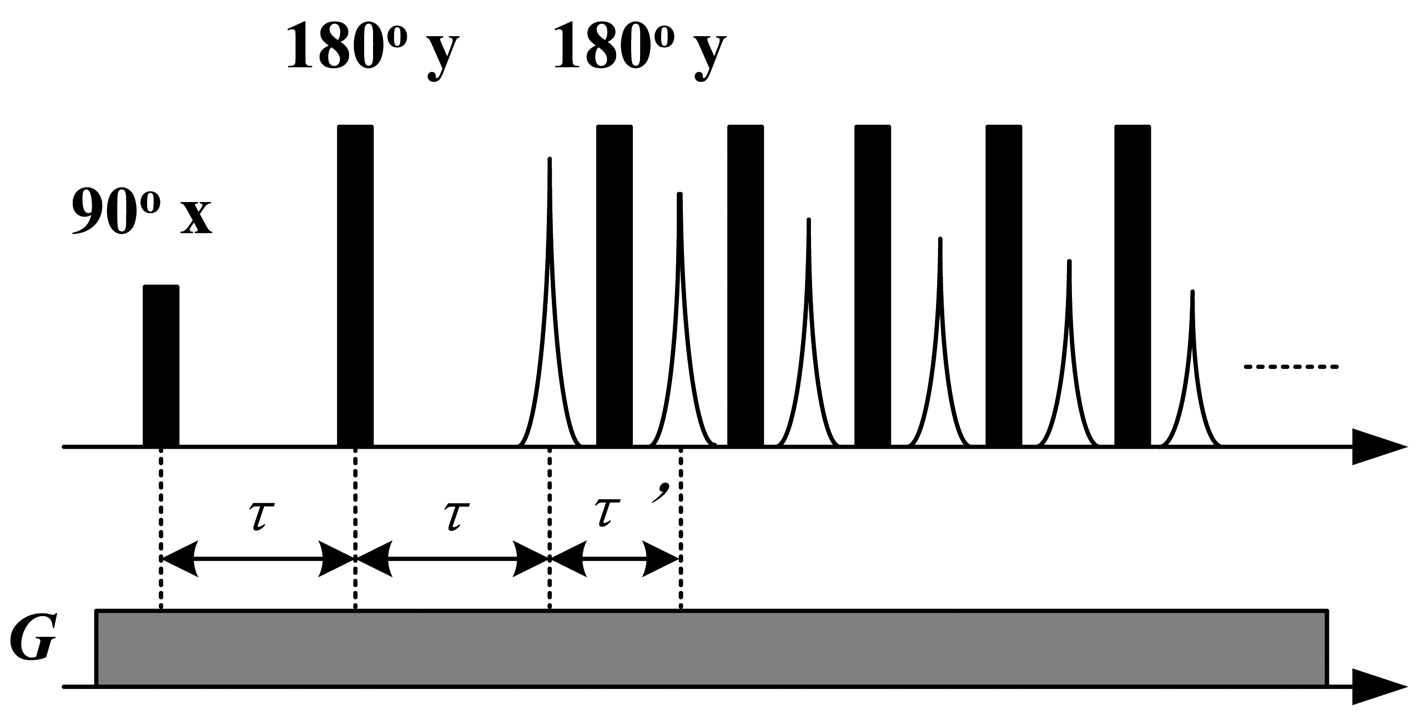
To detect the transverse relaxation and self-diffusion behaviors of oils, a SGSE [14] sequence as shown in Figure 2 was employed. The pulse widths of the 90° and the 180° pulses were 8 μs. The time interval between the 90° and the first 180° pulse (τ) was gradually increased from 120 μs to 2,500 μs for diffusion encoding. The echo time of CPMG sequence (τ') was fixed at 140 μs. The symbol G in Figure 2 corresponds to the constant gradient of the static magnetic field, which was 11.38 T/m and the RF frequency was 10.64 MHz. The CPMG echoes were recorded for further processing.
Due to the complex constituents of the samples studied, we expect to acquire multi-exponential signals for the transverse relaxation and diffusion. The recorded CPMG decay signals related to the two dimensional probability density distribution can be expressed as:
3. Results and Discussion
3.1. Mixtures of Sunflower and Extra Virgin Olive Oils
Two mixtures of sunflower and extra virgin olive oils, with sunflower concentrations at 10% and 20% by volume, pure sunflower oil and pure extra virgin olive oil, were measured. The D-T2 distributions of the different oils are plotted in Figure 3.
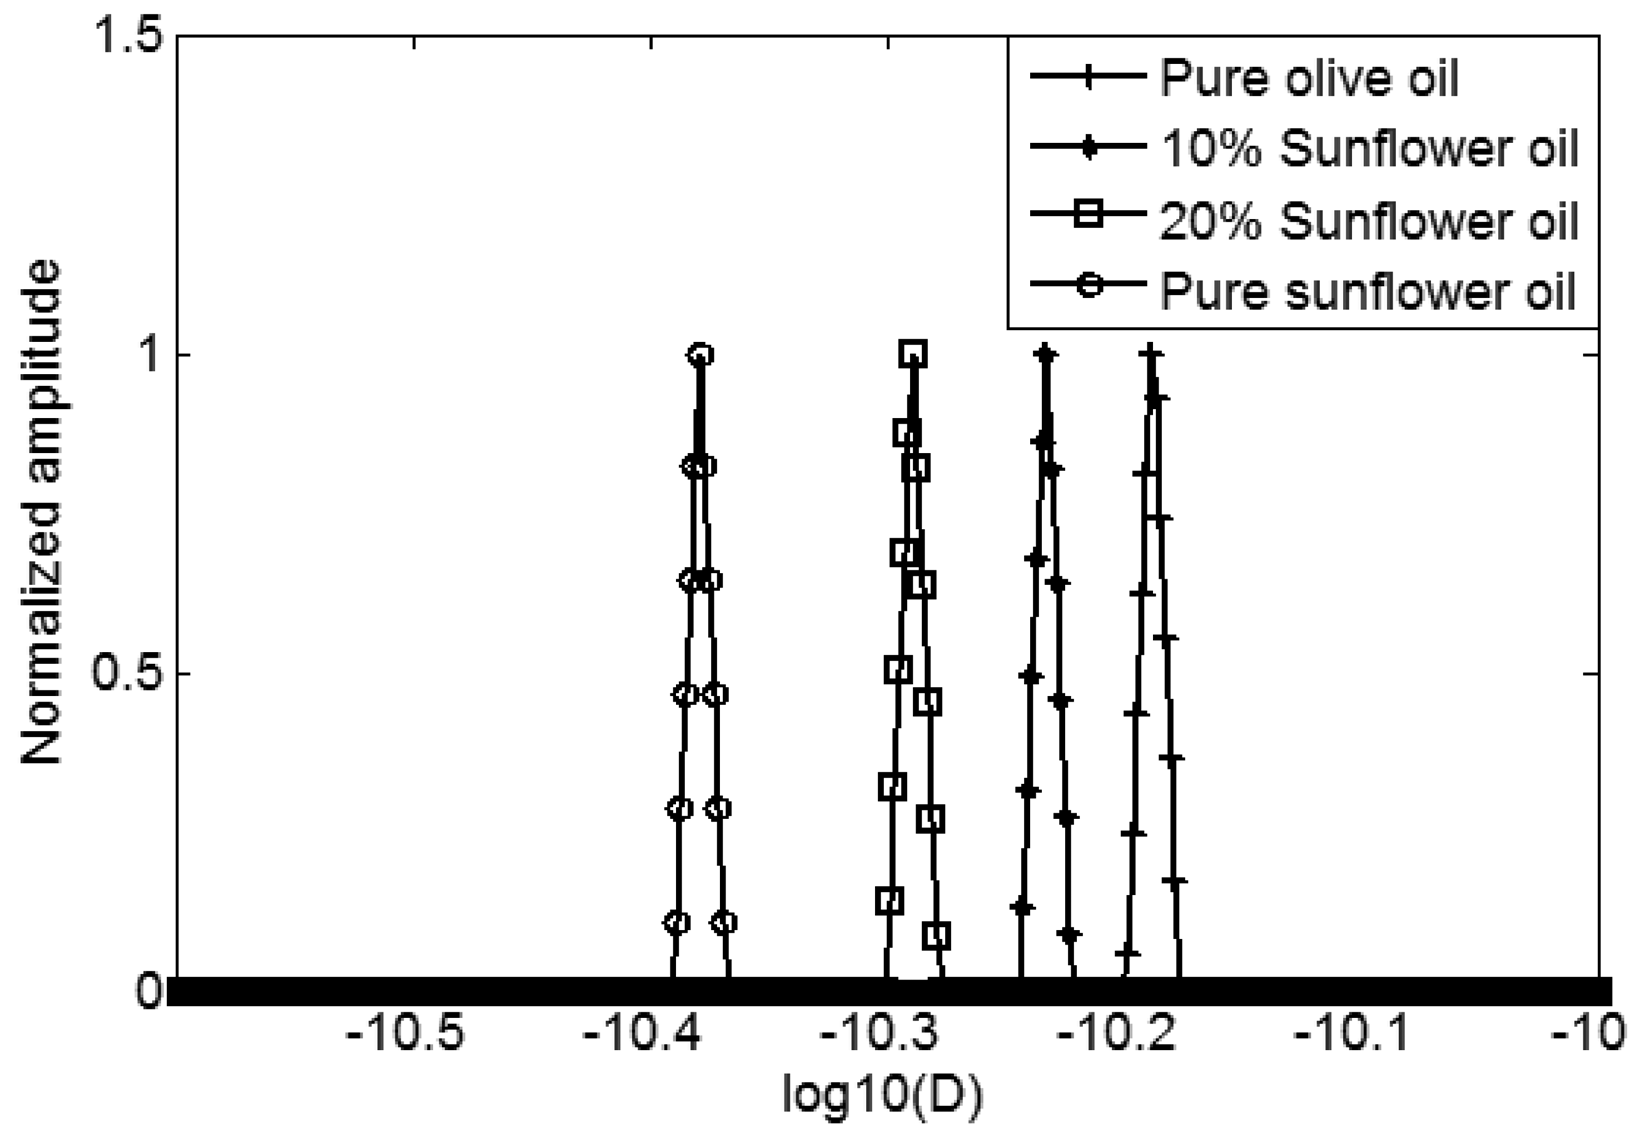
In Figure 3, we can see that the D-T2 distribution plot of different oils separate in the vertical direction (D-axis), but overlap in the lateral direction (T2-axis). It indicates that the adulteration of sunflower oil in the extra virgin olive oil can more readily be detected from the sample's diffusion behavior. In order to better show the differences in diffusion, the 2-dimensional D-T2 distributions were projected to the D-axis, forming a 1-dimensional diffusion distribution, which is shown in Figure 4.
As shown in Figure 4, from right to left there are four peaks representing the pure extra virgin olive oil, 10% sunflower and 90% olive mixed oil, 20% sunflower and 80% olive mixed oil and the pure sunflower oil. The actual self-diffusion coefficients of these four oils are 6.5 × 10⁻¹¹ m2s−1, 5.9 × 10⁻¹¹ m2s−1, 5.1 × 10⁻¹¹ m2s−1 and 4.1 × 10⁻¹¹ m2s−1, respectively. Compared to the pure extra virgin olive oil, the sunflower oil mixtures have a smaller self-diffusion coefficient. The four narrow peaks in Figure 4 indicate that there are no diffusion distributions, and the diffusion has no correlation with the T2 relaxation. The food oil we have used are not similar to petroleum oils, for example, S3 [16], which has a D-T2 correlated distribution. The diffusion-relaxation behavior of oil is complex, although we do not see the diffusion distribution and its correlation with relaxation, it is still possible that, for other food oils, a diffusion distribution and correlation exist.
3.2. Mixtures of Red Palm and Extra Virgin Olive Oils
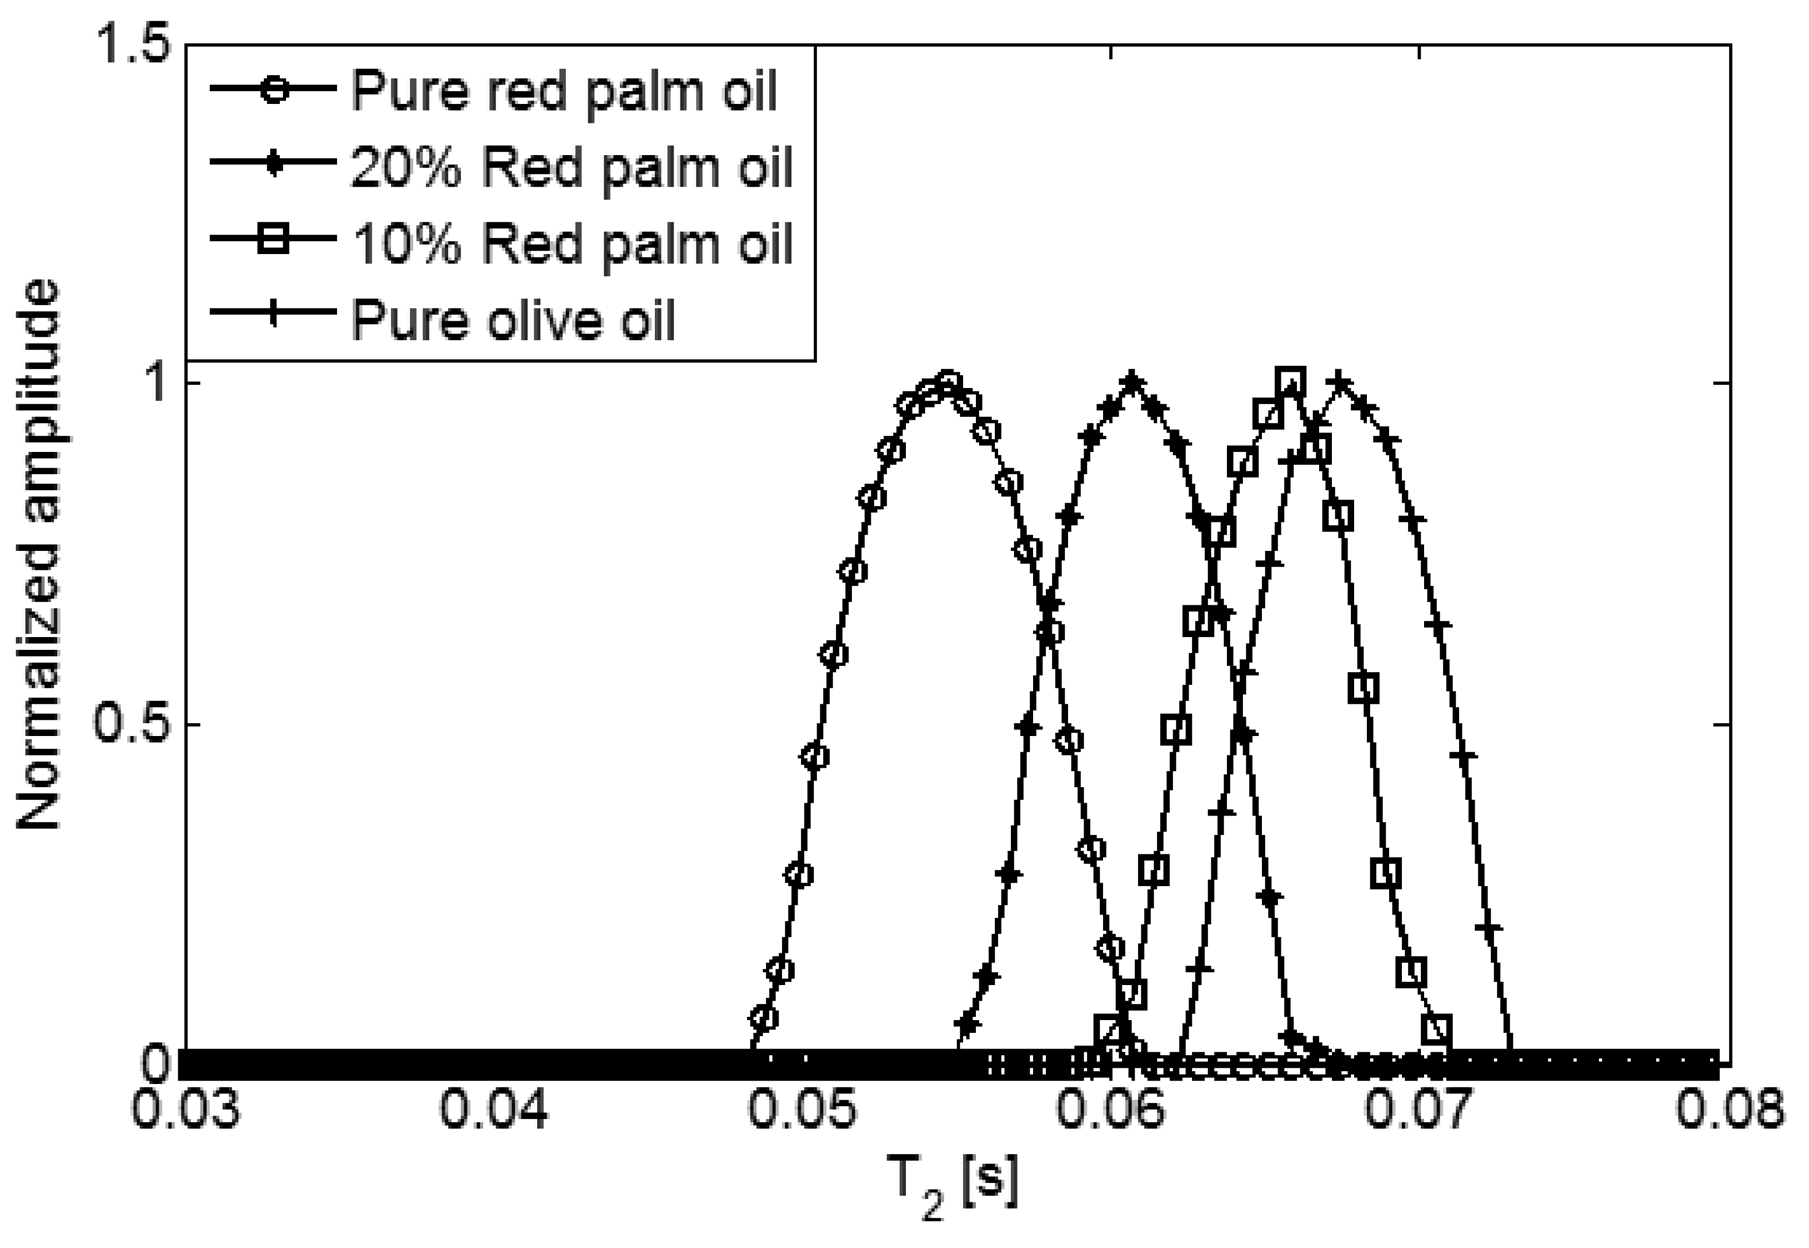
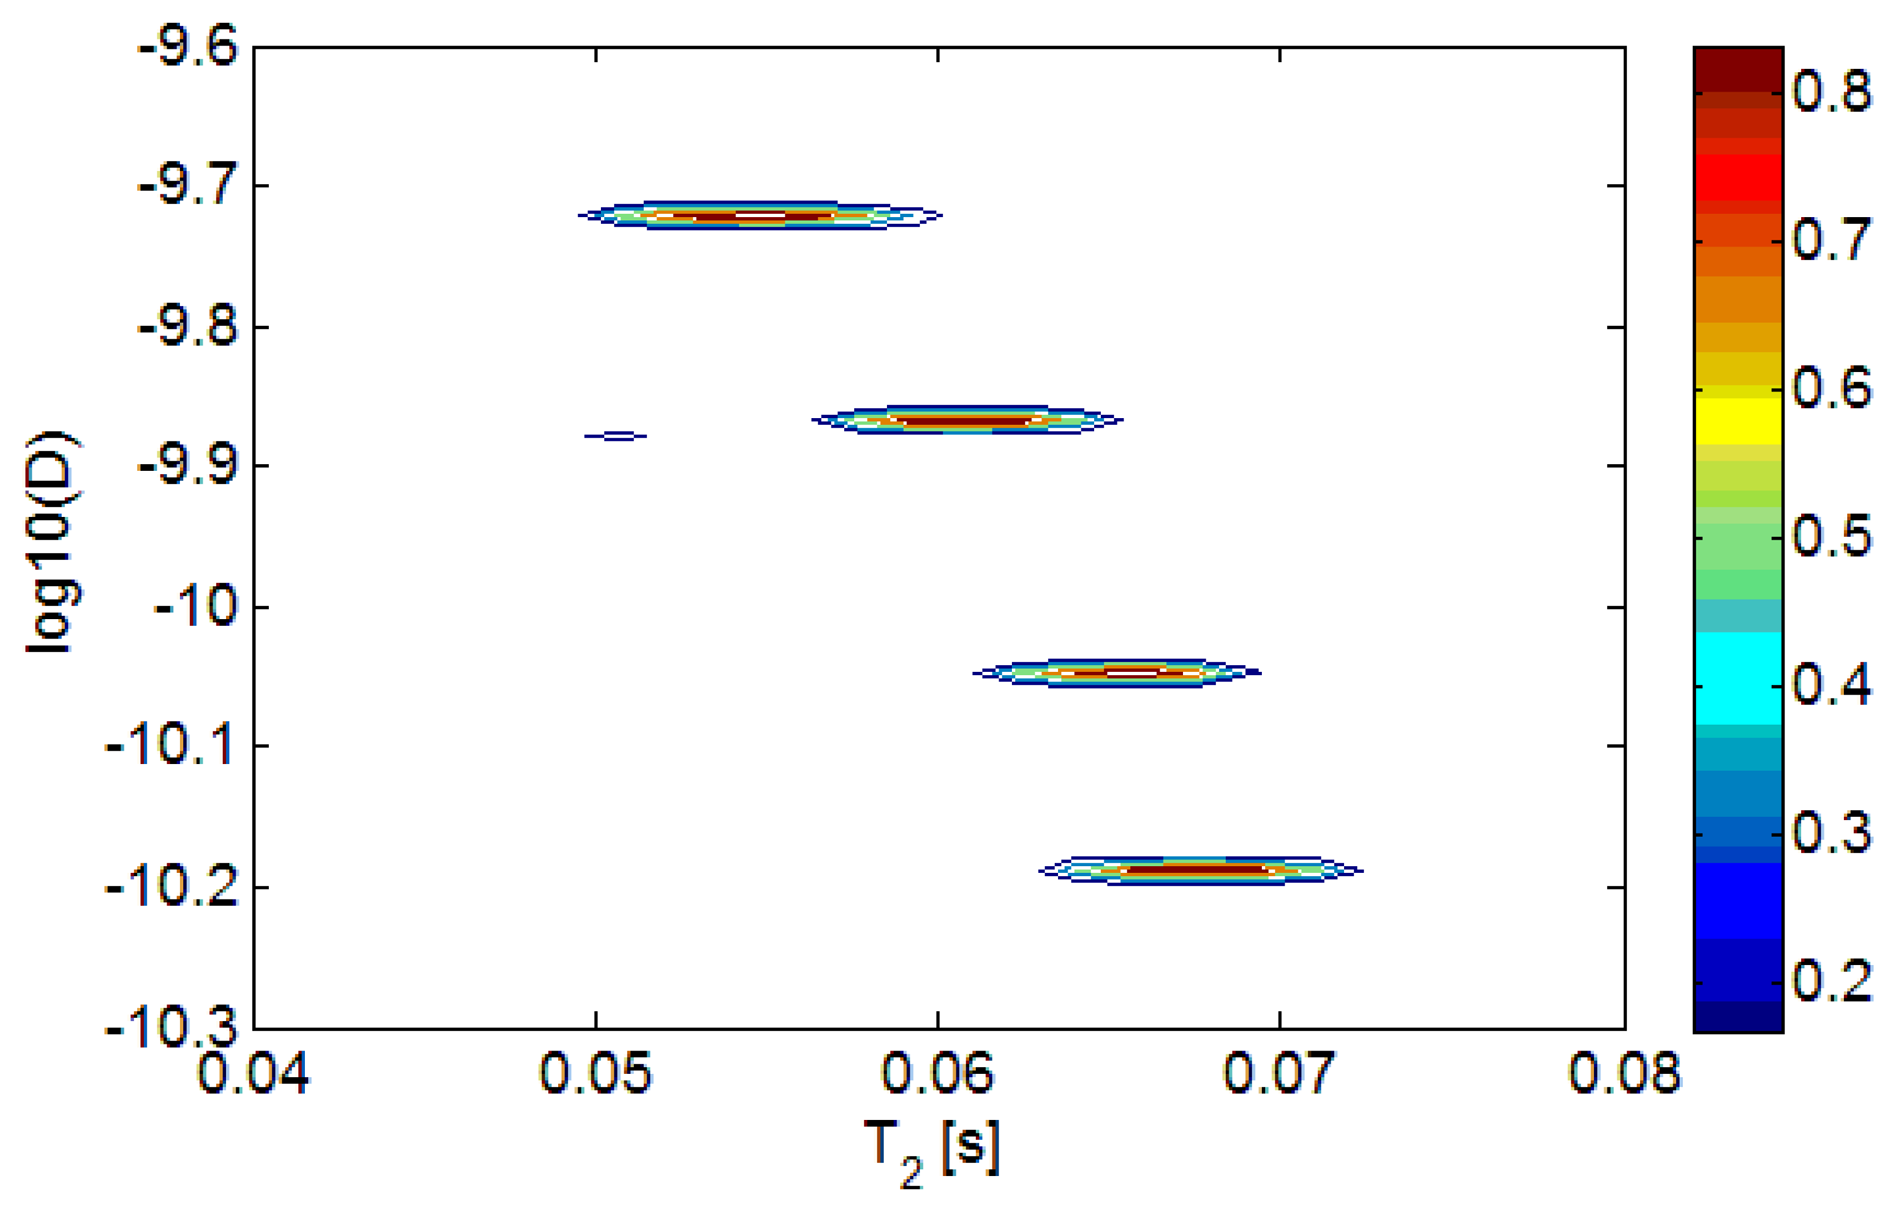
Two mixtures of red palm and extra virgin olive oils, with concentration of red palm oil at two levels (10% and 20%), pure red palm oil and pure extra virgin olive oil, were also measured. The D-T2 distributions of these four different oils are plotted in Figure 5. For the red palm and extra virgin olive mixed oils, the distributions are separated not only in D-axis, but also in T2-axis. This indicates that the adulteration of red palm oil in the extra virgin olive oil can be detected both from the diffusion and transverse relaxation behaviors. To show the differences more clearly, the 2-dimensional D-T2 distributions were projected to the D-axis and T2-axis, as shown in Figures 6 and 7.
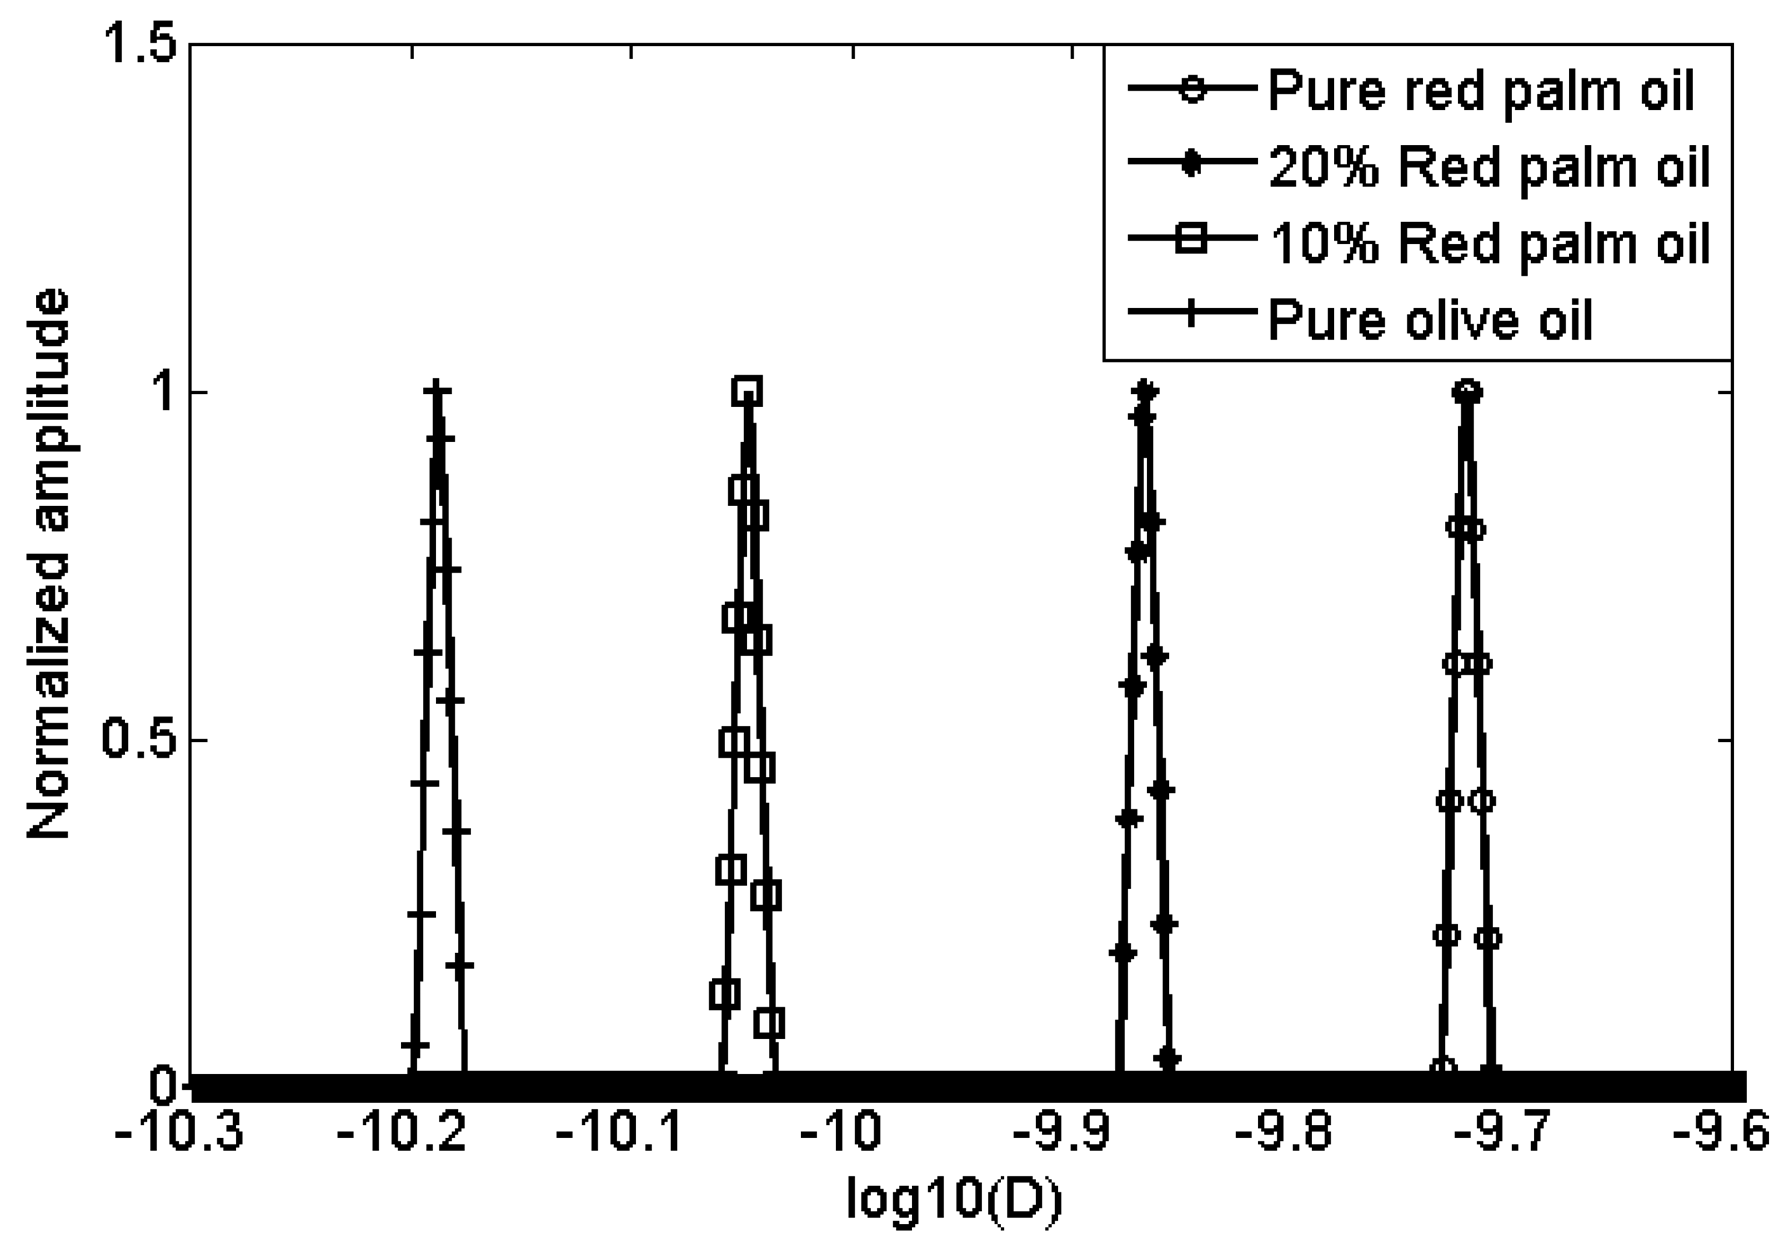
In Figure 6, from right to left there are four peaks representing the pure red palm oil, 10% red palm and 90% olive mixed oil, 20% red palm and 80% olive mixed oil and the pure extra virgin olive oil. The self-diffusion coefficient increases as the percentage of red palm oil increases, giving 6.5 × 10⁻¹¹ m2s−1, 8.9 × 10⁻¹¹ m2s−1, 1.4 × 10⁻¹¹ m2s−1 and 1.9 × 10⁻¹¹ m2s−1, respectively. While in Figure 7, the T2 decreases as the percentage of red palm oil increases, giving 67.5 ms, 64.1 ms, 60.8 ms and 54.9 ms, respectively. Comparing with the pure extra virgin olive oil, the red palm mixed oil has a larger self-diffusion coefficient but smaller T2.
4. Conclusions
This article demonstrates a low field unilateral NMR method to screen for the adulteration of extra virgin olive oil. With 2-dimensional Inverse Laplace transformation, the adulteration of extra virgin olive oil with different percentages of sunflower oil or red palm oil can be differentiated from the transverse relaxation and self-diffusion behaviors. The detection threshold is similar to that achieved using the much more expensive pulsed field gradient diffusion NMR measurement [10]. The narrow peaks in the diffusion distributions indicate that there is no distribution in the diffusion coefficients of our samples. It further suggests that the measurement of diffusion coefficient for the adulteration of olive oil can be sped up by just using two appropriate Hahn echo times (τ). Although the feasibility of this method has been demonstrated by these experiments, one problem was encountered. Measurements on the NMR MOUSE are temperature-sensitive because of the poor temperature coefficient of NdFeB magnets and an unstable static magnetic field influences the diffusion behavior measurement significantly. This however could be overcome using a temperature controlled environment or speeding up the measurement. Further work will concentrate of the ability of this technique to discriminate multiple additives.
Acknowledgments
Zheng Xu acknowledges financial support from the National Natural Science Foundation of China (No. 51107150 and 51377182).
Conflicts of Interest
The authors declare no conflict of interest.
References
- Aparicio, R.; Harwood, J. Handbook of Olive Oil, 2nd ed.; Springer: New York, NY, USA, 2013; pp. 163–395. [Google Scholar]
- Ellis, D.I.; Brewster, V.L.; Dunn, W.B.; Allwood, J.W.; Golovanov, A.P.; Goodacre, R. Fingerprinting food current technologies for the detection of food adulteration and contamination. Chem. Soc. Rev. 2012, 41, 5706–5727. [Google Scholar]
- Frankel, E.N. Chemistry of Extra Virgin Olive Oil: Adulteration, Oxidative Stability, and Antioxidants. J. Agric. Food Chem. 2010, 58, 5991–6006. [Google Scholar]
- Flores, G.; del Castill, M.L.R.; Herraiz, M.; Blanch, G.P. Study of the adulteration of olive oil withhazelnut oil byon-line coupled high performance liquid chromatographic and gas chromatographic analysis of filbertone. Food Chem. 2006, 97, 742–749. [Google Scholar]
- Pena, F.; Cardenas, S.; Gallego, M.; Valcarcel, M. Detection of adulteration of olive oil with hazelnut oil by direct coupling of headspace and mass spectrometry. J. Chromatogr. A 2005, 1027, 215–221. [Google Scholar]
- Poulli, K.I.; Mousdis, G.A.; Georgiou, C.A. Synchronous fluorescence spectroscopy for quantitative determination of virgin olive oil adulteration with sunflower oil. Anal. Bioanal. Chem. 2006, 386, 1571–1575. [Google Scholar]
- Capote, F.P.; Jiménez, J.R.; Luque de Castro, M.D. Sequential (step-by-step) detection, identification and quantitation of extra virgin olive oil adulteration by chemometric treatment of chromatographic profiles. Anal. Bioanal. Chem. 2007, 388, 1859–1565. [Google Scholar]
- Marcone, M.F.; Wang, S.A.; Albabish, W.; Nie, S.P.; Somnarain, D.; Hill, A. Diverse food-based applications of nuclear magnetic resonance (NMR) technology. Food Res. Int. 2013, 51, 729–747. [Google Scholar]
- Alonso-Salces, R.M.; Moreno-Rojas, J.M.; Holland, M.V.; Reniero, F.; Guillou, C.; Heberger, K. Virgin olive oil authentication by multivariate analyses of 1H NMR fingerprints and 13C and 2H data. J. Agric. Food Chem. 2010, 58, 5586–5596. [Google Scholar]
- Smejkalova, D.; Piccolo, A. High-power gradient diffusion NMR spectroscopy for the rapid assessment of extra-virgin olive oil adulteration. Food Chem. 2010, 118, 153–158. [Google Scholar]
- Altun, A.; Ok, S. NMR Analyses and Diffusion Coefficient Determination of Minor constituents of olive oil: Combined Experimental and Theoretical Studies. J. Chem. Eng. Data 2012, 57, 2619–2624. [Google Scholar]
- Zou, M.Q.; Zhang, X.F.; Qi, X.H.; Ma, H.L.; Dong, Y.; Liu, C.W.; Guo, X.; Wang, H. Rapid Authentication of Olive Oil Adulteration by Raman Spectrometry. J. Agric. Food Chem. 2009, 57, 6001–6006. [Google Scholar]
- Eidmann, G.; Savelsberg, R.; Blumler, P.; Blumich, B. The NMR MOUSE, a mobile universal surface explorer. J. Magn. Reson. 1996, 122, 104–109. [Google Scholar]
- Rata, D.G.; Casanova, F.; Perlo, J.; Demco, D.E.; Blumich, B. Self-diffusion measurements by a mobile single-sided NMR sensor with improved magnetic field gradient. J. Magn. Reson. 2006, 180, 229–235. [Google Scholar]
- Venkataramanan, L.; Song, Y.Q.; Hurlimann, M.D. Solving Fredholm integrals of the first kind with tensor product structure in 2 and 2.5 dimensions. IEEE Trans. Sign. Process. 2002, 50, 1017–1026. [Google Scholar]
- Hurlimann, M.D.; Venkataramanan, L. Quantitative measurement of two-dimensional distribution functions of diffusion and relaxation in grossly inhomogeneous fields. J. Magn. Reson. 2002, 157, 31–42. [Google Scholar]


© 2014 by the authors; licensee MDPI, Basel, Switzerland. This article is an open access article distributed under the terms and conditions of the Creative Commons Attribution license ( http://creativecommons.org/licenses/by/3.0/).
Share and Cite
Xu, Z.; Morris, R.H.; Bencsik, M.; Newton, M.I. Detection of Virgin Olive Oil Adulteration Using Low Field Unilateral NMR. Sensors 2014, 14, 2028-2035. https://doi.org/10.3390/s140202028
Xu Z, Morris RH, Bencsik M, Newton MI. Detection of Virgin Olive Oil Adulteration Using Low Field Unilateral NMR. Sensors. 2014; 14(2):2028-2035. https://doi.org/10.3390/s140202028
Chicago/Turabian StyleXu, Zheng, Robert H. Morris, Martin Bencsik, and Michael I. Newton. 2014. "Detection of Virgin Olive Oil Adulteration Using Low Field Unilateral NMR" Sensors 14, no. 2: 2028-2035. https://doi.org/10.3390/s140202028