Calibration-Free Pulse Oximetry Based on Two Wavelengths in the Infrared — A Preliminary Study

Abstract
: The assessment of oxygen saturation in arterial blood by pulse oximetry (SpO2) is based on the different light absorption spectra for oxygenated and deoxygenated hemoglobin and the analysis of photoplethysmographic (PPG) signals acquired at two wavelengths. Commercial pulse oximeters use two wavelengths in the red and infrared regions which have different pathlengths and the relationship between the PPG-derived parameters and oxygen saturation in arterial blood is determined by means of an empirical calibration. This calibration results in an inherent error, and pulse oximetry thus has an error of about 4%, which is too high for some clinical problems. We present calibration-free pulse oximetry for measurement of SpO2, based on PPG pulses of two nearby wavelengths in the infrared. By neglecting the difference between the path-lengths of the two nearby wavelengths, SpO2 can be derived from the PPG parameters with no need for calibration. In the current study we used three laser diodes of wavelengths 780, 785 and 808 nm, with narrow spectral line-width. SaO2 was calculated by using each pair of PPG signals selected from the three wavelengths. In measurements on healthy subjects, SpO2 values, obtained by the 780–808 nm wavelength pair were found to be in the normal range. The measurement of SpO2 by two nearby wavelengths in the infrared with narrow line-width enables the assessment of SpO2 without calibration.1. Introducation
1.1. Pulse Oximetry for the Measurement of Arterial Oxygen Saturation
The transfer of oxygen from the lungs to the tissue cells is largely carried out by the hemoglobin molecules in the red blood cells and only 2% of the total oxygen content is dissolved in the plasma. Oxygen saturation in the blood is the ratio of oxygenated hemoglobin concentration to total hemoglobin concentration in the blood, and its value in the arterial blood, SaO2, is of great clinical and physiological significance since it reflects the adequacy of oxygen delivery and respiratory function. Normal values of SaO2 are 94%–98% at sea level but the values may decline somewhat beyond the age of 70 years [1].
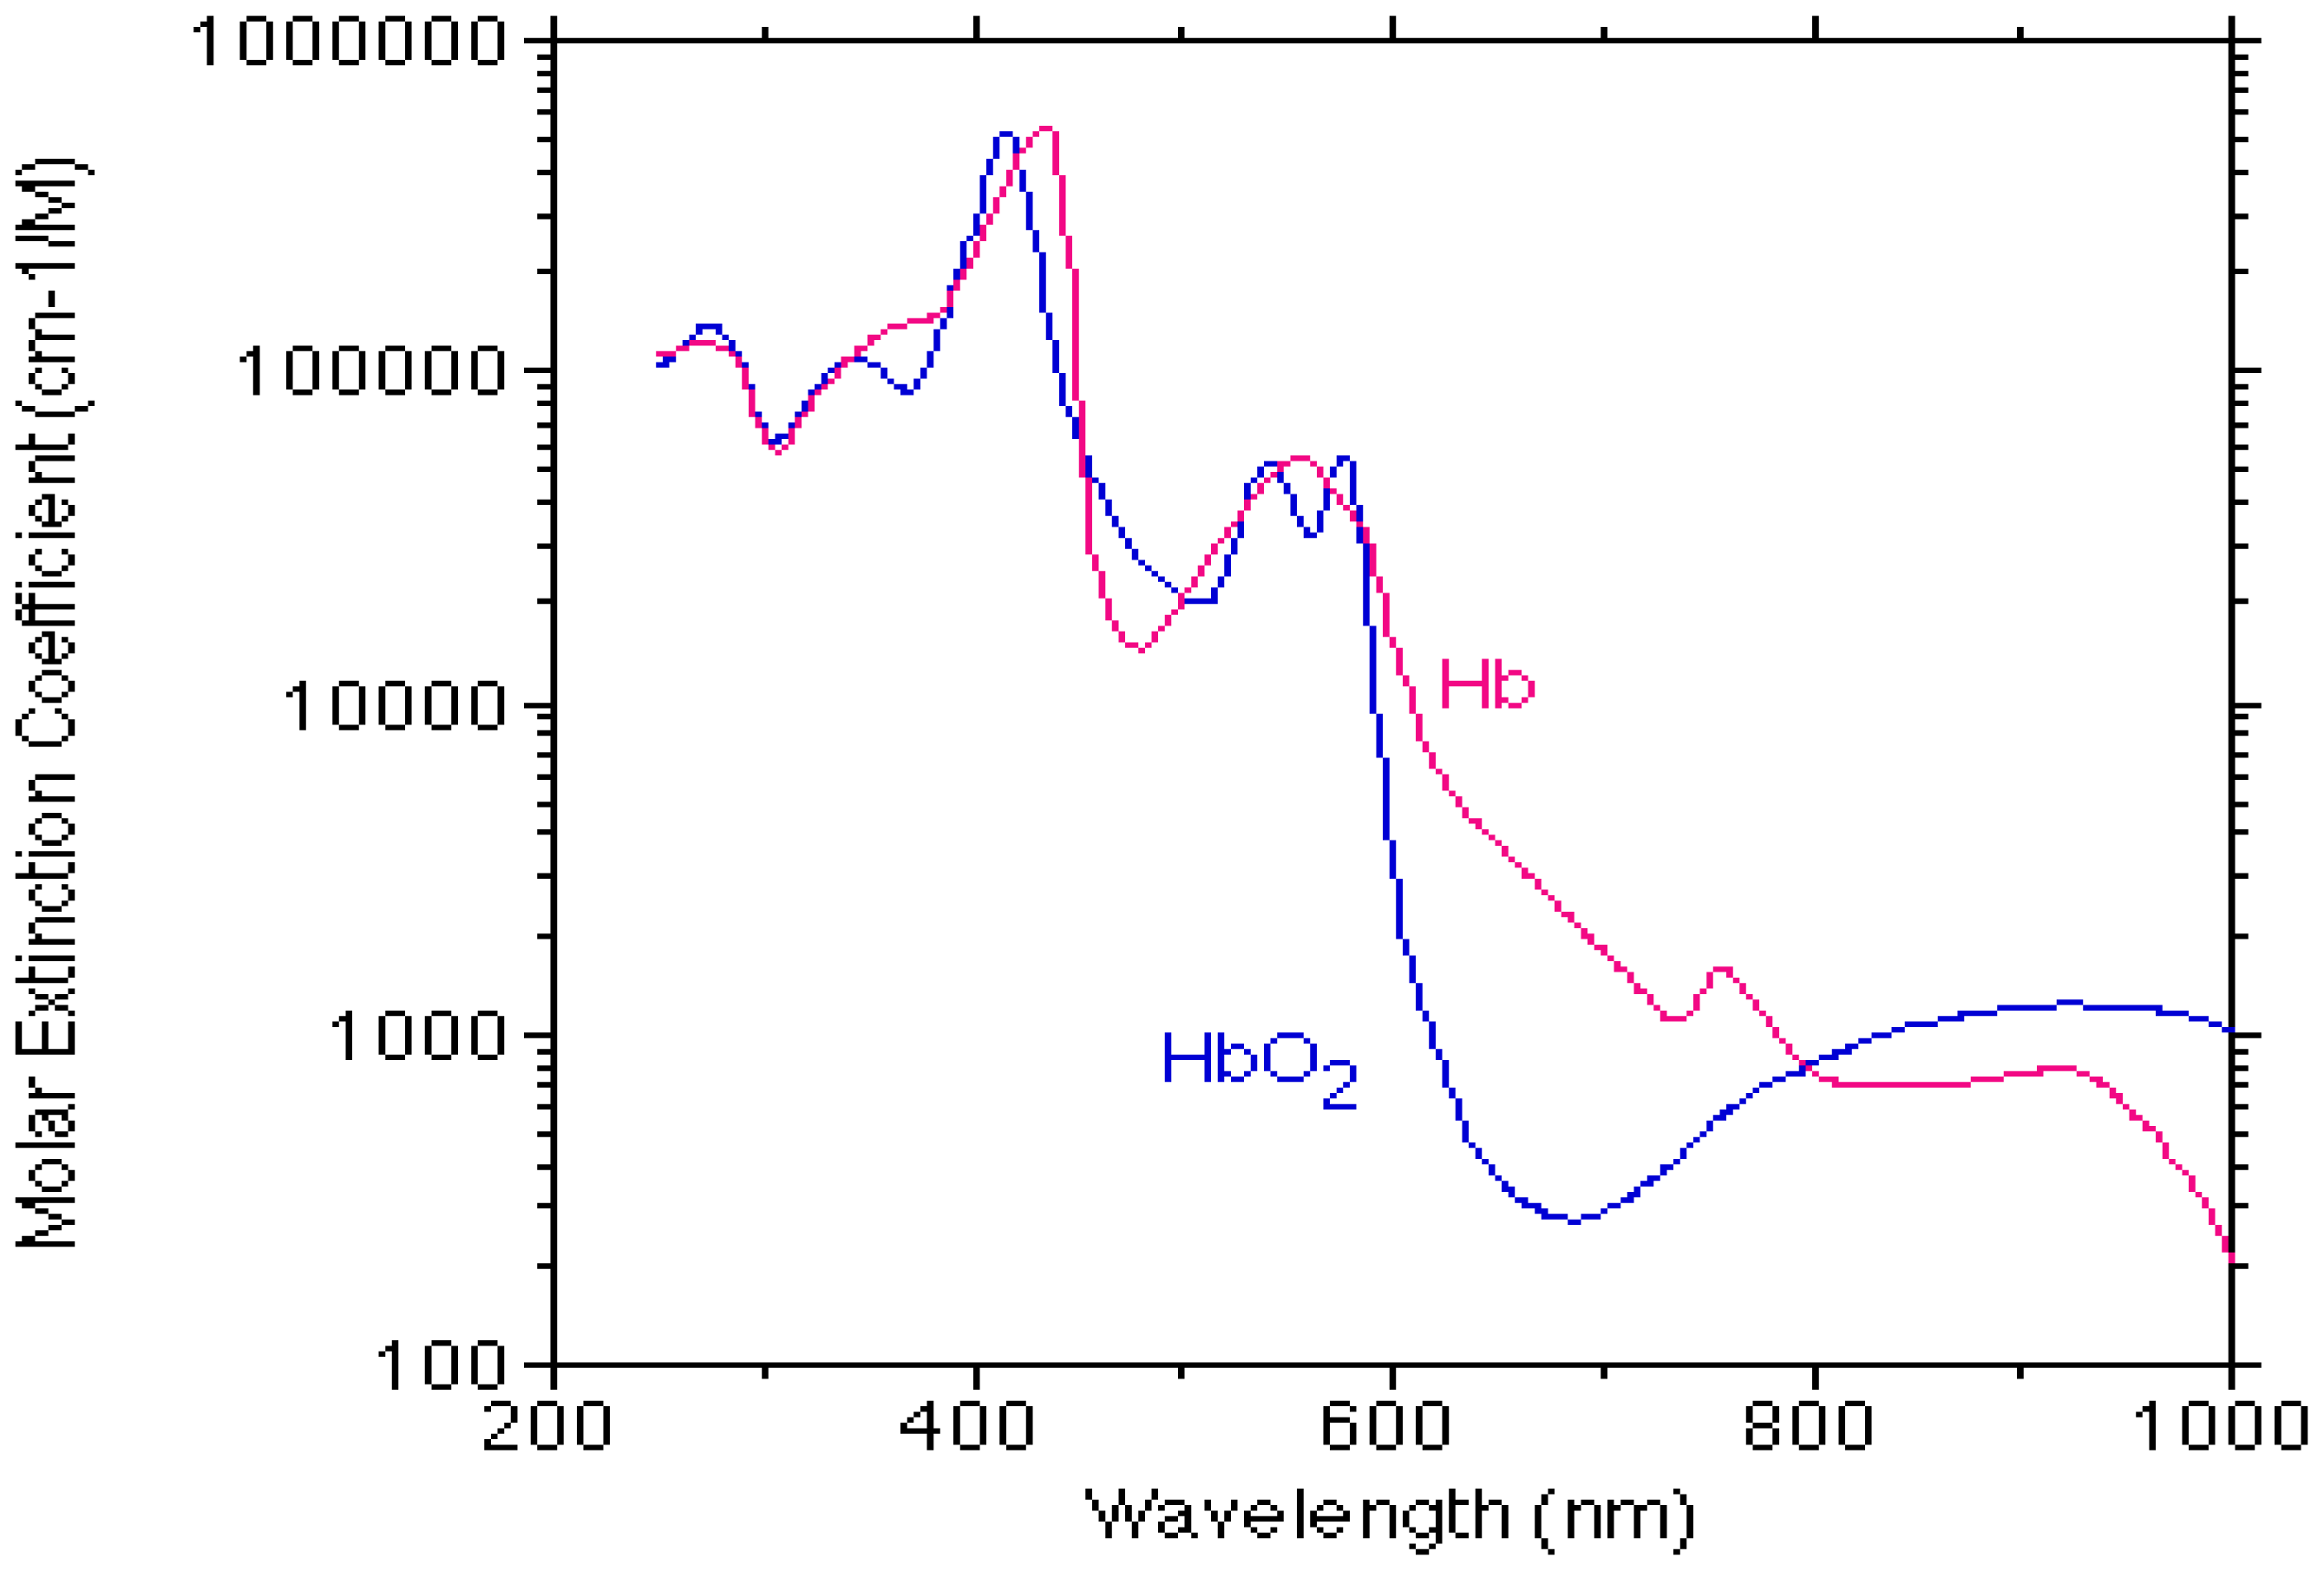
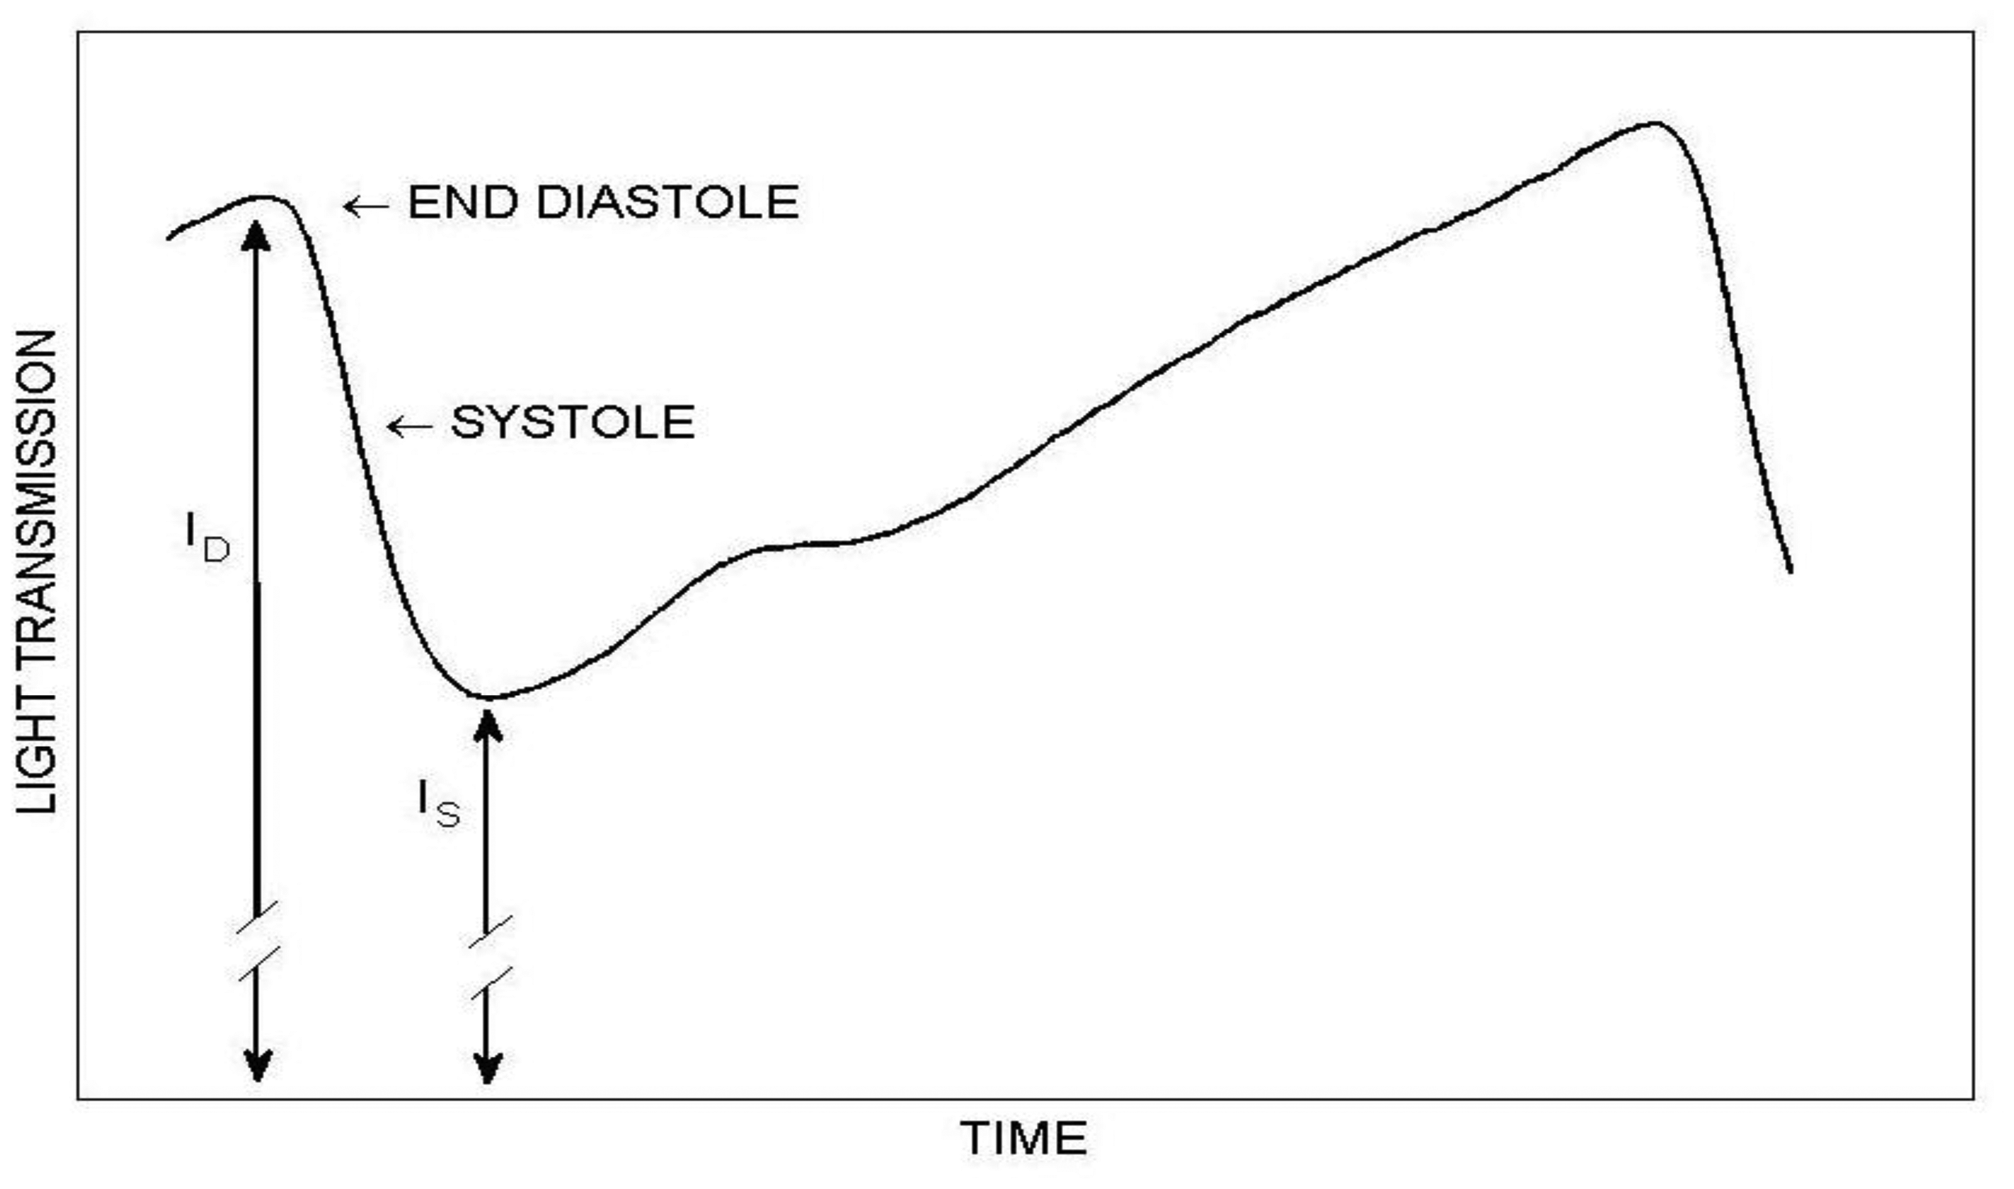
SaO2 can be assessed in vitro, in extracted arterial blood, either directly by means of co-oximetry or by measuring oxygen partial pressure and using the oxygen-hemoglobin dissociation curve. Estimation of SaO2 can also be obtained non-invasively by pulse oximetry [2–4], which is based on the different light absorption spectra for oxygenated and de-oxygenated hemoglobin (Figure 1). In order to assess SaO2, the contribution of the arterial blood to the light absorption must be isolated from that of the venous blood, and in pulse oximetry it is achieved by photoplethysmography (PPG)–the measurement of light absorption changes due to the cardiac-induced blood volume changes. The PPG probe consists of a light source emitting light into the tissue and a detector measuring the intensity of light transmitted through the tissue, which decreases during systole because of the systolic increase in the arterial blood volume (Figure 2). Since the PPG pulse represents light absorption in arterial blood, PPG signals at two wavelengths enable the assessment of oxygen saturation in the arterial blood [2]. As will be explained below, there is still a discrepancy between the value of arterial oxygen saturation obtained by pulse oximetry and that obtained by direct measurements in blood extracted from the arteries, and it is therefore customary to designate the former by SpO2 while the latter retains the name SaO2. [4–6].
The theory of conventional pulse oximetry has been described in several publications [3,8–10]. PPG curves in two wavelengths are recorded and SpO2 is derived from the ratio of ratios R which is defined by:
An analytical relationship between R and SpO2 can be obtained by making use of the Lambert-Beer Law and analysis of the light absorption and scattering in tissue which includes blood with oxygenated and deoxygenated hemoglobin [9,11]. The following relationship between the ratio R and the oxygen saturation SpO2 is then derived:
For the two wavelengths in the red and infrared regions which are used by the common commercial pulse oximeters, l1 and l2 are expected to differ and they are unknown. SpO2 can be derived from R through the calibration process by assuming that l2/l1 is a constant that is independent of inter-subject variability in the circulatory system. In this case the coefficients of R in Equation (3) are constants and can be determined through calibration, as described above [5,11]. If the parameter l2/l1 changes between different subjects, in particular between the healthy subjects on whose fingers the calibration was performed and the patients on whose fingers the clinical examination is carried out, inaccuracy in SpO2 measurement is to be expected.
1.2. Accuracy of Pulse Oximetry
Most manufacturers of pulse oximeters claim an accuracy of 2% [13,14], which is the standard deviation (SD) of the differences between SpO2 and SaO2 measured on extracted arterial blood samples by a co-oximeter. An SD of 2% means that an error of 4% or more (2SD) is expected in 5% of the examinations, assuming that the differences between SpO2 and SaO2 are normally distributed. Since the full range of SaO2 in adults, even including most of the sick patients is 80%–100%, an error of 3%–4% may be significant.
Despite its potential error of 3%–4%, pulse oximetry is a clinically valuable tool for monitoring patients during surgery or rehabilitation, ensuring intraoperative and post-operative patient safety. Pulse oximetry can detect a sudden decrease of SpO2 by 3%–4%, enabling the early detection of acute deterioration of the respiratory function of the patient or technical failure of mechanical ventilatory support and is, therefore, considered a mandatory tool for most patients in operating rooms and intensive care units.
An inaccuracy of 3%–4% in oxygen saturation measurement is, however, too high to allow such pulse oximeters to be used in routine management of various patient populations, in particular critically ill patients. Because of the low accuracy of SpO2 measurements, some researchers suggested that SpO2 levels as high as 94% or 96% should be maintained, in order to ensure SaO2 value of 90% during mechanical ventilation and oxygen support [1,15,16]. In a study on critically ill patients, relatively low correlation was found between spontaneous changes in SpO2 and in SaO2 (r = 0.6, r2 = 0.37) [17], and the authors inferred that changes in SpO2 do not reliably predict equivalent changes in SaO2 in the critically ill. In a study on patients with severe sepsis and septic shock in emergency department, the mean difference between SpO2 and SaO2 was 2.75% and the standard deviation 3.1% [18].
The low accuracy of pulse oximetry can be attributed, at least partly, to the calibration process currently used for pulse oximeters, which is based on examinations on healthy volunteers and is not necessarily applicable to sick patients, in particular neonates [14]. Since the calibration process is based on SaO2 measurements by co-oximeter, the inaccuracy in the latter also contributes to the error in SpO2 measurement [13]. The discrepancy between SpO2 and SaO2 is greater at saturations below 75%–85% [1,10,18–20], because ethical restrictions prevent manufacturers from reducing SaO2 below 80% during the calibration process.
1.3. A Calibration-Free Pulse Oximeter
If the two wavelengths are sufficiently close so that the difference between their path-lengths can be neglected (l2/l1 ∼ 1), the relationship between the ratio R and SpO2 becomes [3,8,21]:
Equation (4) enables the calculation of SpO2 from the measured parameter R and the values of the extinction coefficients with no need for calibration. This was shown by Nitzan et al. [21], using two infrared light emitting diodes (LEDs) with emission spectra that peaked at wavelengths 767 and 811 nm. The SpO2 values, found using Equation (4), were in the range of 90%–100%, while SpO2 values obtained by commercial pulse oximeters (using red and infrared light and calibration) were 96%–98%. In that study, the values of the hemoglobin extinction coefficients in Equation (4) were taken as the mean values of the corresponding values presented in several data bases, averaged over the emission spectra of the LEDs.
The low accuracy achieved by the calibration-free pulse oximetry in that study [21] can be attributed, at least partly, to the broad emission spectra of the LEDs resulting in inaccuracy in the determination of the mean extinction coefficient. In the current study, the LEDs, have been replaced by infrared laser diodes. The narrow emission spectra of the laser diodes allow the use of specific values of the extinction coefficients for hemoglobin. Additionally, as described in the next section, the analysis of the PPG pulses was improved.
2. Experimental Section
2.1. Subjects and Methods
SpO2 was measured on 15 male subjects aged 20–35 years. Each finger temperature was above 30 °C. For each subject PPG signals in three wavelengths, 780, 785 and 808 nm, were recorded for about 90 s, and SpO2 was derived from each pair of wavelengths as described below. Simultaneous SaO2 measurements were also performed on these subjects using a commercial pulse oximeter (BCI 3301 Smiths Medical PM, Waukesha, WI, USA) for comparison.
2.2. The Optical System
When using Equation (4) to determine the value of SpO2, it is important to ensure that the wavelength of the light used to measure the PPG is stable. An error of ±0.2 nm in the wavelength causes an error in the determination of the extinction coefficient and leads to an error of about ±0.5% in SaO2 for the 780 nm–808 nm and 785 nm–808 nm pairs and much more for the 780 nm–785 nm pair. Hence, a well-defined, stable wavelength is needed for the calibration-free pulse oximetry.
In the current study we used three wavelength-stabilized laser diodes (Innovative Photonic Solutions, Inc. Monmouth Junction, NJ, USA) of wavelengths 780, 785 and 808 nm, with narrow spectral bandwidth (less than 0.15 nm). For each diode, the manufacturer's data sheets were used to determine a temperature range over which the wavelength dependence on temperature is small. Thermoelectric coolers (TECs) (TCLDM9 Thorlabs, Newton, NJ, USA) that make use of the Peltier effect were used to stabilize the temperature (mainly in order to stabilize the light intensity). Changes in the TEC temperature by ±3 °C and changes in the diode current in the range 80–140 mA changed the wavelength by less than 0.1 nm (measured by an Agilent 86140, optical spectral analyzer, Santa Rosa, CA, USA).
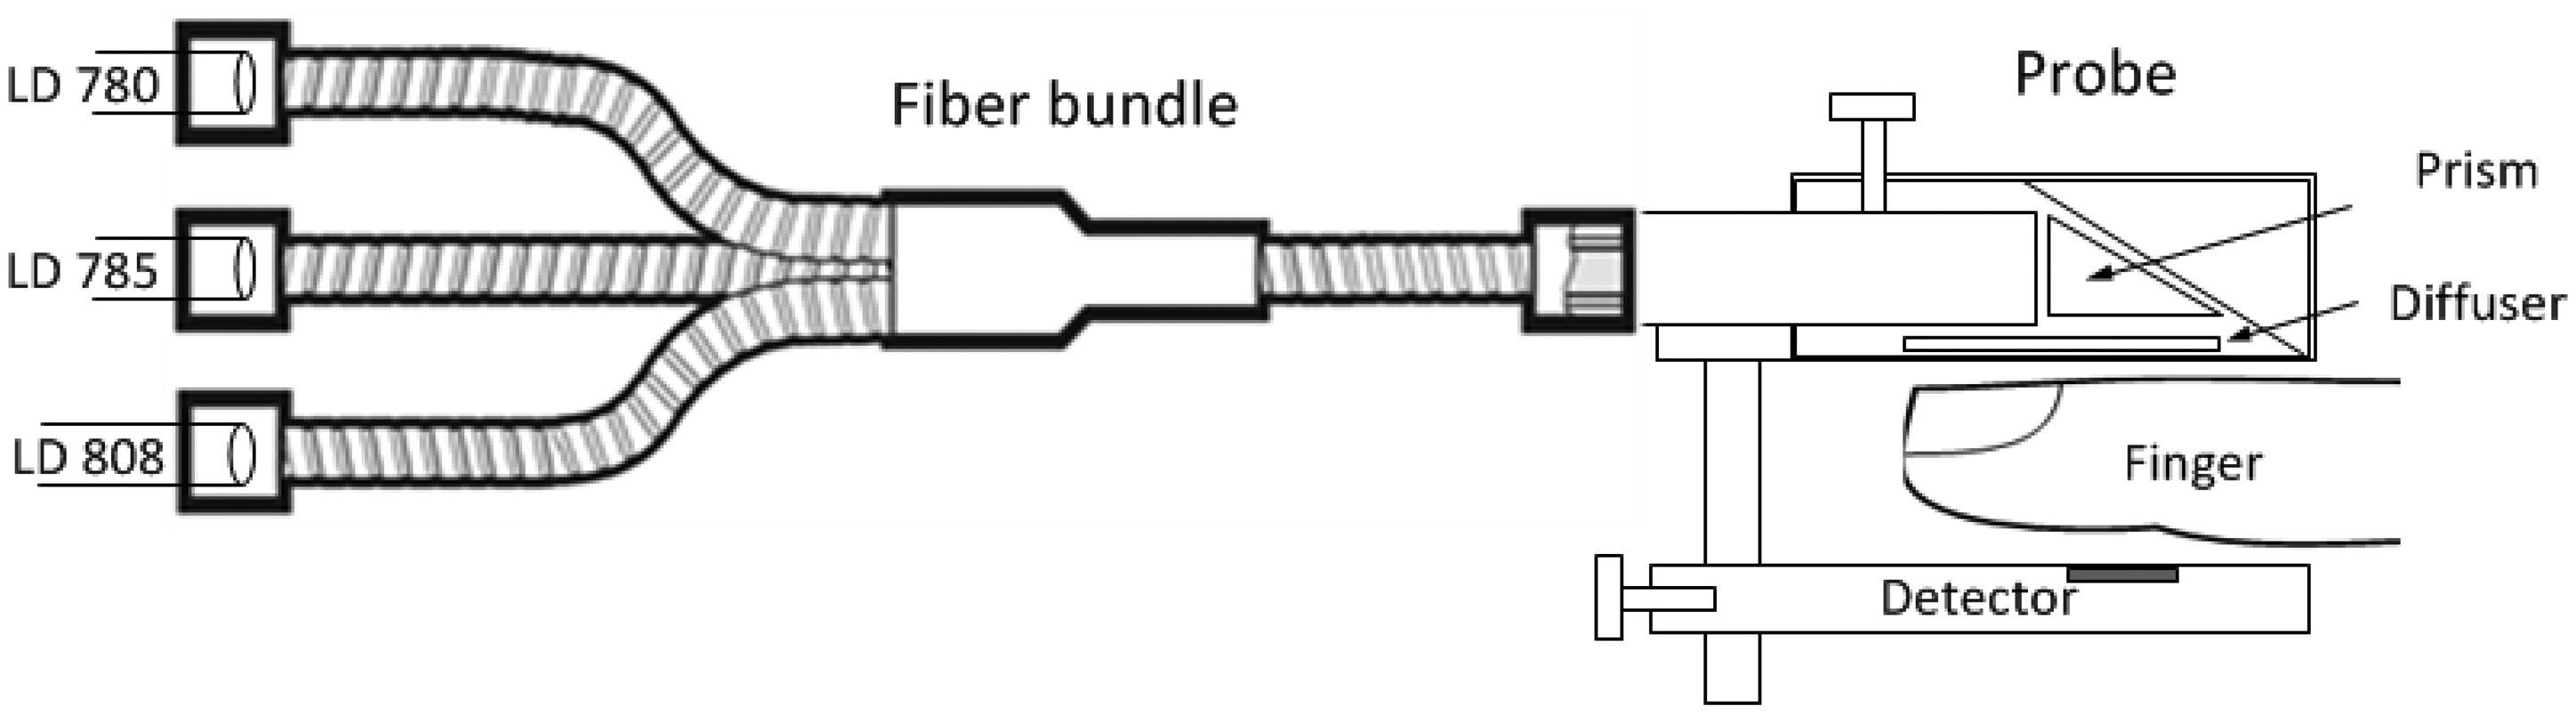
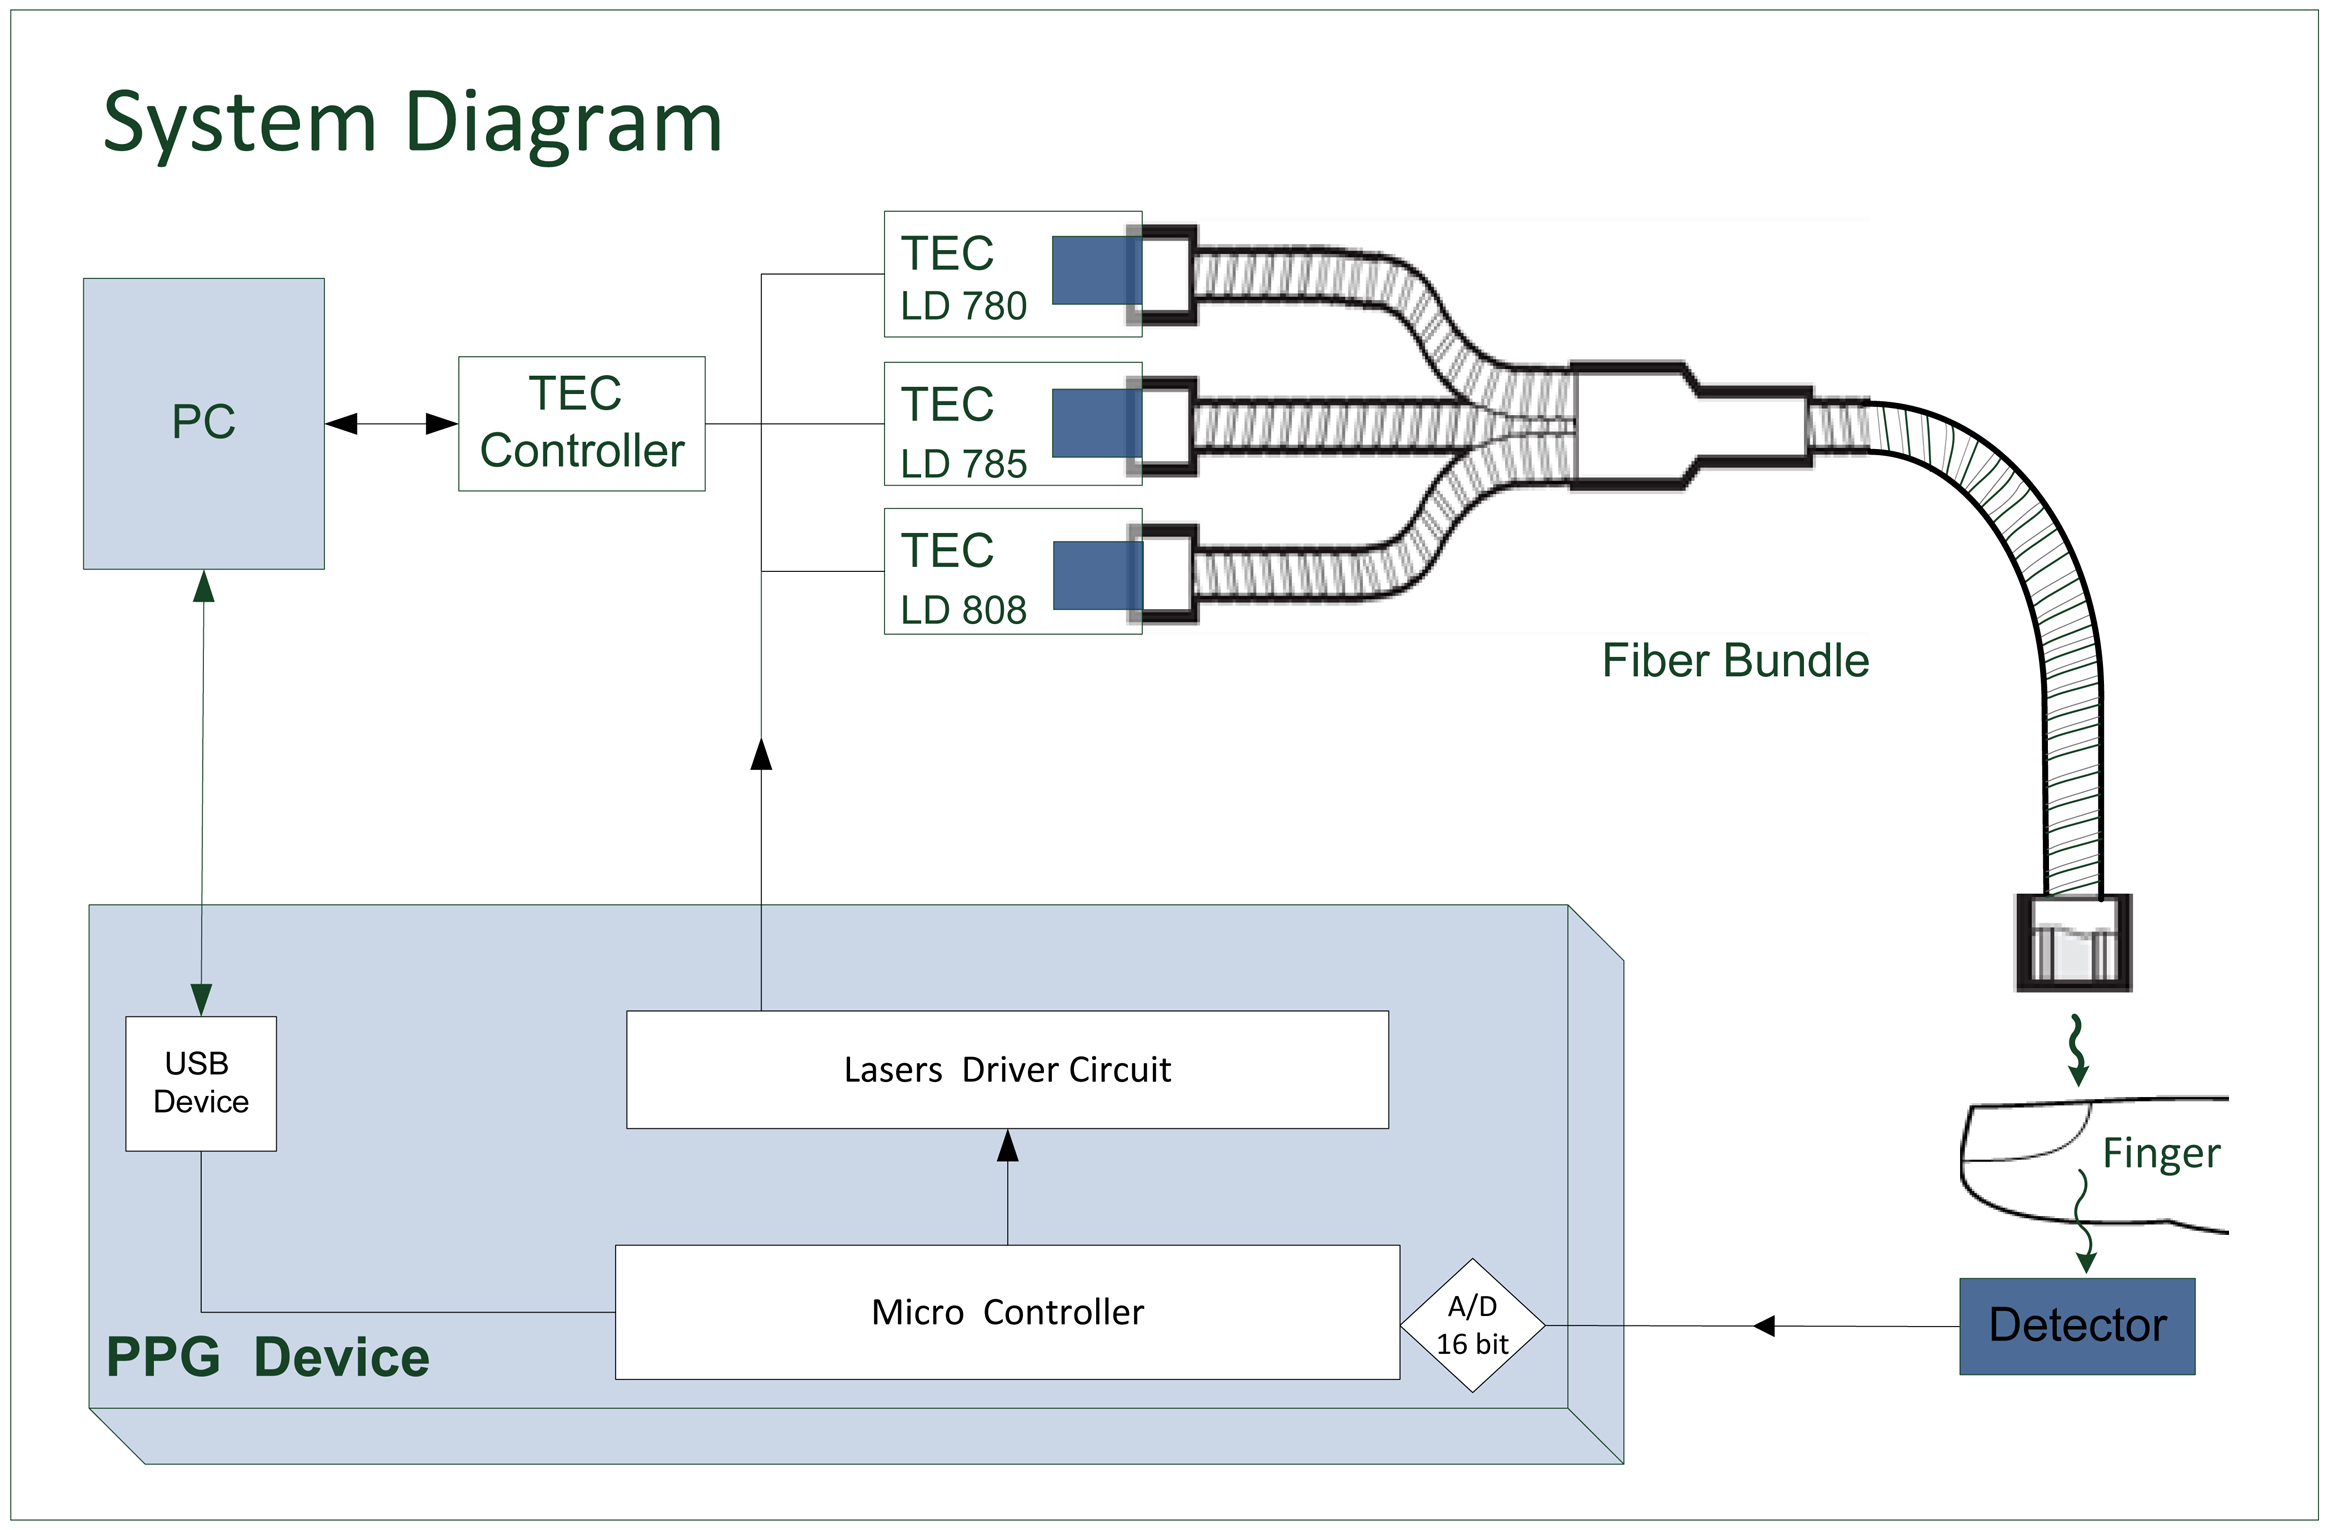
The light emitted from each of the three light sources needs to be delivered to the same site in the finger in order to illuminate the same blood volume for each pair of wavelengths. The beams from the three laser diodes were merged randomly and delivered to the same measurement site by using a trifurcated fiber bundle (Oriel-Newport Model 77536, Irvine, CA, USA) which was comprised of three input bundles (each with a diameter of 3.2 mm) and a common bundle (with a diameter of 5.5 mm) (Figure 3). The latter was comb randomized, so the output light from each input bundle was evenly divided in the common bundle.
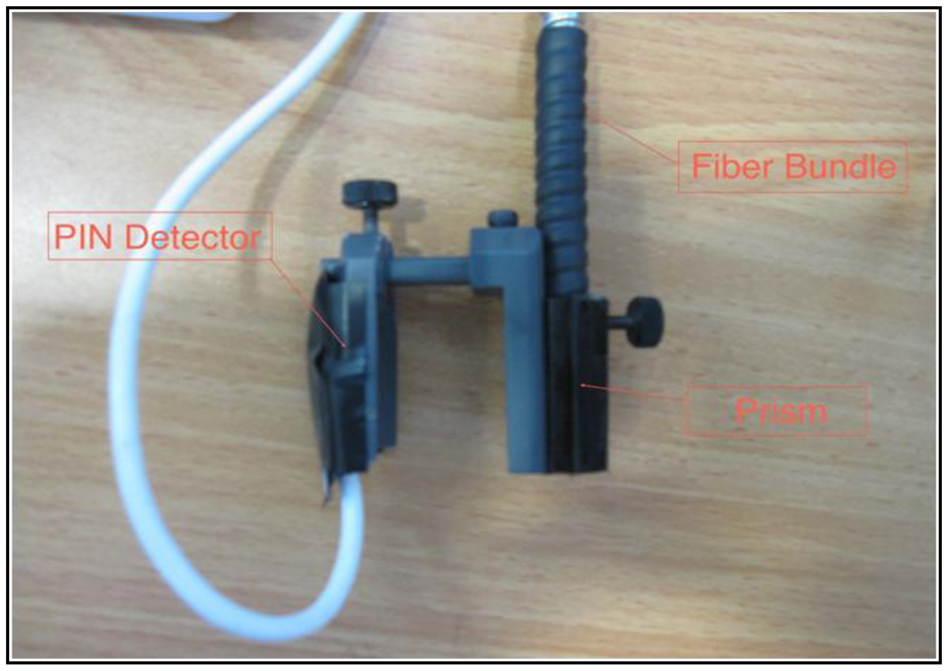
The finger transmission probe (Figure 3) had an input port for the common fiber bundle end and a PIN photodiode (BPW 34, Vishay Electronics, Malvern, PA, USA, 5.4 × 4.3 mm2) placed opposite the fiber bundle end. The light was reflected by 90° through a prism inside the probe, allowing the fiber bundle to be attached parallel to the finger, for higher mechanical stability. A diffuser (Light Shaping Diffuser, Luminit, Torrance, CA, USA) was placed after the prism to homogenize the light distribution and to reduce speckle noise. A photograph of the probe is shown in Figure 4.
2.3. The Electronic System
A block diagram of the measurement system is given in Figure 5. Light from the laser diodes is emitted sequentially, by time sharing, using driver circuits controlled by a microcontroller. The light transmitted through the finger is detected by the photodetector, whose output is digitized and processed by the microcontroller and conveyed to a PC for offline analysis. The temperature of each TEC is determined via the PC. The power to the PPG device was supplied by three 1.5 V AA batteries.
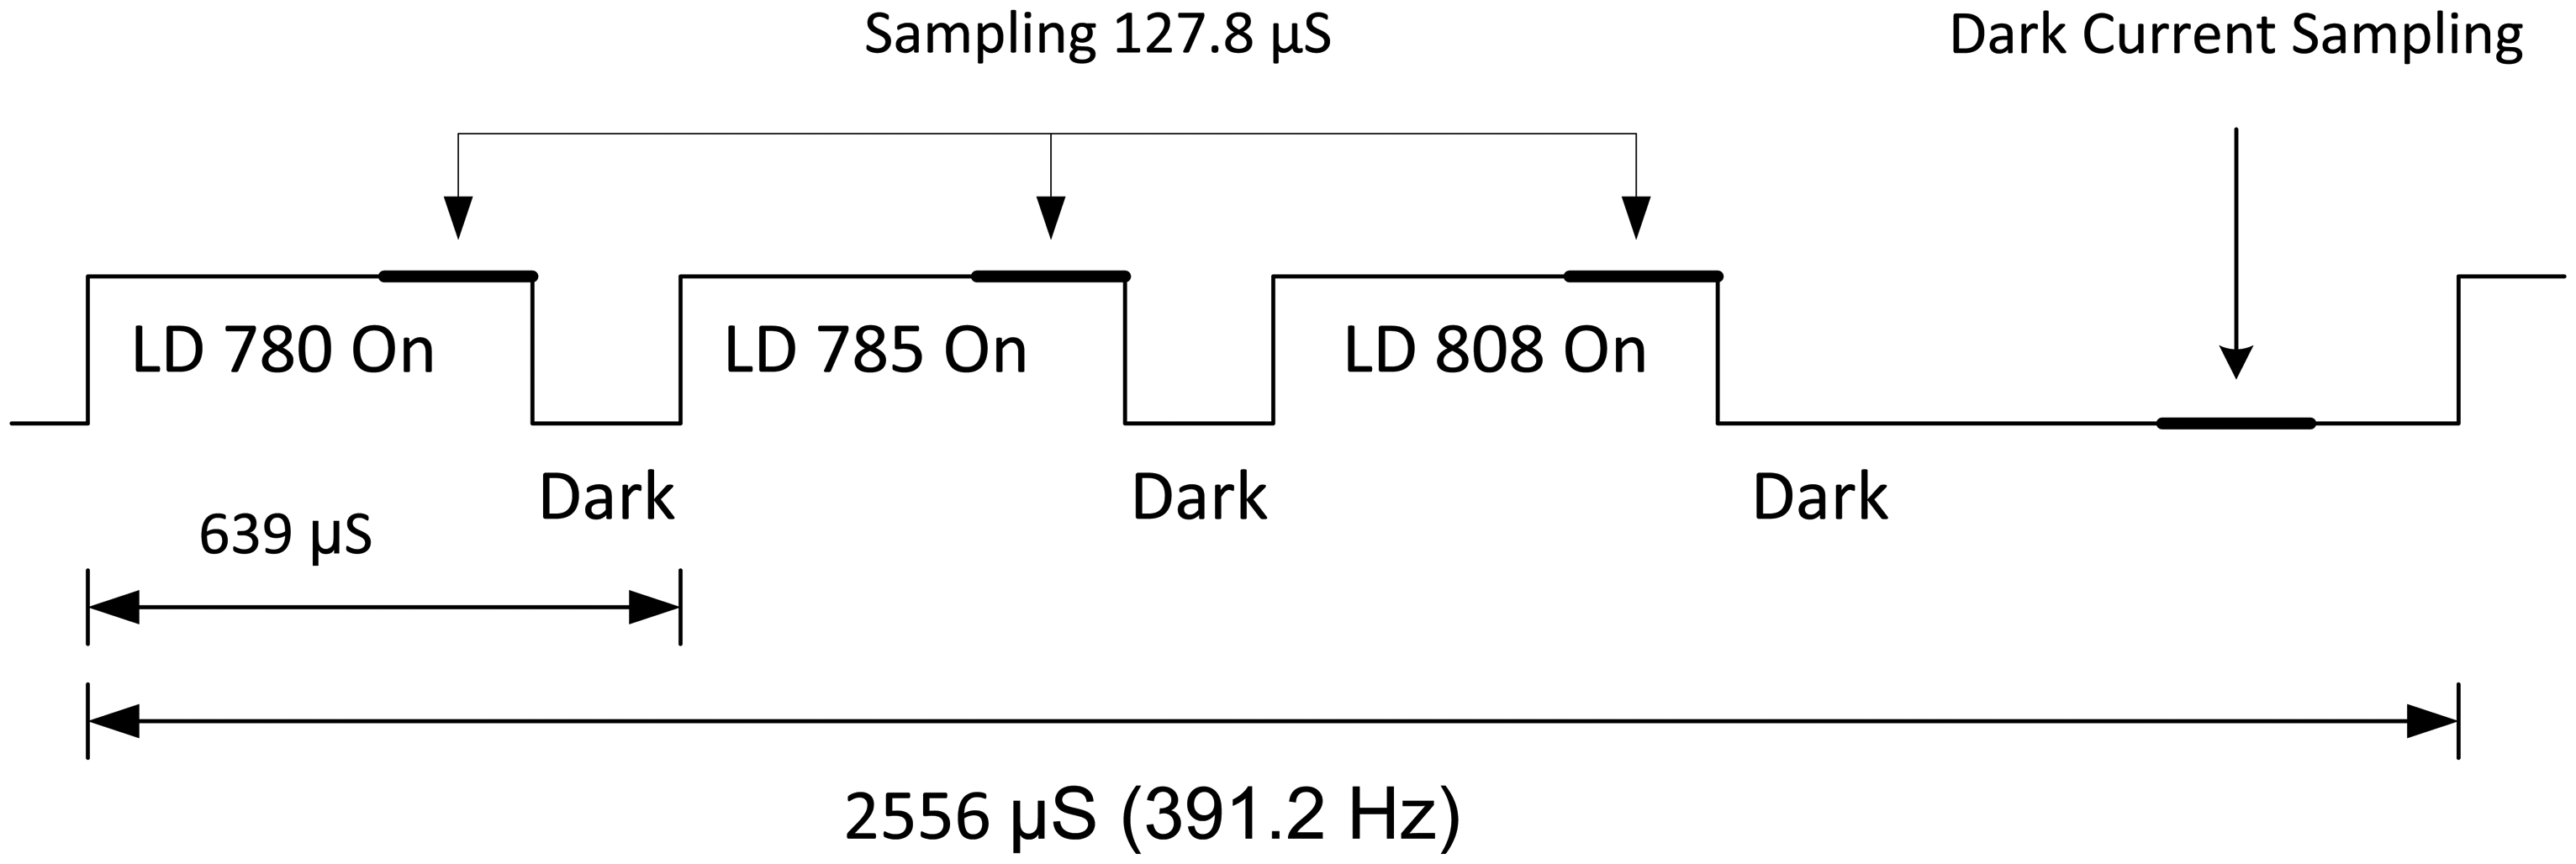
The PPG signal for each wavelength was separated by means of time sharing between the laser diodes. During each cycle of 2,556 μs, each laser diode was turned on for 511.2 μs and off for the rest of the cycle. Each of the three wavelengths and the dark current were sampled 391.22 times per second (in order to achieve good temporal resolution for the PPG pulses at the three wavelengths and to avoid aliasing of 50 Hz noise). Consequently, the detector output was sampled at 1564.88 Hz and digitized using a 16-bit A/D.
The first sample of the detector output for each laser diode was taken 383.4 μs after turning on the laser diode. This was done in order to stabilize the laser diode, so that the actual sampling was carried out for a period of 127.8 μs (Figure 6). During this interval, 25 readings were acquired by the A/D and averaged by the microcontroller. Then a dark period of 127.8 μs was used to avoid cross-talk between channels. The second and third laser diodes were pulsed in the same sequence, and afterwards the dark current was sampled. Figure 6 shows a diagram of the time division. The signal was exported to MATLAB for post-processing and the system had the ability to display the signal in real time on the PC.
2.4. Determination of SpO2
SpO2 was determined by using Equation (4). The analytical derivation of Equation (4) from the Beer–Lambert law [11,21] shows that in order to obtain SpO2 through Equation (4) the ratio of ratios, R, should be calculated as follows:
In order to use Equation (4) to derive SaO2 the values of εo and εd, the extinction coefficient values for oxygenated (HbO2) and deoxygenated (Hb) hemoglobin, are required for each wavelength. The absorption spectra for Hb and HbO2 have been measured and reported by several research groups [22–24], but the reported values differ between these groups [25]. Even a small change in the Hb and HbO2 extinction coefficients values can cause significant change in the SaO2 calculation when using Equation (4), since the latter includes differences between Hb and HbO2 extinction coefficients values in the infrared region, where these differences are small relative to those in the red region (Figure 1).
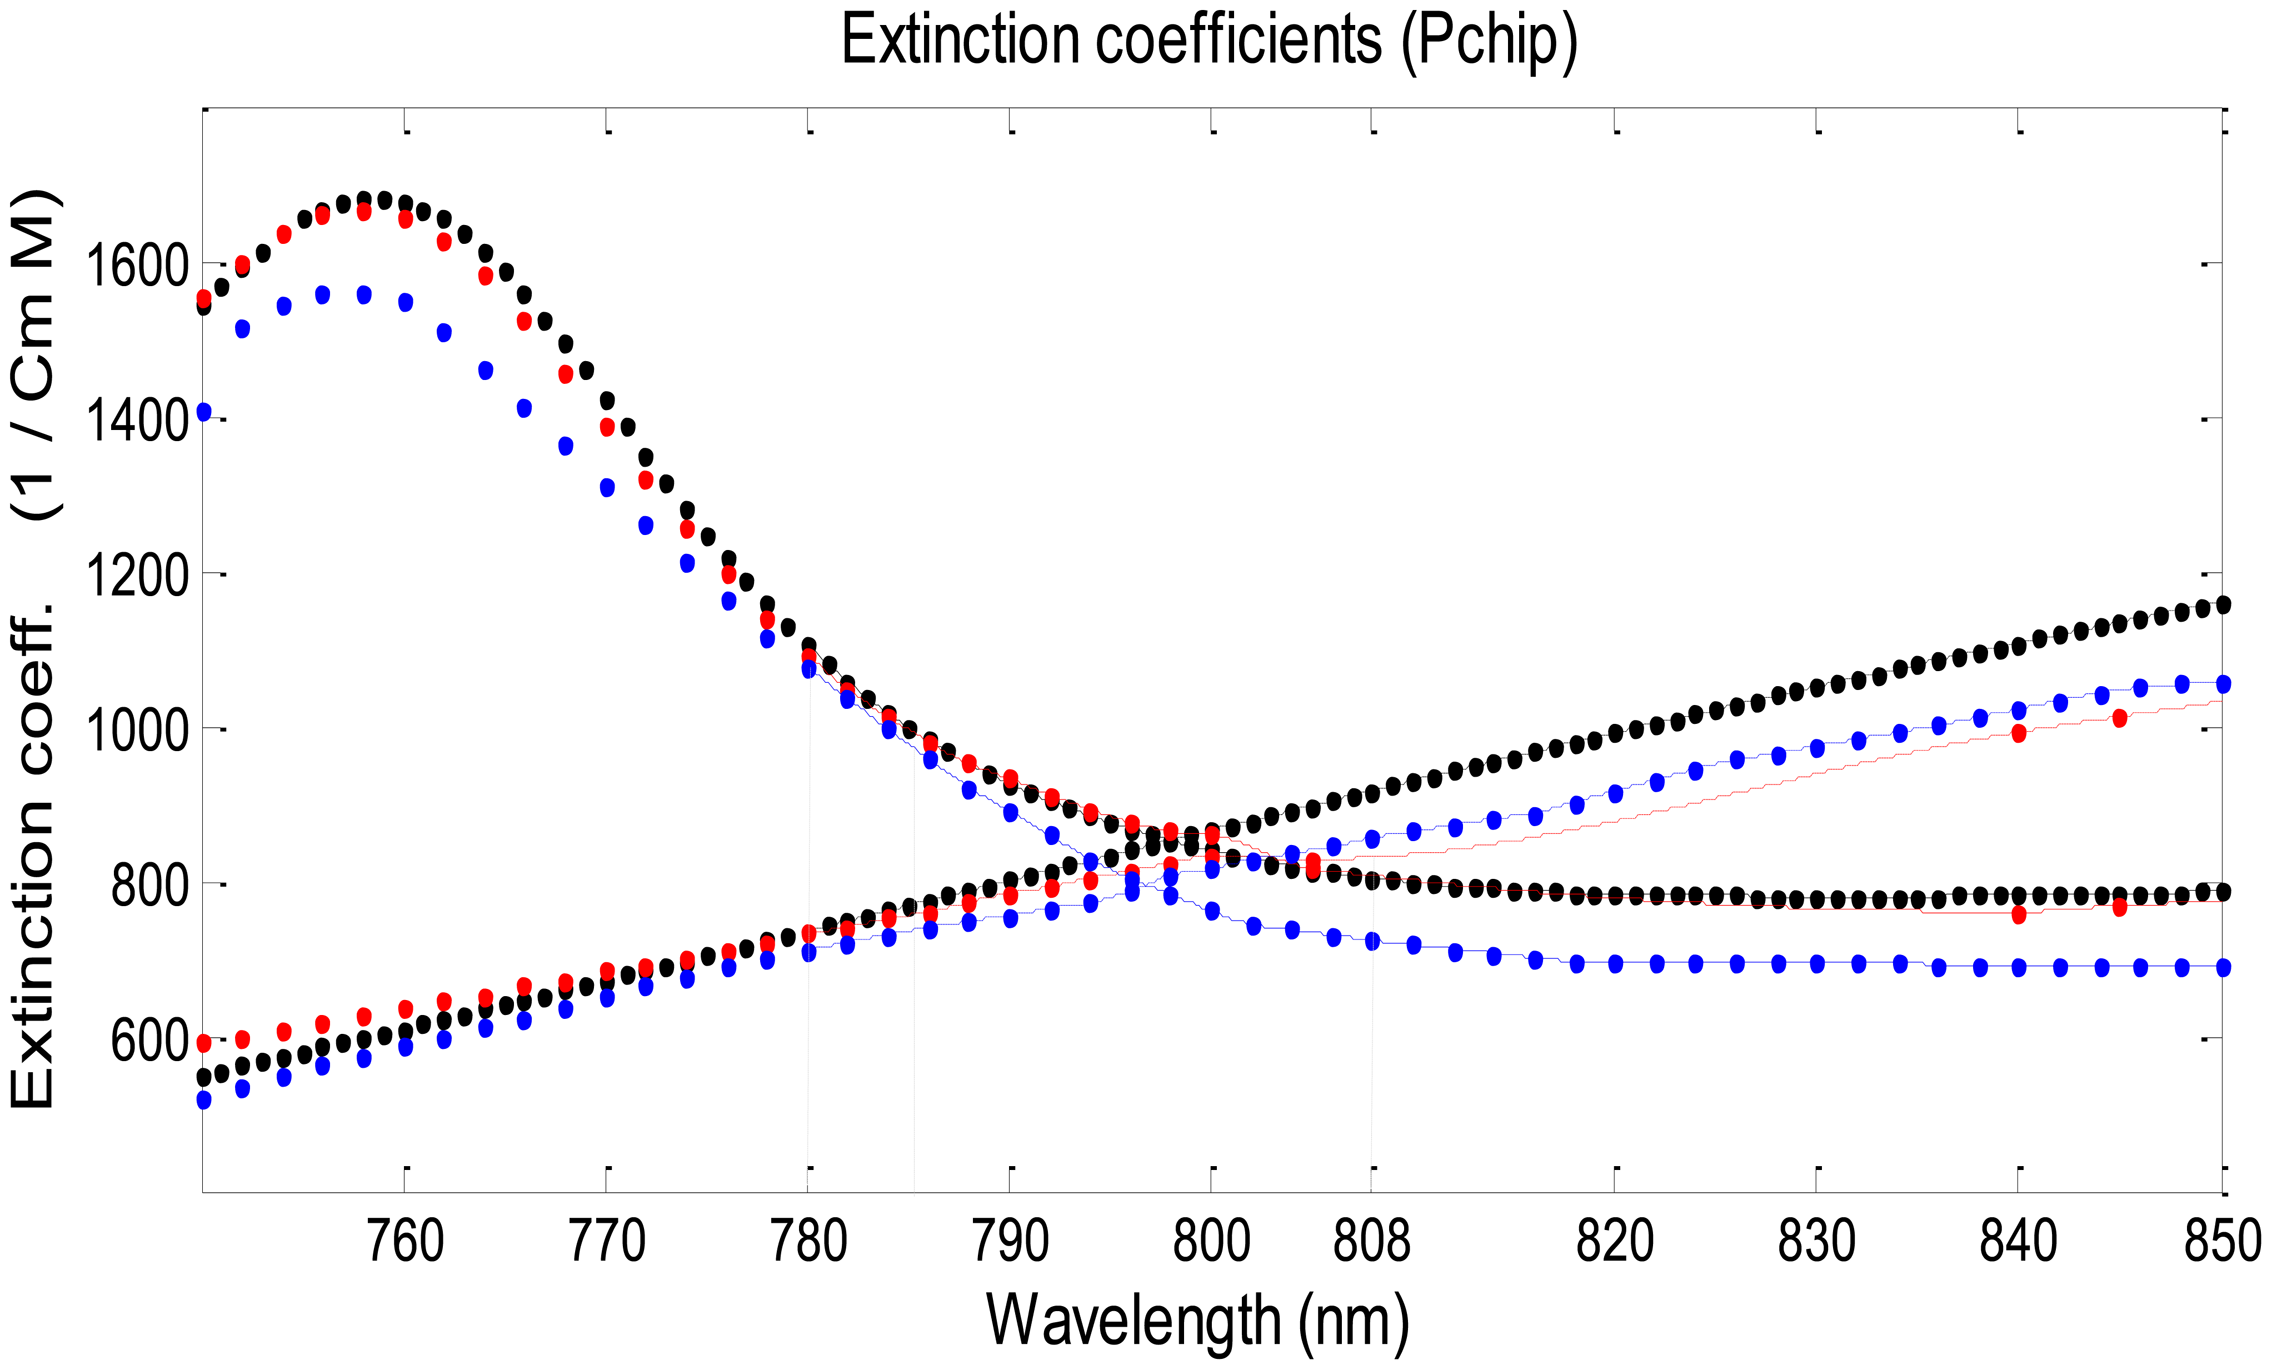
Tables of Hb and HbO2 extinction coefficients values are available from three research groups (Zijlstra [22], Cope [23] and Prahl [24]), and were also presented for analysis by Kim and Liu [25]. Figure 8 shows the extinction coefficients of Hb and HbO2 in the near infrared region of 750–850 nm as determined by the three groups. The data presented by Zijlstra in the region above 800 nm include only two points, at 805 and 840 nm, and interpolation was performed to determine values of the Hb and HbO2 extinction coefficients for 808 nm.
Table 1 presents the extinction coefficients for HB and HbO2 as derived from the tables of Zijlstra et al., Cope and Prahl, for the three wavelengths which were used for the determination of SaO2 in the current study.
3. Results and Discussion
3.1. Results
PPG recordings for the three wavelengths, 780, 785 and 808 nm were performed on each of 15 healthy male volunteers. For each pair of wavelengths, the parameter R was calculated from the corresponding signals (using Equation (5)) and SaO2 was calculated using Equation (4), by making use of the corresponding values of the extinction coefficient from Table 1. In order to validate that the subjects had normal value of oxygen saturation, simultaneous measurements of SpO2 were made on them by means of the commercial pulse oximeter.
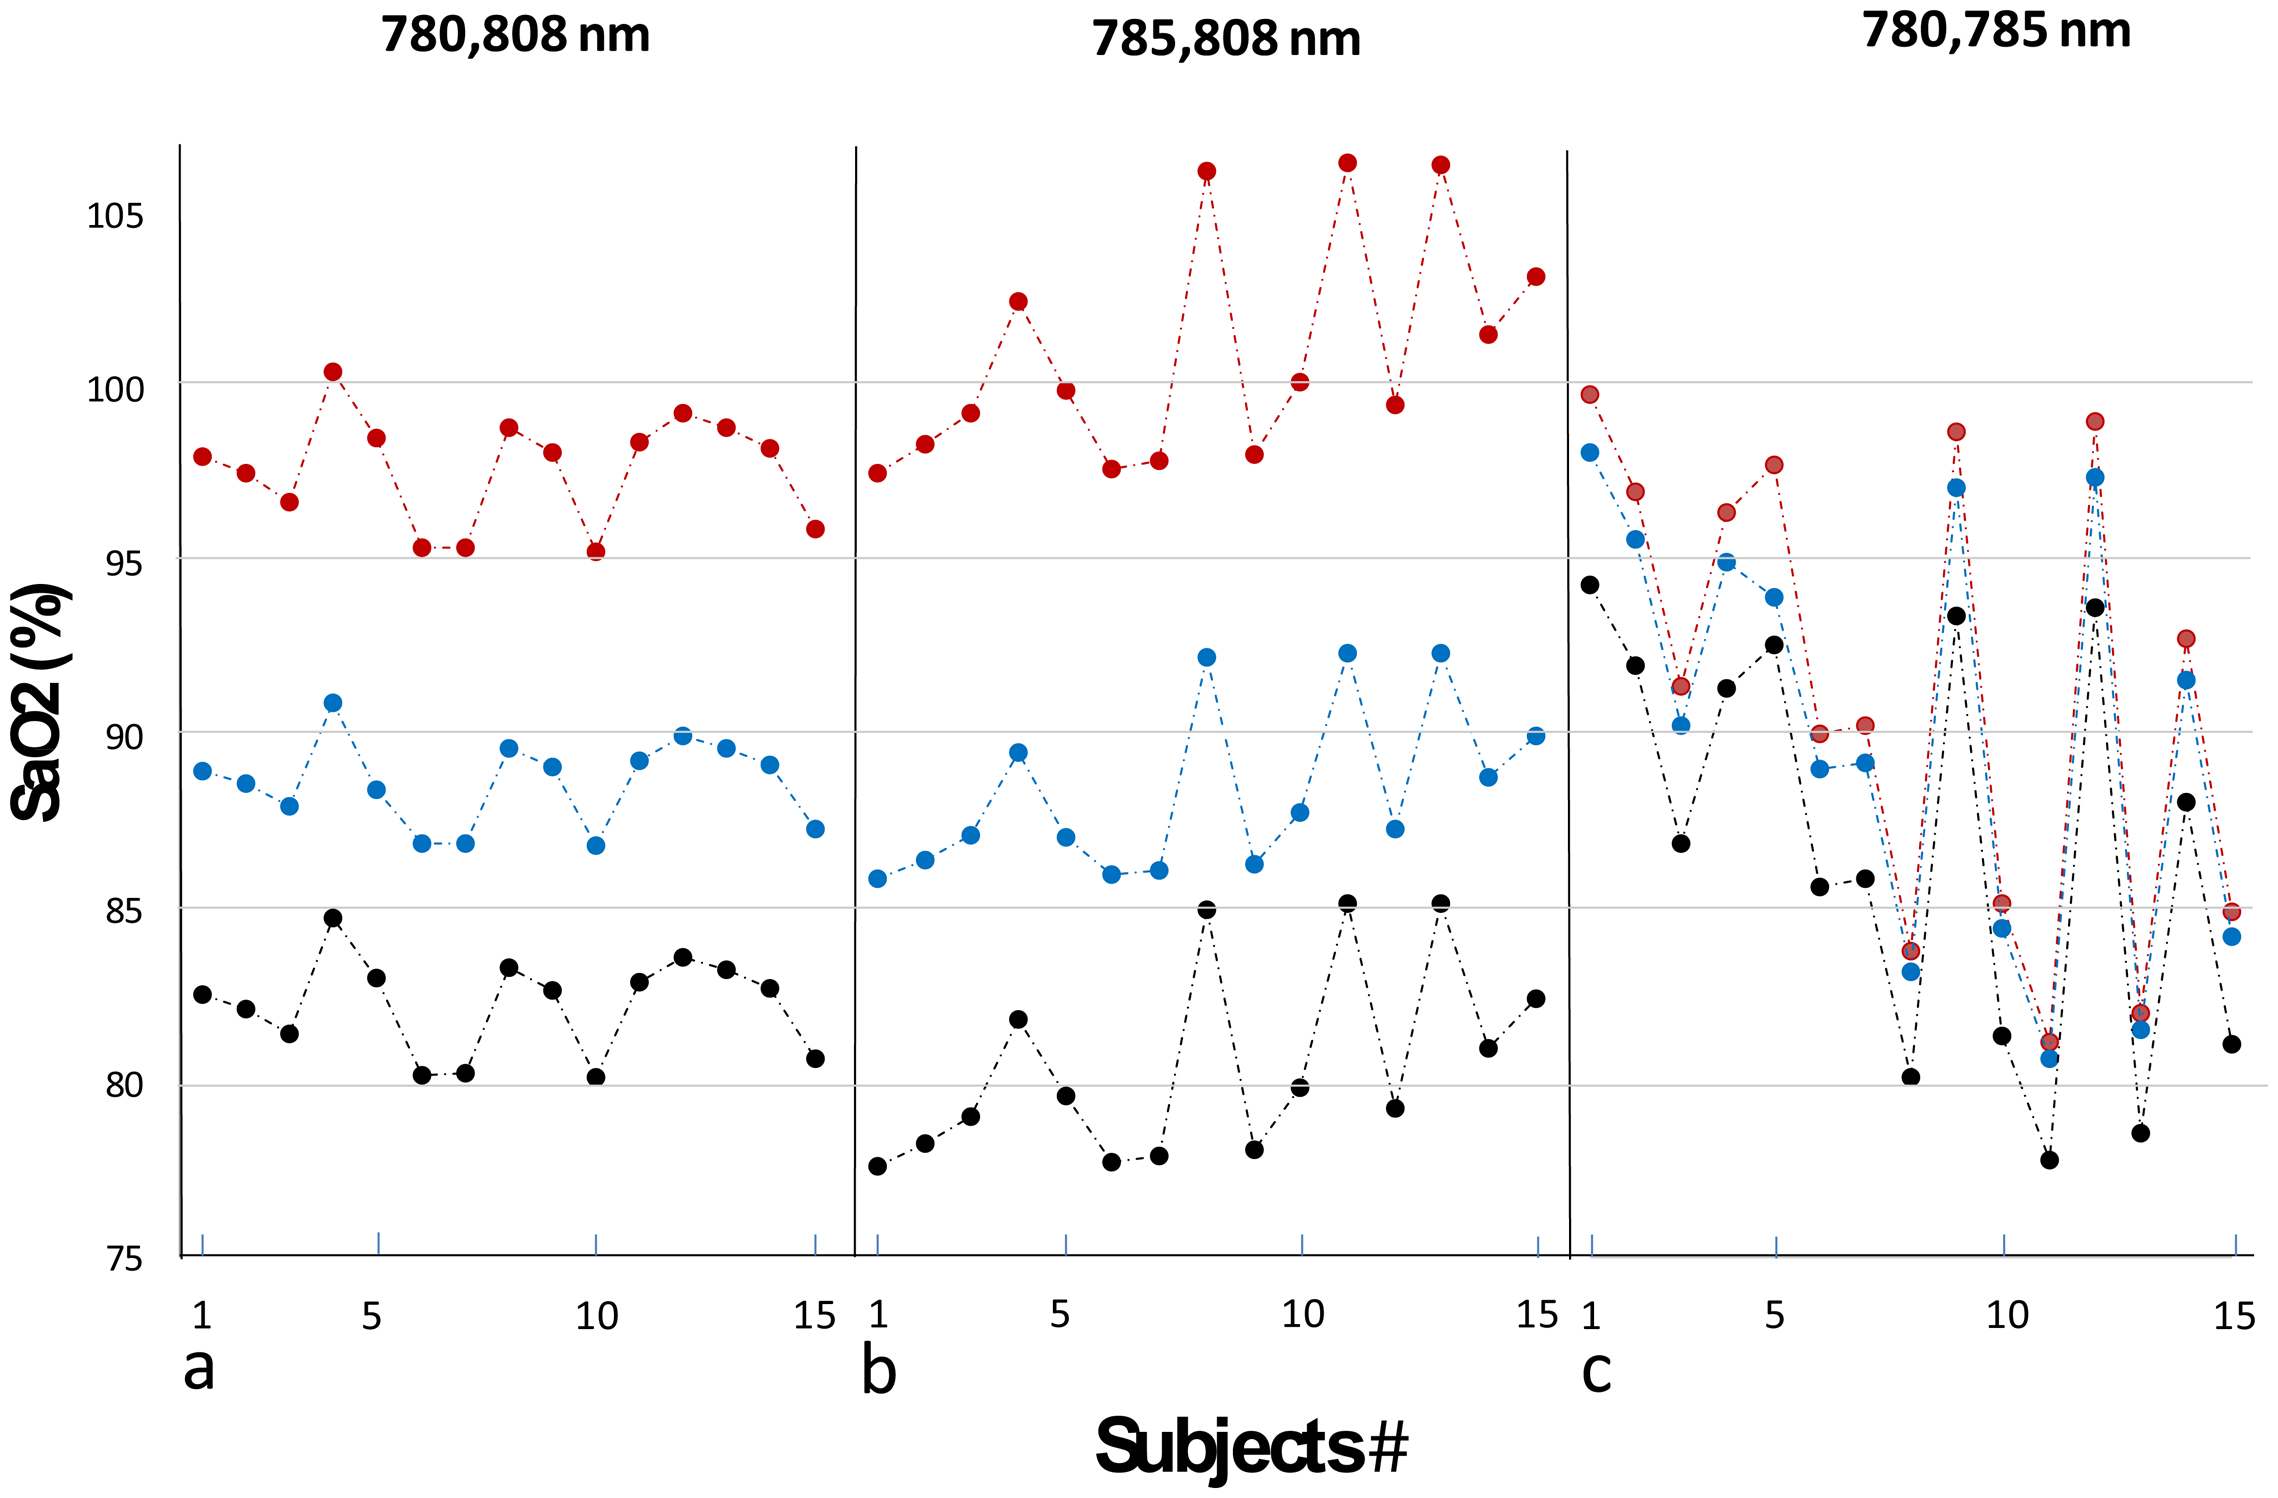
Figure 9a shows SpO2 values as obtained for the pair 780–808 nm. The SpO2 values which were determined through the extinction coefficient values obtained by Zijlstra were between 95.3%–100.5%. These SpO2 values were similar to those obtained by the commercial pulse oximeter; the difference between them for each examinee was 2.5% or less (See Table 2). For this pair of wavelengths, SpO2 values determined through the extinction coefficient data obtained by Prahl and Cope were between 86.8%–91.0% and 80.2%–84.7%, respectively.
Figure 9b shows SpO2 values as obtained for the pair 785–808 nm. For this pair of wavelengths SpO2 values determined through the extinction coefficient values obtained by Zijlstra were between 97.5%–106.4%. For the extinction coefficient values obtained by Prahl and Cope SpO2 values were in the range 85.8%–92.4% and 77.6%–85.1%, respectively. Figure 9c shows SpO2 values as obtained for the 780-785 nm pair. For this pair of wavelengths SpO2 values determined by using the extinction coefficient values obtained by Zijlstra were between 81.2%–99.7% and for those obtained by Prahl and Cope were 0.5%–3.8% and 3.3%–5.4% lower, respectively.
The difference between the SpO2 values obtained for the three extinction coefficient databases was small for the wavelengths pair 780–785 nm (Figure 9c), relative to the other wavelengths pairs, because the difference in the extinction coefficient values between the three databases is relatively small for the wavelengths 780 and 785 nm while for 808 nm is larger (see Figure 8). Nevertheless, the small difference between the two wavelengths 780 and 785 nm relative to the other pairs of wavelengths and the fact that they lie on the same side of the isosbestic point lead to a large error in the determination of R and consequently of SpO2. Since R is quite close to 1 (R is equal to 1 for two equal wavelengths) and the values of the extinction coefficients for oxy- and deoxyhemoglobin are close, the values of the numerator and the denominator in Equation (4) are small, and a small error in the determination of R can cause a large error in the calculated value of SpO2.
3.2. Discussion
In the current preliminary study, we present a calibration-free pulse oximeter that makes use of two nearby wavelengths in the infrared region, assuming that the difference between their path-lengths can be neglected. In this case, by using the published data that gives the relevant extinction coefficients, SaO2 can be derived directly from Equation (4) without calibration. When the extinction coefficients were taken from the data of Zijlstra, SpO2 measurements, obtained by the calibration-free pulse oximeter, provided values in the normal range of oxygen saturation. It should be emphasized that we did not show that pulse oximetry which uses two wavelengths in the infrared is more accurate than conventional pulse oximetry; we did show that the former can measure SaO2 values in the normal range with reasonable accuracy. While the calibration process cannot decrease the error of conventional pulse oximetry to a level below 3%–4%, pulse oximetry with no need for calibration may have the potential to provide more accurate measurements of SaO2 than those provided by the currently available technique.
The proposed technique has several limitations:
- (1).
The small difference between the two wavelengths makes the values of the extinction coefficients quite close and causes the calculation of SpO2 to be very sensitive to the measured value of R. In order to measure SpO2 accurately, a very accurate measurement of the PPG pulse amplitude is required.
In the current study three pairs of wavelengths were used, and only one of them, the 780–808 nm pair provided SpO2 results in the required range of oxygen saturation (when Zijlstra extinction coefficients values were used). The results of the 785–808 nm pair were of lower accuracy and the 780–785 nm pair showed the least accuracy. The correlation between the wavelength pair difference and the error in SpO2 measurement can be attributed to the greater sensitivity of SpO2 measurement to the accuracy of R measurement when two wavelengths with smaller difference between them are used.
- (2).
There are several databases in which values of the extinction coefficients for oxy- and deoxyhemoglobin have been reported, and there are significant discrepancies between the values obtained in the different studies. It seems that the main problem with the accurate determination of the extinction coefficients for oxy- and deoxyhemoglobin is the measurement of light attenuation in hemolized blood (hemolized blood is used in order to avoid the scattering of light by the red blood cells). The biochemical process of hemolization and the removal of the cells' remains probably interfere with the measurement of light absorption by the hemoglobin molecules. In the current study SpO2 results that lie within the normal range of oxygen saturation values were found only when the extinction coefficients values were selected from the data of Zijlstra; the use of Cope and Prahl data resulted in clearly erroneous values of SpO2. The accuracy of the calibration-free pulse oximetry depends on the accuracy of the extinction coefficients values, and additional research is required in order to find accurate values of the hemoglobin extinction coefficients.
The relative accuracy of the conventional and the calibration-free pulse oximetry should be determined through comparison with invasive in vitro measurements of SaO2. If the novel calibration-free pulse oximetry is found to be more accurate than the conventional method, it should have additional diagnostic value in several clinical applications.
It should be noted that some other approaches on calibration-free SpO2 measurement have been proposed in the literature. Reddy et al. [26] suggested a method based on a mathematical model for the attenuation of light passing through the finger. According to their method SpO2 is derived from the amplitudes and slopes of the PPG waveforms acquired at red and infrared excitation wavelengths and the extinction coefficients for Hb and HbO2. Preliminary examinations performed on healthy volunteers and patients showed agreement with a commercial pulse oximeter. Another calibration-free method based on frequency-modulated near infrared spectroscopy (NIRS) was suggested by Franceschini et al. [27]. However both techniques are based on mathematical models that match the tissue circulation only in approximate terms.
4. Conclusions
The pulse oximetry technique for the measurement of oxygen saturation in arterial blood has been improved significantly since its emergence about 30 years ago, but it is still not accurate to better than three or four percent. This inaccuracy is due, at least in part, to the calibration process used, while this process is essential when two significantly different wavelengths are used. The great success of pulse oximeters in detecting significant decrease of oxygen delivery and deterioration of respiratory function in patients during surgical procedures and during recovery probably masks the fact that the accuracy of the present technique is not sufficient to allow its reliable use in certain medical problems, in particular SaO2 monitoring during oxygen supplementation for critically ill patients. Pulse oximetry which uses two nearby wavelengths is a greater technological challenge, but since it does not require initial calibration it has the potential to provide the clinical community with more accurate arterial oxygen saturation values than those obtained by the available pulse oximeters which use two wavelengths in the red and infrared regions and need calibration.
Acknowledgments
The study was supported by Joseph Trust, UK.
Author Contributions: Conception and design of the study: M. Nitzan. Design of the pulse oximeter and technical support: S. Noach, E. Tobal, Y. Adar, Y. Miller, E. Shalom. Collection of data: E. Tobal, Y. Adar, Y. Miller. Analysis and interpretation of the data: M. Nitzan, S. Engelberg, E. Tobal, Y. Adar. Manuscript preparation: M. Nitzan. Critical revision of the article: S. Engelberg.
Conflicts of Interest
The authors declare no conflict of interest.
References
- O'Driscoll, B.R.; Howard, L.S.; Davison, A.G. on behalf of the British Thoracic Society. BTS guideline for emergency oxygen use in adult patients. Thorax 2008, 63 Suppl 6, vi1–vi68. [Google Scholar]
- Yoshiya, I.; Shimady, Y.; Tanake, K. Spectrophotometric monitoring of arterial oxygen saturation on the fingertip. Med. Biol. Eng. Comput. 1980, 18, 27–32. [Google Scholar]
- Wieben, O. Light absorbance in pulse oximetry. In In Design of Pulse Oximeters; Institute of Physics Publishing: Bristol, UK, 1997; pp. 40–55. [Google Scholar]
- Moyle, J.T.B. Pulse Oximetry; BMJ Books: London, UK, 2002. [Google Scholar]
- Mannheimer, P.D. The Light-Tissue Interaction of Pulse Oximetry. Anesth. Analg. 2007, 105, S10–S17. [Google Scholar]
- Sebald, D.J. Motivation in pulse oximetry. In Design of Pulse Oximeters; Institute of Physics Publishing: Bristol, UK, 1997; pp. 13–20. [Google Scholar]
- Prahl, S. The absorption spectra of the oxygenated and deoxygenated hemoglobin molecules. graph. Available online: http://omlc.ogi.edu/spectra/hemoglobin/index.html (accessed on 21 January 2014).
- Mannheimer, P.D.; Casciani, J.R.; Fein, M.E.; Nierlich, S.L. Wavelength selection for low-saturation pulse oximetry. IEEE Trans. Biomed. Eng. 1997, 44, 148–158. [Google Scholar]
- Zourabian, A.; Siegel, A.; Chance, B.; Ramanujan, N.; Rode, M.; Boas, D.A. Trans-abdominal monitoring of fetal arterial blood oxygenation using pulse oximetry. J. Biomed. Opt. 2000, 5, 391–405. [Google Scholar]
- Kyriacou, P.A. Pulse oximetry in the esophagus. Physiol. Meas. 2006, 27, R1–R35. [Google Scholar]
- Nitzan, M.; Engelberg, S. Three-wavelength technique for the measurement of oxygen saturation in aterial blood and in venous blood. J. Biomed. Opt 2009, 14, 024046. [Google Scholar]
- Friebel, M.; Helfmann, J.; Netz, U.; Meinke, M. Influence of oxygen saturation on the optical scattering properties of human red blood cells in the spectral range 250 to 2000 nm. J. Biomed. Opt. 2009, 14, 034001. [Google Scholar]
- Batchelder, P.B.; Raley, D.M. Maximizing the laboratory setting for testing devices and understanding statistical output in pulse oximetry. Anest. Analg. 2007, 105, S85–S94. [Google Scholar]
- Fouzas, S.; Priftis, K.N.; Anthrcopoulos, M.B. Pulse oximetry in pediatric practice. Pediatrics 2011, 128, 740–752. [Google Scholar]
- Seguin, P.; Le Rouzo, A.; Tanguy, M.; Guillou, Y.M.; Feuillu, A.; Malledant, Y. Evidence for the need of bedside accuracy of pulse oximetry in an intensive care unit. Crit. Care Med. 2000, 28, 703–706. [Google Scholar]
- Van de Louw, A.; Cracco, C.; Cerf, C.; Harf, A.; Duvaldestin, P.; Lamaire, P,F.; Brochard, L. Accuracy of pulse oximetry in the intensive care unit. Intens. Care Med. 2001, 27, 1606–1613. [Google Scholar]
- Perkins, G.D.; McAuley, D.F.; Giles, S.; Routledge, H.; Gao, F. Do changes in pulse oximeter oxygen saturation predict equivalent changes in arterial oxygen saturation? Crit. Care 2003, 7, R67–R71. [Google Scholar]
- Wilson, B.J.; Cowan, H.J.; Lord, J.A.; Zuege, D.J.; Zygun, D.A. The accuracy of pulse oximetry in emergency department patients with severe sepsis and septic shock: A retrospective cohort study. BMC Emerg. Med. 2010, 10, 9. [Google Scholar]
- Poets, C.F.; Southall, D.P. Noninvasive monitoring of oxygenation in infants and children: practical considerations and areas of concern. Pediatrics 1994, 93, 737–746. [Google Scholar]
- Tungjitkusolmun, S. Accuracy and errors. In In Design of Pulse Oximeters; Institute of Physics Publishing: Bristol, UK, 1997; pp. 176–198. [Google Scholar]
- Nitzan, M.; Babchenko, A.; Khanokh, B.; Taitelbaum, H. The measurement of oxygen saturation in venous blood by dynamic near IR spectroscopy. J. Biomed. Opt. 2000, 5, 155–162. [Google Scholar]
- Zijlstra, W.G.; Buursma, A.; Meeuwsen-van der Roest, W.P. Absorption spectra of human fetal and adult oxyhemoglobin, de-oxyhemoglobin, carboxyhemoglobin, and methemoglobin. Clin. Chem. 1991, 37, 1633–1638. [Google Scholar]
- Cope, M. The application of near infrared spectroscopy to non invasive monitoring of cerebral oxygenation in the newborn infant. Ph.D. Thesis, University College London, London, UK, 1991. [Google Scholar]
- Prahl, S.A. Tabulated Molar Extinction Coefficient for Hemoglobin in Water. Available online: http://omlc.ogi.edu/spectra/hemoglobin/summary.hmtl (accessed on 14 January 2014).
- Kim, J.G.; Liu, H. Variation of haemoglobin extinction coefficients can cause errors in the determination of haemoglobin concentration measured by near-infrared spectroscopy. Phys. Med. Biol. 2007, 52, 6295–6322. [Google Scholar]
- Reddy, K.A.; George, B.; Mohan, N.N.; Kumar, V.J. A novel calibration-free method of measurement of oxygen saturation in arterial blood. IEEE Tr. BME 2009, 58, 1699–1705. [Google Scholar]
- Franceschini, M.A.; Gratton, E.; Fantini, S. Noninvasive optical method of measuring tissue and arterial saturation: An application to absolute pulse oximetry of the brain. Opt. Lett. 1999, 24, 829–831. [Google Scholar]


| Wavelength [nm] | εo/εd[1/cm M] | ||
|---|---|---|---|
| Cope | Prahl | Zijlstra | |
| 780 | 738/1,098 | 712/1070 | 733/1085 |
| 785 | 769/994 | 736/973 | 757/992 |
| 808 | 918/803 | 857/723 | 831/806 |
| # | Calibration-Free (%) | Commercial (%) |
|---|---|---|
| 1 | 98.1 | 97 |
| 2 | 97.6 | 96 |
| 3 | 96.7 | 98 |
| 4 | 100.5 | 98 |
| 5 | 98.6 | 97 |
| 6 | 95.4 | 96 |
| 7 | 95.4 | 97 |
| 8 | 98.9 | 97 |
| 9 | 98.2 | 97 |
| 10 | 95.3 | 96 |
| 11 | 98.4 | 97 |
| 12 | 99.3 | 98 |
| 13 | 98.9 | 97 |
| 14 | 98.3 | 97 |
| 15 | 95.9 | 96 |
© 2014 by the authors; licensee MDPI, Basel, Switzerland. This article is an open access article distributed under the terms and conditions of the Creative Commons Attribution license ( http://creativecommons.org/licenses/by/3.0/).
Share and Cite
Nitzan, M.; Noach, S.; Tobal, E.; Adar, Y.; Miller, Y.; Shalom, E.; Engelberg, S. Calibration-Free Pulse Oximetry Based on Two Wavelengths in the Infrared — A Preliminary Study. Sensors 2014, 14, 7420-7434. https://doi.org/10.3390/s140407420
Nitzan M, Noach S, Tobal E, Adar Y, Miller Y, Shalom E, Engelberg S. Calibration-Free Pulse Oximetry Based on Two Wavelengths in the Infrared — A Preliminary Study. Sensors. 2014; 14(4):7420-7434. https://doi.org/10.3390/s140407420
Chicago/Turabian StyleNitzan, Meir, Salman Noach, Elias Tobal, Yair Adar, Yaacov Miller, Eran Shalom, and Shlomo Engelberg. 2014. "Calibration-Free Pulse Oximetry Based on Two Wavelengths in the Infrared — A Preliminary Study" Sensors 14, no. 4: 7420-7434. https://doi.org/10.3390/s140407420