WO3/W Nanopores Sensor for Chemical Oxygen Demand (COD) Determination under Visible Light

Abstract
: A sensor of a WO3 nanopores electrode combined with a thin layer reactor was proposed to develop a Chemical Oxygen Demand (COD) determination method and solve the problem that the COD values are inaccurately determined by the standard method. The visible spectrum, e.g., 420 nm, could be used as light source in the sensor we developed, which represents a breakthrough by limiting of UV light source in the photoelectrocatalysis process. The operation conditions were optimized in this work, and the results showed that taking NaNO3 solution at the concentration of 2.5 mol·L−1 as electrolyte under the light intensity of 214 μW·cm−2 and applied bias of 2.5 V, the proposed method is accurate and well reproducible, even in a wide range of pH values. Furthermore, the COD values obtained by the WO3 sensor were fitted well with the theoretical COD value in the range of 3–60 mg·L−1 with a limit value of 1 mg·L−1, which reveals that the proposed sensor may be a practical device for monitoring and controlling surface water quality as well as slightly polluted water.1. Introduction
Chemical oxygen demand (COD) is considered to be a quite significant parameter in contemporary society. The traditional COD measurement, the potassium dichromate oxidation method, has been applied for decades but is unsuitable to determine samples with COD concentrations lower than 50 mg·L−1. The potassium permanganate oxidation (CODMn) method, another standard method for determining low COD concentrations within the range of 5–50 mg·L−1, however, does not accurately reflect the COD values of samples for its poor oxidation ability. Furthermore, both methods suffer shortcomings such as being time-consuming, high cost, and using toxic chemicals in the determination process [1]. Considering this situation, it is urgent to propose a method which could accurately determine the COD values of aquatic samples.
Sensors have been used to solve various issues [2–4], and in this kind of case a semiconductor electrode sensor combined with a thin layer reactor could serve as a COD determination device which requires only 1–5 min to complete an examination and consumes very limited amounts of reagent (electrolyte only) when applying the photoelectrocatalysis approach to generate electron/hole pairs to degrade organic matter on the semiconductor surface. Among semiconductors [5,6], TiO2 nanomaterials have attracted special attention [7–9] due to its superior oxidative abilities under UV illumination and is typically non-toxic, inexpensive and environmentally benign. However, two drawbacks have limited the application of TiO2 nanomaterials: one is the limiting use of the light source for the wide band gap of 3.2 eV [9] which could only use the UV spectrum as a light source to excite the photogenerated electron/hole pairs; the other one is the unexpected heating of the short wave light source during the degradation process.
In this work, a new kind of sensor, a WO3 nanopores electrode, in conjunction with a thin layer reactor was proposed for application in COD determination. Benefitting from the narrow band gap (2.6 eV) of WO3 [10–12], a light source in the visible light spectrum could excite the photogenerated electron/hole pairs. In addition, like TiO2, WO3 is low cost and non-toxic. The WO3 electrode was prepared via a facile electrochemical anodization method from tungsten foil with a nanoporous structure which assured its good stability. Compared to previous WO3 electrodes, the as-prepared WO3 nanoporous electrode displays excellent mechanical stability and possesses larger specific surface area which enhances its light harvesting capability and electrolyte contacting. Due to all of the above-mentioned factors, the WO3 sensor represents an improvement in the phototelectrocatalytic degradation of organics.
2. Experimental Section
All the reagents, purchased from Sinopharm Chemical Reagent Co., Ltd., (Shanghai, China) were analytical reagent grade and used without further purification unless otherwise stated. Deionized water was used for the solution preparation. NaNO3 solution served as supporting electrolyte for the COD determination in the photoelectrocatalysis method.
The WO3/W nanopores electrode sensor was prepared by an electrochemical anodic oxidation method in which tungsten was served as anode and platinum as cathode. In a typical process, the preparation was conducted in a mixture solution of 0.2 wt % NaF and 0.3% HF at 60 V for 1 h and subsequently at 40 V for 30 min. The resulting sample was annealed in an air atmosphere at 450 °C for 3 h. The surface morphology of the WO3 film was investigated by field emission scanning electron microscopy (FE-SEM FEI-Sirion200, Hillsboro, America) under a voltage of 5 kV.
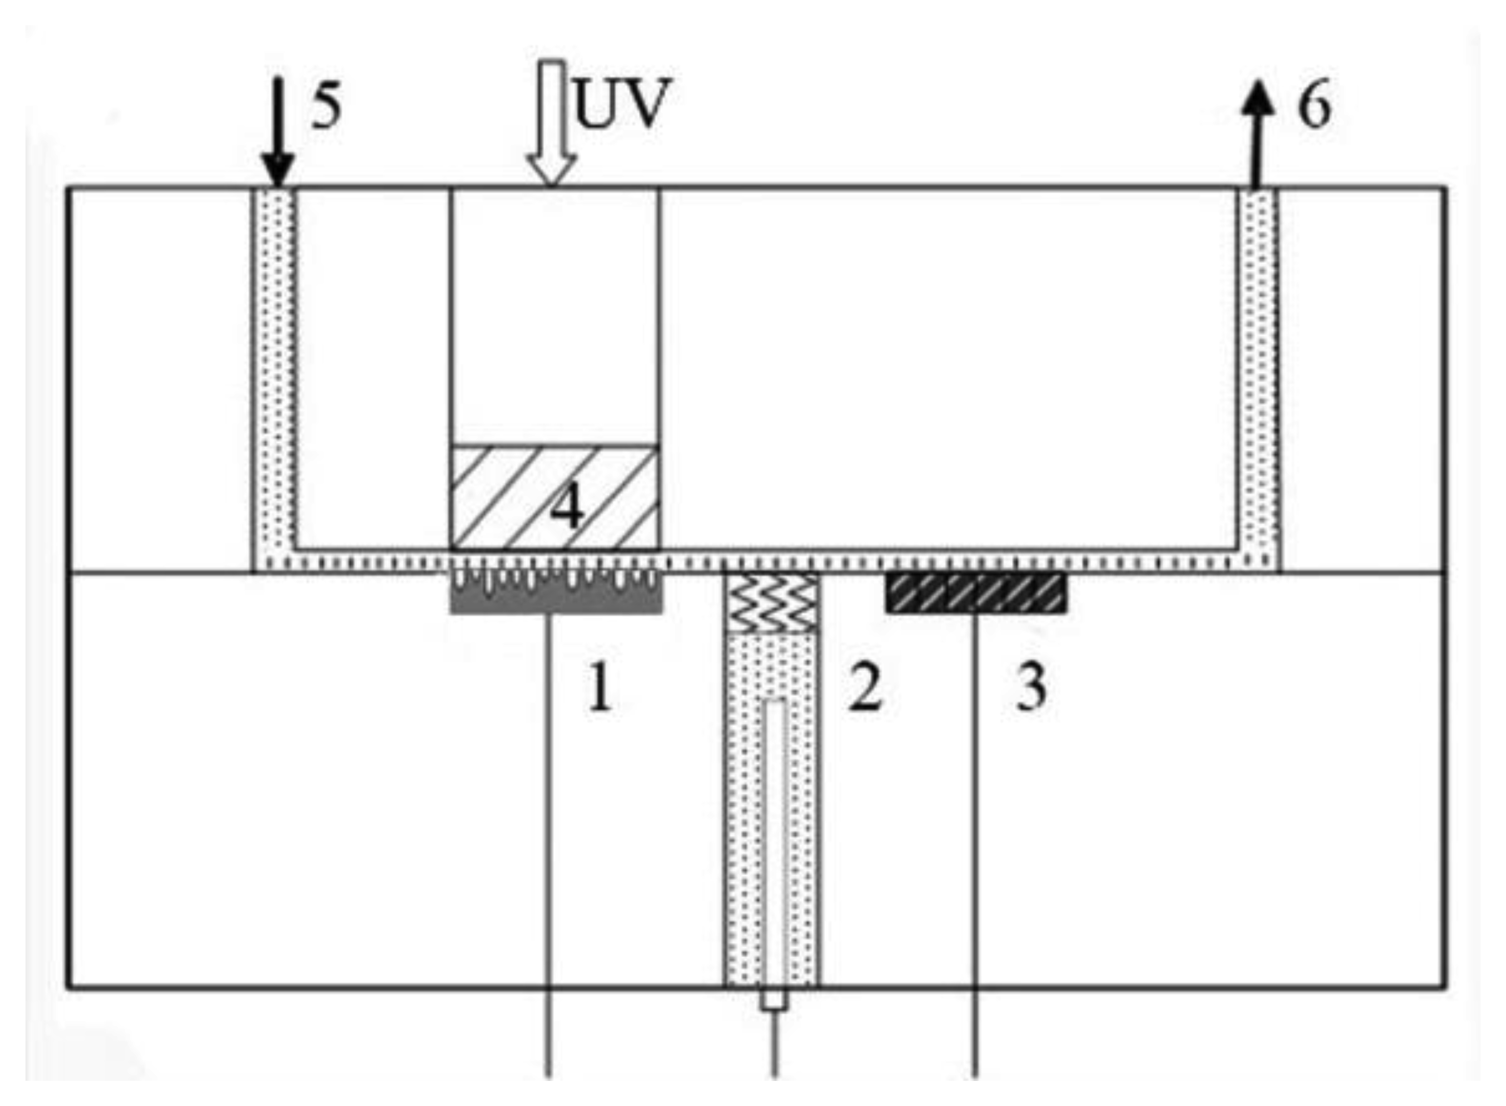
The photoelectrochemical experiment was conducted in a thin layer reactor as shown in Figure 1, in which the thickness was 0.1 mm and diameter was 1 cm. A typical three-electrode system was applied with a platinum foil counter electrode, a saturated Ag/AgCl reference electrode and a WO3 nanopores working electrode under visible light illumination at a wavelength of 420 nm. The solution was injected into the reactor by an automatic injector purchased from Xi'an Remex Analysis Instrument Company (Xi'an, China). The potential and current of the working electrode were controlled by an electrochemical workstation (CHI 610D, Chenghua, Shanghai, China).
3. Results and Discussion
The phototelectrocatalysis oxidation process of organic compounds in the WO3 nanopores electrode sensor can be represented by the following formula:
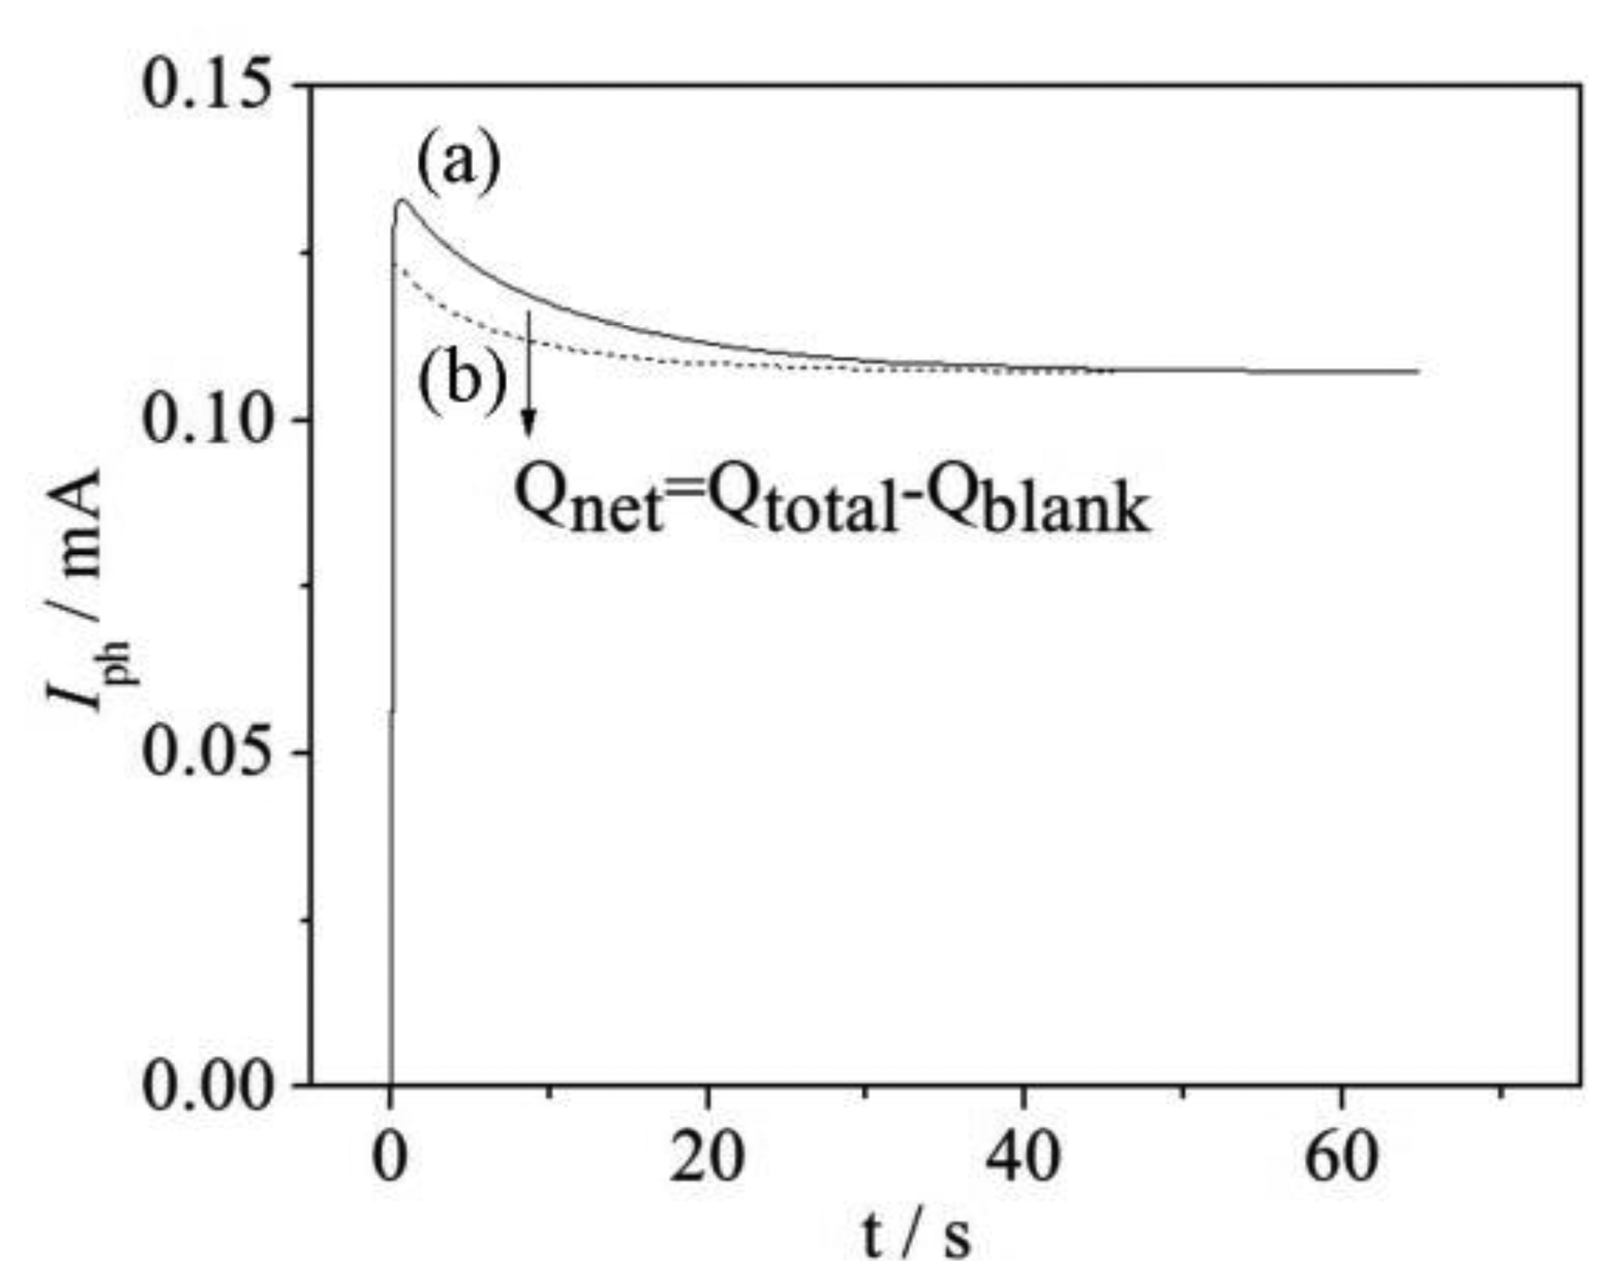
Faraday's law can be used to quantify the concentration by measuring the charge generated by organic compounds degradation:
Besides, according to the definition of COD and the chemical reaction formula:
The quantity of transferred electrons could be converted to that of oxygen consumption and does not depend on the type of organic matter, which has been proved in our previously work [9].
3.1. Characterization of WO3 Nanopores Electrode Sensor
In order to improve the separation of photoelectron/hole pairs, the WO3/W electrode properties should be optimized. It can be seen from the scanning electron microscopy (SEM) image (Figure 3a) that continuous nanopores with a diameter of 55∼100 nm covered the tungsten surface and the nanopores directly grew on the tungsten, which made the electrons easily exported to the external circuit.
Nanopores with a large surface area contacting the electrolyte produce more reaction sites to promote the reaction efficiency. Figure 3b shows the I–t curves obtained by the WO3/W nanopores sensor under photoelectrocatalysis, electrocatalysis and photocatalysis conditions, respectively. It can be seen that the WO3/W nanopores electrode performed well when both light illumination and bias were applied, and the photocurrent values are obviously higher than with the other two methods (electrocatalysis and phototcatalysis) under these photoelectrocatalysis conditions. In addition, it can be seen that the resulting electrode possesses good visible light response, good mechanical stability and large surface area, which would be beneficial to the separation of photoelectron/hole pairs.
3.2. Effect of the Supporting Electrolyte
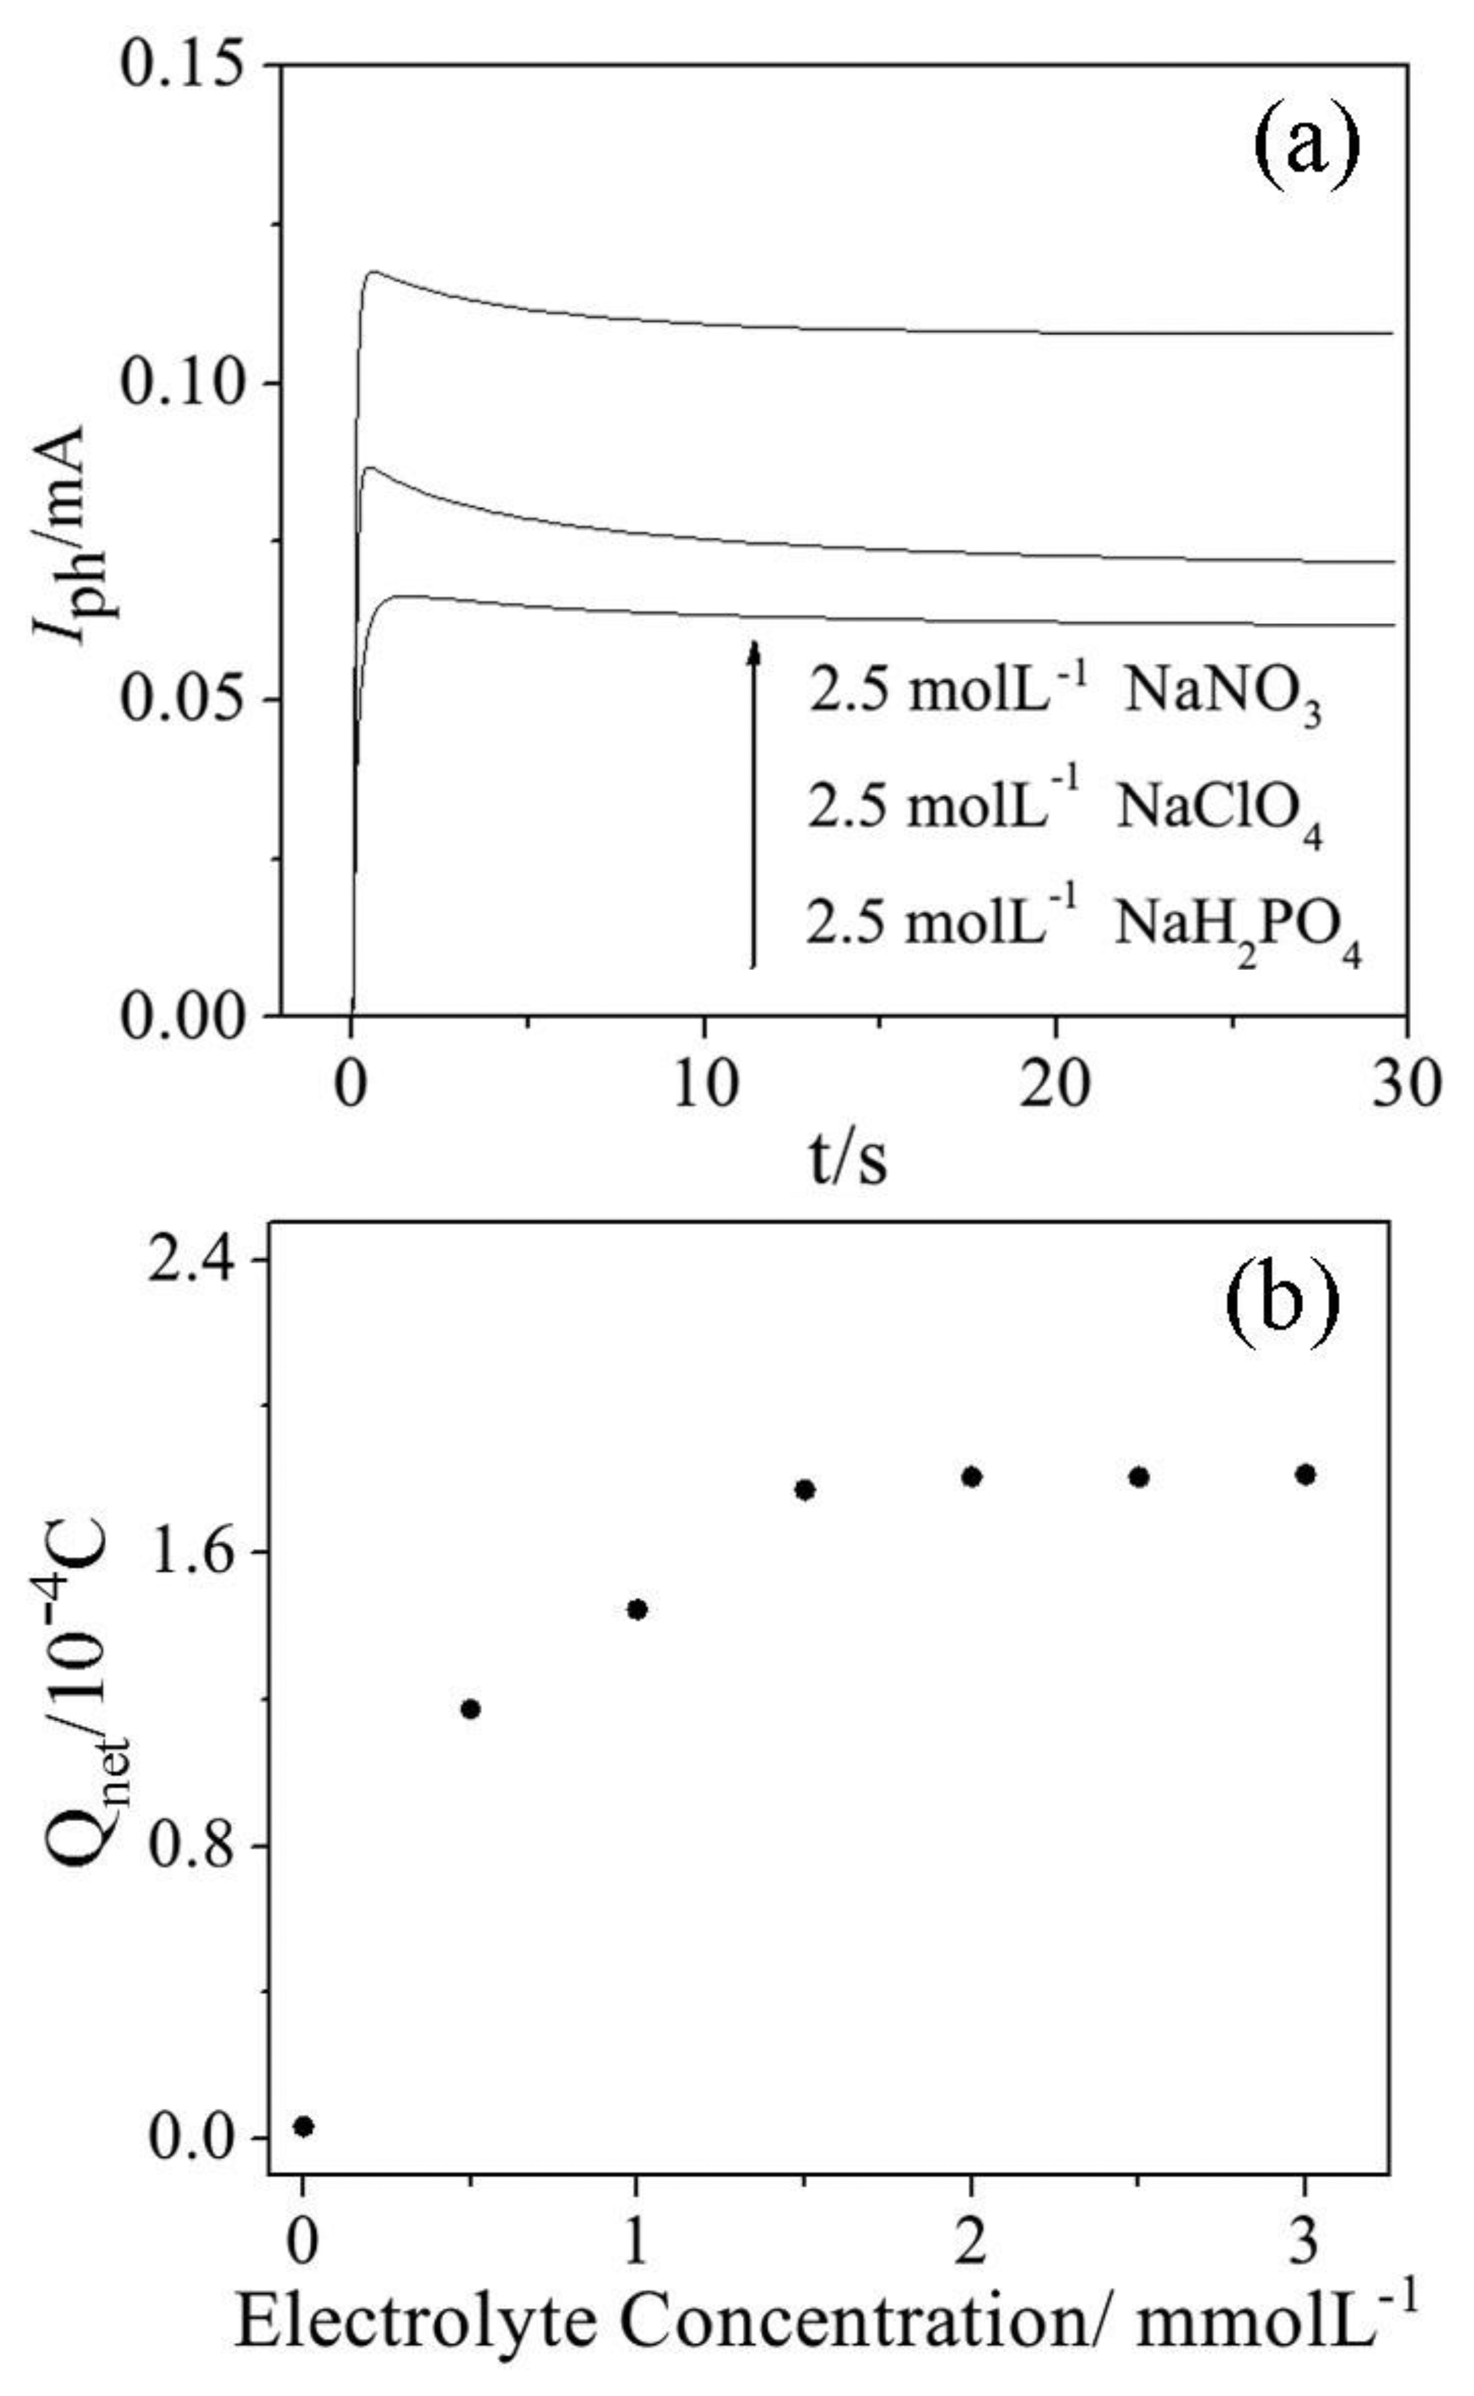
The supporting electrolyte is crucial to transfer electrons from the sensor to the external circuit because the quantity of the captured charge directly affects the COD determination results according the determination principle. In order to choose a suitable electrolyte and concentration, three kinds of sodium salts were tested in the photoelectrocatalysis process. As shown in Figure 4a, both the maximum value of the photocurrent response signals and the shortest time (about 20 s) to achieve the steady state were realized by using 2.5 mol·L−1 NaNO3 as the supporting electrolyte.
The various concentrations of NaNO3 electrolyte were tested taking glucose with a known theoretical COD (ThCOD) value of 42 mg·L−1 as target sample. The results shown in Figure 4b illustrate that when the electrolyte concentrations are in the range of 2 to 3 mol·L−1, the determined Qnet values show good stability and are obviously higher than those obtained under the condition that the electrolyte concentrations are lower than a certain value, e.g., 1.5 mol·L−1. In order to make sure the electrons pass the narrow pathway of the sensor to external circuit, 2.5 mol·L−1 NaNO3 was chosen as the supporting electrolyte for the subsequent experiments.
3.3. Effect of the Light Intensity
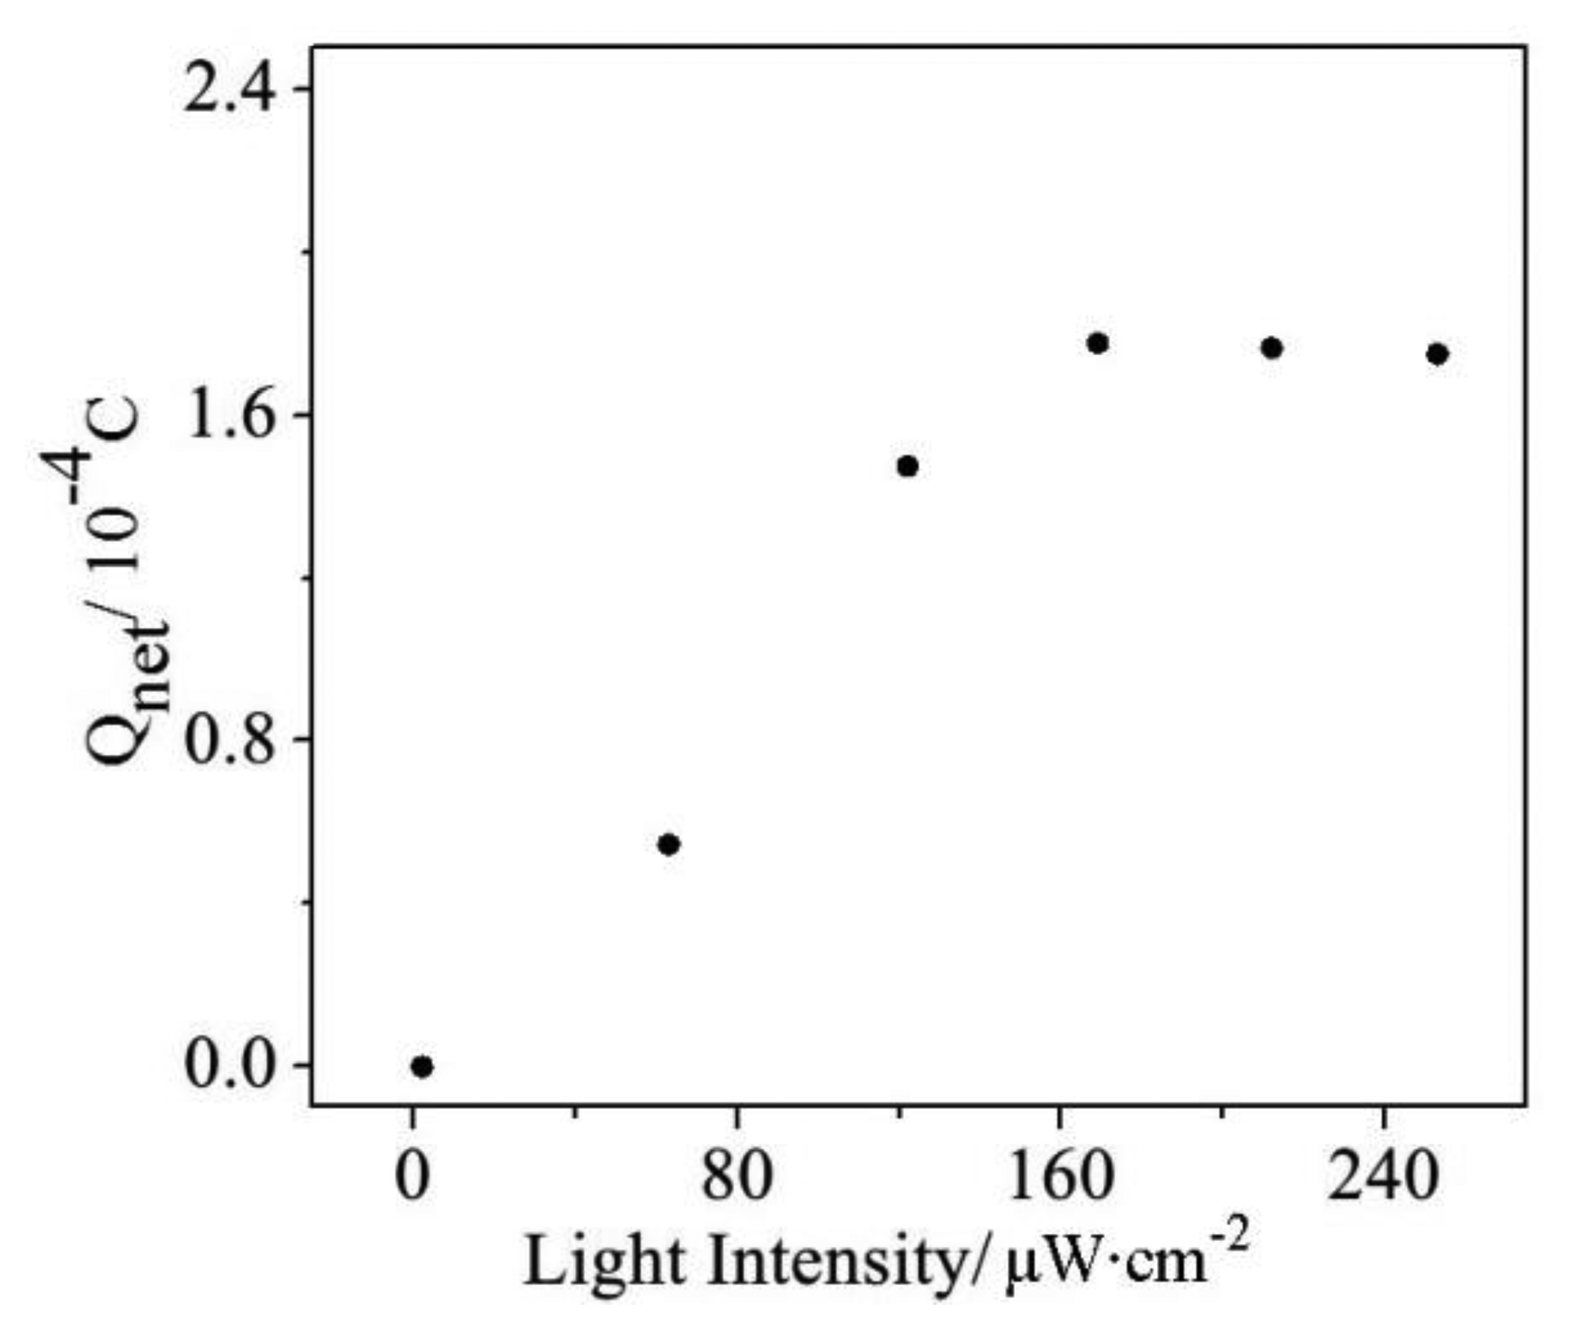
The light source is very important in the photoelectrocatalysis process because the light excites the photoelectron/hole pairs on the surface of WO3/W electrode. The light-excited photoelectron holes can then oxidize the organics. As shown in Figure 5, the obtained Qnet values are much smaller when the light intensity is weaker than 170 μW·cm−2 because the weak light intensity excites only a small amount of photogenerated holes, which is distinctly inadequate for the quantity of organic material. In contrast, the obtained Qnet values are stable when the light intensities are stronger than 170 μW·cm−2. To enhance the stability of the quantity of light-excited photoelectron/hole pairs, a light intensity condition of 214 μW·cm−2 was selected for the subsequent experiments.
3.4. Selection of the Applied Bias
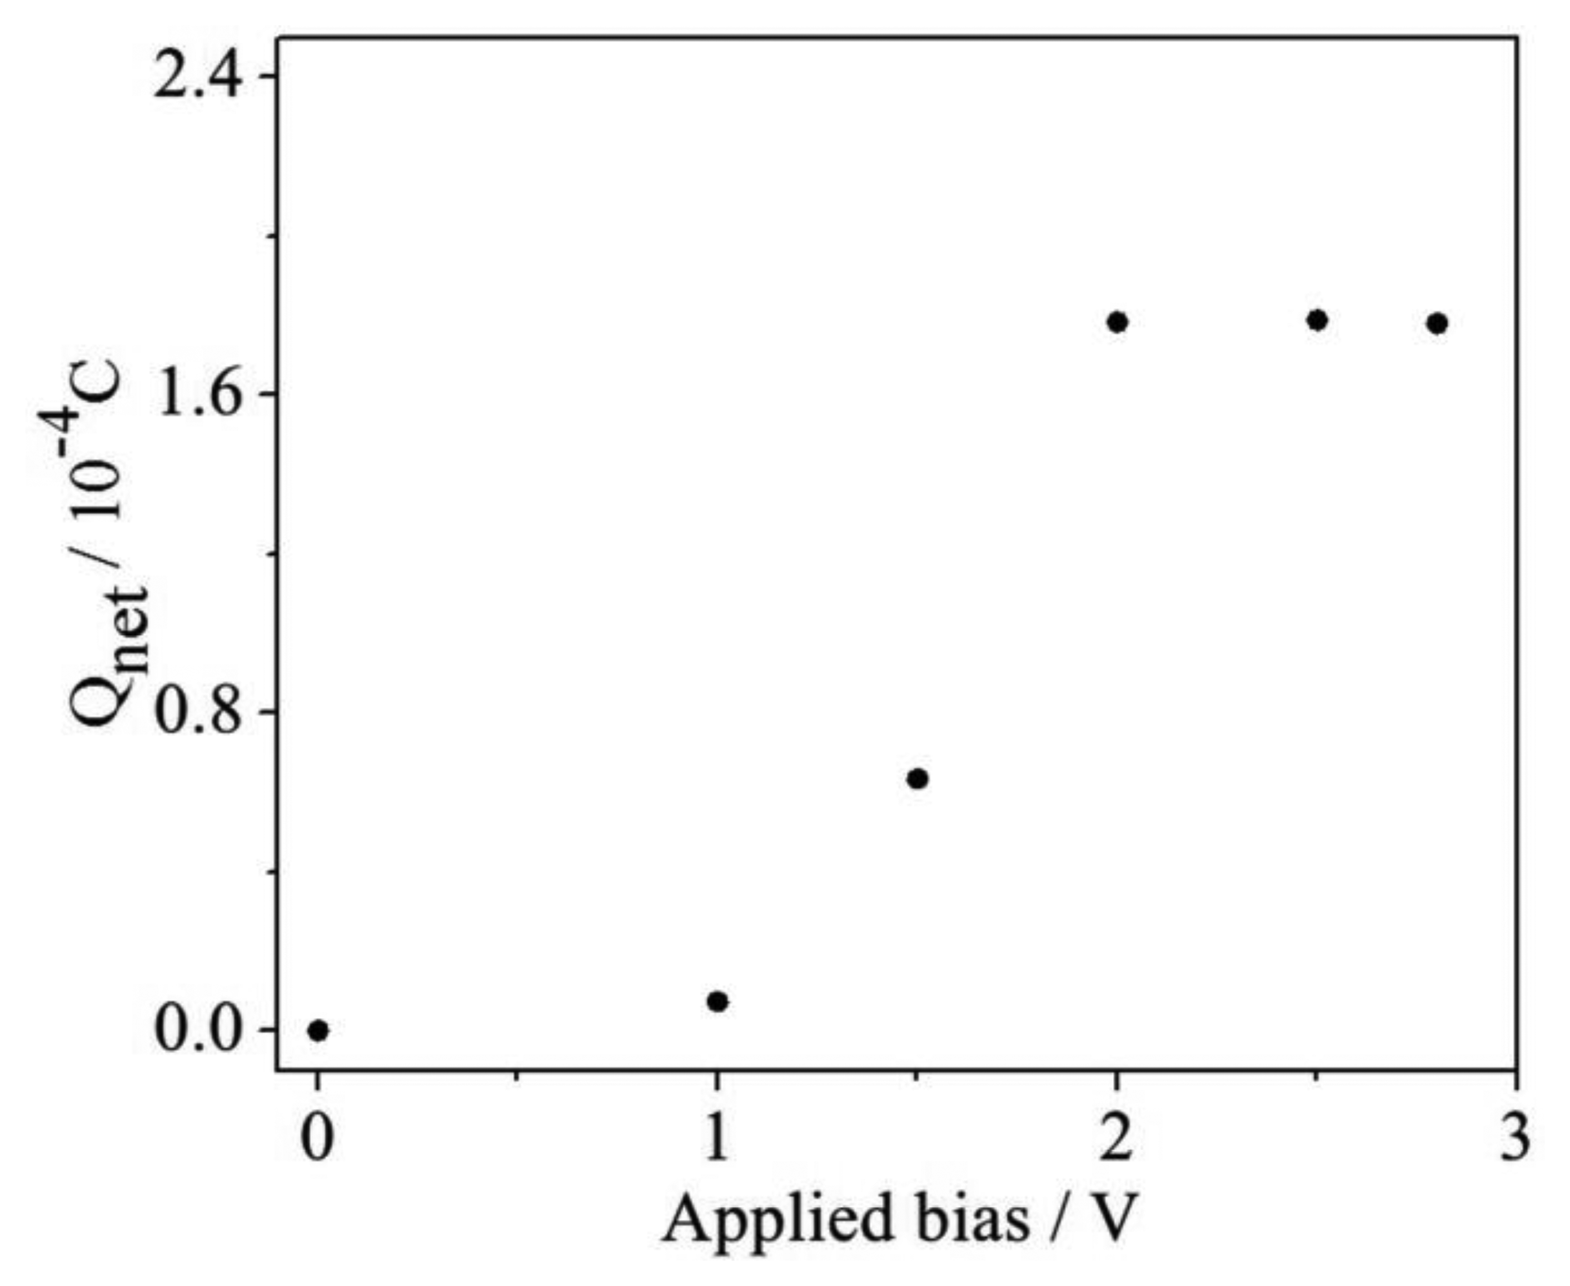
In the phtotelectrocatalysis oxidation process, the photogenerated hole is a kind of very powerful oxidizing reagent for the degradation of organics. However, the recombination of the photogenerated electrons and holes is always a limiting factor for the degradation efficiency [13]. It has been reported that an applied bias could assist in transferring the photogenerated electrons to the external circuit, thus remarkably improving the organic compound degradation efficiency [9]. Therefore, a proper applied bias is necessary because the low voltage only supplies a weak transmission force so that the quick recombination of photogenerated electron/hole pairs occurs in a very short time. The effect of the applied bias on Qnet determination was investigated at different applied bias conditions and the results are shown in Figure 6, from which it can been seen that the determined Qnet values are much smaller when the applied bias values are lower than 2 V. When the applied bias is in the range of 2.0 to 2.8 V, the obtained Qnet values almost do not fluctuate. Thus, the condition of 2.0 V was selected for the next experiments.
3.5. Propose Method Stability and Accuracy
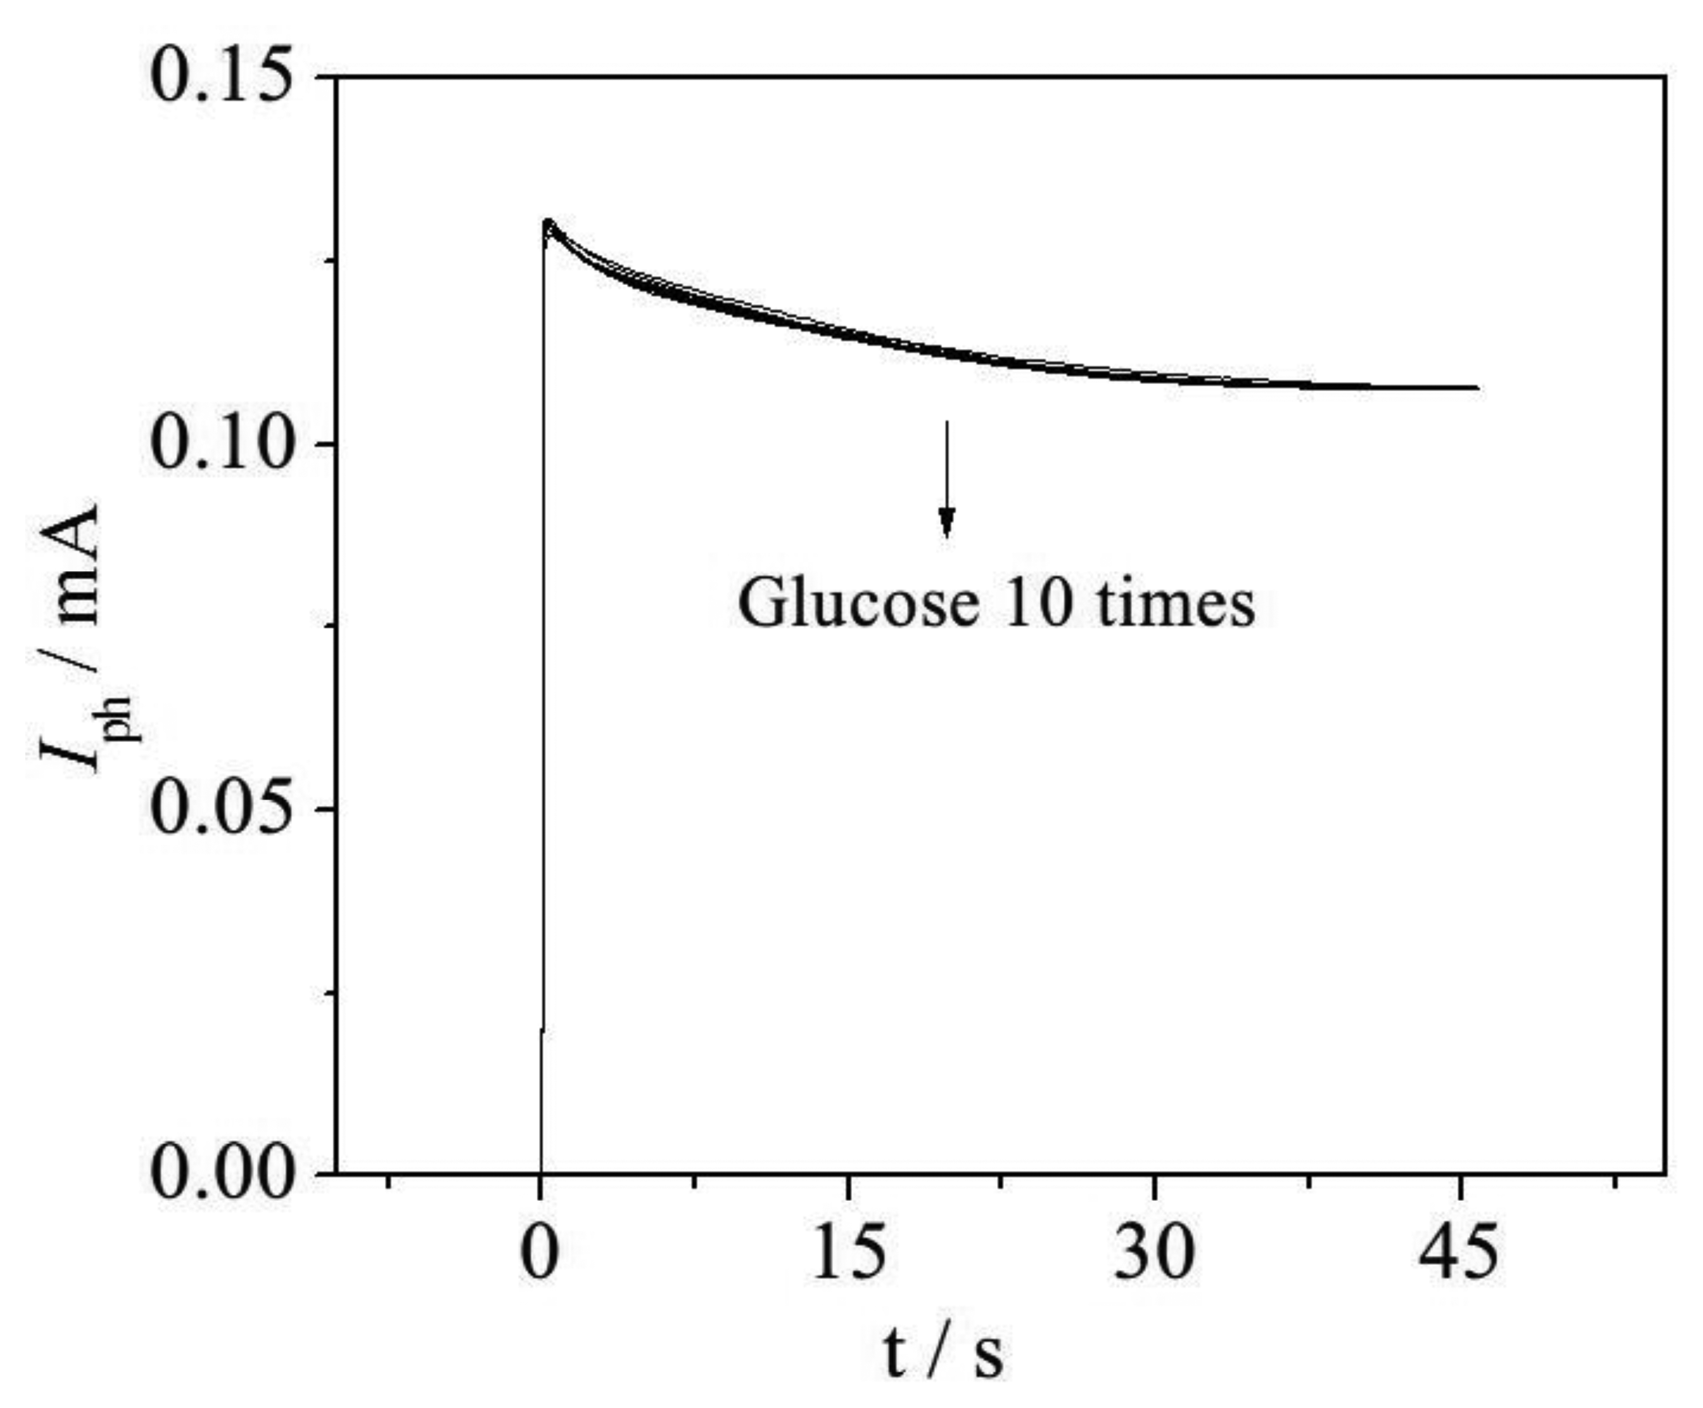
To increase the stability and accuracy of the proposed method, samples containing 42 mg·L−1 ThCOD glucose were investigated. Response photocurrents from ten continuous experiments are shown in Figure 7, from which it can be seen that all of these I–t curves show a similar degradation process, as the curves almost coincide. In addition, the calculated relative standard deviation (RSD) is 3.60% for these ten samples, with a mean value of 42.23 mg·L−1. Furthermore, COD values determined by the photoelectrocatalysis method (PeCOD), e.g., with the WO3/W nanopores sensor, are shown in Table 1. The determined PeCOD values of glucose samples agreed well with the ThCOD, and the relative deviation (RD) of each determined value is smaller than 5%. The results illustrate that the proposed method is accurate and well reproducible.
3.6. Effect of pH
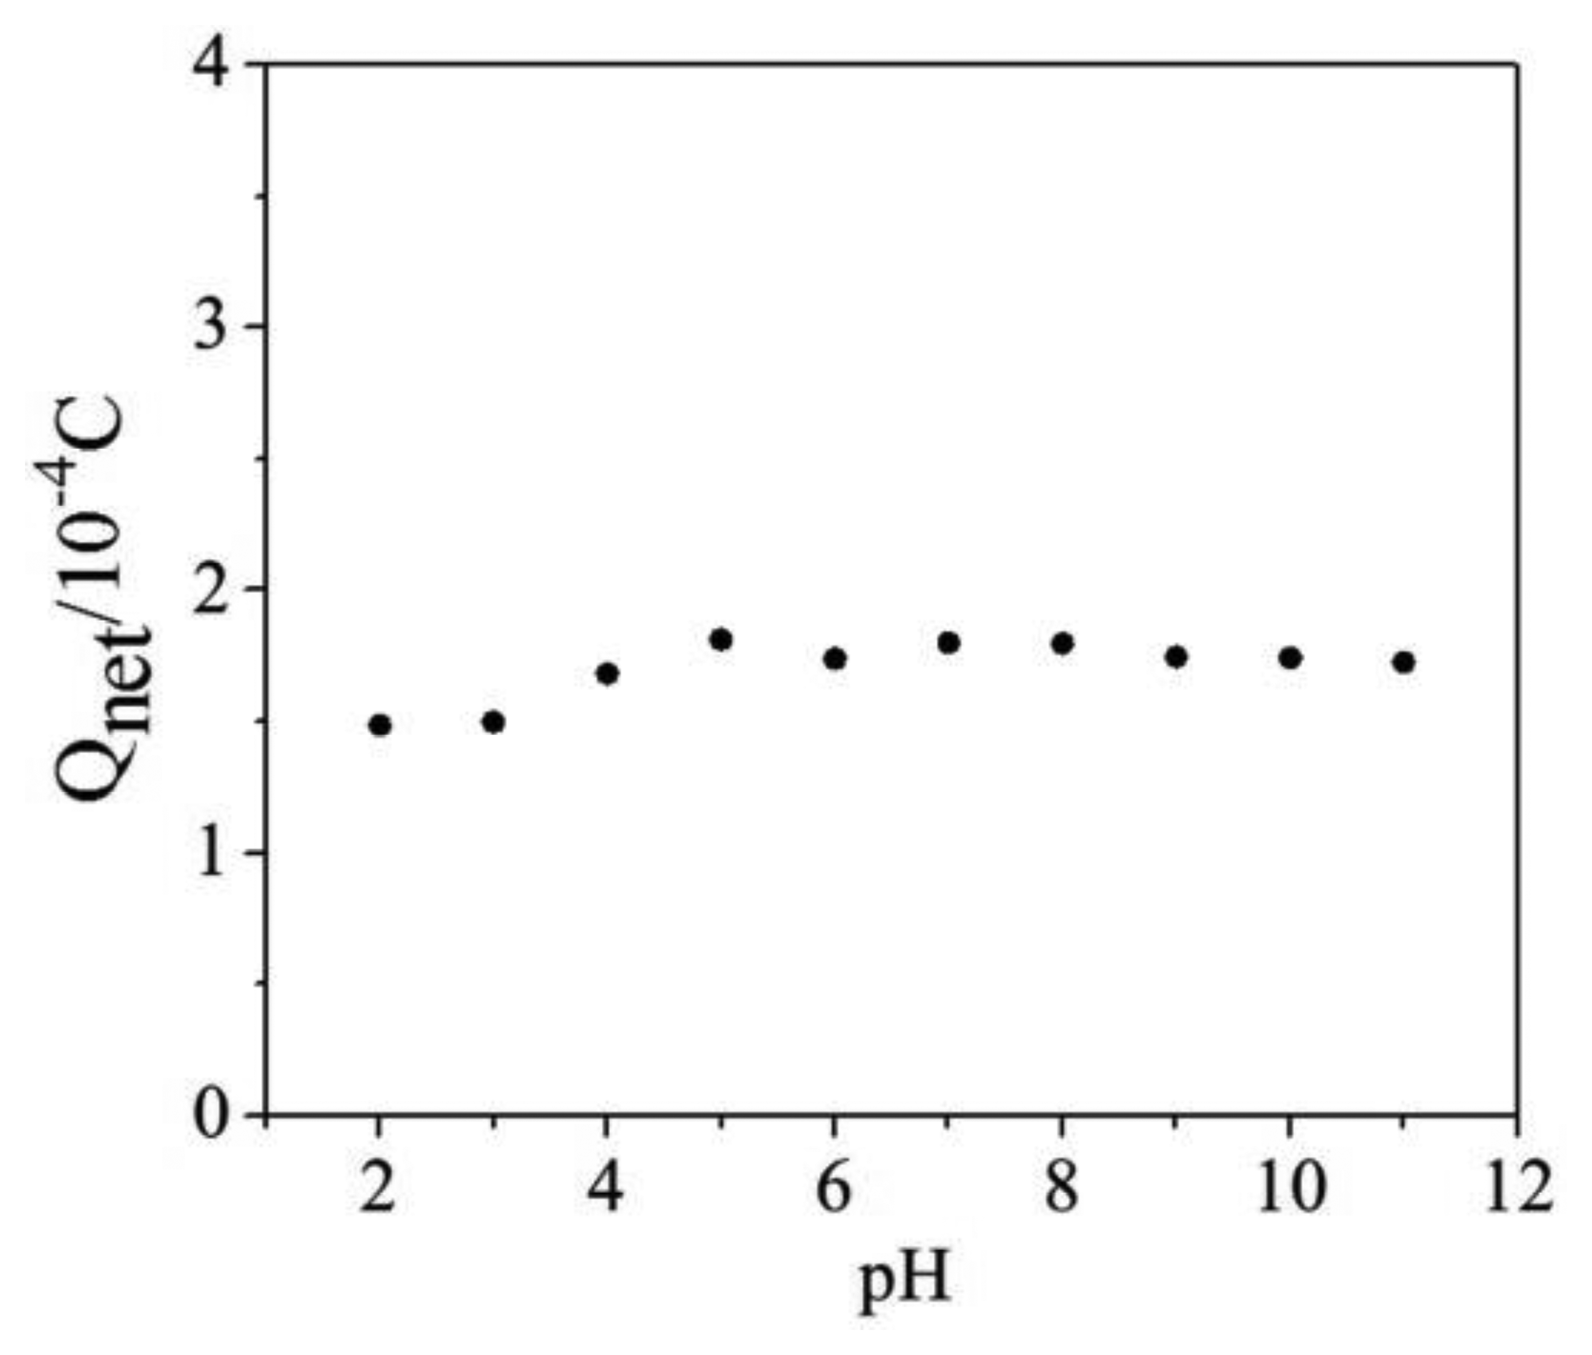
The pH value of solution is a very important parameter in the phtotelectrocatalysis determination process, and the effect of pH on Qnet determination was investigated in this work. The Qnet values determined in a wide pH range of 2 to 11 are shown in Figure 8, where it can be seen that the Qnet values are stable in case of pH values ranging from 4 to 11 and the calculated RSD is 2.53% for eight samples with a mean value of 1.75 × 10⁻⁴ C. According to the national standards the pH values of surface water should between 6 and 9, which means the proposed method is applicable to detect these kinds of samples.
3.7. COD Determination
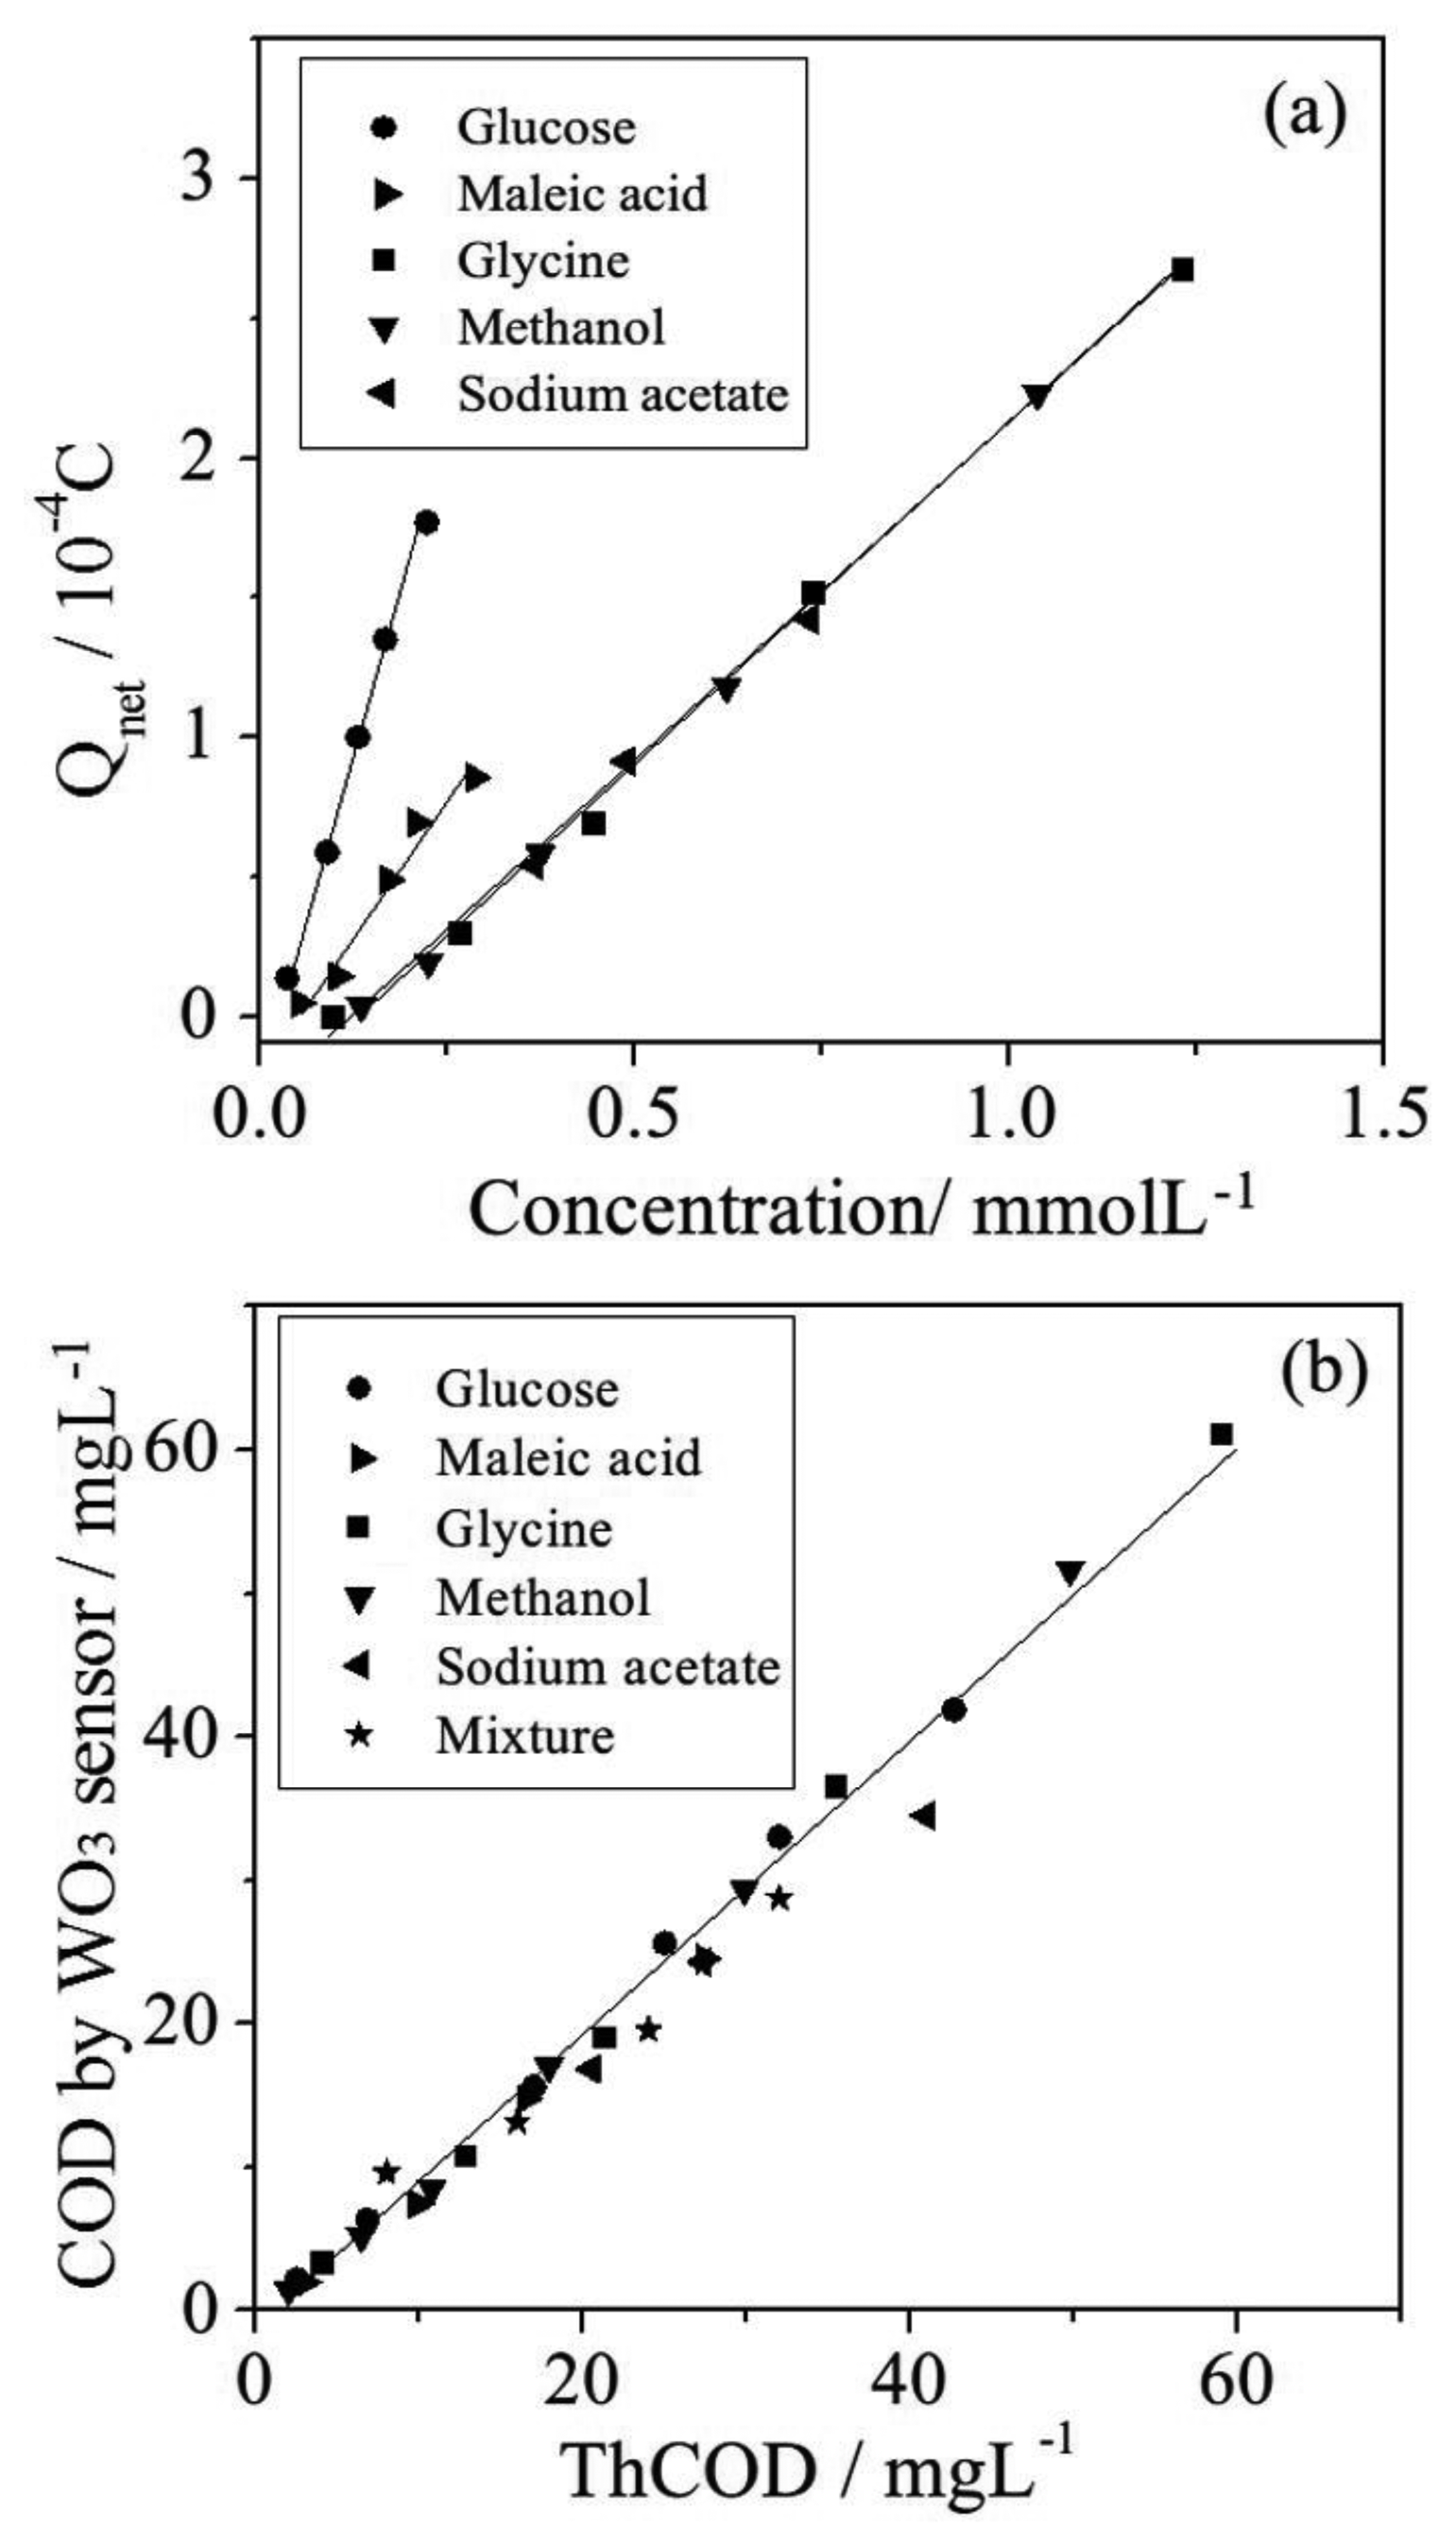
The COD values of various kinds of organics have been determined and the relationship between the Qnet values and the molar concentrations of individual organic compounds are shown in Figure 9a, which indicates the Qnet values are proportional to the concentration for each kind of organic compound investigated in this work. Figure 9b has been derived from Figure 9a by plotting the net charge against the theory values of COD. The plots reveal that all kinds of the compounds investigated in this work can be fitted by a straight line y = 1.013x − 1.654, (where y represents PeCOD obtained from phototelectrocatalysis oxidation by the WO3 sensor, x represents the ThCOD of the organics) with R2 = 0.98. For the different kinds of organics, the same Qnet has been obtained as long as the COD values of the organics are the same. It suggests that this method could be applicable to slightly polluted water such as groundwaters and the effluent of sewage treatment plants.
4. Conclusions
A sensor of a WO3/W nanoporous electrode combined with a thin layer reactor was proposed to determine COD, which is based on the relationship between COD and the quantity of charge captured applying the photoelelctrocatalysis method. The optimum conditions, including light intensity, applied bias and supporting electrolyte concentration, were investigated in photoelectrochemical experiments. The results showed a good relationship between PeCOD and the theoretical COD value, which suggests the application of this kind of sensor to slightly polluted water such as surface waters and sewage treatment plant effluents. In light of the advantages of the WO3 nanopores electrode, such as simplified operation, significantly shortened measurement times, reduce costs and absence of toxic and hazardous substances, the proposed WO3/W sensor could represent a new approach for COD determination.
Acknowledgments
This work was supported by Chinese National Key Projects of Water Pollution and Reclamation (NO. 2012ZX07102-002), the National High Technology Research and Development Program of China (Grant No. 2009AA063003), the National Nature Science Foundation of China (No. 20677039), and the Tech Cross Fund of Shanghai Jiaotong University for financial support.
References
- Moore, W.A.; Kroner, R.C.; Ruchhoft, C. Dichromate reflux method for determination of oxygen consumed. Anal. Chem. 1949, 21, 953–957. [Google Scholar]
- Zhang, X.N.; Teng, Y.Q.; Fu, Y.; Xu, L.L.; Zhang, S.P.; He, B.; Wang, C.G.; Zhang, W. Lectin-based biosensor strategy for electrochemical assay of glycan expression on living cancer cells. Anal. Chem. 2010, 82, 9455–9460. [Google Scholar]
- Clifford, K.H.; Robert, C.H. In-situ chemiresistor sensor package for real-time detection of volatile organic compounds in soil and groundwater. Sensors 2006, 6, 1420–1427. [Google Scholar]
- Shi, L.; Song, W.; Li, Y.; Li, D.W.; Swanick, K.N.; Ding, Z.F.; Long, Y.T. A multi-channel sensor based on 8-hydroxyquinoline ferrocenoate for probing Hg(II) ion. Talanta 2011, 84, 900–904. [Google Scholar]
- Yu, H.B.; Quan, X.; Chen, S.; Zhao, H.M. Flow injection analysis of chemical oxygen demand (COD) by using a boron-doped diamond (BDD) electrode. Environ. Sci. Technol. 2009, 43, 1935–1939. [Google Scholar]
- Silva, C.R.; Conceição, C.D.; Bonifácio, V.G.; Filho, O.F.; Teixeira, M.F. Determination of the chemical oxygen demand (COD) using a copper electrode: A clean alternative method. J. Solid. State. Electr. 2009, 13, 665–669. [Google Scholar]
- Li, J.Q.; Zheng, L.; Li, L.P.; Shi, G.Y.; Xian, Y.Z.; Jin, L.T. Photoelectro–synergistic catalysis at Ti/TiO2/PbO2 electrode and its application on determination of chemical oxygen demand. Electroanalysis 2006, 18, 2251–2256. [Google Scholar]
- Grimes, C.A. Synthesis and application of highly ordered arrays of TiO2 nanotubes. J. Mater. Chem. 2007, 17, 1451–1457. [Google Scholar]
- Zheng, Q.; Zhou, B.X.; Bai, J.; Li, L.H.; Jin, Z.J.; Zhang, J.L.; Li, J.H.; Liu, Y.B.; Cai, W.M.; Zhu, X.Y. Self–organized TiO2 nanotube array sensor for the determination of chemical oxygen demand. Adv. Mater. 2008, 20, 1044–1049. [Google Scholar]
- Tatsuma, T.; Saitoh, S.; Ohko, Y.; Fujishima, A. TiO2-WO3 photoelectrochemical anticorrosion system with an energy storage ability. Chem. Mater. 2001, 13, 2838–2842. [Google Scholar]
- Chen, Q.P.; Li, J.H.; Zhou, B.X.; Long, M.C.; Chen, H.C.; Liu, Y.B.; Cai, W.M.; Shangguan, W.F. Preparation of well-aligned WO3 nanoflake arrays vertically grown on tungsten substrate as photoanode for photoelectrochemical water splitting. Electrochem. Commun. 2012, 20, 153–156. [Google Scholar]
- Chen, Q.P.; Li, J.H.; Zhou, B.X.; Cai, W.M.; Shangguan, W.F.; Li, X.J.; Huang, K. Visible-light responsive photocatalytic fuel cell based on WO3/W photoanode and Cu2O/Cu photocathode for simultaneous wastewater treatment and electricity generation. Environ. Sci. Technol. 2012, 46, 11451–11458. [Google Scholar]
- Robertson, P.K. Semiconductor photocatalysis: An environmentally acceptable alternative production technique and effluent treatment process. J. Clean. Prod. 1996, 4, 203–212. [Google Scholar]


| No. | PeCOD (mg·L−1) | RD (%) | No. | PeCOD (mg·L−1) | RD (%) |
|---|---|---|---|---|---|
| 1 | 43.30 | 3.10 | 6 | 42.07 | 1.66 |
| 2 | 41.84 | −0.37 | 7 | 40.31 | −4.01 |
| 3 | 41.71 | −0.69 | 8 | 40.97 | −2.46 |
| 4 | 43.54 | 3.67 | 9 | 40.66 | −3.20 |
| 5 | 44.04 | 4.86 | 10 | 43.88 | 4.49 |
© 2014 by the authors; licensee MDPI, Basel, Switzerland. This article is an open access article distributed under the terms and conditions of the Creative Commons Attribution license ( http://creativecommons.org/licenses/by/3.0/).
Share and Cite
Li, X.; Bai, J.; Liu, Q.; Li, J.; Zhou, B. WO3/W Nanopores Sensor for Chemical Oxygen Demand (COD) Determination under Visible Light. Sensors 2014, 14, 10680-10690. https://doi.org/10.3390/s140610680
Li X, Bai J, Liu Q, Li J, Zhou B. WO3/W Nanopores Sensor for Chemical Oxygen Demand (COD) Determination under Visible Light. Sensors. 2014; 14(6):10680-10690. https://doi.org/10.3390/s140610680
Chicago/Turabian StyleLi, Xuejin, Jing Bai, Qiang Liu, Jianyong Li, and Baoxue Zhou. 2014. "WO3/W Nanopores Sensor for Chemical Oxygen Demand (COD) Determination under Visible Light" Sensors 14, no. 6: 10680-10690. https://doi.org/10.3390/s140610680