The Theory and Fundamentals of Bioimpedance Analysis in Clinical Status Monitoring and Diagnosis of Diseases


Abstract
: Bioimpedance analysis is a noninvasive, low cost and a commonly used approach for body composition measurements and assessment of clinical condition. There are a variety of methods applied for interpretation of measured bioimpedance data and a wide range of utilizations of bioimpedance in body composition estimation and evaluation of clinical status. This paper reviews the main concepts of bioimpedance measurement techniques including the frequency based, the allocation based, bioimpedance vector analysis and the real time bioimpedance analysis systems. Commonly used prediction equations for body composition assessment and influence of anthropometric measurements, gender, ethnic groups, postures, measurements protocols and electrode artifacts in estimated values are also discussed. In addition, this paper also contributes to the deliberations of bioimpedance analysis assessment of abnormal loss in lean body mass and unbalanced shift in body fluids and to the summary of diagnostic usage in different kinds of conditions such as cardiac, pulmonary, renal, and neural and infection diseases.1. Introduction
Bioimpedance analysis is a broadly applied approach used in body composition measurements and healthcare assessment systems. The essential fundamentals of bioimpedance measurement in the human body and a variety of methods are used to interpret the obtained information. In addition there is a wide spectrum of utilization of bioimpedance in healthcare facilities such as disease prognosis and monitoring of body vital status. Thus, with such a broad utilization, we feel that this warrants a review of the most fundamental aspects and healthcare applications of bioimpedance analysis.
Studies on the electrical properties of biological tissues have been going on since the late 18th century [1]. Thomasset [2] explored the utilization of bioimpedance measurement in total body water estimation using needle electrodes. Nyboer [3] applied quad surface electrode readings for bioimpedance measurements to estimate the fat free mass of the human body. Hoffer [4] introduced the association between total body impedance and total body water content in reference to tritium dilution techniques.
The electrical properties of biological tissues are currently categorized based on the source of the electricity, i.e., active and passive response. Active response (bioelectricity) occurs when biological tissue provokes electricity from ionic activities inside cells, as in electrocardiograph (ECG) signals from the heart and electroencephalograph (EEG) signals from the brain. Passive response occurs when biological tissues are simulated through an external electrical current source [5]. Bioimpedance or biological impedance is defined as the ability of biological tissue to impede electric current [6].
Due to the noninvasiveness, the low cost and the portability of bioimpedance analysis systems, numerous researchers have conducted studies on bioimpedance analysis and its applications in body composition estimation and evaluation of clinical conditions. Recently, Mialich et al. [7] reviewed the applications of bioimpedance analysis in body composition assessment and monitoring of chronic diseases with a comprehensive listing of the most used equations, however, recent techniques such as real time multi-sine bioimpedance analysis and bioimpedance vector analysis methods were not discussed. Lukaski [8] has revised the conceptual modules of bioimpedance analysis for physiological activities assessment and diseases prognosis. The study states that the applied multiple regression approaches and physical modules in bioimpedance analysis have limited utilization in individuals' measurement. This paper is a review of the basic fundamentals and the applications of bioimpedance analysis. The first section highlights the main bioimpedance measurement approaches using single frequency, multiple frequencies and broadband frequency spectrum signals, in addition to applied bioimpedance measurements method across the whole body, through body segments and other alternative analysis method such as vector bioimpedance analysis and real time bioimpedance methods. Body composition parameters, which include lean mass and fluid volumes estimation using bioimpedance measurements, are discussed in the second section. Basic factors in bioimpedance measurements, including anthropometric measurements, age, race, protocols and postures, and shape and artifacts of electrode are discussed in the third section. Finally, applications of bioimpedance analysis in diseases prognosis and clinical monitoring systems are outlined in the fourth section.
2. Fundamentals of Bioimpedance Measurement Techniques
Impedance (Z), from an electrical point of view, is the obstruction to the flow of an alternating current and, hence, is dependent on the frequency of the applied current, defined in impedance magnitude (|Z|) and phase angle (φ) as shown in Equations (1)–(3) [9]. Bioimpedance is a complex quantity composed of resistance (R) which is caused by total body water and reactance (Xc) that is caused by the capacitance of the cell membrane [5]:
Resistance of an object is determined by a shape, that is described as length (L) and surface area (A), and material type, that is described by resistivity (ρ), as shown in Equation (4), [9]. Reactance (Xc) of an object as shown in Equation (5), is defined as resistance to voltage variation across the object and is inversely related with signal frequency (f) and capacitance (C) [9]. In biological systems resistance is caused by total water across the body, and reactance occurs due to the capacitance of the cell membrane [5,10]:
Capacitance (C) is defined as the ability of the non-conducting object to save electrical charges, that is equal to the ratio between differentiation in voltage across object (dV/dt) and current that is passed through the object (I(t)), as shown in Equation (7). In the parallel capacitor module, capacitance is in direct proportion to the surface area (A) in meters square and inversely proportional to distance (d) in meters between the charged plates, and is dependent on the permittivity constant of vacuum (ε0 ≈ 8.854 × 10⁻¹² F·m−1) and the relative dielectric permittivity constant (εr) that is defined based on the material between the plates (for a vacuum space, εr = 1), as shown in Equation (6) [9]:
Body composition estimation using bioimpedance measurements is based on determination of body volume (Vb) through the basic means of resistance measurement. From Equation (4) that gives the relation between resistance and ratio of length (L) to surface area (A), body volume (Vb) can be obtained by substituting the surface area (A) with the numerator and denominator of the length (L), as in Equation (8):
The human body as a volume is composed generally of fat mass (FM) which is considered as a non-conductor of electric charge and is equal to the difference between body weight (WtBody) and fat free mass (FFM), as shown in Equation (9); and FFM, which is considered as the conducting volume that helps the passing of electric current due to conductivity of electrolytes dissolved in body water. Studies show that water, known as total body water (TBW) is the major compound of FFM and is equal to 73.2% in normal hydration subjects, as in Equation (10) [11]:
In bioimpedance measurements, the human body is divided into five inhomogeneous segments, two for upper limbs, two for lower limbs and one for the trunk. In the five compartment module, the human body is composed of FM and FFM which consists of bone minerals and body cell mass (BCM) that include protein and total body water that consists of extracellular fluid (ECF) and intracellular fluid (ICF) [5]. Figure 1, shows the five segments and compartments of human body.
Most of the known prediction methods rely on the relation between water volume and the ratio between square length to resistance (L2/R) [12], however the alternation in anatomical and anthropometric features of the whole human body and segments cause variations in estimated volumes. Jaffrin and Morel reviewed that most TBW estimation equations between 1985 and 1994 were based on values predicted using the H2/R50 that was introduced by Kyle et al. [13,14] and Houtkouper et al. [15].
Measurement of bioimpedance is obtained from the whole body and body segments separately, using single frequency, multiple frequencies and bioimpedance spectroscopy analysis. In addition to several alternative assessments method such as bioimpedance vector analysis and real time bioimpedance analysis.
2.1. Single Frequency Bioimpedance Analysis (SF-BIA)
Analysis of bioimpedance information obtained at 50 KHz electric current is known as single-frequency bioimpedance analysis (SF-BIA). SF-BIA is the most used and is one of the earliest proposed methods for the estimation of body compartments, It is based on the inverse proportion between assessed impedance and TBW, that represents the conductive path of the electric current [5,16].
SF-BIA predicts the volume of TBW that is composed of fluctuating percentages of extra cellular fluid (ECF) which is almost equal to 75% of TBW, and ICF that represent the rest [5]. SF-BIA instruments have been used to assess TBW and FFM using the derived Equations (2) and (3), respectively, for normal hydrated subjects, although SF-BIA is not valid for body conditions with significantly altered hydration [17]. Studies by Hanai [18] on mixture theory report that body tissue conductivity is diverse [5], and SF-BIA shows limitations in ICF variance prediction, however many of studies show an acceptable correlation in ICF estimation [19].
2.2. Multiple Frequency Bioimpedance Analysis (MF-BIA)
Analysis of bioimpedance that is obtained at more than two frequencies is known as multiple-frequency bioimpedance analysis (MF-BIA). MF-BIA is based on the finding that the ECF and TBW can be assessed by exposing it to low and high frequency electric currents, respectively. Thomasset [2] has proposed TBW and ECF estimation using 100 and 1 kHz based on the Cole model [20]. However, in later years, Jaffrin et al. [21] stated that technically a bioimpedance analyzer should use frequency range between 5–1000 kHz. Simpson et al. [22] state that low frequency in MF-BIA is generally less than 20 KHz and high frequency is more than 50 KHz. Hannan et al. [23] report that parameters measured using a frequency of less than 5 KHz and more than 200 KHz fluctuate around the actual value and conclude that estimated TBW is more accurate using the MF-BIA than the BIS method with the same predicted values of ECF for both methods. Patel et al. [24] reported that in diseased subjects, TBW prediction using SF-BIA gave more precise results than MF-BIA. In general, the MF-BIA method predicts ECF more precisely than the SF-BIA method; however in elderly diseased subjects the MF-BIA method shows less sensitivity in detecting fluid shifts between ECF and ICF [19].
2.3. Bioimpedance Spectroscopy (BIS)
Analysis of bioimpedance data obtained using a broad band of frequencies is known as bioimpedance spectroscopy (BIS). The BIS method is based on the determination of resistance at zero frequency (R0) and resistance at infinity frequency (Rinf) that is then used to predict ECF and TBW, respectively. The use of 100 and 1 kHz, respectively, was earlier proposed by Thomasset [25] who applied the basics of Hanai's mixture theory [18] and Cole's module [26,27] as explained by the Cole-Cole plot (Figure 2), however it is complicated to directly measure these values because of the relaxation phenomena of living tissue [20].
Reference methods for estimating TBW are based on radioisotopic dilution of deuterium, and for ECF estimation they are based on the dilution of bromide [28] and for ICF they are based on the radioactive potassium isotope, 40K, both elements which are readily diffused in the human body [29,30]. Reference techniques are invasive, expensive and complicated when compared to bioimpedance methods, although the precision is dependent on the electrical module and body parameter variation [21].
Estimation of TBW, ECF and ICF using BIS techniques can be performed using either an equation modules approach [10,31–33] or an analytically derived equations approach [27]. Hanai's mixture theory shows limitations in some studies [14,15,34], however it showed advantages in other studies [35,36]. Ward et al. [37] stated that the differences in biological construction among subjects may limit mixture theory as noted in some studies [38,39]. Scharfetter et al. [40] report that an accurate module for body fluid allocation and trusted fitting methods are most crucial factors in the BIS method.
The determination of Cole module parameters (R0, Rinf, α, Fc), in Figure 2 is done using the BIS method which is based on the argument that the human body is composed of a mixture containing conducting and non-conducting compartments [18].
In Equation (4), the reference method is based on the assumption that the measured resistance (R) represents the total conducting volume of the lean body mass. However in the BIS method, the measured resistance represents the total conducting and non-conducting part of the lean body mass, so that the non-conducting part is included by multiplying the obtained resistance by body shape factor (Kb) and substituting the surface area (A) by body volume (Vb). Ayllon et al. [41] reports that the estimation of Cole module parameters (R0, Rinf, α, Fc) that is obtained by using only resistance achieves slightly better results and there is less standard error based on the Non-Linear Least Squares technique as compared to the capacitive and impedance complex components. Ward et al. [42] concludes that the Cole parameters can be obtained by using four selected frequencies and substituting a fitting technique based on amplitude impedance values at these frequencies:
2.4. Whole Body Bioimpedance Measurement
Measurement of total body bioimpedance is the most commonly used method for estimating whole body compartments. Many of the whole body bioimpedance instruments apply three approaches for impedance measurement: hand to foot method [14,17], foot to foot [44–46] method and hand to hand method [47,48]. The hand to foot (Figure 3a) one is the most commonly used method. It was introduced by Hoofer [4] and later revised by Nyboer [3] to decrease the contact impedance between skin and electrodes, and validated by Lukaski [17] in 140 normal adults. Tetrapolar hand to foot measurements are performed on a supine subject for 15 min, placing electrodes filled with gel to minimize gap impedance on the dorsal surfaces of the right hand and foot, distal (current) ones being respectively proximal to the metacarpal and metatarsal phalangeal joints, in accordance with standard tetrapolar electrode placement [49]. Foot to foot measurements (Figure 3b) were introduced by Nuñez et al. [50] through the use of a pressure-contact foot-pad electrode. In leg to leg bioimpedance measurements, the subject stands vertically, with uncovered feet, on four stainless steel footpads electrodes and divided for each foot into frontal and back portion for current injecting and voltage measurement [46]. Hand to hand bioimpedance measurements were introduced by Ghosh et al. [48] by performing body composition analyses using a handheld impedance meter in subjects with malnutrition. The device was held while both arms were stretched out horizontally in front of the body. Deurenberg et al. [47] validated the hand to hand method on 298 Singaporean subjects and reported that readings obtained using a handheld impedance meter were significantly acceptable for those subjects.
2.5. Body Segment Bioimpedance Measurement
Segmental bioimpedance analysis achieves better estimation of skeletal muscle mass (SMM) than whole body bioimpedance analysis, with a reported standard error of 6.1% in reference to MRI measurements among 30 male subjects [51]. Baumgartner et al. [52] stated that multi-frequency segmental bioimpedance analysis enhances and elucidates the relationship between bioimpedance analysis and body compartment estimation after examining the impact of phase angle on body composition prediction among 116 normal subjects.
Segmental bioimpedance analysis detects the fluctuation in ECF due to differences in posture and is more precise than the ankle foot method [53], and gives a better estimation of TBW than total body measurements with reference to dilution method [54].
Segmental or perpendicular bioimpedance analysis defines the measurement method of body segments that is mostly treated as five cylinders as in Figure 1 [5], and was introduced to overcome the disagreement between trunk resistance to upper limbs ratio and trunk resistance to lower limbs ratio of 0.72 and 0.66 respectively [52]; Earthman et al. stated that the trunk represents 50% of the body mass [55]. Kyle et al. pointed out that total bioimpedance measurement assesses mainly the upper and lower limb compartments, and shows some limitation to predict water compartments of the trunk [13].
Measurement of segmental bioimpedance can be achieved through four types of protocols. The first approach, as suggested by Scheltinga et al. [56], uses dual current injection electrodes on the proximal area of the right forearm and lower leg, and quad voltage electrodes placed on the right proximal forearm, shoulder, upper thigh and lower leg (Figure 4a). The second approach is suggested by Zhu et al. [57], through the sum of segments technique, that uses dual current injection electrodes on the right wrist and foot, and quad voltage electrodes placed on the right wrist, shoulder, upper iliac spine and foot (Figure 4b). A third approach was presented by Organ et al. [58], who suggested the use of dual current injection electrodes on the right wrist and foot, and quad voltage electrodes, two placed on the right wrist and foot, and two on the left wrist and foot (Figure 4c). The fourth approach as suggested by Jaffrin et al. [16,59,60], is through the use of quad current injection electrodes located on the right and left wrist and foot, and quad voltage electrodes located at the same place (Figure 4d).
Limitations of whole body bioimpedance measurement in evaluating body segment compartments have given rise to the demand for segment localized bioimpedance analysis applications. Scharfetter et al. [40], reported that using segmental (across the waist) localized bioimpedance analysis can significantly estimate abdominal fat with a correlation coefficient of R2 = 0.99; furthermore Seward et al. [61], introduced localized bioimpedance analysis as a trending diagnostic tool for neuromuscular disorders. The study was applied on 25 neuromuscular patients and 45 normal subjects for control.
Studies report that the segmental bioimpedance analysis method shows some limitations in the estimation of FFM [62,63], with estimation power not significantly different from whole body bioimpedance method [44]. However, Kyle et al. [13] concluded that enhancement can be achieved through applying the MF-BIA method and further studies on electrode types and allocation.
2.6. Alternative Bioimpedance Analysis Method
Bioimpedance analysis, as an independent method for the assessment of the human health status from absolute bioimpedance measurements, has triggered a new path of data analysis and interpretation. The bioimpedance vector analysis method (BIVA) is a novel approach established essentially by Piccoli et al. [64,65] to estimate the hydration status using height indexed resistance and reactance data (R-Xc graph) from bioimpedance measurements. Using 8,022 normal subjects (3796 female and 4226 male) Piccoli et al. [66] formulated 50%, 75%, and 95% tolerance ellipses that determine increasing and decreasing body mass if the minor vector falls in the left and right half of the 50% ellipse, along with increasing and decreasing hydration ratio if the major vector falls in the lower and upper half of the 50% ellipse (Figure 5).
Evaluation study of the BIVA method by Cox-Reijven et al. [67], on 70 diseased subjects with gastrointestinal disorders, conclude the high specificity and low sensitivity of BIVA method in classifying patients with extraordinarily rates of body fluids. Low values (Xc/H < 27.7 O/m and R/H < 563.6 O/m) in the BIVA method can be considered as predictors of severity among diseased children, as shown in a study conducted on 332 precarious pediatric patients with multiple organ dysfunction (MODS), acute respiratory distress syndrome (ARDS) and acute lung injury (ALI) [68].
In [69] the BIVA method successfully monitored rapid increases in ECF during short term recovery (3 weeks) and a dramatic increase in BCM during long term recovery (3 months) among 47% of 57 diseased women with anorexia nervosa [5].
The BIVA method is also considered as a valid tool for the estimation of dry weight in 24 haemodialysis patients' with reference to the Bilbrey Index based on different allocation of values before and after obtrusion [70].
Kyle et al. reported that the BIVA method is affected by differences in biological factors and measurement artifacts [5]. Ward and Heithmann state that BIVA is affected by body size and influenced by the cross-sectional area of the body [71].
A specific BIVA method has been proposed by Marini et al. [72] to neutralize the bias due to body size. The specific BIVA method used a resistivity-reactivity graph that is constructed using information and results collected from multiplication of resistance and reactance by ratio of cross section area and length (L/A) from Ohm's law (Equation (1)). The cross section area (A) and length (L) were estimated as follows: A = (0.45(arm area) + 0.45(calf area) + 0.10(waist area)) in square meter [73,74], where segment area = c2/4π and (c) is the circumference in meter of the arm, waist and calf, respectively; L = 1.1 (Ht), where Ht is body height in meters.
Another alternative method for analysis is real time processing of bioimpedance data which is currently introduced as a key feature for body health monitoring applications. A logarithmic analysis carried out between 0.01 and 10 Hz with five frequencies needs 276 s to be completed, this includes the calculation time [75]. Sanchez et al. [76] stated that real time processing, accuracy and the ability of data retrieval and throughput of a BIS system were the most important features to be applied in health monitoring systems, and Sanchez et al. [77] introduced a local polynomial based method for impedance-frequency-response estimation. Comparison studies between four different multi-sine periodic broadband excitations broadband for EIS measurements in term of accuracy and speed in frequency and time domain concluded that multi-sine and discrete interval binary sequences (DIBS) enhance SNRZ and have better accuracy than chirp and maximum length binary sequences (MLBS) [75].
Use of multi-sine excitation signals in bioimpedance measurements that is proposed in [78,79] helped increase the accuracy of the measured bioimpedance parameters. It has been validated using a set of optimal multi-sine measurements on 2R-1C equivalent electrical circuits, then applied on healthy myocardium tissue. The multi-sine excitation method was introduced as a parametric-in-time identification method for electrical bioimpedance measurements with inclusion of harmonic impedance spectra (HIS). HIS directly identified from noisy current and voltage myocardium measurements at the multi-sine measurement frequencies to express periodic changes of impedance, rather than the commonly used method that assumed the measurement changing over time [80].
3. Body Composition Prediction Using Bioimpedance Analysis
Body composition assessment is considered a key factor for the evaluation of general health status of humans. Several methods use different assumptions to estimate body composition based on the number of compartments. This review considers that the human body is composed of two main compartments, FM and body lean mass or FFM. FFM is composed of bone minerals and body cell mass (BCM) that includes skeletal muscle mass (SMM). BCM contains proteins and TBW that represents 73% of lean mass in normal hydrated subjects. TBW is composed of ICF and ECF as illustrated in Figure 1. In this section, several predictive equations for both lean and fat mass, in addition to body fluids, will be discussed.
3.1. Fat Mass (FM) and Fat Free Mass (FFM)
FM and FFM estimations are considered one of the main objectives of body composition assessment techniques. Variations in FM among the reference population are due to several factors, but are believed to follow aging factors in addition to gradual changes in lifestyle [81].
Anthropometric and skin fold thickness measurements are traditional, simple and inexpensive methods for body fat estimation to assess the size of specific subcutaneous fat depots [82] compared with other methods such as underwater weighing, dilution method and dual-energy x-ray absorptiometry [DXA] that requires a trained practitioner to perform it.
Bioimpedance analysis has been shown in recent studies to be more precise for determining lean or fat mass in humans [83]. In comparison with BMI, anthropometric and skin fold methods, BIA offers trustable results in the estimation of fatness across human tissues [84]. Several studies conducted to establish reference values for FFM are based on bioimpedance measurements.
Kyle et al. [13] developed a single Equation (12) for the prediction of FFM, using 343 normal subjects aged from 22 to 94 years old, with body mass indexes between 17.0 and 33.8 kg/m2 in reference to DXA method:
In [81,85], FFM was assessed in a population of 5,225 white subjects aged from 15 to 98 years old using bioimpedance measurements and it was concluded that mean FFM was 8.9 kg or 14.8% lower in men older than 85 years than in men 35 to 44 years old and 6.2 kg or 14.3% lower in women older than 85 years than in women 45 to 54 years old.
Sun et al. [86], used a multi-component model based on densitometry, isotope dilution, and dual-energy X-ray absorptiometry to build Equations (13) and (14) for FFM estimation:
The mean FFM prediction equations achieved a correlation coefficient R2 = 0.90 and 0.83 and root mean square errors of 3.9 and 2.9 kg for males and females, respectively.
Deurenberg et al. [87], used densitometry, anthropometry and bioelectrical impedance to formulate FFM prediction Equation (15) using 661 normal adult subjects aged from 7 to 83 years old:
The FFM prediction equations achieved a correlation coefficient R2 = 0.93 and standard estimation error (SEE) = 2.63 kg.
Pichard et al. [88], assessed FFM and FM in a 3,393 white subject population aged from 15 to 64 years old using bioimpedance measurements and performed a comparison of %FM as determined by BIA with %FM determined by calculations using BMI developed by Deurenberg et al. [89], and concluded that the mean FFM ranged of 59.1–61.0 kg for men and 43.3–44.1 kg for women which is 38% greater in men.
Heitmann [90] compared three body composition methods (BMI, skin folds and BIA) using 139 healthy subjects aged from 35 to 65 years old:
The multiple regression Equation (16) for impedance had a higher correlation coefficient (R2 = 0.89) and lower standard estimation error (SEE = 3.32 kg) than the multiple regression equations for skin fold (R2 = 0.81, SEE = 3.91 kg) or body mass index (R2 = 0.85, SEE = 3.94 kg).
Heitmann [88] assessed FFM and FM in 2987 out of a 3608 subject Danish population aged from 35 to 65 years old. The obtained data, which are estimated from measurements of electrical impedance, concluded that men have a FM of 4.5 kg, an increase by 30%, when compared to women that have a 6.9 kg increase of 36% for evaluated sample.
Recently, Pichler et al. [91] assessed FM in 116 subjects (32 healthy subjects and 84 patients) and concluded that the following prediction equation overestimated FM by 6.55 ± 3.86 kg:
3.2. Body Fluids
Body fluid is the total volume of fluids inside a human body that represents the majority of the FFM volume percentage. TBW includes the fluids inside the cellular mass that is known as ICF; and the fluid located outside the cell body which is composed of plasma and interstitial fluid which is known as ECF. ECF and ICF fluids that are incorporated under TBW, contain several ion types with different concentrations, however the main ions in ECF are Na+ and Cl−, and for ICF are K+ and PO−4 [92].
Body fluids estimation using bioimpedance measurements are based on the inversely proportional between body resistance and the total amount of body water [93]. There are varieties of methods for estimating body fluid volumes based on bioimpedance analysis approach.
Sun et al. [86] developed prediction Equations (19) and (20) of the TBW reference to dilution method using SF-BIA from a multi-ethnic pool of 1830 people aged from 12 to 94 years old:
The developed equation achieved a correlation coefficient (R2) and mean square error equal to 0.84 and 3.8 L in men, and 0.79 and 2.6 L in women.
For ECF and ICF estimation using SF-BIA, a few studies performed were based on measurement of bioimpedance in 50 KHz frequency, Sergi et al. [94], predict ECF using two frequencies (1 and 50 KHz):
After measurements performed using bioimpedance and bromide dilution methods on 40 subjects (19 males and 21 females) aged 21–81 years, of which 22 were healthy subjects, 12 were affected by chronic heart failure and 6 by chronic renal failure, the best estimation results at 1 KHz achieved a correlation coefficient (R2) and standard estimation error equal to 0.89 and 1.7 L.
Due to incomplete conduction of the intracellular fluid at 50 kHz [2], MF-BIA was proposed to increase accuracy of estimation of TBW, ECF and ICF. Deurenberg et al. [95] used MF-BIA (1, 5, 50, 100 KHz) to predict TBW using Z100KHz and Z50KHz; and ECF using Z1KHz and Z5KHz among 139 normal adult subjects with reference to deuterium oxide dilution and bromide dilution:
The prediction equation of TBW achieved a correlation coefficient (R2) and standard error of estimate (SEE) equal to 0.95 and 1.73 L using Z100KHz, and 0.95 and 1.74 L using Z50KHz:
The prediction equation of ECF achieved a correlation coefficient (R2) and standard error of estimate (SEE) equal to 0.87 and 0.98 L using Z1KHz, and 0.86 and 1.02 L using Z5KHz.
Prediction of body fluids using the BIS method in three steps involves firstly determination using the values of Re from R0 and Rinf, secondly, inclusion of the body shape factor Kb due to the variation of body segments, and thirdly, inclusion of apparent resistivity ρa instead of the general resistivity ρ as stated by Hanai in mixture theory [18]:
At low frequencies the current will pass through extracellular fluids only without intracellular fluid due to the high capacitance of cell membranes [96]. In that case the conducting volume is equal to the ratio between ECF volume (Vecf) and TBW volume (Vb). The volume fraction of non-conducting tissues at low frequencies calculated as in Equation (29):
Based on the mixture theory [18], apparent resistivity (ρa) at low frequency represents the extracellular fluid resistivity (ρAecf), thus the resistance of ECF (Recf) can be recalculated in Equation (31), by substituting Equation (29) in Equation (28) and including the outcome of apparent resistivity (ρaecf) from Equation (30):
Hanai [18], calculated ρecf to be equal to 40.3 Ω ·cm for men and 42.3 Ω ·cm for women, which is close to that achieved by saline, and is about 40 Ω ·cm t for the ECF composed of plasma and interstitial water [49].
To reform the equation to evaluate the variance in ECF volume (Vecf) caused by changes in estimated ECF resistance (Recf), that is achieved by replacing body volume (Vb), that is equal to the ratio between body weight (Wt) in Kg and body density (Db) in Kg/L from Equation (32) in Equation (33):
Body factor (Kb), extracellular fluid resistivity (ρaecf) and body density (Db) are constant values that can be included in one factor defined as extracellular fluid factor (Ke) as in Equation (34), and for extracellular fluid volume (Vecf) as in Equation (35):
Van Loan et al. [43], calculated Ke using the bromide dilution method to be equal 0.306 for men and 0.316 for women; and the ratio between ρicf and ρecf to be equal to 3.82 for men and 3.40 for women. De Lorenzo et al. [10] calculated Ke to be equal to 0.229 in women; and ρecf to be equal to 40.5 Ω ·cm and 39.0 Ω ·cm for men and women, respectively; and the ratio between ρicf and ρecf to be equal to 6.76 for men and 6.79 for women.
Ellis and Wong [30], analyzed the BIS method as introduced by Van Loan et al. [43], with reference to the H2O and Br dilution technique in 469 multi-ethnic healthy subjects. The study suggested that the ratio between ρicf and ρecf is equal to 3.032 for men and 2.694 for women, due to underestimation of TBW caused by misprediction of ICF measurements. Biasing factors and different regression module approaches caused slight differences in the ratios obtained by these researchers [30].
Moissl et al. [97], suggested a body composition spectroscopy method through recalculating Kecf , using different assumptions through inclusion of body mass index (BMI) and taking the module of non-conducting tissue factor (c) in Equation (14) as a valid assumption, as in Equation (36), and then determining the (Vecf) using the same equation as Equation (20):
From [97], (a) and (b) were calculated to be equal to 0.188 and 0.2883 based on measurements using the Br dilution method as a reference method on dialyzed patients and 120 healthy subjects. At high frequencies, the current will pass through the whole TBW which is composed of ECF and ICF [96], so the conducting volume is equal to the ratio between TBW and total body volume.
Jaffrin et al. [31] suggested calculating the TBW directly from Rinf using the same assumption of mixture theory [96], and assuming uniformity of water compartments inside human body. Thus, using the same assumption as in Equation (29), the volume fraction of non-conducting tissue (c) at high frequencies can be calculated using Equation (37):
To determine the apparent resistivity of total body water (ρa_tbw) from actual total body water resistivity (ρtbw), the parameters in (c) from Equation (37), was included into Equation (38):
By replacing the actual resistivity by apparent resistivity for total body water in Equation (11), and restoring the value of (Vb) from Equation (32), Equation (40) to determine the total body water factor (Ktbw) and total body water volume (Vtbw) is recalculated by using Equation (39):
Considering that total body water is equal to the accumulation of ECF and ICF, Jaffrin et al. [31] calculated ρtbw to be equal to 104.3 Ω ·cm in men and 100.5 Ω ·cm. A validation study conducted in 28 dialysed patients [31], concluded that ρtbw was equal to 108.1 Ω·cm in men and 100.2 Ω·cm, which predicted 91% of mean water loss when compared with 39% for Cole method [43], but overestimated TBW compared to the original BIS method in 21 healthy subjects with the same ρtbw and hydration rate values.
For ICF prediction using a BIS method, Matthie et al. [32] introduced a second generation mixture theory to overcome the limitations of the first generation in predicting intracellular fluid volume (Vicf) using a new assumption for TBW resistivity (ρtbw), as in Equation (32):
In the second version of mixture theory, total body water volume is considered to be equal to the summation of ECF and ICF, for ECF estimation, the relation in Equation (35) is considered as a valid method, and for ICF estimation, the method uses Equation (42); note that the ratio (Rtbw/Recf) is opposite and proportional to (Vtbw/Vecf):
Moissl et al. [97] calculated ρicf to be equal to 273.9 Ω·cm and ρecf = 40.5 Ω·cm in men and 264.9 Ω·cm and 39.0 Ω·cm, respectively in women. De Lorenzo et al. [10] suggest the formula in Equation (34) to determine intracellular volume (Vicf):
Jaffrin and Morel [21] claim that the prediction of ECF by Hanai [18] mixture theory is valid and direct, however the ICF prediction by De Lorenzo et al. [10], who state that the determination of Ri is less accurate than for Re in parallel module because it sums up the errors on Re and Rinf, is not.
Moissl et al. [97] introduced a different method for calculation of intracellular fluid volume (Vicf), taking into consideration that the non-conducting tissue factor (c) is as given in Equation (44):
Then the recalculated intracellular fluid factor (Kicf) and intracellular fluid volume (Vicf) are added as in Equations (45) and (46), respectively, and it is concluded that total body water factor (Ktbw) and total body water volume (Vtbw) is equal to the summation of ECF and ICF volumes as in Equation (47) and recalculated (Vtbw) using different assumption of (Ktbw) and (ρtbw) from Jaffrin et al. [31], and Matthie et al. [32], as given in Equations (48) and (49):
Fenech and Jaffrin [2] state that ECF prediction using segmental bioimpedance analysis in supine position (0.79 liter) is less than Watson anthropomorphic method [3] (1.12 liter) and for ICF is reduced by 3.4% for segmental bioimpedance and 3.8% for the Watson anthropomorphic method [3]:
Pichler et al. [91] examined the BIS method using an Impedimed device (SFB7) in TBW, ECF and FFM with reference to the deuterium space method, sodium bromide space method and DXA method, respectively. The study was applied on 32 healthy subjects and 84 patients with different types of diseases (congestive heart failure, coronary heart disease, essential hypertension, atherosclerosis, kidney disease, chronic renal failure, gastrointestinal diseases, type II diabetes, morbid obesity, osteoporosis, cancer, chronic polyarthritis and anorexia nervosa):
Pichler's equations for TBW achieved a correlation coefficient 0.91 and 0.89 for men and women, respectively, as in Equations (51) and (52). For ECF it achieved 0.87 and 0.89 for men and women, respectively, as in Equations (53) and (54) [91]. Hanai mixture equations [18], when applied in SFB7 give ECF measurements higher than the sodium bromide space method by mean ± SD (0.93 ± 2.62 Liter) however it is noted that the Hanai mixture equations applied in SFB7 detect ECF excess in 9 patients, and TBW measurements higher than the deuterium space method by mean ± SD (3.82 ± 3.37 Liter), and FFM measurements lower than the DXA method by mean ± SD (6.55 ± 3.86 kg).
4. Bioimpedance Measurement Biasing Factors
4.1. Anthropometric Measurements
Anthropometric measurements such as weight, height, skin fold thickness, lengths, diameters and circumferences that involves mathematical modules are the main contributors in the estimation of body compartments [5,99].
Bioimpedance parameters only without body dimension measurements are considered poor estimators for body composition [91,100]. Diaz et al. [101] concluded that in FM and FFM prediction, resistance and capacitance measurements contribute by 0%–20%. In contrast, the percentages increase to 11%–53% after height inclusion, and 22%–68% after inclusion of Ht2/R ratio.
Ward et al. [102] presented a validation study to predict BCM and ECF as a portion of TBW without measuring height and using BIA device, the Soft Tissue Analyzer STATM (Akern Sri, Florence, Italy) with a correlation coefficient referenced to the total body potassium counting method is equal to 0.91, 0.82 and 0.89, and a standard estimation error equal of 5.6 kg, 6.3 kg and 1.3 kg for FFM, BCM and ECF, respectively.
4.2. Gender
Variations in body composition between male and female were proven in several studies [103]. In body composition prediction, methods based on bioimpedance analysis, and most equations tend to include gender as one of the main determining factors for body compartment assessment [13,86,87].
FFM or lean mass studies show that males have greater FFM than females with different ranges. Kyle et al. [81] state that mean FFM for male is 8.9 kg and 6.2 kg for female and fat mass index FMI increases based on age, in females from 5.6 to 9.4 and from 3.7 to 7.4 in males. In a recent study [104] on 1649 healthy children-adults (6–18 years) and 925 adult-elders (19–92 years) using BIA and DXA it was concluded that for all age ranges, males have less fat mass and more fat free mass than females.
TBW averaged 73.2% of fat free mass in the healthy population; however several studies show that males have less TBW than females [11]. Sun et al. [86], stated that in a mixed ethnic groups prediction equation, TBW volume for males start from 1.2 L compared with 3.75 L for females. Jaffrin et al. [31] state that determined TBW resistivity (ρ) is on average 104.3 ± 7.9 Ω·cm for men and 100.5 ± 7.8 Ω·cm for women. The values are smaller in men are due to their larger limb cross section.
Due to the different body composition between males and females, gender considerations have a strong impact in estimating body compartments.
4.3. Age
Aging is defined as a multi-factor changing in the physical and biological activities of the human body that leads to differences in body composition among age groups. When the human body becomes older it leads to a gradual increase in fat mass and spontaneous decrease in lean mass. Fat free mass to fat mass ratio increases gradually in response to increase of age, and a noticeable increment in average weight is seen among the elder population compared with adults associated with increment in fat mass [81]. In some studies [58], the general body composition prediction equations were unsatisfactory in elderly men over 75 years of age, especially in TBW estimation.
Several studies were conducted using the BIA method on children [68,105] adults [13], and elders [106,107]. In children, the BIA method using the Deurenberg equation [87], underestimates body fat as determined by DXA. It however achieved a better correlation than the skin fold method [108]. Muscle mass loss among the elderly reduces the fat free mass at a certain age, followed by decreases in total body water and bone mass [109]. Marja et al. [107] reported that in 75-year-old Swedes, average fat free mass index was 15.6 and 18.3; and body fat index was 11.0 and 8.6 for women and men, respectively, compared to the DXA method.
4.4. Ethnic Groups
Body composition varies among different races and ethnic groups due to the environment, nutrition factors, culture and anthropometric measurements that include body conformation [110]. There is also difference in limb length [111], body structure [112], body size [89] and that lead to variation in body fat percentages among different ethnic groups which may lead to prediction errors (3%) [111].
The majority of bioimpedance measurement studies have been done on Caucasian subjects [5], Kotler et al. [113] and Sun et al. [86] have included African American and Hispanic subjects in their studies. Kim et al. assessed the segmental lean mass among Koreans [106], Schulz et al. assessed the fat free mass among Germans and compared it to the American and Swiss population [114]. Siváková et al. studied the clinical applications of BIVA on Slovaks [115]. Nigam et al. had performed a comparative study among two different Indian races [116], whereas Saragat et al. obtained specific BIVA reference values for the Italian healthy elderly population in order to construct the specific tolerance ellipses to be used for reference purposes for assessing body composition in gerontological practice and for epidemiological purposes [117]. Validation of bioimpedance measurements among different ethnicities is thus needed due to differences in body composition among certain populations.
4.5. Measurements Protocols and Posture
Simplicity and the economic acceptance of bioimpedance analysis method for body composition estimation have increased the need to unify the protocols and procedures of bioimpedance measurements in order to retrieve robust data.
For the foot to ankle measurement method, bioimpedance measurements performed in a supine position with abduction of the upper limbs to 30 degrees and lower limbs to 45 degrees for 5 to 10 min. studies show that when the posture changes from a standing to a supine body position, the ECV decreased in the arms by 2.51% and legs by 3.02%, but increased in the trunk by 3.2% [118]. Fasting for at least 8 hours and bladder voiding before measurements are recommended as consumption of food and beverages may decrease impedance by 4–15 O over a 2–4 h period after meals and that causes an error (<3%) [84,119,120]. Body anthropometric measurements should be retrieved prior of the test and for scale or foot to foot bioimpedance analyzer weight retrieved automatically [1].
Electrodes should be placed on the pre-cleaned metacarpal and metatarsal phalangeal joints with a distance in between of at least 5 cm without skin lesions at the location of the electrodes. In some studies skin temperature should be counted [84,120]. Subjects under test should not perform any exercise activities before measurements that could lead to errors in assessed resistance and reactance equal to 3% and 8% respectively [121]. Roos et al. concluded that the error in total body water prediction range from 1 to 1.5 L figured out after laying at rest for one hour [122].
4.6. Electrode Shape and Measurement Error
In bioimpedance analysis, the geometrical structure of electrode has a strong impact on elementary data retrieved during the measurement process. In bioimpedance analysis electrodes are defined as isoelectric materials with a negligible voltage drop along the connectors. The minimum numbers of electrodes required to perform the bioimpedance measurements are two, one for current injection with the assumption of zero potential difference and the other for collecting the voltage drop with a negligible current flow and is more affected by position.
The tetrapolar electrode approach become widely used for whole bioimpedance measurements because of the uniformity of current distribution compared to monopolar electrodes [6], and the usage of more than two potential collecting electrodes or octapolar electrode method were used for segmental bioimpedance studies to assess compartments in different body segments [73].
Ag-AgCl electrodes are now used in most bioimpedance measurements because it has a well-defined DC potential with electrolyte gel to minimize the gap impedance between skin and electrodes. Circular and rectangular electrode shapes with a contact area greater than 4 cm2 are the most commonly used shapes [1].
Buendía et al. investigated the impact of electrode discrepancy on BIS measurements and concluded that mismatched potential electrode causes 4% overestimated measurements in resistance at zero and infinite frequency because of an imbalanced electrical field distribution [123]. Shiffman [124] addressed the artifacts caused by inaccurate distance between electrodes in four electrode measurement methods performed on a 17.5 cm segment of the thigh area. That study reported that the values of resistance and reactance were four times larger when the current injecting electrodes were placed 2.5 cm from the sensing electrodes. Scharfetter et al. stated that capacitance between different body segments and earth, and capacitance between the signal ground of the device and earth cause a significant false dispersion in the measured impedance spectra at frequencies >500 kHz [125].
Errors in bioimpedance measurements are caused by many factors such as motion, miss-positioning, connector length and fabrication errors. Moreover, the diversity of the commercially available bioimpedance analyzers cause a wide range of fluctuations in measurements between the devices. Thus the calibration of the components inside a bioimpedance analyzer such as signal generator, sensing apparatus, scales of weight and height and electrical interference should be conducted to ensure the reliability of the bioimpedance analyzers [1].
5. Applications of Bioimpedance Analysis in Clinical Status Monitoring and Diagnosis of Diseases
Bioimpedance analysis in healthcare practice contributes to the estimation of body compartments to assess the regular change in nutrition status in in-patients and to monitor nutritional risk in out-patients [126]. Most of the body composition assessment methods like BMI techniques, skin fold method and underwater weight measurements is used to estimate fat mass and fat free mass, however bioimpedance analysis can estimate FM and FFM in addition to total and particular body fluids which is very helpful for disease prognosis [127]. The National Health and Nutrition Examination Survey program in United States included bioimpedance analysis in the third NHANES program between 1999 and 2004 to assess the health and nutritional status of adults and children because of a general frustration with the dependability of the skin fold thickness method to estimate FM and FFM, especially in subjects with higher amount of segmented fat [128].
Observation of body compartment fluctuations like fat free mass, fat mass and total body water from normal limits are considered as key factors to be used in bioimpedance analysis in healthcare applications. Abnormal loss in lean body mass and unbalanced shifts in body fluids are the most measured parameters to be used to assess the healthiness of the human body. Analysis of bioimpedance parameters has bern used in several studies to estimate and analyze the changes in disorders of different kind of diseases.
Norman et al. [70] stated that phase angle is an essential predictor of clinical status. Pichler et al. [91] stated that estimation of body fluids using BIS was slightly better than anthropometric methods among healthy and diseased.
Table 1 contains some of the applications of bioimpedance analysis in disease diagnosis that are organized according to the organ systems of human body, diseases or abnormalities diagnosed based on bioimpedance parameters, and comments on how these factors are applied to determine the health condition. Bioimpedance analysis is a common method used for estimating body composition among healthy and diseased subjects in research and clinical trials. This review has focused on the theoretical and the fundamentals of bioimpedance analysis. Thus it may have some limitations, where possible important studies on the applications of bioimpedance analysis in diagnostic of diseases and the related shifts in bioimpedance parameters may have been missed.
6. Conclusions
Increasing demands for accurate, cost effective and non-invasive systems for clinical status monitoring and diagnosis of diseases in healthcare, has accelerated the research endeavors to provide new methods and technologies to evaluate the health condition of human body. Body composition assessment tools has been considered a promising approach for the quantitative measurement of tissues characteristic over time, in addition to direct relativity between fluctuations in body composition equivalences and survival rate, clinical condition, illness and quality of life. Bioimpedance analysis is a growing method for body compartments estimation in nutrition studies, sport medicine and evaluation of hydration rate, fat mass and fat free mass between healthy and diseased populations. Fat mass, fat free mass including skeletal muscle mass, bone minerals, and total body water, which is composed of intercellular fluid and extracellular fluid, are compartments that can be predicted and analyzed using suitable bioimpedance measurements techniques, procedures and population, age, ethnic groups or disease-dedicated bioimpedance analysis equations. Further studies are needed to evaluate the correlations between variations in bioimpedance parameters, especially in ECF and ICF, and the deviation from health to disease.
Acknowledgments
This research is supported by UM High Impact Research Grant UM-MOHE UM.C/625/1/HIR/MOHE/05 from the Ministry of Higher Education Malaysia, Fundamental Research Grant Scheme (FRGS: FP042-2013B) and University of Malaya Research Grant (UMRG: RP009C-13AET).
Author Contributions All authors contributed extensively to the work presented in this paper.
Conflict of Interest
The authors declare no conflict of interest.
References
- Kyle, U.G.; Bosaeus, I.; De Lorenzo, A.D.; Deurenberg, P.; Elia, M.; Manuel Gómez, J.; Lilienthal Heitmann, B.; Kent-Smith, L.; Melchior, J.-C.; Pirlich, M. Bioelectrical impedance analysis—Part ii: Utilization in clinical practice. Clin. Nutr. 2004, 23, 1430–1453. [Google Scholar]
- Thomasset, A. Bio-electrical properties of tissue impedance measurements. Lyon Med. 1962, 207, 107–118. [Google Scholar]
- Nyboer, J. Electrical Impedance Plethysmograph, 2nd ed.; Thomas, C., Ed.; Thomas publishers: Springfield, IL, USA, 1970. [Google Scholar]
- Hoffer, E.C.; Meador, C.K.; Simpson, D.C. Correlation of whole-body impedance with total body water volume. J. Appl. Physiol. 1969, 27, 531–534. [Google Scholar]
- Kyle, U.G.; Bosaeus, I.; De Lorenzo, A.D.; Deurenberg, P.; Elia, M.; Gómez, J.M.; Heitmann, B.L.; Kent-Smith, L.; Melchior, J.-C.; Pirlich, M. Bioelectrical impedance analysis—Part i: Review of principles and methods. Clin. Nutr. 2004, 23, 1226–1243. [Google Scholar]
- Martinsen, O.G.; Grimnes, S. Bioimpedance and Bioelectricity Basics; Academic Press: Waltham, MA, USA, 2011. [Google Scholar]
- Mialich, M.S.; Sicchieri, J.M.F.; Junior, A.A.J. Analysis of body composition: A critical review of the use of bioelectrical impedance analysis. Int. J. Clin. Nutr. 2014, 2, 1–10. [Google Scholar]
- Lukaski, H. Evolution of bioimpedance: A circuitous journey from estimation of physiological function to assessment of body composition and a return to clinical research. Eur. J. Clin. Nutr. 2013, 67, S2–S9. [Google Scholar]
- Kasap, S.O. Principles of Electrical Engineering Materials and Devices; McGraw-Hill: New York, City, NY, USA, 1997. [Google Scholar]
- De Lorenzo, A.; Andreoli, A.; Matthie, J.; Withers, P. Predicting body cell mass with bioimpedance by using theoretical methods: A technological review. J. Appl. Physiol. 1997, 82, 1542–1558. [Google Scholar]
- Genton, L.; Hans, D.; Kyle, U.G.; Pichard, C. Dual-energy x-ray absorptiometry and body composition: Differences between devices and comparison with reference methods. Nutrition 2002, 18, 66–70. [Google Scholar]
- Thomas, B.; Ward, L.; Cornish, B. Bioimpedance spectrometry in the determination of body water compartments: Accuracy and clinical significance. Appl. Radiat. Isot. 1998, 49, 447–455. [Google Scholar]
- Kyle, U.G.; Genton, L.; Karsegard, L.; Slosman, D.O.; Pichard, C. Single prediction equation for bioelectrical impedance analysis in adults aged 20–94 years. Nutrition 2001, 17, 248–253. [Google Scholar]
- Gudivaka, R.; Schoeller, D.; Kushner, R.; Bolt, M. Single-and multifrequency models for bioelectrical impedance analysis of body water compartments. J. Appl. Physiol. 1999, 87, 1087–1096. [Google Scholar]
- Chertow, G.M.; Lazarus, J.M.; Lew, N.L.; Ma, L.; Lowrie, E.G. Development of a population-specific regression equation to estimate total body water in hemodialysis patients. Kidney Int. 1997, 51, 1578–1582. [Google Scholar]
- Ward, L.C.; Dyer, J.M.; Byrne, N.M.; Sharpe, K.K.; Hills, A.P. Validation of a three-frequency bioimpedance spectroscopic method for body composition analysis. Nutrition 2007, 23, 657–664. [Google Scholar]
- Lukaski, H.C.; Bolonchuk, W.W.; Hall, C.B.; Siders, W.A. Validation of tetrapolar bioelectrical impedance method to assess human body composition. J. Appl. Physiol. 1986, 60, 1327–1332. [Google Scholar]
- Hanai, T. Electrical properties of emulsions. Kolloid-Zeitschrift 1961, 177, 57–61. [Google Scholar]
- Olde, R.M.; Deurenberg, P.; Jansen, R.; Van't Hof, M.; Hoefnagels, W. Validation of multi-frequency bioelectrical impedance analysis in detecting changes in fluid balance of geriatric patients. J. Am. Geriatr. Soc. 1997, 45, 1345–1351. [Google Scholar]
- Woodrow, G.; Oldroyd, B.; Turney, J.; Davies, P.; Day, J.; Smith, M. Measurement of total body water by bioelectrical impedance in chronic renal failure. Eur. J. Clin. Nutr. 1996, 50, 676–681. [Google Scholar]
- Jaffrin, M.Y.; Morel, H. Body fluid volumes measurements by impedance: A review of bioimpedance spectroscopy (bis) and bioimpedance analysis (bia) methods. Med. Eng. Phys. 2008, 30, 1257–1269. [Google Scholar]
- Simpson, J.; Lobo, D.; Anderson, J.; Macdonald, I.; Perkins, A.; Neal, K.; Allison, S.; Rowlands, B. Body water compartment measurements: A comparison of bioelectrical impedance analysis with tritium and sodium bromide dilution techniques. Clin. Nutr. 2001, 20, 339–343. [Google Scholar]
- Pierson, R.; Wang, J.; Colt, E.; Neumann, P. Body composition measurements in normal man: The potassium, sodium, sulfate and tritium spaces in 58 adults. J. Chronic Dis. 1982, 35, 419–428. [Google Scholar]
- Patel, R.V.; Peterson, E.L.; Silverman, N.; Zarowitz, B.J. Estimation of total body and extracellular water in post-coronary artery bypass graft surgical patients using single and multiple frequency bioimpedance. Crit. Care Med. 1996, 24, 1824–1828. [Google Scholar]
- Thomasset, A. Bio-electrical properties of tissues. Lyon Med. 1963, 209, 1325–1352. [Google Scholar]
- Cole, K.S.; Cole, R.H. Dispersion and absorption in dielectrics i. Alternating current characteristics. J. Chem. Phys. 1941, 9, 341–351. [Google Scholar]
- Cornish, B.; Ward, L.; Thomas, B.; Jebb, S.; Elia, M. Evaluation of multiple frequency bioelectrical impedance and cole-cole analysis for the assessment of body water volumes in healthy humans. Eur. J. Clin. Nutr. 1996, 50, 159–164. [Google Scholar]
- Pastan, S.; Gassensmith, C. Total body water measured by bioelectrical impedance in patients after hemodialysis: Comparison with urea kinetics. ASAIO J. 1992, 38, M186–M189. [Google Scholar]
- Scanferla, F.; Landini, S.; Fracasso, A.; Morachiello, P.; Righetto, F.; Toffoletto, P.; Bazzato, G. On-line bioelectric impedance during haemodialysis: Monitoring of body fluids and cell membrane status. Nephrol. Dial Transplant. 1990, 5, 167–170. [Google Scholar]
- Ellis, K.J.; Wong, W.W. Human hydrometry: Comparison of multifrequency bioelectrical impedance with 2H2O and bromine dilution. J. Appl. Physiol. 1998, 85, 1056–1062. [Google Scholar]
- Jaffrin, M.Y.; Fenech, M.; Moreno, M.V.; Kieffer, R. Total body water measurement by a modification of the bioimpedance spectroscopy method. Med. Biol. Eng. Comput. 2006, 44, 873–882. [Google Scholar]
- Matthie, J.R. Second generation mixture theory equation for estimating intracellular water using bioimpedance spectroscopy. J. Appl. Physiol. 2005, 99, 780–781. [Google Scholar]
- Matthie, J.; Zarowitz, B.; De Lorenzo, A.; Andreoli, A.; Katzarski, K.; Pan, G.; Withers, P. Analytic assessment of the various bioimpedance methods used to estimate body water. J. Appl.Physiol. 1998, 84, 1801–1816. [Google Scholar]
- Baarends, E.; Van Marken Lichtenbelt, W.; Wouters, E.; Schols, A. Body-water compartments measured by bio-electrical impedance spectroscopy in patients with chronic obstructive pulmonary disease. Clin. Nutr. 1998, 17, 15–22. [Google Scholar]
- Cox-Reijven, P.; Soeters, P. Validation of bio-impedance spectroscopy: Effects of degree of obesity and ways of calculating volumes from measured resistance values. Int. J. Obes. 2000, 24, 271–280. [Google Scholar]
- Earthman, C.P.; Matthie, J.R.; Reid, P.M.; Harper, I.T.; Ravussin, E.; Howell, W.H. A comparison of bioimpedance methods for detection of body cell mass change in hiv infection. J. Appl. Physiol. 2000, 88, 944–956. [Google Scholar]
- Ward, L.; Elia, M.; Cornish, B. Potential errors in the application of mixture theory to multifrequency bioelectrical impedance analysis. Physiol. Meas. 1998, 19, 53–60. [Google Scholar]
- Hannan, W.; Cowen, S.; Plester, C.; Fearon, K.; DeBeau, A. Comparison of bieimpedance spectroscopy and mu it if requency biei m pedance analysis for the assessment of extracellular and total body water in surgical patients. Clin. Sci. 1995, 89, 651–658. [Google Scholar]
- Deurenberg, P.; Andreoli, A.; De Lorenzo, A. Multi-frequency bioelectrical impedance: A comparison between the cole-cole modelling and hanai equations with the classical impedance index approach. Ann. Hum. Biol. 1996, 23, 31–40. [Google Scholar]
- Scharfetter, H.; Monif, M.; Laszlo, Z.; Lambauer, T.; Hutten, H.; Hinghofer-Szalkay, H. Effect of postural changes on the reliability of volume estimations from bioimpedance spectroscopy data. Kidney Int. 1997, 51, 1078–1087. [Google Scholar]
- Ayllon, D.; Seoane, F.; Gil-Pita, R. Cole equation and parameter estimation from electrical bioimpedance spectroscopy measurements-a comparative study. Proceedings of Annual International Conference of the IEEE Engineering in Medicine and Biology Society (EMBC 2009), Minneapolis, MN, USA, 3–6 September 2009; pp. 3779–3782.
- Ward, L.C.; Essex, T.; Cornish, B.H. Determination of cole parameters in multiple frequency bioelectrical impedance analysis using only the measurement of impedances. Physiol. Meas. 2006, 27, 839–950. [Google Scholar]
- Cole, K.S. Membranes, Ions, and Impulses: A Chapter of Classical Biophysics; University of California Press: Oakland, CA, USA, 1968; Volume 1. [Google Scholar]
- Xie, X.; Kolthoff, N.; Bärenholt, O.; Nielsen, S. Validation of a leg-to-leg bioimpedance analysis system in assessing body composition in postmenopausal women. Int. J. Obes. 1999, 23, 1079–1084. [Google Scholar]
- Jebb, S.A.; Cole, T.J.; Doman, D.; Murgatroyd, P.R.; Prentice, A.M. Evaluation of the novel tanita body-fat analyser to measure body composition by comparison with a four-compartment model. Br. J. Nutr. 2000, 83, 115–122. [Google Scholar]
- Utter, A.C.; Nieman, D.C.; Ward, A.N.; Butterworth, D.E. Use of the leg-to-leg bioelectrical impedance method in assessing body-composition change in obese women. Am. J. Clin. Nutr. 1999, 69, 603–607. [Google Scholar]
- Deurenberg, P.; Deurenberg‐Yap, M. Validation of skinfold thickness and hand‐held impedance measurements for estimation of body fat percentage among singaporean chinese, malay and indian subjects. Asia Pac. J. Clin. Nutr. 2002, 11, 1–7. [Google Scholar]
- Ghosh, S.; Meister, D.; Cowen, S.; Hannan, J.W.; Ferguson, A. Body composition at the bedside. Eur. J. Gastroenterol. Hepatol. 1997, 9, 783–788. [Google Scholar]
- Buchholz, A.C.; Bartok, C.; Schoeller, D.A. The validity of bioelectrical impedance models in clinical populations. Nutr. Clin. Pract. 2004, 19, 433–446. [Google Scholar]
- Nuñez, C.; Gallagher, D.; Visser, M.; Pi-Sunyer, F.X.; Wang, Z.; Heymsfield, S.B. Bioimpedance analysis: Evaluation of leg-to-leg system based on pressure contact footpad electrodes. Med. Sci. Sports Exerc. 1997, 29, 524–531. [Google Scholar]
- Tanaka, N.I.; Miyatani, M.; Masuo, Y.; Fukunaga, T.; Kanehisa, H. Applicability of a segmental bioelectrical impedance analysis for predicting the whole body skeletal muscle volume. J. Appl. Physiol. 2007, 103, 1688–1695. [Google Scholar]
- Baumgartner, R.N.; Chumlea, W.C.; Roche, A.F. Bioelectric impedance phase angle and body composition. Am. J. Clin. Nutr. 1988, 48, 16–23. [Google Scholar]
- Thomas, B.; Cornish, B.; Ward, L.; Patterson, M. A comparison of segmental and wrist-to-ankle methodologies of bioimpedance analysis. Appl. Radiat. Isot. 1998, 49, 477–478. [Google Scholar]
- Thomas, B.; Cornish, B.; Pattemore, M.; Jacobs, M.; Ward, L. A comparison of the whole-body and segmental methodologies of bioimpedance analysis. Acta Diabetol. 2003, 40, s236–s237. [Google Scholar]
- Earthman, C.; Traughber, D.; Dobratz, J.; Howell, W. Bioimpedance spectroscopy for clinical assessment of fluid distribution and body cell mass. Nutr. Clin. Pract. 2007, 22, 389–405. [Google Scholar]
- Moon, J. Body composition in athletes and sports nutrition: An examination of the bioimpedance analysis technique. Eur. J. Clin. Nutr. 2013, 67, S54–S59. [Google Scholar]
- Fogelholm, M.; van Marken, L.W. Comparison of body composition methods: A literature analysis. Eur. J. Clin. Nutr. 1997, 51, 495–503. [Google Scholar]
- Fuller, N.; Sawyer, M.; Laskey, M.; Paxton, P.; Elia, M. Prediction of body composition in elderly men over 75 years of age. Ann. Hum. Biol. 1996, 23, 127–147. [Google Scholar]
- Chumlea, W.; Schubert, C.; Sun, S.; Demerath, E.; Towne, B.; Siervogel, R. A review of body water status and the effects of age and body fatness in children and adults. J. Nutr. Health Aging 2007, 11, 111–118. [Google Scholar]
- Coppini, L.Z.; Waitzberg, D.L.; Campos, A.C.L. Limitations and validation of bioelectrical impedance analysis in morbidly obese patients. Curr. Opin Clin. Nutr. Metab. Care 2005, 8, 329–332. [Google Scholar]
- Rutkove, S.B.; Aaron, R.; Shiffman, C.A. Localized bioimpedance analysis in the evaluation of neuromuscular disease. Muscle Nerve 2002, 25, 390–397. [Google Scholar]
- Jaffrin, M.Y. Body composition determination by bioimpedance: An update. Curr. Opin. Clin. Nutr. Metab. Care 2009, 12, 482–486. [Google Scholar]
- Thomas, B.; Cornish, B.; Ward, L. Bioelectrical impedance analysis for measurement of body fluid volumes: A review. J. Clin. Eng. 1992, 17, 505–510. [Google Scholar]
- Piccoli, A.; Piazza, P.; Noventa, D.; Pillon, L.; Zaccaria, M. A new method for monitoring hydration at high altitude by bioimpedance analysis. Med. Sci. Sports Exerc. 1996, 28, 1517–1522. [Google Scholar]
- Piccoli, A.; Rossi, B.; Pillon, L.; Bucciante, G. A new method for monitoring body fluid variation by bioimpedance analysis: The rxc graph. Kidney Int. 1994, 46, 534–539. [Google Scholar]
- Piccoli, A.; Pillon, L.; Dumler, F. Impedance vector distribution by sex, race, body mass index, and age in the united states: Standard reference intervals as bivariate scores. Nutrition 2002, 18, 153–167. [Google Scholar]
- Cox-Reijven, P.L.; van Kreel, B.; Soeters, P.B. Bioelectrical impedance measurements in patients with gastrointestinal disease: Validation of the spectrum approach and a comparison of different methods for screening for nutritional depletion. Am. J. Clin. Nutr. 2003, 78, 1111–1119. [Google Scholar]
- Azevedo, Z.M.A.; Moore, D.C.B.C.; de Matos, F.A.A.; Fonseca, V.M.; Peixoto, M.V.M.; Gaspar-Elsas, M.I.C.; Santinoni, E.; dos Anjos, L.A.; Ramos, E.G. Bioelectrical impedance parameters in critically ill children: Importance of reactance and resistance. Clin. Nutr. 2013, 32, 824–829. [Google Scholar]
- Haas, V.; Riedl, A.; Hofmann, T.; Nischan, A.; Burghardt, R.; Boschmann, M.; Klapp, B. Bioimpedance and bioimpedance vector analysis in patients with anorexia nervosa. Eur. Eat. Disord. Rev. 2012, 20, 400–405. [Google Scholar]
- Norman, K.; Stobäus, N.; Pirlich, M.; Bosy-Westphal, A. Bioelectrical phase angle and impedance vector analysis–clinical relevance and applicability of impedance parameters. Clin. Nutr. 2012, 31, 854–861. [Google Scholar]
- Ward, L.C.; Heitmann, B.L. Re: “Electrical maturation trajectory of human tissues identified by bioelectrical impedance vector analysis”. Nutrition 2000, 16, 319–320. [Google Scholar]
- Marini, E.; Sergi, G.; Succa, V.; Saragat, B.; Sarti, S.; Coin, A.; Manzato, E.; Buffa, R. Efficacy of specific bioelectrical impedance vector analysis (biva) for assessing body composition in the elderly. J. Nutr. Health Aging 2013, 17, 515–521. [Google Scholar]
- Bracco, D.; Thiébaud, D.; Chioléro, R.L.; Landry, M.; Burckhardt, P.; Schutz, Y. Segmental body composition assessed by bioelectrical impedance analysis and dexa in humans. J. Appl. Physiol. 1996, 81, 2580–2587. [Google Scholar]
- Yanovski, S.Z.; Hubbard, V.S.; Heymsfield, S.B.; Lukaski, H.C. Bioelectrical impedance analysis in body composition measurement: National institutes of health technology assessment conference statement. Am. J. Clin. Nutr. 1996, 64, 524S–532S. [Google Scholar]
- Sanchez, B.; Vandersteen, G.; Bragos, R.; Schoukens, J. Basics of broadband impedance spectroscopy measurements using periodic excitations. Meas. Sci. Technol. 2012, 23. [Google Scholar] [CrossRef]
- Sanchez, B.; Bandarenka, A.S.; Vandersteen, G.; Schoukens, J.; Bragos, R. Novel approach of processing electrical bioimpedance data using differential impedance analysis. Med. Eng. Phys. 2013, 35, 1349–1357. [Google Scholar]
- Sanchez, B.; Schoukens, J.; Bragos, R.; Vandersteen, G. Novel estimation of the electrical bioimpedance using the local polynomial method. Application to in vivo real-time myocardium tissue impedance characterization during the cardiac cycle. IEEE Trans. Biomed. Eng. 2011, 58, 3376–3385. [Google Scholar]
- Sanchez, B.; Vandersteen, G.; Bragos, R.; Schoukens, J. Optimal multisine excitation design for broadband electrical impedance spectroscopy. Med. Eng. Phys. 2011, 22. [Google Scholar] [CrossRef]
- Sanchez, B.; Rojas, C.R.; Vandersteen, G.; Bragos, R.; Schoukens, J. On the calculation of the d-optimal multisine excitation power spectrum for broadband impedance spectroscopy measurements. Med. Eng. Phys. 2012, 23. [Google Scholar] [CrossRef]
- Sanchez, B.; Louarroudi, E.; Jorge, E.; Cinca, J.; Bragos, R.; Pintelon, R. A new measuring and identification approach for time-varying bioimpedance using multisine electrical impedance spectroscopy. Physiol. Meas. 2013, 34, 339–357. [Google Scholar]
- Kyle, U.G.; Genton, L.; Slosman, D.O.; Pichard, C. Fat-free and fat mass percentiles in 5225 healthy subjects aged 15 to 98 years. Nutrition 2001, 17, 534–541. [Google Scholar]
- Roubenoff, R.; Dallal, G.E.; Wilson, P. Predicting body fatness: The body mass index vs. estimation by bioelectrical impedance. Am. J. Public Health 1995, 85, 726–728. [Google Scholar]
- Kyle, U.G.; Pichard, C. Dynamic assessment of fat-free mass during catabolism and recovery. Curr. Opin. Clin. Nutr. Metab. Care 2000, 3, 317–322. [Google Scholar]
- Heitmann, B. Impedance: A valid method in assessment of body composition? Eur. J. Clin. Nutr. 1994, 48, 228–248. [Google Scholar]
- Kyle, U.G.; Schutz, Y.; Dupertuis, Y.M.; Pichard, C. Body composition interpretation: Contributions of the fat-free mass index and the body fat mass index. Nutrition 2003, 19, 597–604. [Google Scholar]
- Sun, S.S.; Chumlea, W.C.; Heymsfield, S.B.; Lukaski, H.C.; Schoeller, D.; Friedl, K.; Kuczmarski, R.J.; Flegal, K.M.; Johnson, C.L.; Hubbard, V.S. Development of bioelectrical impedance analysis prediction equations for body composition with the use of a multicomponent model for use in epidemiologic surveys. Am. J. Clin. Nutr. 2003, 77, 331–340. [Google Scholar]
- Deurenberg, P.; Van der Kooy, K.; Leenen, R.; Weststrate, J.; Seidell, J. Sex and age specific prediction formulas for estimating body composition from bioelectrical impedance: A cross-validation study. Int. J. Obes. 1991, 15, 17–25. [Google Scholar]
- Pichard, C.; Kyle, U.G.; Bracco, D.; Slosman, D.O.; Morabia, A.; Schutz, Y. Reference values of fat-free and fat masses by bioelectrical impedance analysis in 3393 healthy subjects. Nutrition 2000, 16, 245–254. [Google Scholar]
- Deurenberg, P.; Weststrate, J.A.; Seidell, J.C. Body mass index as a measure of body fatness: Age-and sex-specific prediction formulas. Br. J. Nutr. 1991, 65, 105–114. [Google Scholar]
- Heitmann, B.L. Evaluation of body fat estimated from body mass index, skinfolds and impedance. A comparative study. Eur. J. Clin. Nutr. 1990, 44, 831–837. [Google Scholar]
- Pichler, G.P.; Amouzadeh-Ghadikolai, O.; Leis, A.; Skrabal, F. A critical analysis of whole body bioimpedance spectroscopy (BIS) for the estimation of body compartments in health and disease. Med. Eng. Phys. 2013, 35, 616–625. [Google Scholar]
- Sargent, J.A.; Gotch, F.A. Principles and biophysics of dialysis. In Replacement of Renal Function by Dialysis; Springer: Dordrecht, The Netherlands, 1989; pp. 87–143. [Google Scholar]
- Lukaski, H.C.; Johnson, P.E.; Bolonchuk, W.; Lykken, G. Assessment of fat-free mass using bioelectrical impedance measurements of the human body. Am. J. Clin. Nutr. 1985, 41, 810–817. [Google Scholar]
- Sergi, G.; Bussolotto, M.; Perini, P.; Calliari, I.; Giantin, V.; Ceccon, A.; Scanferla, F.; Bressan, M.; Moschini, G.; Enzi, G. Accuracy of bioelectrical impedance analysis in estimation of extracellular space in healthy subjects and in fluid retention states. Ann. Nutr. Metab. 1994, 38, 158–165. [Google Scholar]
- Deurenberg, P.; Tagliabue, A.; Schouten, F.J. Multi-frequency impedance for the prediction of extracellular water and total body water. Br. J. Nutr. 1995, 73, 349–358. [Google Scholar]
- Schloerb, P.R.; Friis-Hansen, B.J.; Edelman, I.S.; Solomon, A.; Moore, F.D. The measurement of total body water in the human subject by deuterium oxide dilution: With a consideration of the dynamics of deuterium distribution 1. J. Clin. Investig. 1950, 29, 1296–1310. [Google Scholar]
- Moissl, U.M.; Wabel, P.; Chamney, P.W.; Bosaeus, I.; Levin, N.W.; Bosy-Westphal, A.; Korth, O.; Müller, M.J.; Ellegård, L.; Malmros, V. Body fluid volume determination via body composition spectroscopy in health and disease. Physiol. Meas. 2006, 27, 921–933. [Google Scholar]
- Wagner, D.R.; Heyward, V.H. Techniques of body composition assessment: A review of laboratory and field methods. Res. Q. Exerc. Sport 1999, 70, 135–149. [Google Scholar]
- Serrano, M.D.M.; de Espinosa, M.G.-M.; Zamorano, E.M. Relationship between physical measures of anthropometry and bioimpedance measures. In Handbook of Anthropometry; Springer: New York City, NY, USA, 2012; pp. 459–473. [Google Scholar]
- Jaffrin, M.Y.; Bousbiat, S.; Dongmo, E. A comparison between two methods for measuring limb resistances with wrist and ankle electrodes. Med. Eng. Phys. 2011, 33, 943–949. [Google Scholar]
- Diaz, E.; Villar, J.; Immink, M.; Gonzales, T. Bioimpedance or anthropometry? Eur. J. Clin. Nutr. 1989, 43, 129–137. [Google Scholar]
- Ward, L.; Heitmann, B. Assessment of body composition by bioelectrical impedance analysis without the need for measurement of height. Clin. Nutr. 2001, 20, 21–26. [Google Scholar]
- Mridha, S. A comparative study on body composition of male and female national level sub-junior volleyball players. Br. J. Sports Med. 2010, 44, i37–i38. [Google Scholar]
- Kirchengast, S. Gender differences in body composition from childhood to old age: An evolutionary point of view. J. Life Sci. 2010, 2, 1–10. [Google Scholar]
- Fomon, S.J.; Haschke, F.; Ziegler, E.E.; Nelson, S.E. Body composition of reference children from birth to age 10 years. Am. J. Clin. Nutr. 1982, 35, 1169–1175. [Google Scholar]
- Kim, J.H.; Choi, S.H.; Lim, S.; Kim, K.W.; Lim, J.Y.; Cho, N.H.; Park, K.S.; Jang, H.C. Assessment of appendicular skeletal muscle mass by bioimpedance in older community-dwelling korean adults. Arch Gerontol. Geriatr. 2014, 58, 303–307. [Google Scholar]
- Tengvall, M.; Ellegård, L.; Malmros, V.; Bosaeus, N.; Lissner, L.; Bosaeus, I. Body composition in the elderly: Reference values and bioelectrical impedance spectroscopy to predict total body skeletal muscle mass. Clin. Nutr. 2009, 28, 52–58. [Google Scholar]
- Eisenmann, J.C.; Heelan, K.A.; Welk, G.J. Assessing body composition among 3‐ to 8‐year‐old children: Anthropometry, bia, and dxa. Obes. Res. 2004, 12, 1633–1640. [Google Scholar]
- Buffa, R.; Floris, G.U.; Putzu, P.F.; Marini, E. Body composition variations in ageing. Coll. Antropol. 2011, 35, 259–265. [Google Scholar]
- Deurenberg, P.; Deurenberg-Yap, M.; Schouten, F. Validity of total and segmental impedance measurements for prediction of body composition across ethnic population groups. Eur. J. Clin. Nutr. 2002, 56, 214–220. [Google Scholar]
- Deurenberg, P.; Deurenberg-Yap, M. Validity of body composition methods across ethnic population groups. Acta Diabetol. 2003, 40, s246–s249. [Google Scholar]
- Deurenberg, P.; Wolde-Gebriel, Z.; Schouten, F. Validity of predicted total body water and extracellular water using multifrequency bioelectrical impedance in an ethiopian population. Ann. Nutr. Metab. 1995, 39, 234–241. [Google Scholar]
- Kotler, D.P.; Burastero, S.; Wang, J.; Pierson, R. Prediction of body cell mass, fat-free mass, and total body water with bioelectrical impedance analysis: Effects of race, sex, and disease. Am. J. Clin. Nutr. 1996, 64, 489S–497S. [Google Scholar]
- Schulz, H.; Teske, D.; Penven, D.; Tomczak, J. Fat-free mass from two prediction equations for bioelectrical impedance analysis in a large german population compared with values in swiss and american adults: Reasons for a biadata project. Nutrition 2006, 22, 973–975. [Google Scholar]
- Siváková, D.; Vondrová, D.; Valkovič, P.; Cvíčelová, M.; Danková, Z.; Luptáková, L. Bioelectrical impedance vector analysis (biva) in slovak population: Application in a clinical sample. Cent. Eur. J. Biol. 2013, 8, 1094–1101. [Google Scholar]
- Nigam, P.; Misra, A.; Colles, S.L. Comparison of dexa-derived body fat measurement to two race-specific bioelectrical impedance equations in healthy indians. Diabetes Metab. Syndr. 2013, 7, 72–77. [Google Scholar]
- Saragat, B.; Buffa, R.; Mereu, E.; De Rui, M.; Coin, A.; Sergi, G.; Marini, E. Specific bioelectrical impedance vector reference values for assessing body composition in the italian elderly. Exp. Gerontol. 2014, 50, 52–56. [Google Scholar]
- Zhu, F.; Schneditz, D.; Wang, E.; Levin, N.W. Dynamics of segmental extracellular volumes during changes in body position by bioimpedance analysis. J. Appl. Physiol. 1998, 85, 497–504. [Google Scholar]
- Schols, A.; Dingemans, A.; Soeters, P.; Wouters, E. Within-day variation of bioelectrical resistance measurements in patients with chronic obstructive pulmonary disease. Clin. Nutr. 1990, 9, 266–271. [Google Scholar]
- Kushner, R.F.; Gudivaka, R.; Schoeller, D.A. Clinical characteristics influencing bioelectrical impedance analysis measurements. Am. J. Clin. Nutr. 1996, 64, 423S–427S. [Google Scholar]
- Liang, M.; Norris, S. Effects of skin blood flow and temperature on bioelectric impedance after exercise. Med. Sci. Sports Exerc. 1993, 25, 1231–1239. [Google Scholar]
- Roos, A.; Westendorp, R.; Frölich, M.; Meinders, A. Tetrapolar body impedance is influenced by body posture and plasma sodium concentration. Eur. J. Clin. Nutr. 1992, 46, 53–60. [Google Scholar]
- Buendía, R.; Bogónez-Franco, P.; Nescolarde, L.; Seoane, F. Influence of electrode mismatch on cole parameter estimation from total right side electrical bioimpedance spectroscopy measurements. Med. Eng. Phys. 2012, 34, 1024–1028. [Google Scholar]
- Shiffman, C. Adverse effects of near current-electrode placement in non-invasive bio-impedance measurements. Physiol. Meas. 2013, 34, 1513–1545. [Google Scholar]
- Scharfetter, H.; Hartinger, P.; Hinghofer-Szalkay, H.; Hutten, H. A model of artefacts produced by stray capacitance during whole body or segmental bioimpedance spectroscopy. Physiol. Meas. 1998, 19, 247–261. [Google Scholar]
- Kondrup, J.; Allison, S.; Elia, M.; Vellas, B.; Plauth, M. Espen guidelines for nutrition screening 2002. Clin. Nutr. 2003, 22, 415–421. [Google Scholar]
- Thibault, R.; Genton, L.; Pichard, C. Body composition: Why, when and for who? Clin. Nutr. 2012, 31, 435–447. [Google Scholar]
- Kuczmarski, R.J. Bioelectrical impedance analysis measurements as part of a national nutrition survey. Am. J. Clin. Nutr. 1996, 64, 453S–458S. [Google Scholar]
- Toso, S.; Piccoli, A.; Gusella, M.; Menon, D.; Bononi, A.; Crepaldi, G.; Ferrazzi, E. Altered tissue electric properties in lung cancer patients as detected by bioelectric impedance vector analysis. Nutrition 2000, 16, 120–124. [Google Scholar]
- Zlochiver, S.; Arad, M.; Radai, M.; Barak-Shinar, D.; Krief, H.; Engelman, T.; Ben-Yehuda, R.; Adunsky, A.; Abboud, S. A portable bio-impedance system for monitoring lung resistivity. Med. Eng. Phys. 2007, 29, 93–100. [Google Scholar]
- Bracco, D.; Revelly, J.-P.; Berger, M.M.; Chiolero, R.L. Bedside determination of fluid accumulation after cardiac surgery using segmental bioelectrical impedance. Crit. Care Med. 1998, 26, 1065–1070. [Google Scholar]
- Hoyle, G.; Chua, M.; Soiza, R. Volaemic assessment of the elderly hyponatraemic patient: Reliability of clinical assessment and validation of bioelectrical impedance analysis. QJM 2011, 104, 35–39. [Google Scholar]
- Cumming, K.; Hoyle, G.; Hutchison, J.; Soiza, R.L. Bioelectrical impedance analysis is more accurate than clinical examination in determining the volaemic status of elderly patients with fragility fracture and hyponatraemia. J. Nutr. Health Aging. in press.
- Chen, Y.-C.; Chen, H.-H.; Yeh, J.-C.; Chen, S.-Y. Adjusting dry weight by extracellular volume and body composition in hemodialysis patients. Nephron 2002, 92, 91–96. [Google Scholar]
- Chamney, P.W.; Krämer, M.; Rode, C.; Kleinekofort, W.; Wizemann, V. A new technique for establishing dry weight in hemodialysis patients via whole body bioimpedance. Kidney Int. 2002, 61, 2250–2258. [Google Scholar]
- Zhu, F.; Kuhlman, M.; Kotanko, P.; Handelman, G.; Leonard, E.; Levin, N. A device for monitoring hydration state in hemodialysis patients using a calf bioimpedance technique. Proceedings of the 13th International Conference on Electrical Bioimpedance and the 8th Conference on Electrical Impedance Tomography, Graz, Austria, 29 August– 2 September 2007; pp. 775–778.
- Zhu, F.; Kuhlmann, M.; Kotanko, P.; Seibert, E.; Leonard, E.; Levin, N. A method for the estimation of hydration state during hemodialysis using a calf bioimpedance technique. Physiol. Meas. 2008, 29, S503–S516. [Google Scholar]
- Seibert, E.; Mueller, S.G.; Fries, P.; Pattmoeller, J.; Kuss, O.; Heine, G.H.; Girndt, M.; Schneider, G.; Kotanko, P.; Zhu, F. Calf bioimpedance spectroscopy for determination of dry weight in hemodialysis patients: Effects on hypertension and left ventricular hypertrophy. Kidney Blood Press. Res. 2013, 37, 58–67. [Google Scholar]
- Atilano, X.; Luis Miguel, J.; Martínez, J.; Sánchez, R.; Selgas, R. Bioimpedance vector analysis as a tool for determination and adjustment of dry weight in hemodialysis patients. Kidney Res. Clin. Prac. 2012, 31, A17–A18. [Google Scholar]
- Buffa, R.; Mereu, R.; Putzu, P.; Floris, G.; Marini, E. Bioelectrical impedance vector analysis detects low body cell mass and dehydration in patients with alzheimer's disease. J. Nutr. Health Aging 2010, 14, 823–827. [Google Scholar]
- Moreno, M.V.; Djeddi, D.-D.; Jaffrin, M.Y. Assessment of body composition in adolescent subjects with anorexia nervosa by bioimpedance. Med. Eng. Phys. 2008, 30, 783–791. [Google Scholar]
- Sillanpää, E.; Häkkinen, A.; Häkkinen, K. Body composition changes by dxa, bia and skinfolds during exercise training in women. Eur. J. Appl. Physiol. 2013, 113, 2331–2341. [Google Scholar]
- Paton, N.I.; Elia, M.; Jennings, G.; Ward, L.C.; Griffin, G.E. Bioelectrical impedance analysis in human immunodeficiency virus-infected patients: Comparison of single frequency with multifrequency, spectroscopy, and other novel approaches. Nutrition 1998, 14, 658–666. [Google Scholar]
- Libraty, D.H.; Endy, T.P.; Kalayanarooj, S.; Chansiriwongs, W.; Nisalak, A.; Green, S.; Ennis, F.A.; Rothman, A.L. Assessment of body fluid compartment volumes by multifrequency bioelectrical impedance spectroscopy in children with dengue. Trans. R. Soc. Trop. Med. Hyg. 2002, 96, 295–299. [Google Scholar]
- Simons, J.; Schols, A.; Westerterp, K.; Ten Velde, G.; Woliters, E. Bioelectrical impedance analysis to assess changes intotal body water in patients with cancer. Clin. Nutr. 1999, 18, 35–39. [Google Scholar]
- Ibrahim, F.; Taib, M.N.; Abas, W.A.B.W.; Guan, C.C.; Sulaiman, S. A novel approach to classify risk in dengue hemorrhagic fever (dhf) using bioelectrical impedance analysis (bia). IEEE Trans. Instrum. Meas. 2005, 54, 237–244. [Google Scholar]


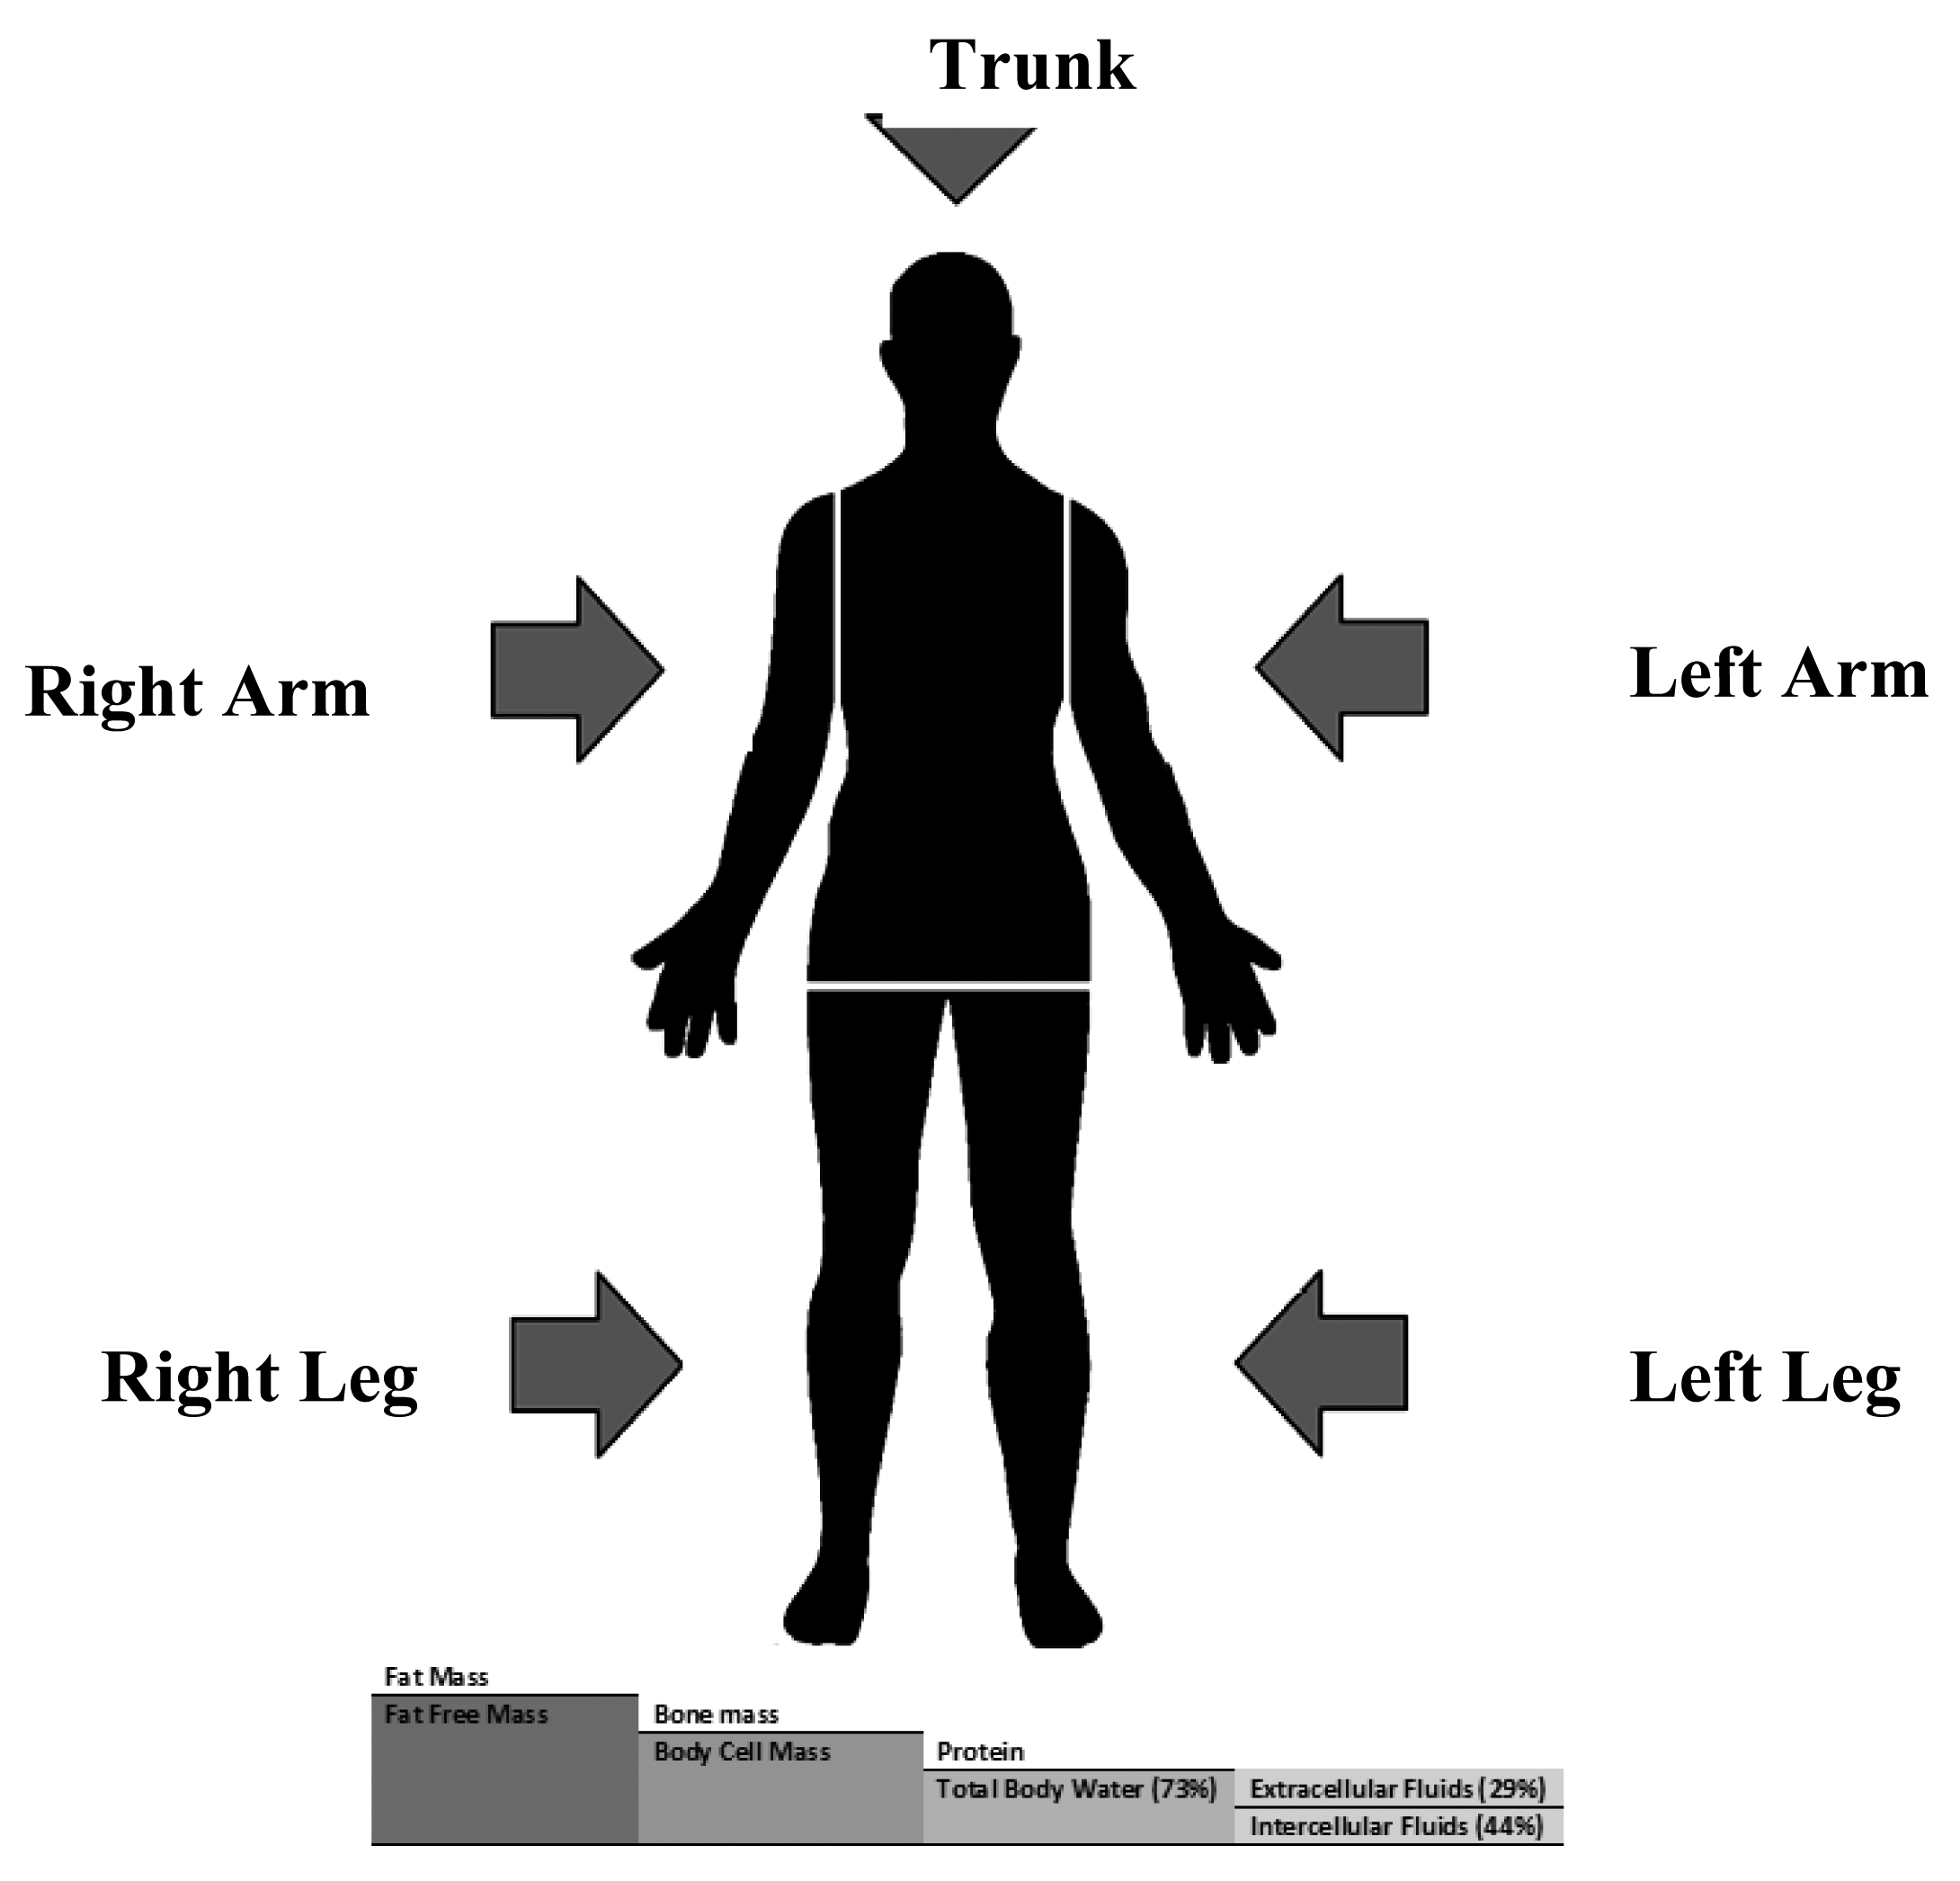
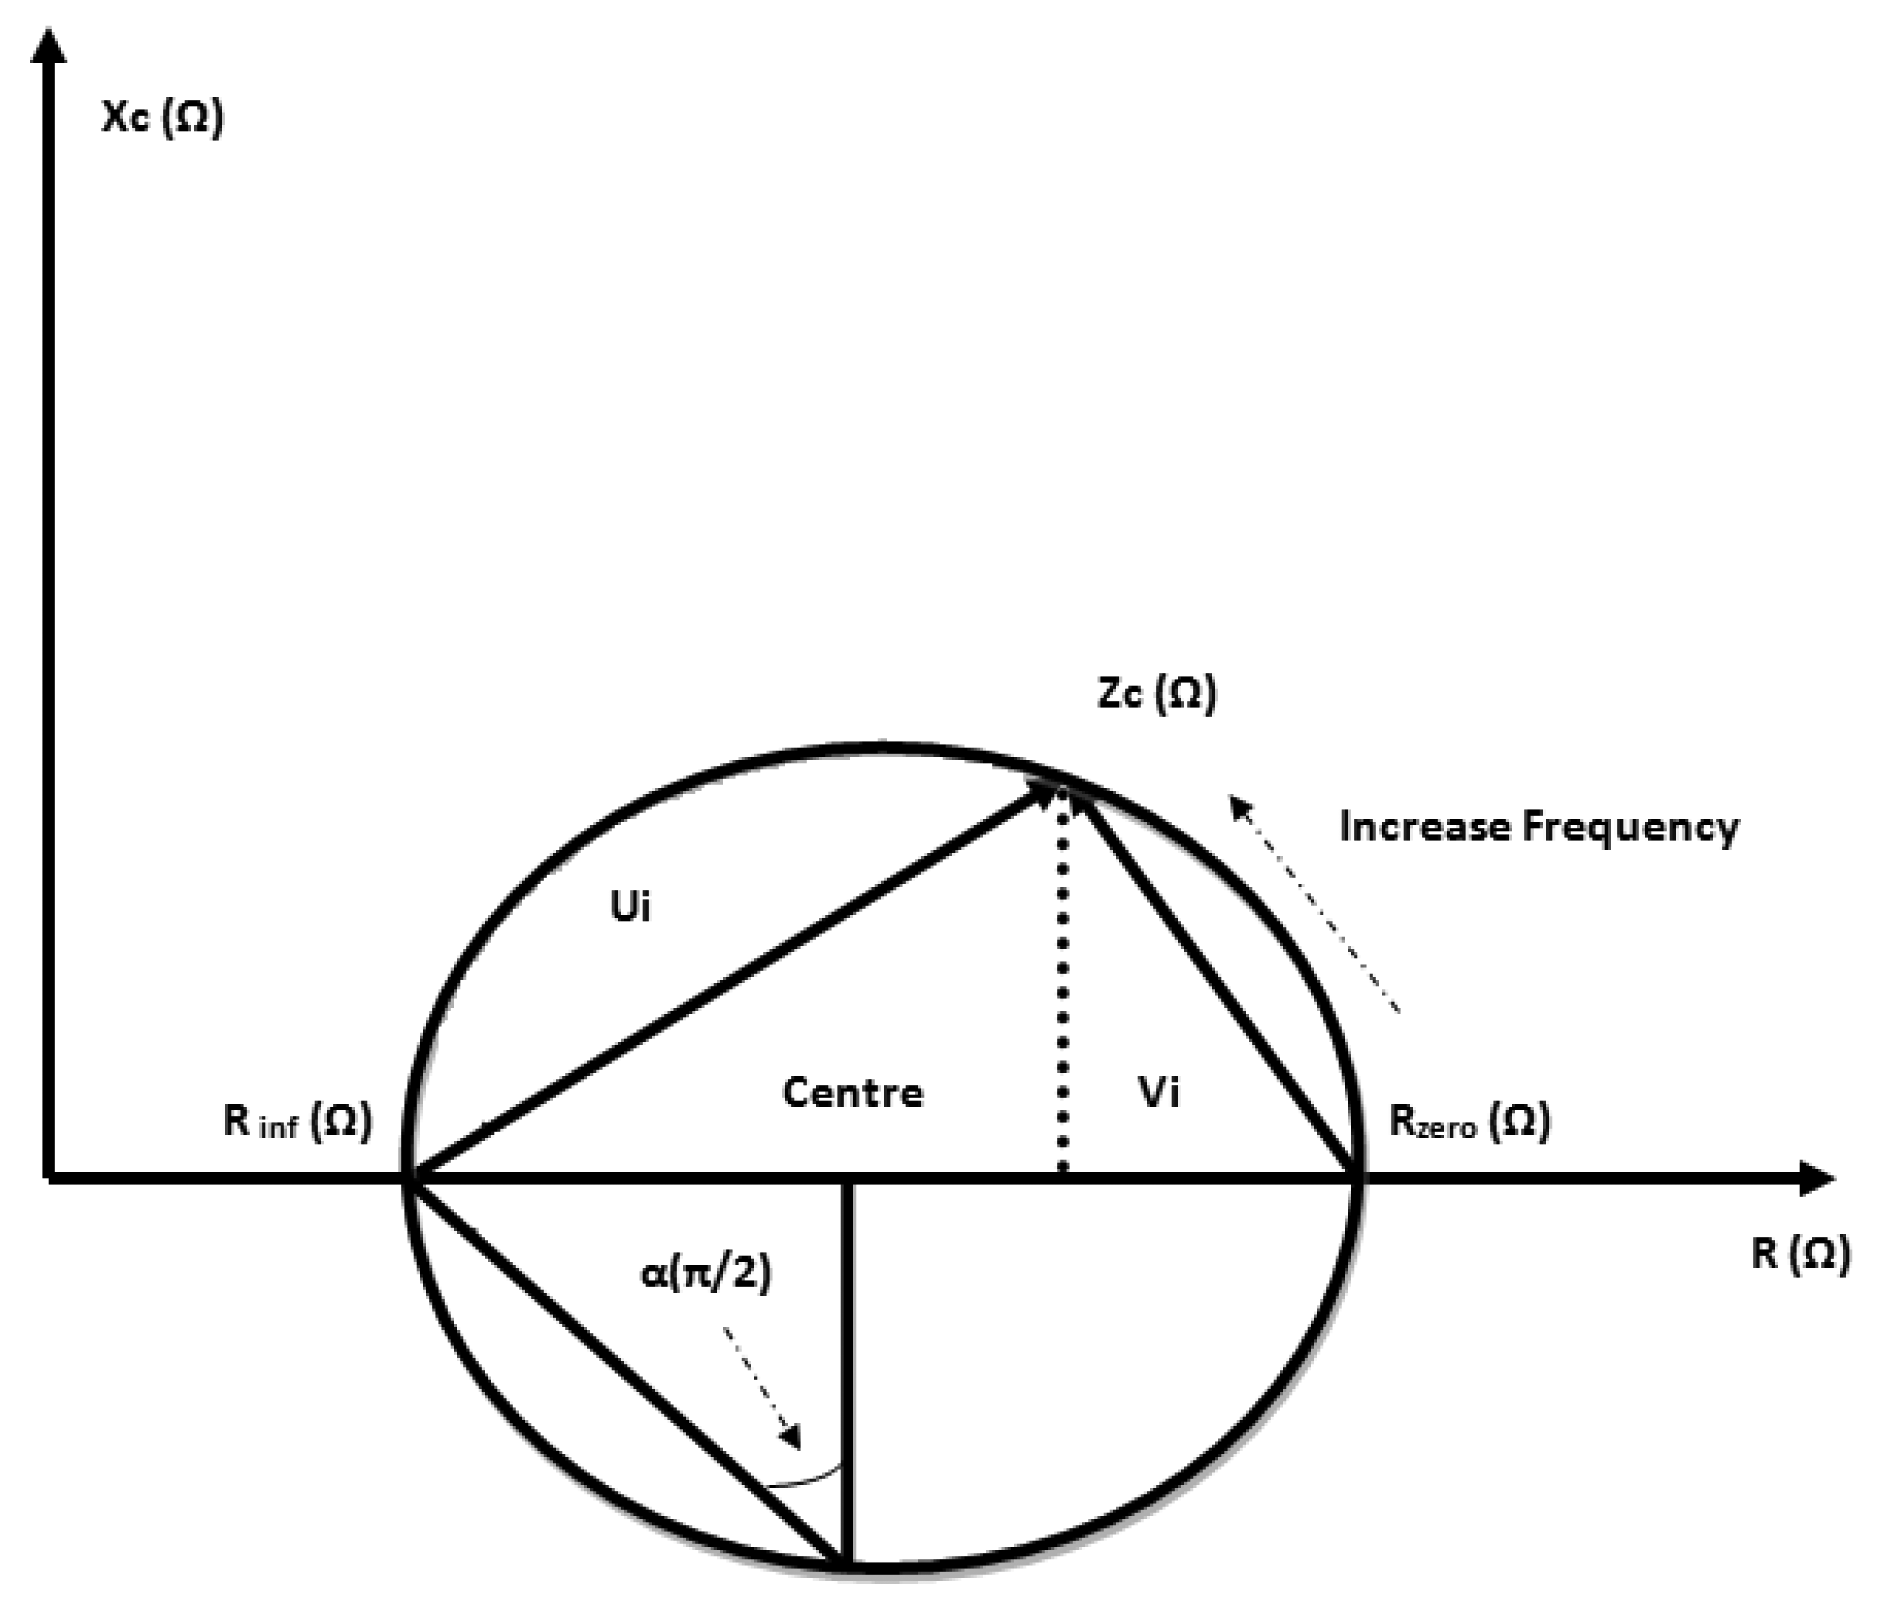
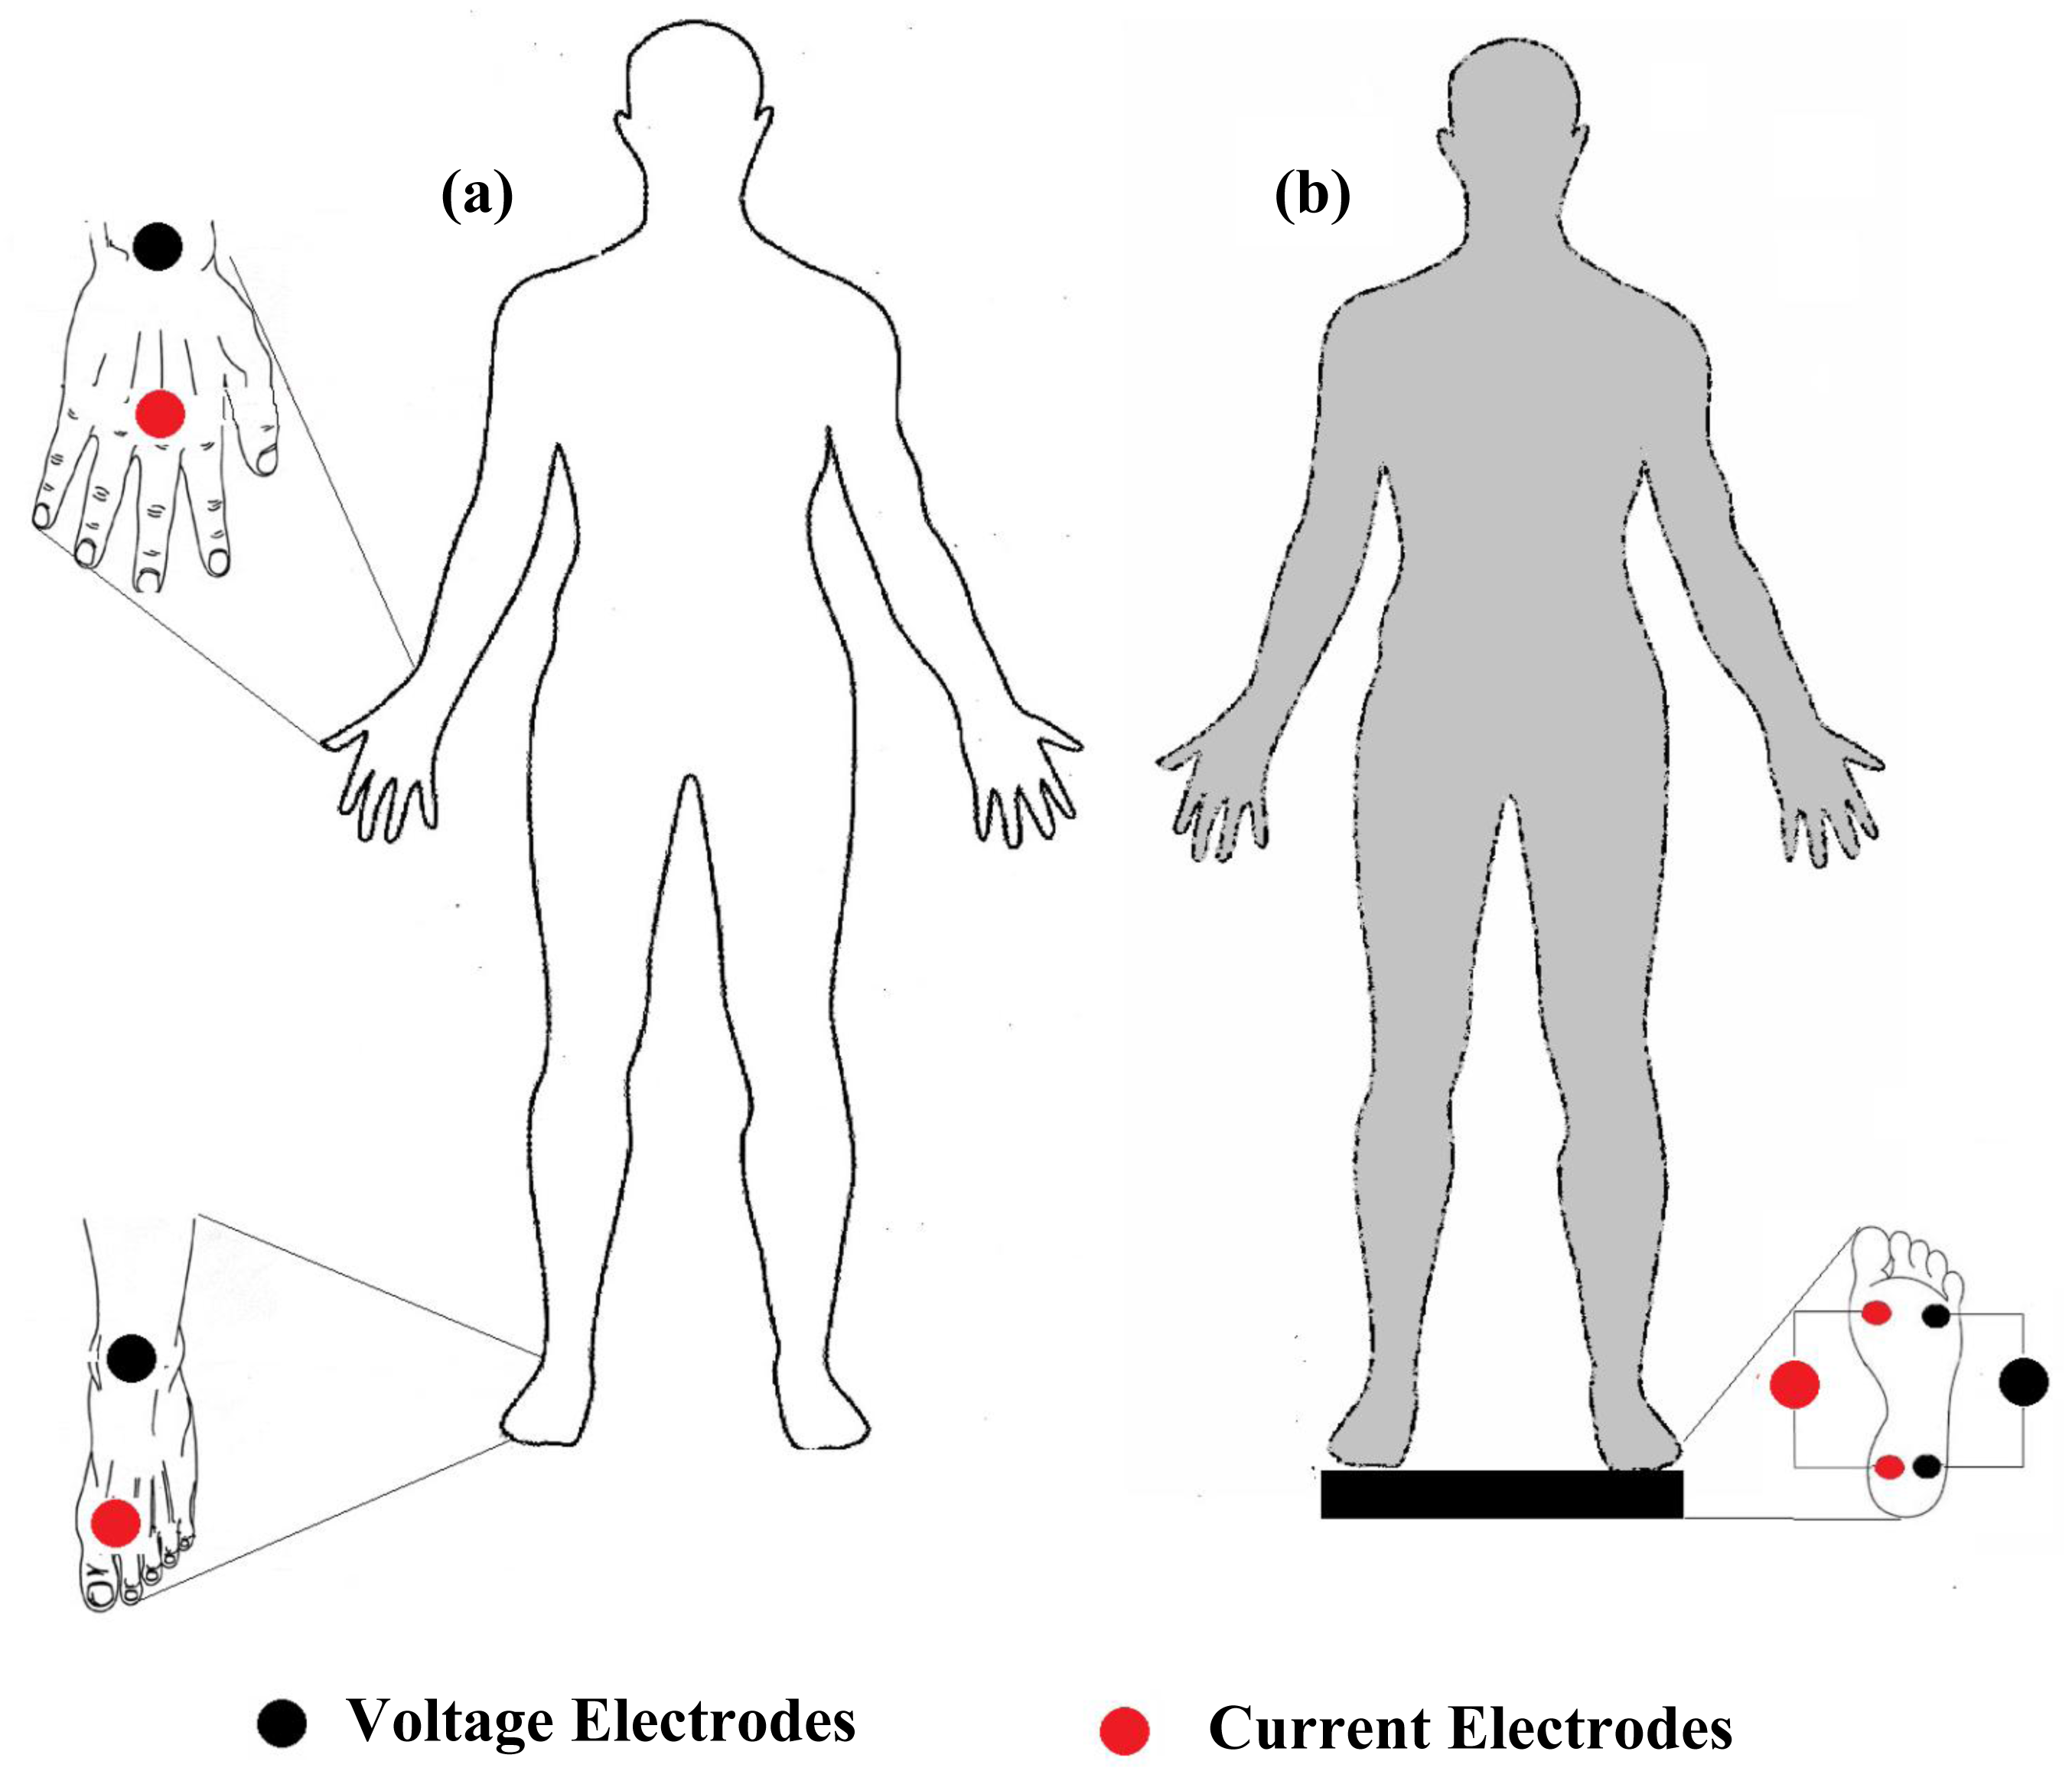
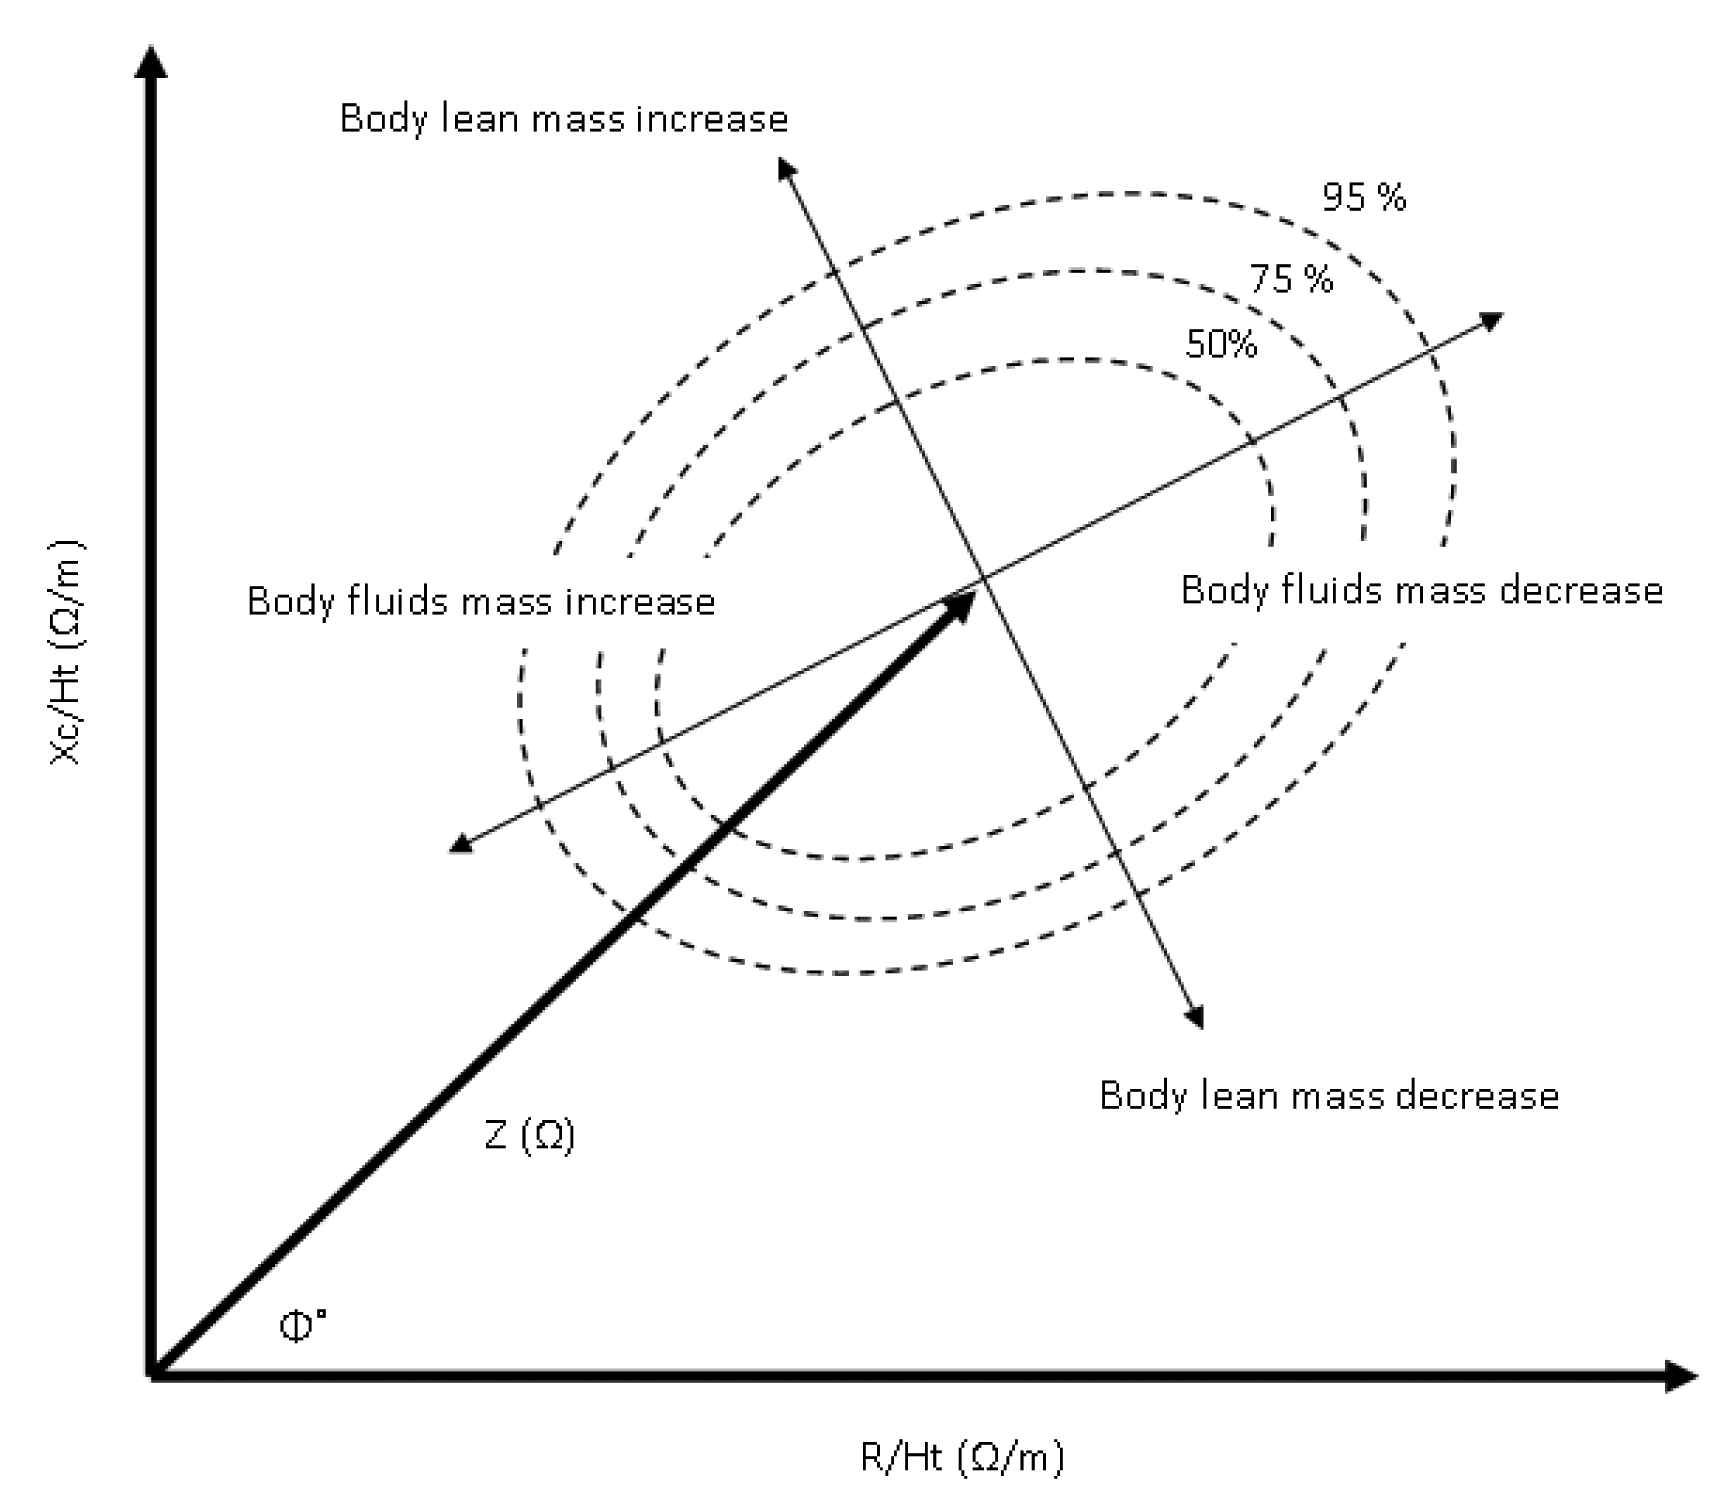
| Organ Systems | Diseases | BIA Parameters | Remarks | Authors |
|---|---|---|---|---|
| Pulmonary system | Lung cancer, stages IIIB and IV | R and Xc (BIVA) | Reactance components decrease in patients (phase angle <4.5). Clinical Study. | Toso et al., 2000 [129] |
| Pulmonary edema monitoring | R (SFBIA) | Mean resistivity for left and right lung (1205 ± 163, 1200 ± 165 Ω·cm) and system reproducibility (2%). Research Study. | Zlochiver et al., 2007 [130] | |
| Cardio-vascular system | Fluid accumulation after cardiac surgery. | Ht2/Z (MFBIA) | Significant increase in segmental trunk bioimpedance after surgery due to fluid accumulation. Clinical Study. | Bracco et al., 1998 [131] |
| Circulatory system | Volaemic status and hyponatraemia | TBW (SFBIA) | In elderly hyponatraemic patients, TBW assessment using BIA method was correlated with dilution of deuterium oxide (R = 0.68). Clinical Study. | Hoyle et al., 2011 [132] |
| Hydration status and hyponatraemia in elderly | TBW (SFBIA) | Assessment of hydration status in elderly hyponatraemic patients using BIA method was more accurate than clinical procedures (Cohen's kappa coefficient = 0.52). Clinical Study. | Cumming et al., 2014 [133] | |
| Renal system | Chronic hemodialysis | ECF (BIS) | ECF to weight ratio of hypertensive patient's increase from that of normal patients (24.29 ± 3.56% vs. 21.50 ± 2.38). Clinical Study. | Chen et al., 2002 [134] |
| Dry weight in kidney failure. | ECF (BIS) | ECF/Wt is 0.239 and 0.214 L/kg for male and female healthy subjects. Clinical Study. | Chamney et al., 2002 [135] | |
| Hydration states monitoring in hemodialysis patients | Calf-BIS (BIS) | Normalized resistivity (μ = ρ /BMI) increased from 17.9 ± 3 to 19.1 ± 2.3 × 10⁻² Ω3·Kg−1, and weight was reduced from 78.3 ± 28 to 77.1 ± 27 kg in Post-dialysis. Research Study. | Zhu et al., 2007 [136], 2008 [137] | |
| Dry weight assessment hemodialysis patients | Calf-BIS (BIS) | Dry weight assessed by cBIS underestimate left ventricular mass and blood pressure while antihypertensive medication remains unchanged. Clinical Study. | Seibert et al., 2013 [138] | |
| Body fluids estimation in hemodialysis patients | ECF, ICF and TBW (BIS) | Correlation between proposed equation corrected for BMI and the references (mean ± SD) was −0.4 ± 1.4 L for ECF, 0.2 ± 2.0 L for ICF and −0.2 ± 2.3 L for TBW. Clinical Study. | Moissl et al., 2006 [97] | |
| Dry weight assessment HD patients | R and Xc (BIVA) | BIVA method shows significant different in vectors in post dialysed patients. Clinical Study. | Atilano et al., 2012 [139] | |
| Neural system | Alzheimer's disease | R and Xc (BIVA) | BCM decreased in patients for men, T2 (Hotelling's statistic) = 12.8 and for women, T2 = 34.9. Clinical Study. | Buffa et al., 2010 [140] |
| Anorexia nervosa (eating disorder) | FM, FFM, TBW and ECF (BIS) | The BCM to Ht2 ratio was found to be significantly changed between diseased and controls subjects. Clinical Study. | Moreno et al., 2008 [141] | |
| Anorexia nervosa (eating disorder) | R and Xc (BIVA) | Gradually increasing in BCM and decreasing in ECF during treatments. Clinical Study. | Haas et al., 2012 [69] | |
| Muscular system | Body composition changes monitoring during exercise training | FFM and FM (MFBIA) | BIA method underestimates FM (−3.42 kg) and overestimated FFM (3.18 kg); and undetected small shift in body composition due to exercise training. Clinical Study. | Sillanpää et al., 2013 [142] |
| Immunology system | Comparison between SFBIA and MFBIA in HIV patients | ECF and TBW (BIS) | Insignificant differences in TBW and ECF estimation using SFBIA, MFBIA and BIS methods. Clinical Study. | Paton et al., 1998 [143] |
| Dengue haemorrhagic fever estimation in children | ECF and ICF (BIS) | (ECF/ICF) increase with increasing dengue virus infections severity in children. Clinical Study. | Libraty et al., 2002 [144] | |
| Cancer patients | TBW (SFBIA) | Change in TBW using BIA method (Ht2/R50) correlate with deuterium dilution in underweight and normal-weight cancer patients (R2 = 0.43 and SEE = 1.22 L). Clinical Study. | Simons et al., 1999 [145] | |
| Early diagnosis and risk analysis of dengue | R, C, φ and Xc (SFBIA) | Reactance variations among dengue patients during defervescence of feverintervalis an indicator for classifying risk category in the DHF patients. Clinical Study. | Ibrahim et al., [146] | |
| Other diseases | Critically ill subjects | FM, TBW and ECF (BIS) | Body composition using BIS method show slightly more significant in estimation of FM, TBW and ECF among healthy and diseased subjects. Clinical Study. | Pichler et al., 2013 [91] |
| Gastrointestinal disease | R, Xc, Fc, FFM, TBW, ECF and ICF (BIS) | In critically diseased subjects, Fc and ECF increased, Xc decreased, and TBW and ICF remain the same. Clinical Study. | Cox-Reijven et al., 2003 [67] | |
© 2014 by the authors; licensee MDPI, Basel, Switzerland. This article is an open access article distributed under the terms and conditions of the Creative Commons Attribution license ( http://creativecommons.org/licenses/by/3.0/).
Share and Cite
Khalil, S.F.; Mohktar, M.S.; Ibrahim, F. The Theory and Fundamentals of Bioimpedance Analysis in Clinical Status Monitoring and Diagnosis of Diseases. Sensors 2014, 14, 10895-10928. https://doi.org/10.3390/s140610895
Khalil SF, Mohktar MS, Ibrahim F. The Theory and Fundamentals of Bioimpedance Analysis in Clinical Status Monitoring and Diagnosis of Diseases. Sensors. 2014; 14(6):10895-10928. https://doi.org/10.3390/s140610895
Chicago/Turabian StyleKhalil, Sami F., Mas S. Mohktar, and Fatimah Ibrahim. 2014. "The Theory and Fundamentals of Bioimpedance Analysis in Clinical Status Monitoring and Diagnosis of Diseases" Sensors 14, no. 6: 10895-10928. https://doi.org/10.3390/s140610895