A New Quantitative Method for the Non-Invasive Documentation of Morphological Damage in Paintings Using RTI Surface Normals

Abstract
: In this paper we propose a reliable surface imaging method for the non-invasive detection of morphological changes in paintings. Usually, the evaluation and quantification of changes and defects results mostly from an optical and subjective assessment, through the comparison of the previous and subsequent state of conservation and by means of condition reports. Using quantitative Reflectance Transformation Imaging (RTI) we obtain detailed information on the geometry and morphology of the painting surface with a fast, precise and non-invasive method. Accurate and quantitative measurements of deterioration were acquired after the painting experienced artificial damage. Morphological changes were documented using normal vector images while the intensity map succeeded in highlighting, quantifying and describing the physical changes. We estimate that the technique can detect a morphological damage slightly smaller than 0.3 mm, which would be difficult to detect with the eye, considering the painting size. This non-invasive tool could be very useful, for example, to examine paintings and artwork before they travel on loan or during a restoration. The method lends itself to automated analysis of large images and datasets. Quantitative RTI thus eases the transition of extending human vision into the realm of measuring change over time.1. Introduction
The conservation, preservation, and documentation of cultural heritage have concerned conservators, art historians, and scientists for many years. The conservation of an artwork depends on the materials of which it is composed and on complex processes such as aging and environmental effects. The accuracy of monitoring techniques to evaluate these changes is indispensable for proper conservation and restoration strategies.
Paintings consist of different layers of materials. These generally consist in a support, primer, and layers of paint and varnish. Other layers such as glue, a preparatory drawing, an imprimatura and additional layers of paint can complement the painting composition. Moreover, the composition of paintings is often dominated by composite materials with different behaviors and chemistry. In general, damage can be defined as an adverse change from an original state.
Deterioration of paintings can be caused by environmental factors such as fluctuations in temperature and relative humidity, light radiation, and microbiological activity. In addition transportation can be another source of damage: vibrations, environmental climate changes, and poor handling can result in damage. The cumulative effects of these factors produce changes in both the painting structure and its chemical composition [1,2].
In traditional conservation techniques the evaluation and quantification of small changes and defects results mostly from an optical and subjective assessment, through the comparison of the previous and the subsequent state of conservation and by means of condition reports. A challenge for conservators is to distinguish a new defect from an old one or to detect the expansion of a defect when it is still in an early state of change.
Burmester et al., Hein et al., Kalms et al., and Groves et al. [3–6] applied various optical methods to. For the first time a quantitative multispectral imaging technique coupled to statistics, developed by our group, has been used for the non-invasive monitoring of the conservation state of the Dead Sea Scrolls [7,8], one of the most important archaeological discoveries of the 20th century.
Other approaches like 3D scanning and shearography present advantages for the non-invasive analysis of artwork. Bertesaghi et al., and Wegner et al., and Debevec et al., extracted the 3D information in the form of surface normals by collecting multiple images under varying lighting conditions: this information has been used for enhancing surface details [9–11].
Several paintings have been examined, showing that RTI is able to record surface features including craquelures, planar distortions, wood grains and canvas weaves. RTI renderings made before and after physical changes to a painting were compared and showed how promising the technique is for the examination of alterations in texture and shape of paintings [12].
Reflectance Transformation Imaging (RTI) is an imaging method that uses multiple angles of illumination to generate topographical information on the surface being imaged. RTI generates surface reflectance information using photometric stereo. The most common implementation of RTI is via Polynomial Texture Mapping (PTM) invented by Tom Malzbender of HP Labs in 2000 [13,14]. Alternative approaches were identified to compress defined surface properties including spherical and hemispherical harmonics [15]. RTI methods have been applied to archaeological and fine art objects in a wide variety of situations [16–18].
The theory of statistical process control (SPC) [19–22] was used to investigate superficial degradation processes, as has been previously demonstrated by our group in monitoring the conservation state of wooden objects and canvas painted with inorganic pigments, analyzed by Raman and IR spectroscopy [23,24].
In this paper we propose a reliable RTI method for the non-invasive detection of morphological changes in paintings: the method includes an imaging protocol, the extraction of the surface normal, and comparison with statistical limits derived from SPC theory. In order to have a reproducible and quantitative method that can be used as a practical method for measuring change in objects we developed a custom semi-arch arm with LED lights to illuminate the surface of a painting. Our method is a completely non-invasive monitoring technique: we obtained a quantitative measure of the deterioration and degradation present in the painting after inducing artificial damage.
2. Theory
2.1. Reflectance Transformation Imaging (RTI)
Malzbender et al. introduced a novel image-based relighting technique for visualizing the appearance of a surface under a spatially variable source of illumination. RTI is an image-based recording method in which information about the surface reflectance is captured on a per-pixel basis. RTI files are created from information derived from multiple digital photographs of an object shot from a stationary camera position: in each image light is projected from a different direction. This process produces a series of images of the same subject with varying highlights and shadows. Lighting information from the images is mathematically treated to generate a mathematical model of the surface, in the form of surface normals for each pixel, and used for enhancing various details [13–15]. A surface normal is a vector perpendicular to the surface at any given pixel. We will focus on that for measuring morphological changes to the surface [25]. An RTI file consists of an interactive viewing file where the user controls the angle of illumination of the surface imaged.
2.2. Quantitative RTI
Recently, the need to improve quantitative imaging techniques for monitoring purposes has become increasingly relevant. Our research is focused on the application of imaging methods for monitoring changes in cultural heritage objects. Quantitative imaging includes the development, standardization, and optimization of imaging acquisition protocols, data analysis, and results interpretation in order to have a validated, reliable, and precise method. This work is taking place within the larger field of computational photography and the measurement of the impact of environmental change on World Heritage.
2.3. Generating Surface Normal
Polynomial texture map (PTM) [14] and Hemispherical Harmonics (HSH) [26] function are usually used to describe the reflectance function. In general HSH approach is superior in terms of 3D quality because PTM uses only six coefficients of a biquadratic polynomial to describe the surface normal while a third order HSH uses 16 coefficients.
We have demonstrated that computing surface normals by means of the HSH polynomial function is more reproducible than using the older PTM method, and it is therefore much more sensitive to changes [25].
After capturing all images for RTI, each with a different light position and the same camera position, all the pictures, and respective light direction, for each single pixel are collected from all the images and fitted to the Hemispherical Harmonics function.
We used the open source software RTI Builder from Cultural Heritage Imaging (culturalheritageimaging.org) to build the RTI images from the raw image set and then calculated the normals for each pixel separately. Surface normals were extracted from RTI; the sixteen coefficients stored for each pixel in the HSH already contain the directional luminance information [26,27].
2.4. Change Detection Principles
Change measurement requires quantitative imaging methods: measuring change requires a before and an after image, quantitated well enough, with low noise, to perform useful comparisons.
In a previous work we have shown that RTI can be used as a sensitive monitoring methodology to automatically recognize areas that have changed: we evaluated how reproducible and accurate the method can be [25]. A monitoring method that has generally low reproducibility and accuracy (film photography, for example) means that it has poor sensitivity to change, since differentiating image changes from the image measurement uncertainty may not be possible.
Statistical process control is widely used in industrial applications and it has also been applied to cultural heritage monitoring. The general principle is to consider the conservation state as an industrial process, which is in its “in-control” condition when no deterioration effect is acting. Each further deviation from this initial condition is attributable to a damaging effect acting on the art object. The basic idea is that by monitoring the surface normals over time it is possible to detect the small-scale morphological and physical changes of an object surface. These changes affect the interaction of light with the object.
In this research we described the normal representing the vector using cartesian coordinates x, y, and z: the individual vector components were used as scalars and were statistically compared before and after the damages. In this way the results can be easily represented as maps, one for each coordinate, where pixels that are statistically changed are “painted” with a defined color.
A normal can be considered changed only if the after image value exceeds the region of statistical control which is defined by 3σ around the average value of each pixel, σ being the standard deviation of the considered pixel from the before, or control image. The average value and the standard deviation of each normal is calculated on its coordinates. This region corresponds to a confidence level of more than 99%. The average normal of each pixel and the region of statistical control have to be estimated by recording several replicates of RTI of the monitored object and are directly related to the uncertainty of the imaging technique: this baseline of normals set the timeline to zero and constitutes the characterization of the object. In this phase the object can be considered “in statistical control”. In this research the variance of the instrument, and so its reproducibility, has been assessed by recording five RTI replicates of the considered painting.
The absolute sensitivity of the method is the minimum variation of the normal that can be considered a statistically relevant change of the object: the larger the variance of the baseline normals, the less sensitive the method is.
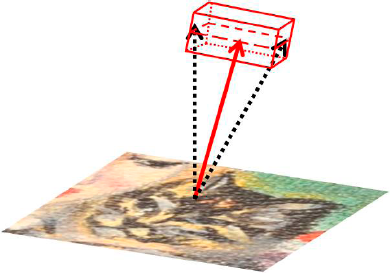
In the present article the region of joint probability of x, y and z (coordinate of the surface normal vector) corresponding to the parallelepiped volume defined by the multivariate Gaussian probability function was approximated by the volume reported in Figure 1: this approximation is sufficiently conservative to provide reliable results. A normal is considered changed only if the monitored vector is outside the control volume.
3. Experimental Section
3.1. RTI Capture Technique
A D3100 camera (Nikon, Tokyo, Japan) with an 18 mm macro lens was used. The F-stop was set at f/8 and the exposure time at 0.62 s: both F-stop and the exposure time were fixed for all the acquisitions. The images are made by 4608 × 3072 pixels, the resolution of the images is 254 dpi and the ground pixel size is 0.1 mm. The camera was operated tethered to a PC.
The photographic capture of 48–52 digital images takes 8 min. It takes an additional 12 min to process and assemble the HSH-RTI data and image. This averages 20 min for a subject 1 m × 1 m or less. The greater the number of capture images, the longer the time to process and assemble.
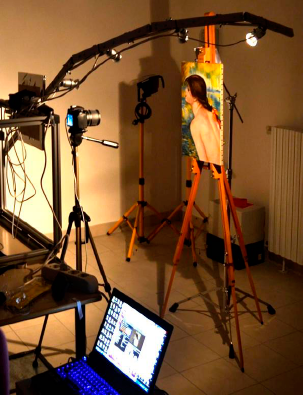
3.2. Light
A semi arch arm with four LEDs (20 Watt) at 15°, 30°, 45° and 60° lighting angles (Figure 2) was used to illuminate the surface of the painting to produce the highlight point in the reflective target. The object was illuminated from multiple light positions moving the arm every 20 degrees following a pattern with radial spokes, creating a virtual dome. The power of the lights was set to illuminate the surface of the object enough and was the same for each lamp. The lights were located from the surface of the object at a consistent distance of three times the object's diameter. A black reflective sphere was used to locate the lighting angle in each photograph [15]. The RTI Builder is able to identify automatically the light direction from its highlight on the sphere.
3.3. Image Processing
In this monitoring method the image alignment between imaging datasets is critical because mis-aligned pixels between imaging sessions would show up as topographical changes. Since it is not possible to repeatedly replace and image an object on the spatial scale of a pixel, rigorous digital alignment methods were employed.
The repeatability of the method was measured by recording the data in five separate imaging sessions: for every imaging session the camera and the object were repositioned in the same position. Then, the open source software RTI Builder was used to build the RTI images from the raw image set and the normals were extracted as described by Macdonald et al., and Gautron et al. [24,26], using both Python version 2.7.3 and Matlab R2010a (the MathWorks, Natick, MA, USA).
The extracted normals of each replicate can be represented as three bi-dimensional images (one for each Cartesian coordinates x, y, z). In order to elaborate and compare the object over time, as described later in the paper, the images of x, y, and z must be aligned between each other. An open source image processing package, a version of ImageJ, called FIJI was used [28,29] to match the coordinate images of the five replicates. The color images, captured to build the RTI files, were employed to calculate an elastic transformation function (SIFT and bunwarpj tools were used) that was then used to align the x, y, and z coordinate images. In this way it was possible to align the images collected during different imaging sessions without positioning the painting in the same place. Moreover, using the elastic transformation function, which was based only on the color images and on their features, the method was able to align the coordinates images taken after a damage: in this case, the alignment has been performed without influencing the damaged areas because the information related to the normals is not accounted by the raw color images used to obtain the elastic function.
4. Results and Discussion
4.1. Painting
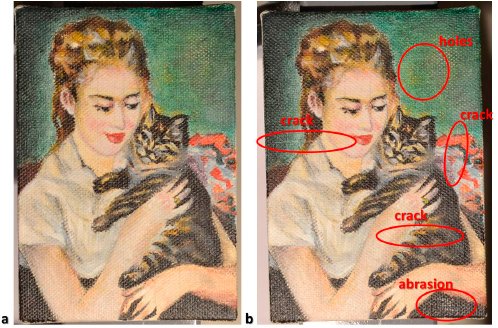
A painting on canvas of 10 cm × 7 cm was prepared and used for this research (Figure 3a). The canvas was painted with acrylic colors. The repeatability of the computed surface normals was measured by recording the data in five separate imaging sessions. The normals were computed with the HSH algorithm and the average variability was calculated. The surface normal vector is described representing the Cartesian coordinates x, y, and z of the vector itself: the average variability is calculated as standard deviation/mean × 100 for each pixel. The average measured variability was 5.8%, 6.9% and 3.8% respectively for x, y, and z axes. The variability of the measurement is very important because it is strictly correlated to the sensitivity of the method, namely the minimum variation that can highlight a statistically relevant change of the object. In the present case the repeatability was worse than the one we calculated in our previous work [27] even if a semi-arc arm was used with the aim of reducing the variability of the light positions and of saving time during each imaging sessions. This is likely due to the fact that in our previous work we used a DSLR camera that has more pixels (24 MP versus 14 MP) and hence a smaller IFOV sample size than the camera used for the present work.
4.2. Damage Detection in Painting
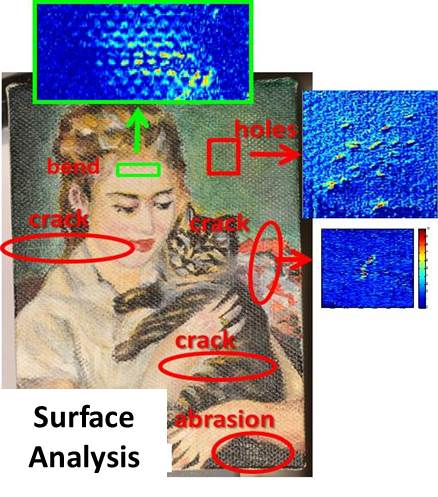
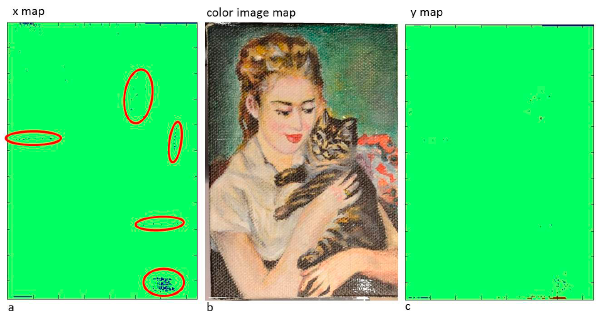
The five RTI replicates recorded with the aim of estimating the repeatability were used to characterize the system's “natural” variability whose estimation is necessary to build the control charts. The statistical limits were calculated as 3σ around the average value of each pixel and were used to define the interval containing the normals that did not present a statistical change as a consequence of the artificial deterioration processes applied. Figure 3 shows the color image of the painting used for this research. The painting was artificially damaged, after the characterization of the natural variability (Figure 3a), by creating some small holes, three cracks and one abrasion (red circles, Figure 3b).
After the damage, the RTI was captured again, and the surface normals were calculated. After aligning the images before and after damage, by comparing on a pixel basis these normals with the statistical limits calculated from the characterization images, it was possible to build a map of statistically significant changes (1% significance).
Figure 4 shows three different ways to visualize the results: Figure 4a shows the map of changes for the x values of the normal (blue pixels represent the areas where the normals are characterized by statistically relevant changes); the map of changes for the y values of the normal is represented in Figure 4c. Figure 4b shows the color image of the painting where white pixels represent the damaged area identified by the method.
The maps of changes detected all the damages (red circles) that had been artificially made: so the method proved to be able to identify the changed areas.
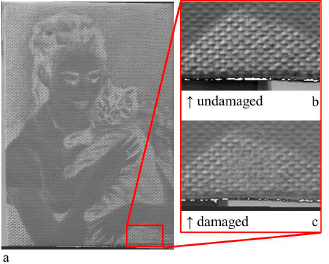
Figure 5a represents the bi-dimensional projection (image) of the y value of the normals of the damaged painting: Figure 5b and Figure 5c are respectively the magnification of an area before and after the abrasion. It can be noticed that the morphological changes are correctly detected and there are no color variations because the abrasion of the canvas is clearly seen and represented by the normal vector images in Figure 5c.
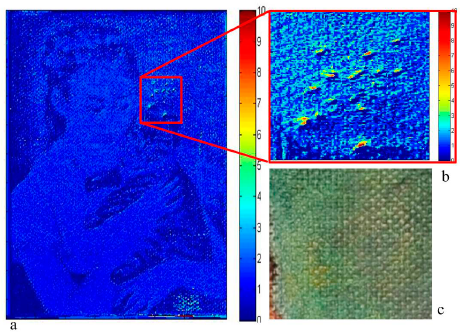
Figure 6a represents the intensity map of the changes of the damaged painting. The map represents the distance of each pixel from the region of statistical control. The scale of the intensity map is ± σ (standard deviation) away from the average normal value of each pixel: a normal can be considered changed only if the value exceeds three times sigma.
Figure 6b represents a 10× magnification of the intensity map of the area containing some holes: the method was clearly able to detect the small holes and the intensity map of the changes was able to highlight the morphological changes caused by the holes. Figure 6c shows a 10× magnification of the color image of the damaged area: the holes are not recognizable at a human eye visual inspection.
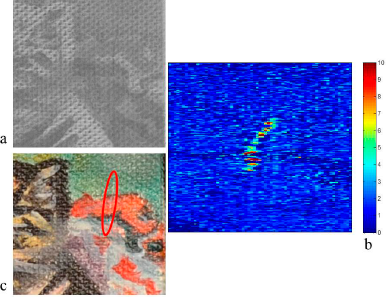
Figure 7a represents the bi-dimensional projection of the x values of the normals of the area damaged with an artificial crack: the damage is clearly recognizable and the intensity map of the changes is able to highlight the changes (Figure 7b).
The resolution of the images is 254 dpi and the width of the crack is approximately 2–3 pixels: this means that the method is able to detect morphological changes slightly smaller than 0.3 mm, which is a good result.
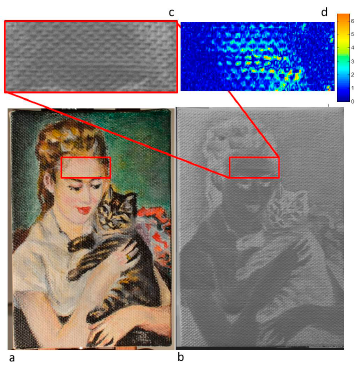
The painting was further damaged by creating a small dimple from the back in order to produce visually un-detectable damage (without color changes): then the RTI was captured again and the map of the changes was built.
In this case, the bend would be very difficult to detect visually, since it does not expose any new surface or pigment and is quite small in height. The heat map in Figure 8d shows what one expects for a bump in the surface; around it, the heat map is blue, showing little change since it far away from the bump. As one goes more to the center, there are more changes and the map turns yellow and green. Note, however, that they are still lots of blue, unchanged, pixels, even in the center of bump. This is due to fact that at the apex of the bump, the normals are roughly where they were before, in the same direction as the rest of the substrate, assuming relatively flat over the field of view.
Figure 8 represents the color images: (a) of the damaged area (red rectangle), the bi-dimensional projection of the y values of the normals (b) with a magnification of the damaged area (c): the damage is identified and highlighted in the intensity map of the changes (Figure 8d).
5. Conclusions
In this paper a reliable quantitative RTI technique was introduced for the non-invasive documentation of morphological changes in paintings. RTI provided detailed information on the geometry and morphology of the painting surface. A custom semi arch arm with LED lights to illuminate the surface of the painting was used in order to have a reproducible and quantitative method for measuring morphological changes of objects.
The method presented here was able to detect both morphological changes (holes, bends, cracks,…) and color changes (abrasion of the canvas). It was estimated that this experiment can detect physical changes slightly smaller than 0.3 mm (2–3 pixels). The sensitivity of the method can be increased by using a more sensitive camera as the camera performance is directly connected with the resolution of the methodology.
This is the first attempt to use the method as tool for monitoring the conservation of painting, and the results seems to be promising for the documentation and quantification of damages. The technique is non-invasive: a system for the automatic and fast acquisition and elaboration of the data will be developed in future. Moreover, in order to increase the accuracy and sensitivity of the method, a wider range of registration algorithms and the circulator statistics will be considered.
The method is a completely non-invasive monitoring and documentation technique: a quantitative evaluation of several types of artificial damage to the painting was obtained. This non-invasive tool could be very useful to examine paintings and artwork before they travel on loan or before and after a conservation treatment.
Acknowledgments
Our thanks to Regione Piemonte (project MEMIP-09) for the financial support.
Author Contributions
These authors contributed equally to this work. The research was carried out through the contribution of all authors. All of the authors read and approved the final manuscript.
Conflicts of Interest
The authors declare no conflict of interest.
References
- Granero-Montagud, L. Deterioration Estimation of Paintings by Means of Combined 3D and Hyperspectral Data Analysis. In Optics for Arts, Architecture and Archaelogy IV; SPIE: Munich, Germany, 2013; Volume 8790. [Google Scholar]
- Morawitz, M.; Hein, N.; Alexeenko, I.; Wilke, M.; Pedrini, G.; Krekel, C.; Osten, W. Detection of Transport and Age Induced Damages on Artwork: An Advanced Concept. In Optics for Arts, Architecture, and Archaelogy IV; SPIE: Munich, Germany, 2013; Volume 8790. [Google Scholar]
- Burmester, A.; Müller, M. The registration of transportation damage using digital image processing. Z. Kunsttechnol. Konserv. 1992, 6, 335345. (In German). [Google Scholar]
- Hein, N.; Krekel, C. 3d-weißlicht-streifenprojektionsscanner zur untersuchung von transportschäden an skulpturen. Z. Kunsttechnol. Konserv. 2010, 24, 146159. (In German). [Google Scholar]
- Kalms, M.; Osten, W.; Jüptner, W. Shearography—The implementation of the principle into a mobile inspection system. Tech. Mess. 2002, 69, 217–226. [Google Scholar]
- Groves, R.M.; Osten, W.; Doulgeridis, M.; Kouloumpi, E.; Green, T.; Hackney, S.; Tornari, V. Shearography as Part of a Multi-Functional Sensor for the Detection of Signature Features in Movable Cultural Heritage. In Optics for Arts, Architecture, and Archaeology; SPIE: Munich, Germany, 2007; Volume 6618. [Google Scholar]
- Marengo, E.; Manfredi, M.; Zerbinati, O.; Robotti, E.; Mazzucco, E.; Gosetti, F.; Bearman, G.; France, F.; Shor, P. Technique based on LED multispectral imaging and multivariate analysis for monitoring the conservation state of the Dead Sea Scrolls. Anal. Chem. 2011, 83, 6609–6618. [Google Scholar]
- Marengo, E.; Manfredi, M.; Zerbinati, O.; Robotti, E.; Mazzucco, E.; Gosetti, F.; Bearman, G.; France, F.; Shor, P. Development of a technique based on multispectral imaging for monitoring the conservation of cultural heritage objects. Anal. Chim. Acta 2011, 706, 229–237. [Google Scholar]
- Bertesaghi, A.; Sapiro, G.; Malzbender, T.; Gelb, D. Three-Dimensional Shape Rendering from Muliple Images. Graph. Models 2005, 67, 332–346. [Google Scholar]
- Wegner, A.; Gardner, A.; Tschou, C.; Unger, J.; Hawkins, T.; Debevec, P. Performance Relighting and Reflectance Transformation with Time Multiplexed Illumination. Proc. Siggraph 2005, 24, 756–764. [Google Scholar]
- Debevec, P.; Hawkins, T.; Tchou, C.; Duiker, H.; Sarokin, W. Acquiring the Reflectance Field of a Human Face. Proceedings of the 27th Annual Conference on Computer Graphics and Interactive Techniques, New Orleans, LA, USA, 23–28 July 2000; pp. 145–156.
- Padfield, J.; Saunders, D.; Malzbender, T. Polynomial texture mapping: A new tool for examining the surface of paintings. Proceedings of the 14th Triennial Meeting, The Hague, The Netherlands, 12–16 September 2005.
- Malzbender, T.; Gelb, D.; Wolters, H.; Zuckerman, B. Enhancement of Shape Perception by Surface Reflectance Transformation. Available online: http://www.hpl.hp.com/techreports/2000/HPL-2000-38R1.pdf (accessed on 9 July 2014).
- Malzbender, T.; Gelb, D.; Wolters, H. Polynomial Texture Maps. Proceedings of the 28th Annual Conference on Computer Graphics and Interactive Techniques, Los Angeles, CA, USA, 12–17 August 2001; pp. 519–528.
- Mudge, M.; Malzbender, T.; Chalmers, A.; Scopigno, R.; Davis, J.; Wang, O.; Gunawardane, P.; Ashley, M.; Doerr, M.; Proenca, A.; et al. Image-Based Empirical Information Acquisition, Scientific Reliability, and Long-Term Digital Preservation for the Natural Sciences and Cultural Heritage, Tutorial of Eurographics, Crete, Greece, 14–18 April 2008.
- Earl, G.P.; Martinez, K.; Malzbender, T. Archaeological Applications of Polynomial Texture Mapping: Analysis, Conservation and Representation. J. Archaeol. Sci. 2010, 37, 2040–2050. [Google Scholar]
- Klausmeyer, P.; Albertson, R.; Cushman, M.; Artal-Isbrand, P. Applications of Reflectance Transformation Imaging (RTI) in a Fine Arts Museum: Examination, Documentation, and Beyond. Available online: http://ncptt.nps.gov/wp-content/uploads/klausmeyer.pdf (accessed on 13 June 2014).
- Mudge, M.; Malzbender, T.; Schroer, C.; Lum, M. New Reflection Transformation Imaging Methods for Rock Art and Multiple-Viewpoint Display. Available online: http://culturalheritageimaging.org/What_We_Do/Publications/vast2006/index.html (accessed on 13 June 2014).
- Shewart, W.A. Economic Control of Quality of Manufactured Product; Van Nostrand: Princeton, NJ, USA, 1931. [Google Scholar]
- Montgomery, D.C. Introduction to Statistical Quality Control, 3rd ed.; Wiley: New York, NY, USA, 1991. [Google Scholar]
- Woodal, W.H.; Spitzner, D.J.; Montgomery, D.C.; Gupta, S. Using control charts to monitor process and product quality profiles. J. Qual. Technol. 2004, 36, 309–320. [Google Scholar]
- Pan, X.; Jarrett, J.J. Applying State Space into SPC: Monitoring Multivariate Time Series. Appl. Statist. 2004, 31, 397–418. [Google Scholar]
- Marengo, E.; Robotti, E.; Liparota, M.C.; Gennaro, M.C. A method for monitoring the surface conservation of wooden objects by Raman spectroscopy and multivariate control charts. Anal. Chem. 2003, 75, 5567–5574. [Google Scholar]
- Marengo, E.; Robotti, E.; Liparota, M.C.; Gennaro, M.C. Monitoring of pigmented and wooden surfaces in accelerated ageing processes by FT-Raman spectroscopy and multivariate control charts. Talanta 2004, 63, 987–1002. [Google Scholar]
- Manfredi, M.; Williamson, G.; Kronkright, D.; Doehne, E.; Jacobs, M.; Marengo, E.; Bearman, G. Measuring Changes in Cultural Heritage Objects with Reflectance Transformation Imaging. In Digital Heritage International Congress (DigitalHeritage); IEEE: Marseille, France, 2013; Volume 1, pp. 189–192. [Google Scholar]
- Macdonald, L.; Robson, S. Polynomial Texture Mapping and 3D Representations. In International Archives of Photogrammetry, Remote Sensing and Spatial Information Sciences; ISPRS Commission V Symposium: Newcastle, UK, 2010; pp. 422–427. [Google Scholar]
- Gautron, P.; Krivanek, J.; Pattanaik, S.; Bouatouch, K. A Novel Hemispherical Basis for Accurate and Efficient Rendering. Proceedings of the Fifteenth Eurographics conference on Rendering Techniques, Aire-la-Ville, Switzerland, 21–23 June 2004; pp. 321–330.
- Thévenaz, P.; Ruttimann, U.E.; Unser, M. A pyramid approach to subpixel registration based on intensity. IEEE Trans. Image Process 1998, 7, 27–41. [Google Scholar]
- Arganda-Carreras, I.; Sorzano, C.; Marabini, R.; Carazo, J.; de Solorzano, C.; Kybic, J. Lecture Notes in Computer Science. In Computer Vision Approaches to Medical Image Analysis; Springer: Berlin/Heidelberg, Germany, 2006; Volume 4241, pp. 85–95. [Google Scholar]


© 2014 by the authors; licensee MDPI, Basel, Switzerland. This article is an open access article distributed under the terms and conditions of the Creative Commons Attribution license ( http://creativecommons.org/licenses/by/3.0/).
Share and Cite
Manfredi, M.; Bearman, G.; Williamson, G.; Kronkright, D.; Doehne, E.; Jacobs, M.; Marengo, E. A New Quantitative Method for the Non-Invasive Documentation of Morphological Damage in Paintings Using RTI Surface Normals. Sensors 2014, 14, 12271-12284. https://doi.org/10.3390/s140712271
Manfredi M, Bearman G, Williamson G, Kronkright D, Doehne E, Jacobs M, Marengo E. A New Quantitative Method for the Non-Invasive Documentation of Morphological Damage in Paintings Using RTI Surface Normals. Sensors. 2014; 14(7):12271-12284. https://doi.org/10.3390/s140712271
Chicago/Turabian StyleManfredi, Marcello, Greg Bearman, Greg Williamson, Dale Kronkright, Eric Doehne, Megan Jacobs, and Emilio Marengo. 2014. "A New Quantitative Method for the Non-Invasive Documentation of Morphological Damage in Paintings Using RTI Surface Normals" Sensors 14, no. 7: 12271-12284. https://doi.org/10.3390/s140712271