Modeling and Analysis of a Microresonating Biosensor for Detection of Salmonella Bacteria in Human Blood

Abstract
: A new photonics biosensor configuration comprising a Double-side Ring Add-drop Filter microring resonator (DR-ADF) made from SiO2-TiO2 material is proposed for the detection of Salmonella bacteria (SB) in blood. The scattering matrix method using inductive calculation is used to determine the output signal's intensities in the blood with and without presence of Salmonella. The change in refractive index due to the reaction of Salmonella bacteria with its applied antibody on the flagellin layer loaded on the sensing and detecting microresonator causes the increase in through and dropper port's intensities of the output signal which leads to the detection of SB in blood. A shift in the output signal wavelength is observed with resolution of 0.01 nm. The change in intensity and shift in wavelength is analyzed with respect to the change in the refractive index which contributes toward achieving an ultra-high sensitivity of 95,500 nm/RIU which is almost two orders higher than that of reported from single ring sensors and the limit of detection is in the order of 1 × 10⁻⁸ RIU. In applications, such a system can be employed for a high sensitive and fast detection of bacteria.1. Introduction
Salmonella Typhimurium bacteria which cause thypoid fever contain flagellin (a protein with 494 amino acids of spherical shape, found in transparent filament cylinders). Several investigations have been conducted for the diagnosis of Salmonella such as electrochemical biomolecule detection, the TUBEX test, and the Felix-Widal test. These techniques requires labeling steps for isolation of the target molecules which takes additional time, and adds reagent costs and complexity [1].
The high demand for precise detection for biomolecules is increasing the tendency towards the improvement of biosensing techniques. Several techniques based on the change in phase or frequency such as Surface Enhanced Raman Spectroscopy (SERS), fluorescence, refractometry and microresonator biosensors have been introduced for the improvement of such detection in the past few years [2]. Most biosensors are focused on the label-free biosensing detection of bacterial proteins such as quartz crystal microbalance (QCM), surface plasmon resonance (SPR), coupled plasmon-waveguide resonance (CPWR) spectroscopy, and optical waveguide light-mode spectroscopy (OWLS) [3]. Label-free detection provides direct detection of biomolecules in natural forms without any adding any impurity to the target which results in performs detections with high sensitivity and low equipment costs.
Recently, the optoelectronics biosensor based on a microresonator in a photonics circuit has been introduced in the biosensing field as an important device that provides the high efficiency in biomolecule detection [1]. The microring resonator (MRR) is the main component in a photonics biosensor circuit which confines photons within the detection system [4]. The MRR system can be operated with more accuracy and low power consumption and can be fabricated in small size at low cost [5]. The MRR is used as the optofluidic devices for biosensing [6], and chemical analysis [7] as it can be integrated within photonics circuits. Nowadays, numerous works have been conducted to achieve the optimum design, size and material for enhancing the sensing purposes in terms of modeling and experimental methods. A limit of detection (LOD) on the order of 10−6 RIU is reported for integrated interferometer sensors with large interaction lengths [8,9]. Resonant-based sensors have also proved as ultra-sensitive sensors due to their high quality factor and sharp resonant peaks which provide a narrow detectable spectral shift. Using a slot waveguide-based ring resonator contributes to increase the light-matter interaction which improves the sensor's sensitivity to 298 nm/RIU and the LOD to 10−5 RIU [10]. Thanks to the Vernier effect, biosensors consisting of cascade ring resonators can also provide sensitivities as high as 2169 nm/RIU and LOD on the order of 10−6 [11]. Based on the size of the microresonators, design and waveguide material, the sensitivity of resonant-based sensors can be enhanced to an ultra-sensitive value of 105 nm/RIU [12].
In this work, a novel photonics biosensor configuration comprising a Double-side Ring Add-drop Filter microring resonator (DR-ADF) made from SiO2-TiO2 material is proposed for the detection of Salmonella bacteria (SB) in blood. Salmonella total antibodies are applied on a thin film flagellin layer and loaded on the sensing and detecting microring resonators and used as the probe for the detection of SB. The nonlinear treatment of the soliton pulse due to the Kerr effect inside DR-ADF is studied analytically. We achieve an ultra-high sensitivity detection of 95,500 nm/RIU and a very low limit of detection in the order of 1 × 10⁻⁸ RIU, which are almost two orders better than those reported for single ring sensors. In applications, such a system can be employed for a high sensitive and fast detection of bacteria. The main advantage of our proposed sensor is that it satisfies both intensity and wavelength interrogation approaches in comparison with other optical sensors and can be employed for a high sensitive and fast detection of Salmonella bacteria.
2. Sensor Layout
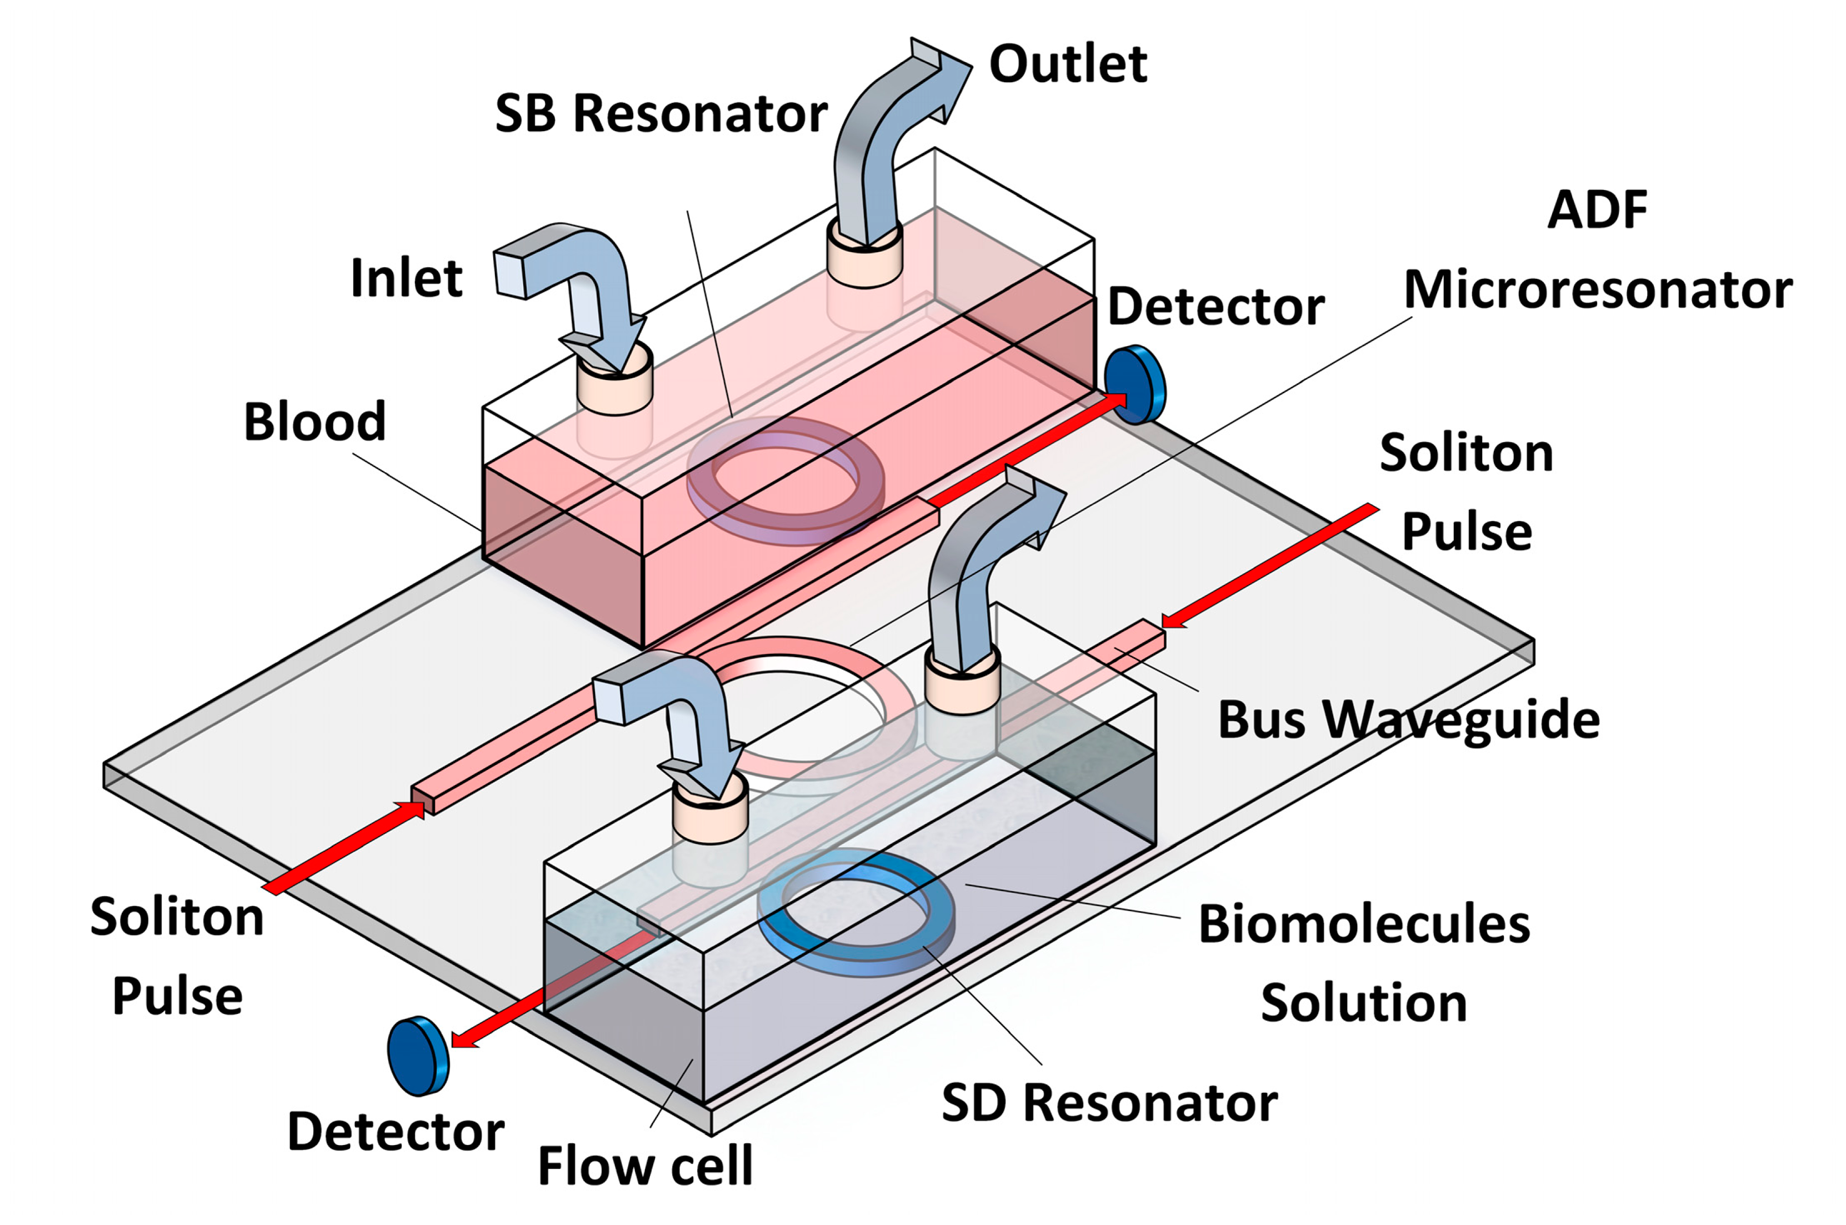
Based on the spectroscopic method known as optical light-mode spectroscopy (OWLS), the bio-molecule must be inserted into a flow cell at the inlet and flow out through the outlet. The small change in the refractive index changes the output intensity signal due to the absorption of pulse radiation by the biomolecules [13]. Figure 1 shows the suggested design for OWLS flow cells. This design consists of a double flow cell on which embedded single rings at the through and drop ports of the microresonator system have been installed.
The add-drop filter (ADF) [14] microring resonator system is attached into two single ring resonators called baseline resonator and detecting resonator. The middle add-drop resonator is used to form the interference between the entrance signals from baseline and detection rings which increases the sensitivity of proposed sensor rather than ADF sensors. Salmonella total antibodies are applied on the thin film flagellin layer and loaded on the baseline and detecting microring resonators and used as the probe for the detection of SB. In practice, the adsorption of Salmonella flagellin on the surface of the sensing resonator causes a change of effective refractive index in which brings about the shift of signals circulating in the interferometer ring.
The flagellin sample layer for Salmonella bacteria can be prepared by heat-induced depolymerization of the flagellar filament by incubation at 65 °C for 15 min. The waveguide (microring system) is placed into the head assembly of an OWLS optical scanner attached with the flow-through cuvette (flow cell) [15]{Delezoide, 2012 #2136}. In order to provide the specific and selective binding of the Salmonella bacterium into the flagellin layer, Salmonella total antibody is applied on the flagellin sample layer which is loaded on the ring waveguide. Salmonalla total antibody including Salmonella paratyphi A H Ab, Salmonella paratyphi B H Ab, Salmonella typhi H D Ab, Salmonella typhi O Vi Ab, and Salmonella typhi O D Ab is used for selective detection of Salmonella H, Type A, B, C and Salmonella O, Type Vi, and Salmonella O, Type D, respectively [16]. A specific and selective binding of the Salmonella bacterium can be obtained as SB can only reacts with its own Salmonalla total antibody. Thus, the detected wavelength shift due to the variation of the refractive index is specifically due to the reaction between antigen (Salmonella) and antibody.
The baseline resonator is placed within the blood with no SB for the reference signal (i.e., base line signal) of the output intensity and the detecting resonator is embedded inside the flow cell which contained blood with Salmonella bacteria. The detector is placed after the baseline and detecting units. In Figure 2, the sensing moment is illustrated by both single rings for detection proposes. In this configuration, the baseline and detecting units are placed within in two separated flow cells and able to reduce the detection time since the sensing operation for the baseline and detecting units can be conducted simultaneously.
The waveguide parameters used in this modeling based on the TiO2 as the core medium with refractive index 2.00 and the SiO2 as the cladding with refractive index 1.75 for the MRR system [17]. The average refractive index of Salmonella flagellin layer with thickness of 2.2 nm on the surface of the waveguide is n3 = 1.43 [3]. Two types of solutions are used for aqueous medium in modeling parameters. The concentration of 30 (g/L) of oxygenated and oxygenated hemoglobin solution with the refractive index of 1.339 [18] is used as the baseline solution (blood) and the concentration of 1 mg/mL Salmonella solution with refractive index of 1.33133 [3] used as contaminated blood in the detecting unit. The refractive index is changed due to the reaction between SB with its total antibody applied on the surface of the microresonator.
The optical soliton pulse laser is launched to the MRR system through the input port. The pulse travels inside the bus waveguide and a portion of the pulse couples into the ring resonator. For the baseline and detecting units, the outer refractive index (cladding material) is changed due to specific reaction between antigen (Salmonella) and its antibodies. The biomolecule solution undergoes a molecular binding process with the cladding material at the ring surface which changes the refractive index while the pulse propagates within the ring [19]. At the output ports, a change in intensity and a shift in wavelength are observed due to the change in the refractive index which determines the sensor sensitivity.
The scattering matrix method is used for the analytical formulation to analyze the behavior of the electric field propagation inside the MRR system. The baseline unit flow cell is contained blood sample with no SB whereas the detecting units flow cell contains the contaminant blood (mixed with SB). The change refractive index of these two biomolecule solutions (i.e., blood samples with and without SB) is the key parameter for the sensing. The Salmonella flagellin refractive index is considered as 1.43 for a thickness of 2.2 nm flagellin from the waveguide surface based on the previous research [3]. The radius of ADF micro resonator is 320 μm and the radius of the baseline and detecting microring resonators is150 μm. The real part of blood refractive index is expressed as:
The wavelength of 632.8 nm has been used for studying blood in the visible range. A soliton laser is used as the input pulse of the sensing due to the signal stability of solitons [20]. Another advantage is the confinement of the optical intensity within the waveguide due to the nonlinearity effect as compared to other lasers. The generation of the red soliton laser has been reported by Kudlinski et al. which has been employed for the blood analysis [21].
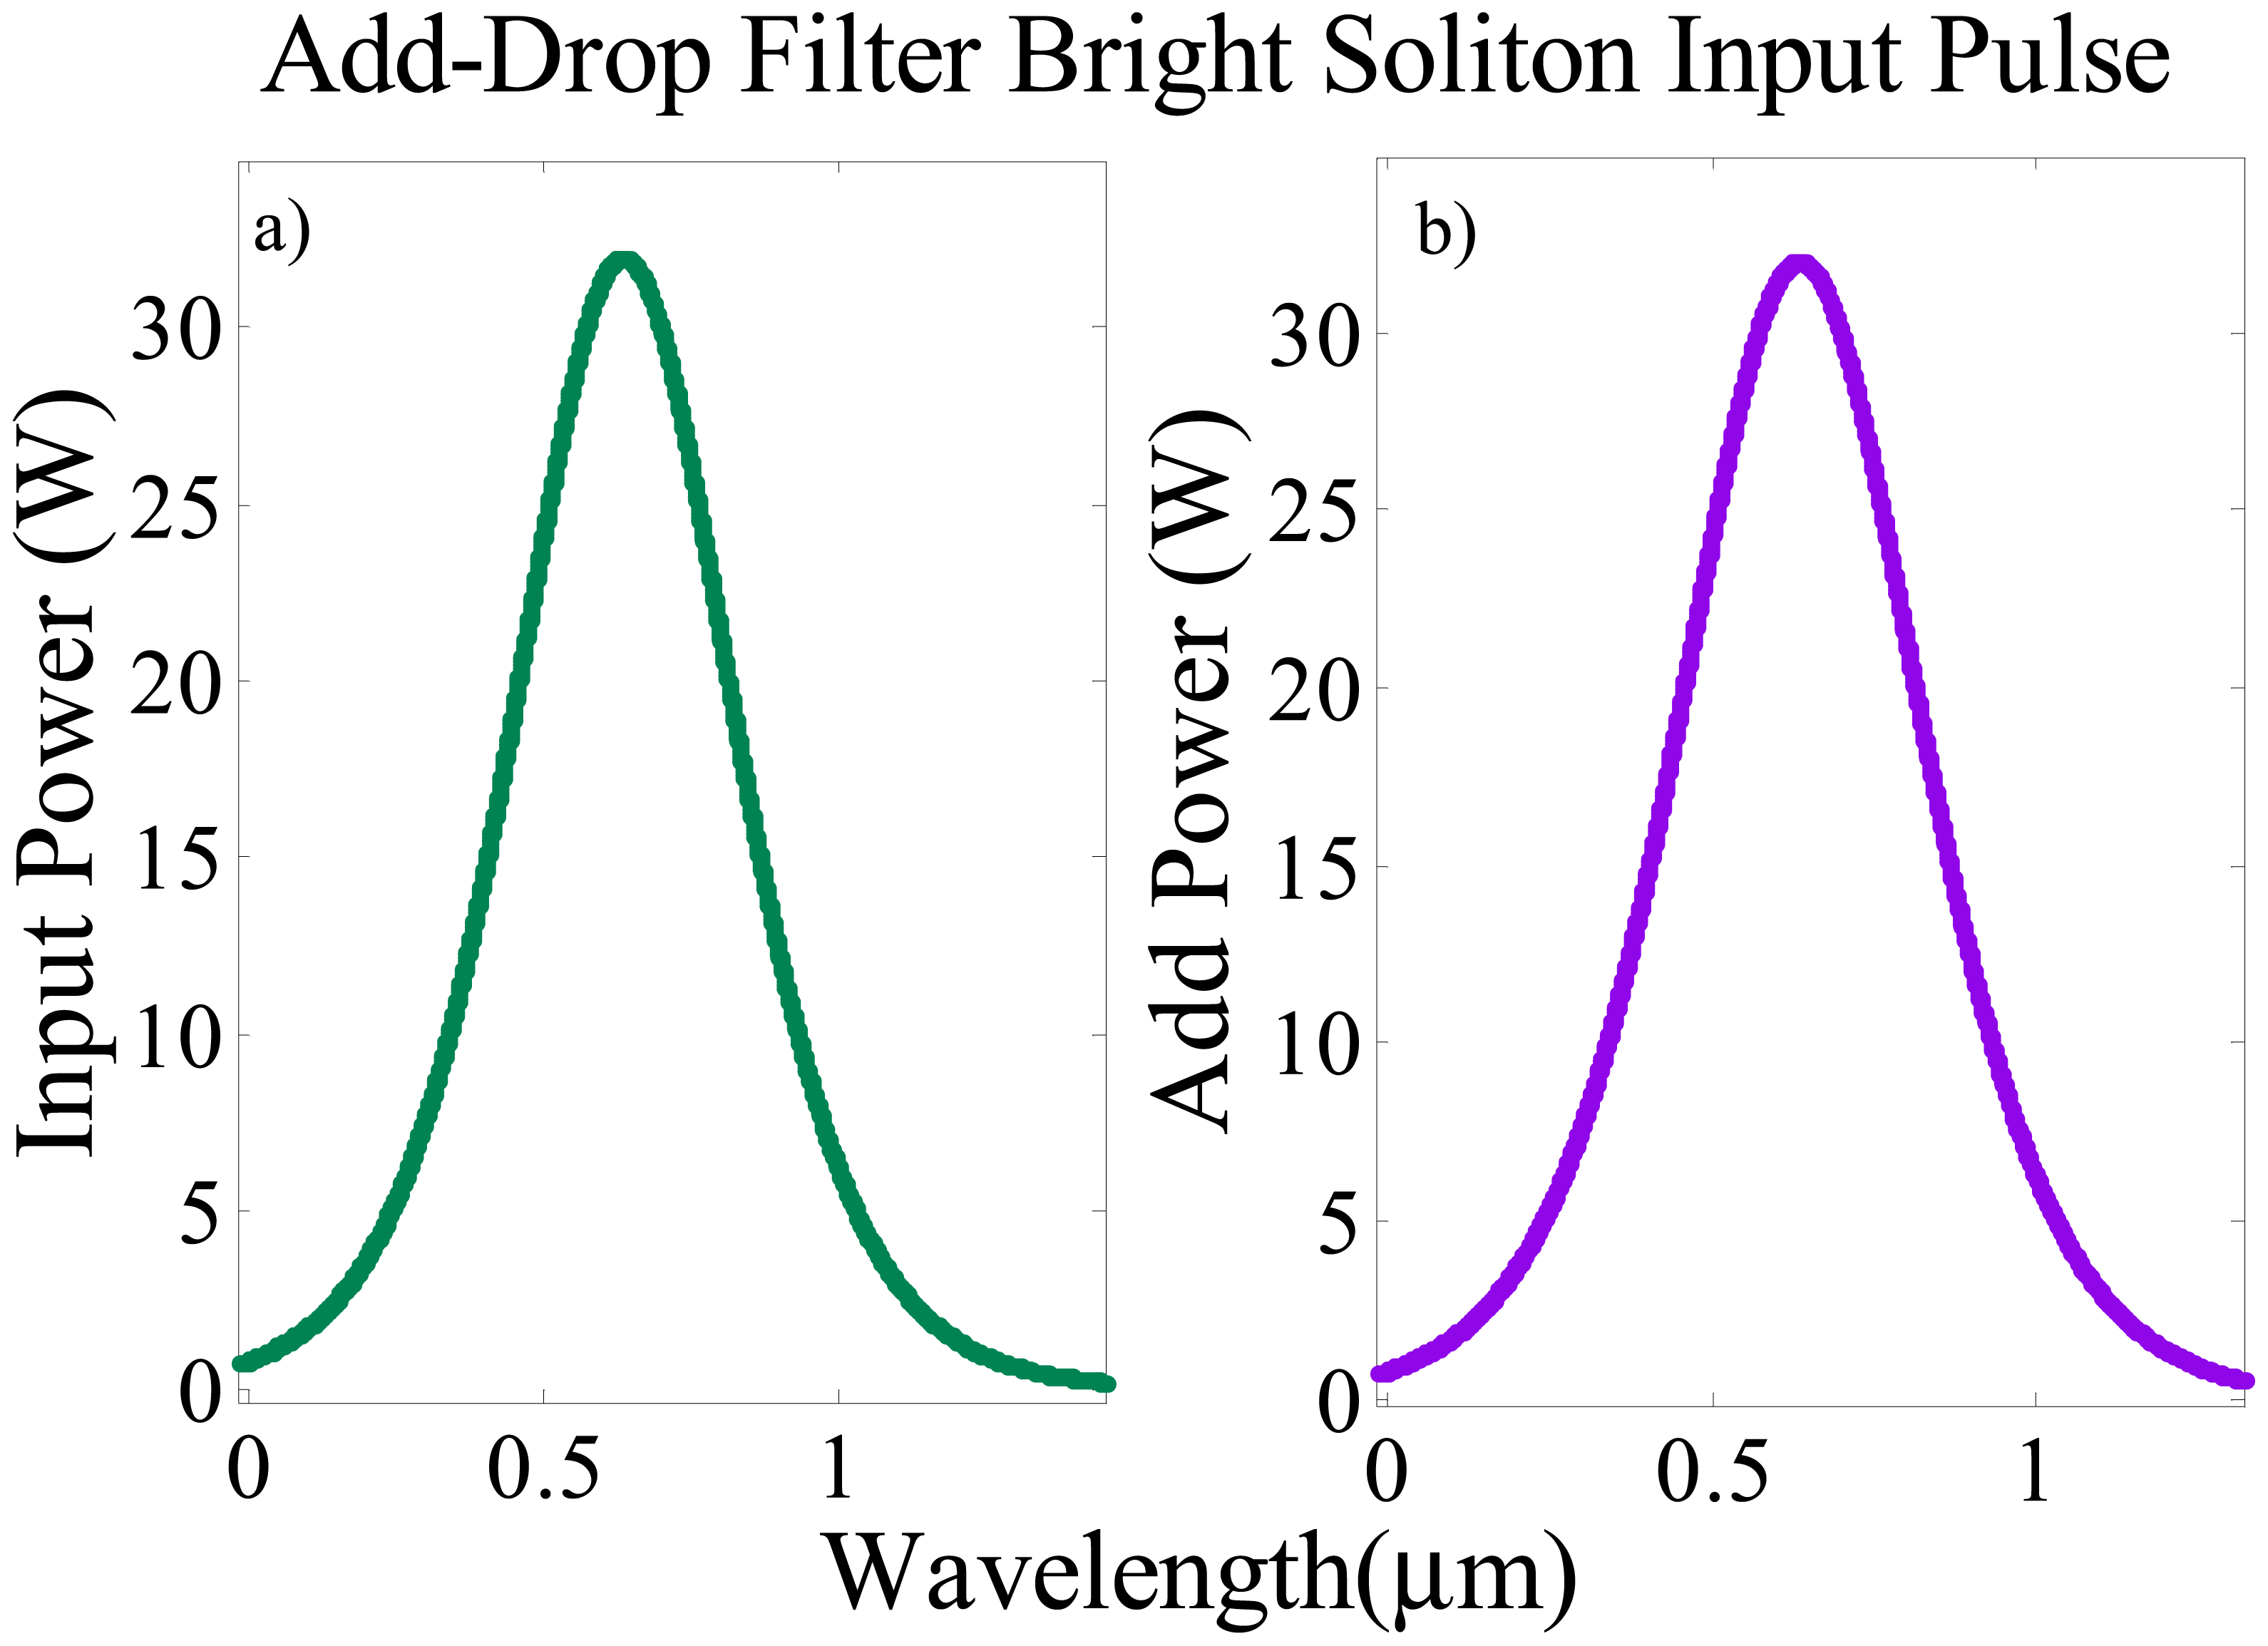
The bright soliton pulses as the input source are launched at the input and add ports of the system. The equation of the optically bright soliton pulse is expressed [22] as:
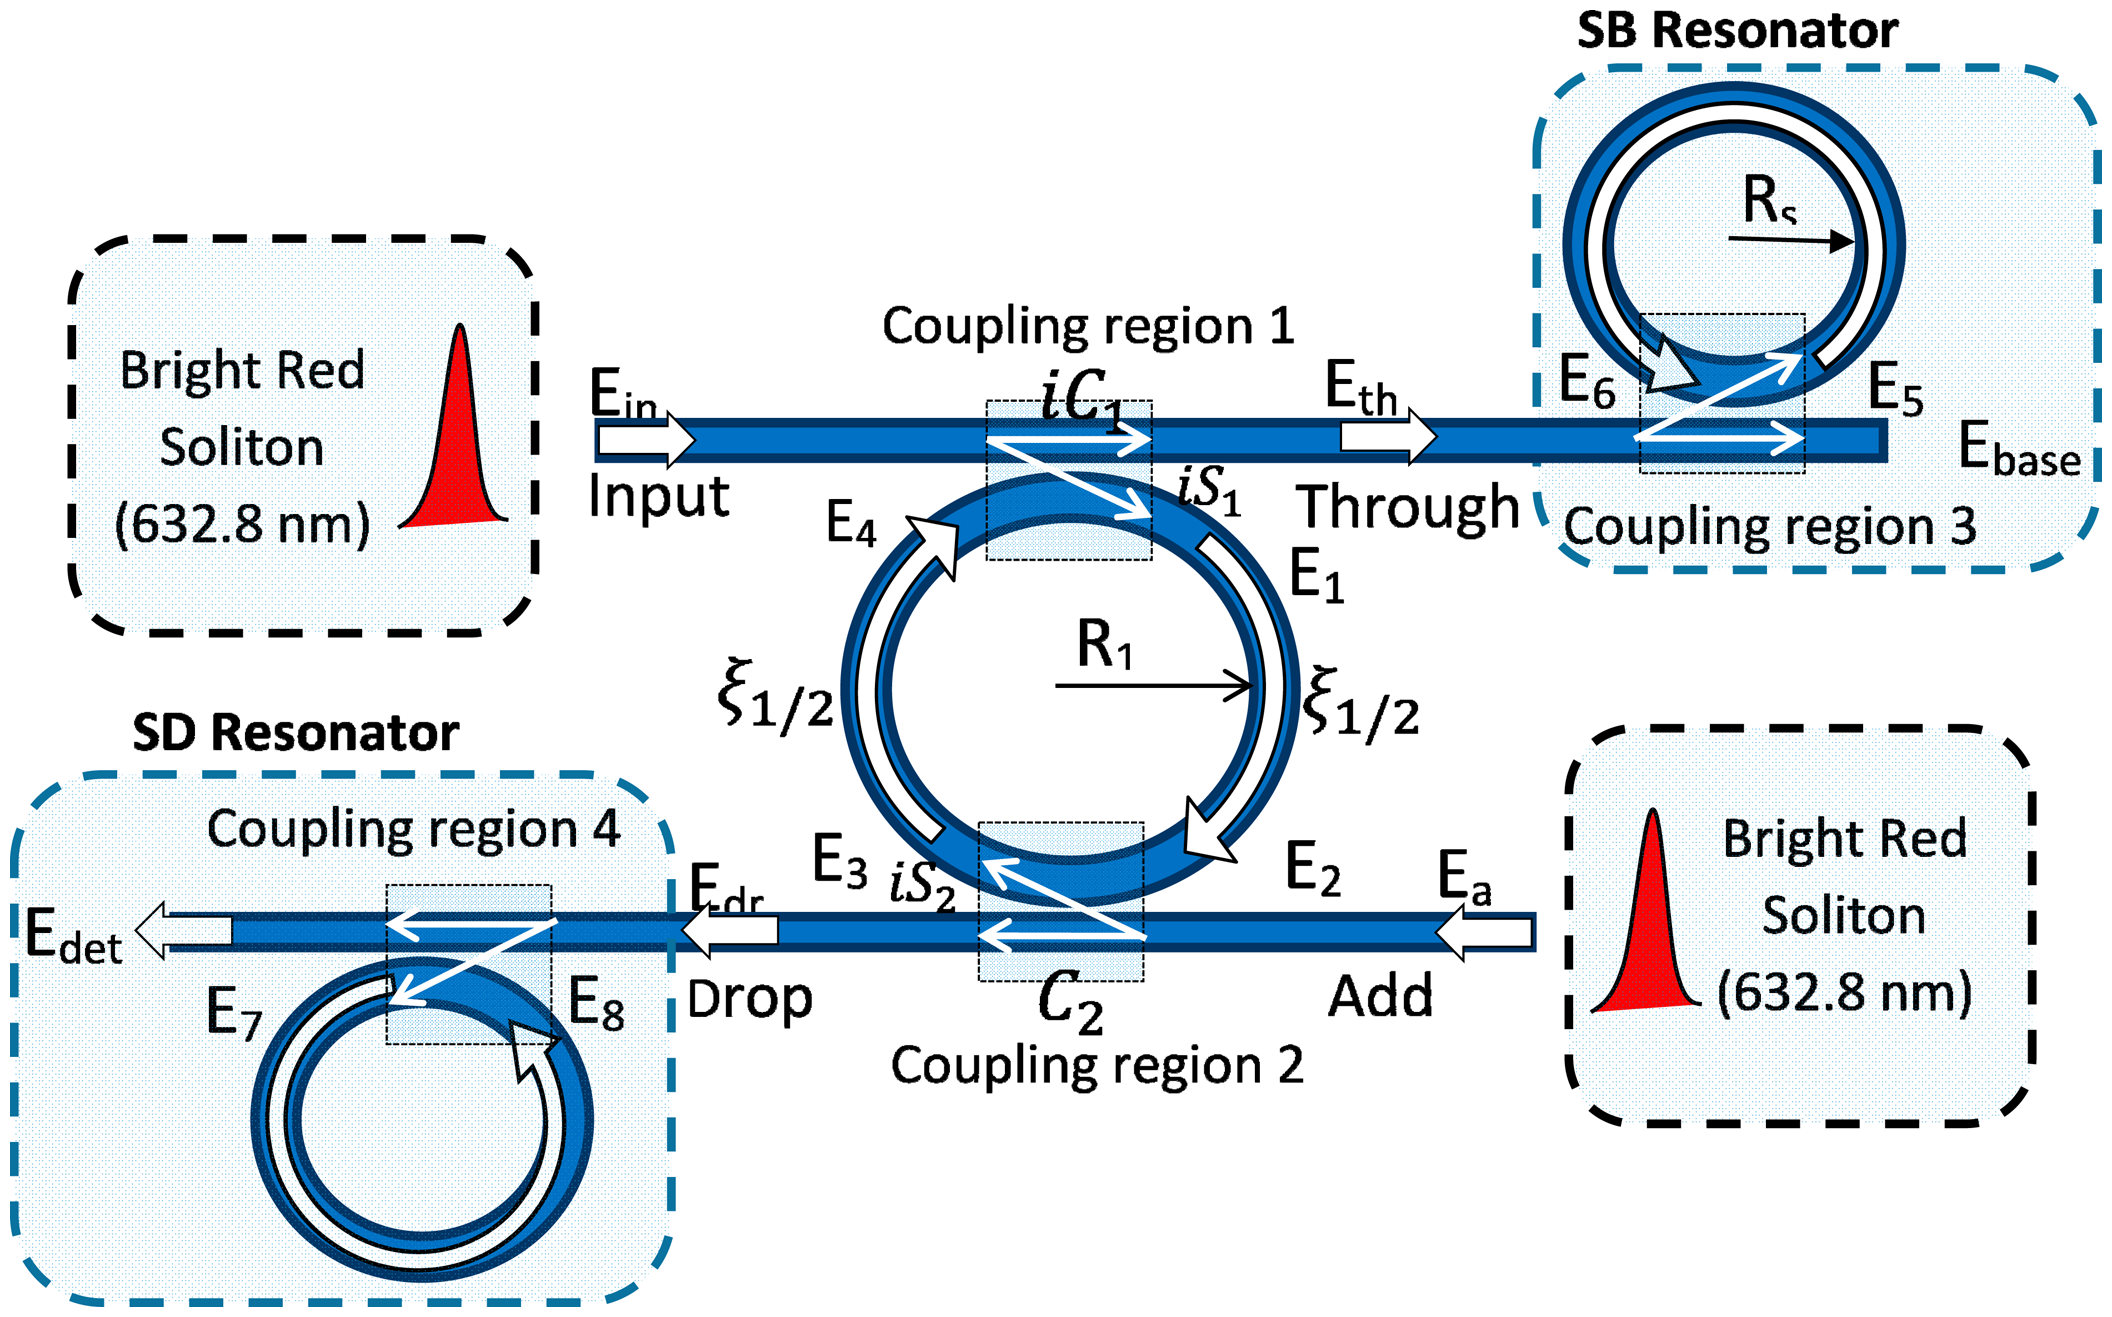
The analytical formulation is conducted based on the transfer matrix method to determine the transfer function of the electric field propagation inside the system. The inserted pulses at both ports propagate within the bus waveguide and a portion of the pulse (evanescent field) is coupled into the center ring resonator as E1 with cross coupling
Whereas, the other portion of the pulses from the input and add port travel through the bus waveguide to the through port and drop port respectively with self-coupling coefficient
The center ring of the ADF microring resonator acts as a signal filter. The self and cross coupling depends on the parameters coupling coefficient k1 and the coupler loss γ1 [23]. The pulse E1 propagates in clockwise direction along the ring and interferes with the portion of bright soliton pulse, E3, inside the ring resonator. Using the scattering matrix method, the relationship between the output and input port's electric fields of the ADF microring resonator can be determined as:
The output signal at the through and drop port are inserted into the baseline and detecting units, separately as shown in Figure 4. The baseline resonator provides the reference signal whereas the detecting resonator operates as the detection unit for the presence of SB in the bio-solution.
As the pulse travels in the bending waveguide (ring waveguide), the round trip loss α and phase shift ξ1/2 = exp(−αL/4−iKnL/2) changes [24], and the relationship between the propagating fields inside the center rings̶ can be determined as:
The electric field at the baseline and detecting units can be obtained:
The output intensity at through Iout and drop Idrp ports can be obtained as:
3. Results and Discussion
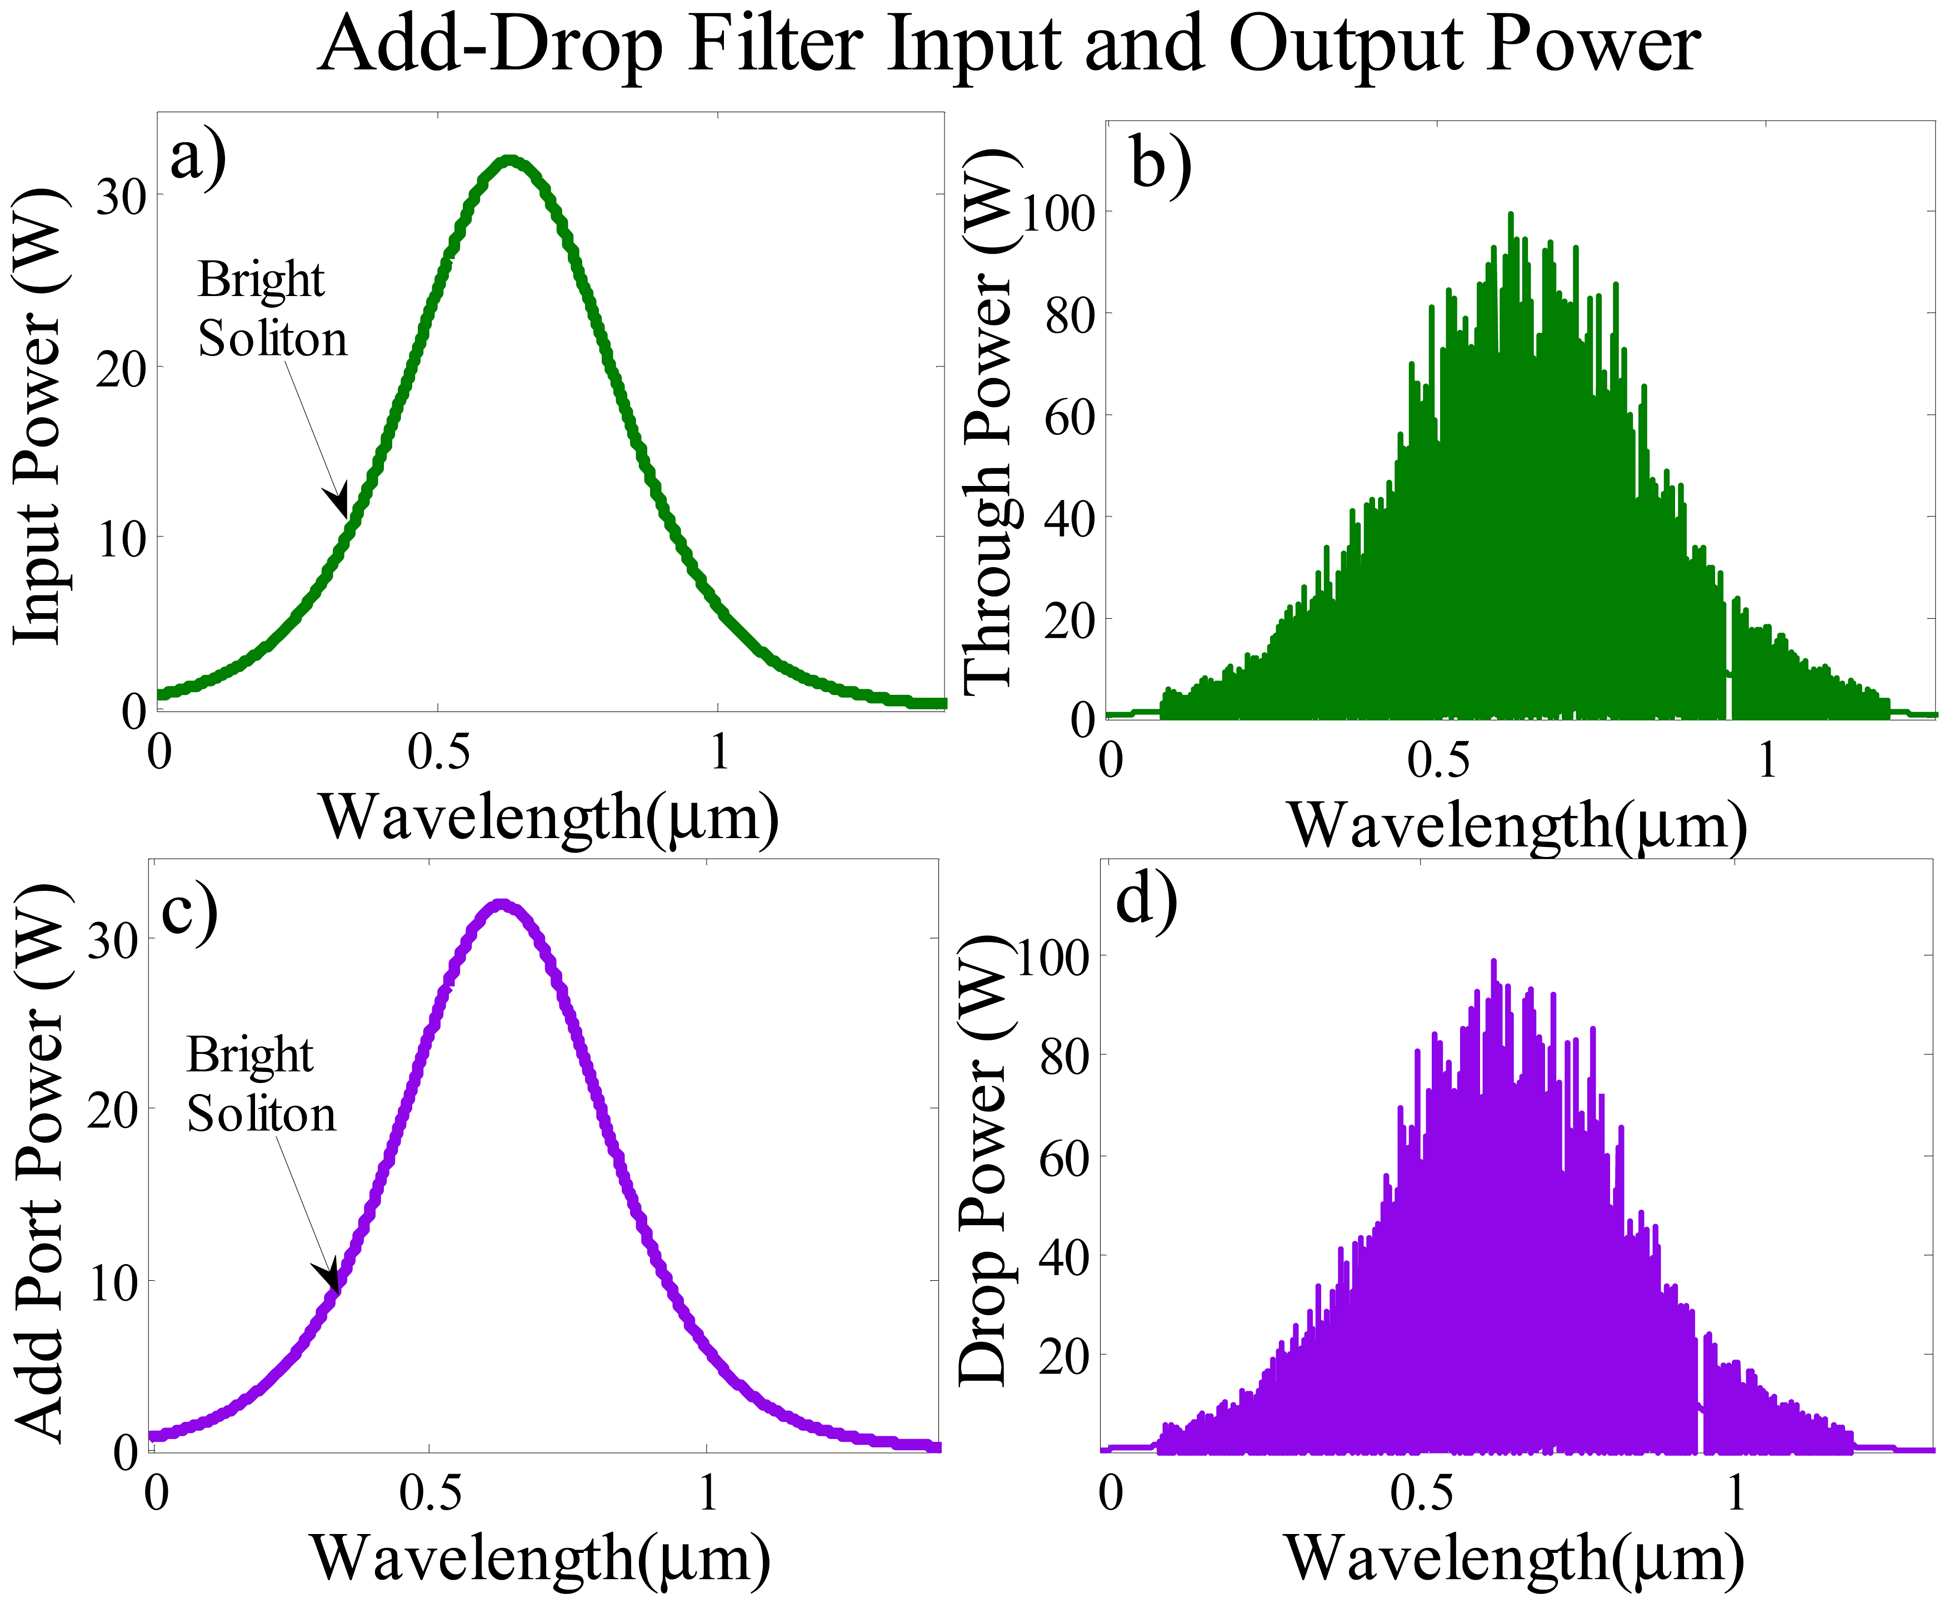
The input pulse consists of a bright soliton with wavelength 632.8 nm that is fed into the ADF microring resonator system as shown in Figure 4. The radius of the ADF ring R1 is 320 μm and the baseline and detecting microresonators have equal radii of Rs = Rd = 150 μm. In the simulation, the following optical parameters are used: coupling coefficient ratios k1:k2 = 50:50, ku:kd = 50:50, Aeff = 0.10 μm2, n2 = 4.2 × 10⁻¹⁷ m2/W [27], α = 0.4 dB/cm [28] and the lossless coupling, γ = 0, is supposed for the proposed system [29].
The output power at the through and drop ports of the system using the iterative method for 20,000 roundtrips are shown in Figure 5b,d. The chirped output signals are obtained at the through and drop ports due to nonlinearity effect as the pulse travels for 20,000 roundtrips which is the recommended distance to enhance nonlinearity effects [30].
In Figure 5 the output power at both through and drop ports are amplified up to 100 W from the 32 W bright red soliton input pulse due to the constructive interference in the centre ring with the incoming input pulse coupled from the bus waveguide. A uniform set of optical parameters including identical coupling coefficients, and coupler loss are used for the main ADF resonating system to attain similar output signals from through and drop ports as shown in Figure 5b,c. The similarity in the output filtered signals show the self-calibration of the sensing system at the through and drop ports.These identical chopped signals are launched simultaneously into the detection and baseline units which act as sensing probe for the proposed biosensor.
Figure 6 shows the output signals at the baseline and detection ports. The bright red soliton pulse propagates within two side rings of ADF resonator which is immersed in the layer of human blood with and without Salmonella. In Figure 6, the output intensities at the detection and baseline ports are simulated for the wavelength range from 0 nm to 1200 nm where the blue lines represent the output intensity of the baseline ring resonator at the through port for blood samples without SB and the red lines show the output intensity of the detecting ring resonator at the drop port for contaminated blood. The Figure 6a shows the change of nonlinearity due to the presence of Salmonella bacteria and its effect on the overall output intensity of input solitons in the baseline and the detecting units. As demonstrated in Figure 6a the maximum resonance intensities for baseline and detection port are labeled as max IRB and max IRD respectively. The obtained intensity at the detection port with SB is 202.3 W/m2, which is higher than the intensity of the baseline unit at 199.3 W/m2.
Generally, microring resonators are studied using two interrogation approaches; the change in intensity and shift in wavelength [31]. In terms of intensity, an increase in the signal intensity in the presence of SB in blood is identified by 3 W/m in comparison to the blood without SB infection. Figure 6b,c is the enlargements of Figure 6a in the range 534.98 nm to 645.72 nm (visible region) and 1284.98 nm to 1315.03 nm (infrared region), respectively. Figure 6b shows the shift in the wavelength of maximum output peak towards shorter wavelength, Δλ = 95.50 nm, which is obtained from the difference between the max IRB at 636.8 nm and the max IRD at 543.3 nm.
The baseline and detecting units signals in Figure 6c indicate that the last point of bistablity [25] for blood without SB is at 1311 nm with the intensity of 0.551 W/m2 while for detecting unit it is at 1295 nm with intensity of 0.638 W/m2. Thus the wavelength shift and intensity variation in the infrared regime are 16.00 nm and 0.086 W/m, respectively. The DR-ADF microrng resonator provides a 95.50 nm shift in wavelength Δλ between baseline and detection output resonance intensity which is better than that if a conventional ADF biosensor [32]. The interaction length between light and biomolecules is proportional to sensitivity [1]. The DR-ADF microresonator provides a longer interaction length between light and biomolecules which brings about higher sensitivity. The measured interaction length of the proposed system is larger than that of other conventional waveguide biosensors [33,34] as it operates in 18.85 m along 20,000 roundtrips. Based on Equation (7) the change in refractive index is 9.9 × 10⁻⁴ which leads to achieving ultra-high-sensitivity detection of 95,500 nm/RIU. This sensitivity is higher than that of the microsphere resonating biosensor [35]. The limit of detection is in the order of 1 × 10⁻⁸ RIU which is better than that of the Vernier cascade ring biosensor [11].
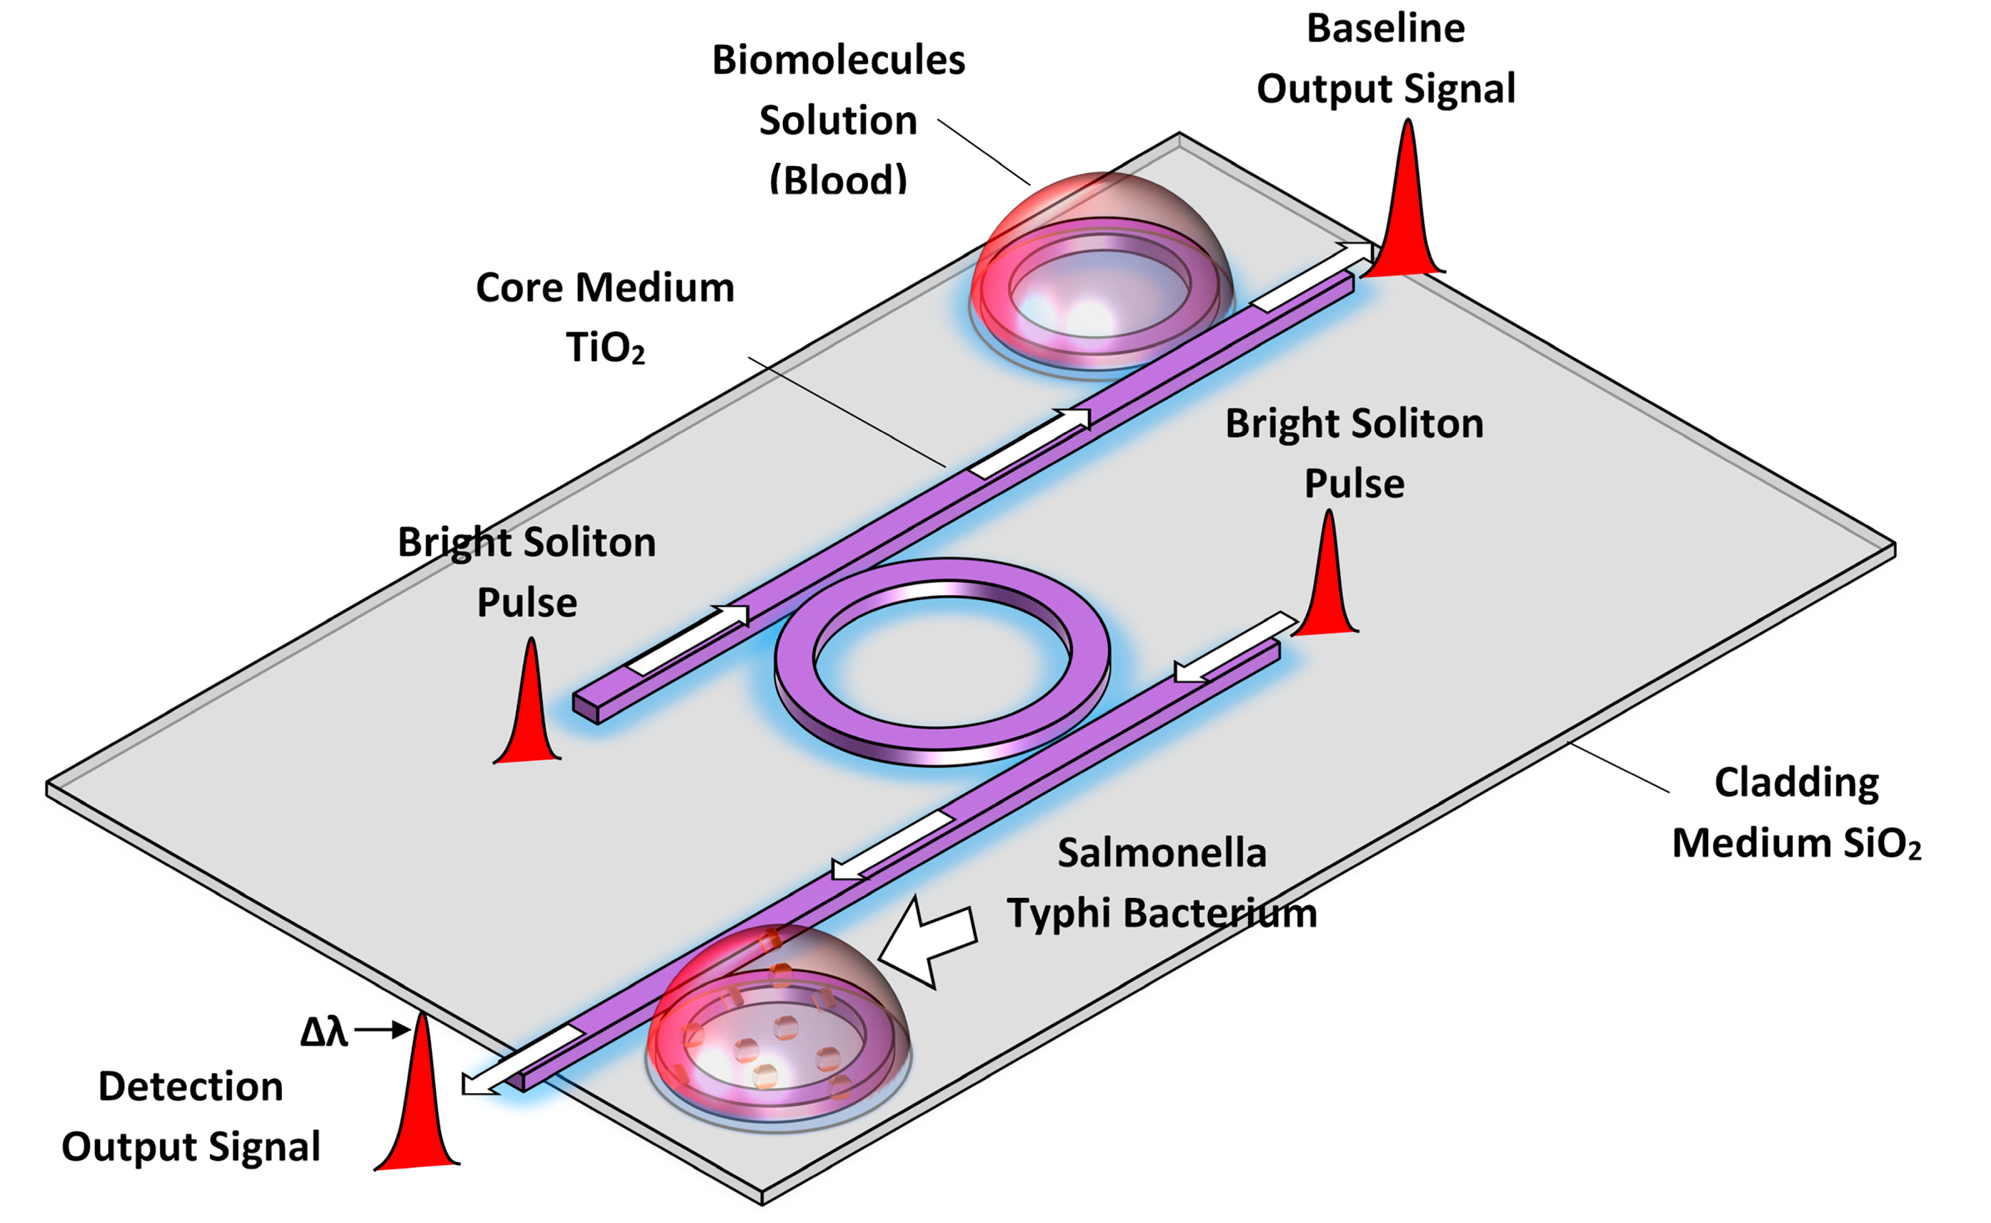
The shift in the wavelength due to the presence of SB in the blood is caused by the interaction of the optical evanescent field with the external molecules on the top surface of the cladding waveguide as shown in Figure 7. The thin film flagellin layer coated on the cladding waveguide and Salmonella total antibodies are applied on this flagellin layer. Among the various kinds of biomolecules in the test sample (blood with SB) only Salmonella bacteria can bind with Salmonella antibodies. This leads to a change in the refractive index of the waveguide and enhances the nonlinearity effect of the system which causes the shift in wavelength of output signal [36]. In the other words, the proposed system can detect the presence of SB in blood with the wavelength shift in the maximum peaks and the wavelength shift in the last points of bistability. The main advantage of our proposed sensor is that it satisfies both intensity and wavelength interrogation approaches in comparison with other optical sensors.
Figure 7 shows a schematic diagram of the red soliton pulse propagation within a rectangular microring waveguide. As the pulse passes through the core, the evanescent field of the pulse interacts with the cladding medium. Since a portion of the red soliton pulse (evanescent field) reaches the outer medium (cladding and the blood), the presence of the SB within the blood causes a change of the pulse behavior while travelling through it as compared to the normal blood. The interaction of the Salmonella flagellin molecules with the surface of the cladding provides the binding process between molecules which can heat the cladding surface and provides change the effective refractive index of the system [36]. Thus, the nonlinearity effect (Equation (7)) of the soliton pulse propagation in the system is enhanced. The resonances intensity of the system changes and shift of the maximum resonance intensity wavelength is due to the SB infection in human blood.
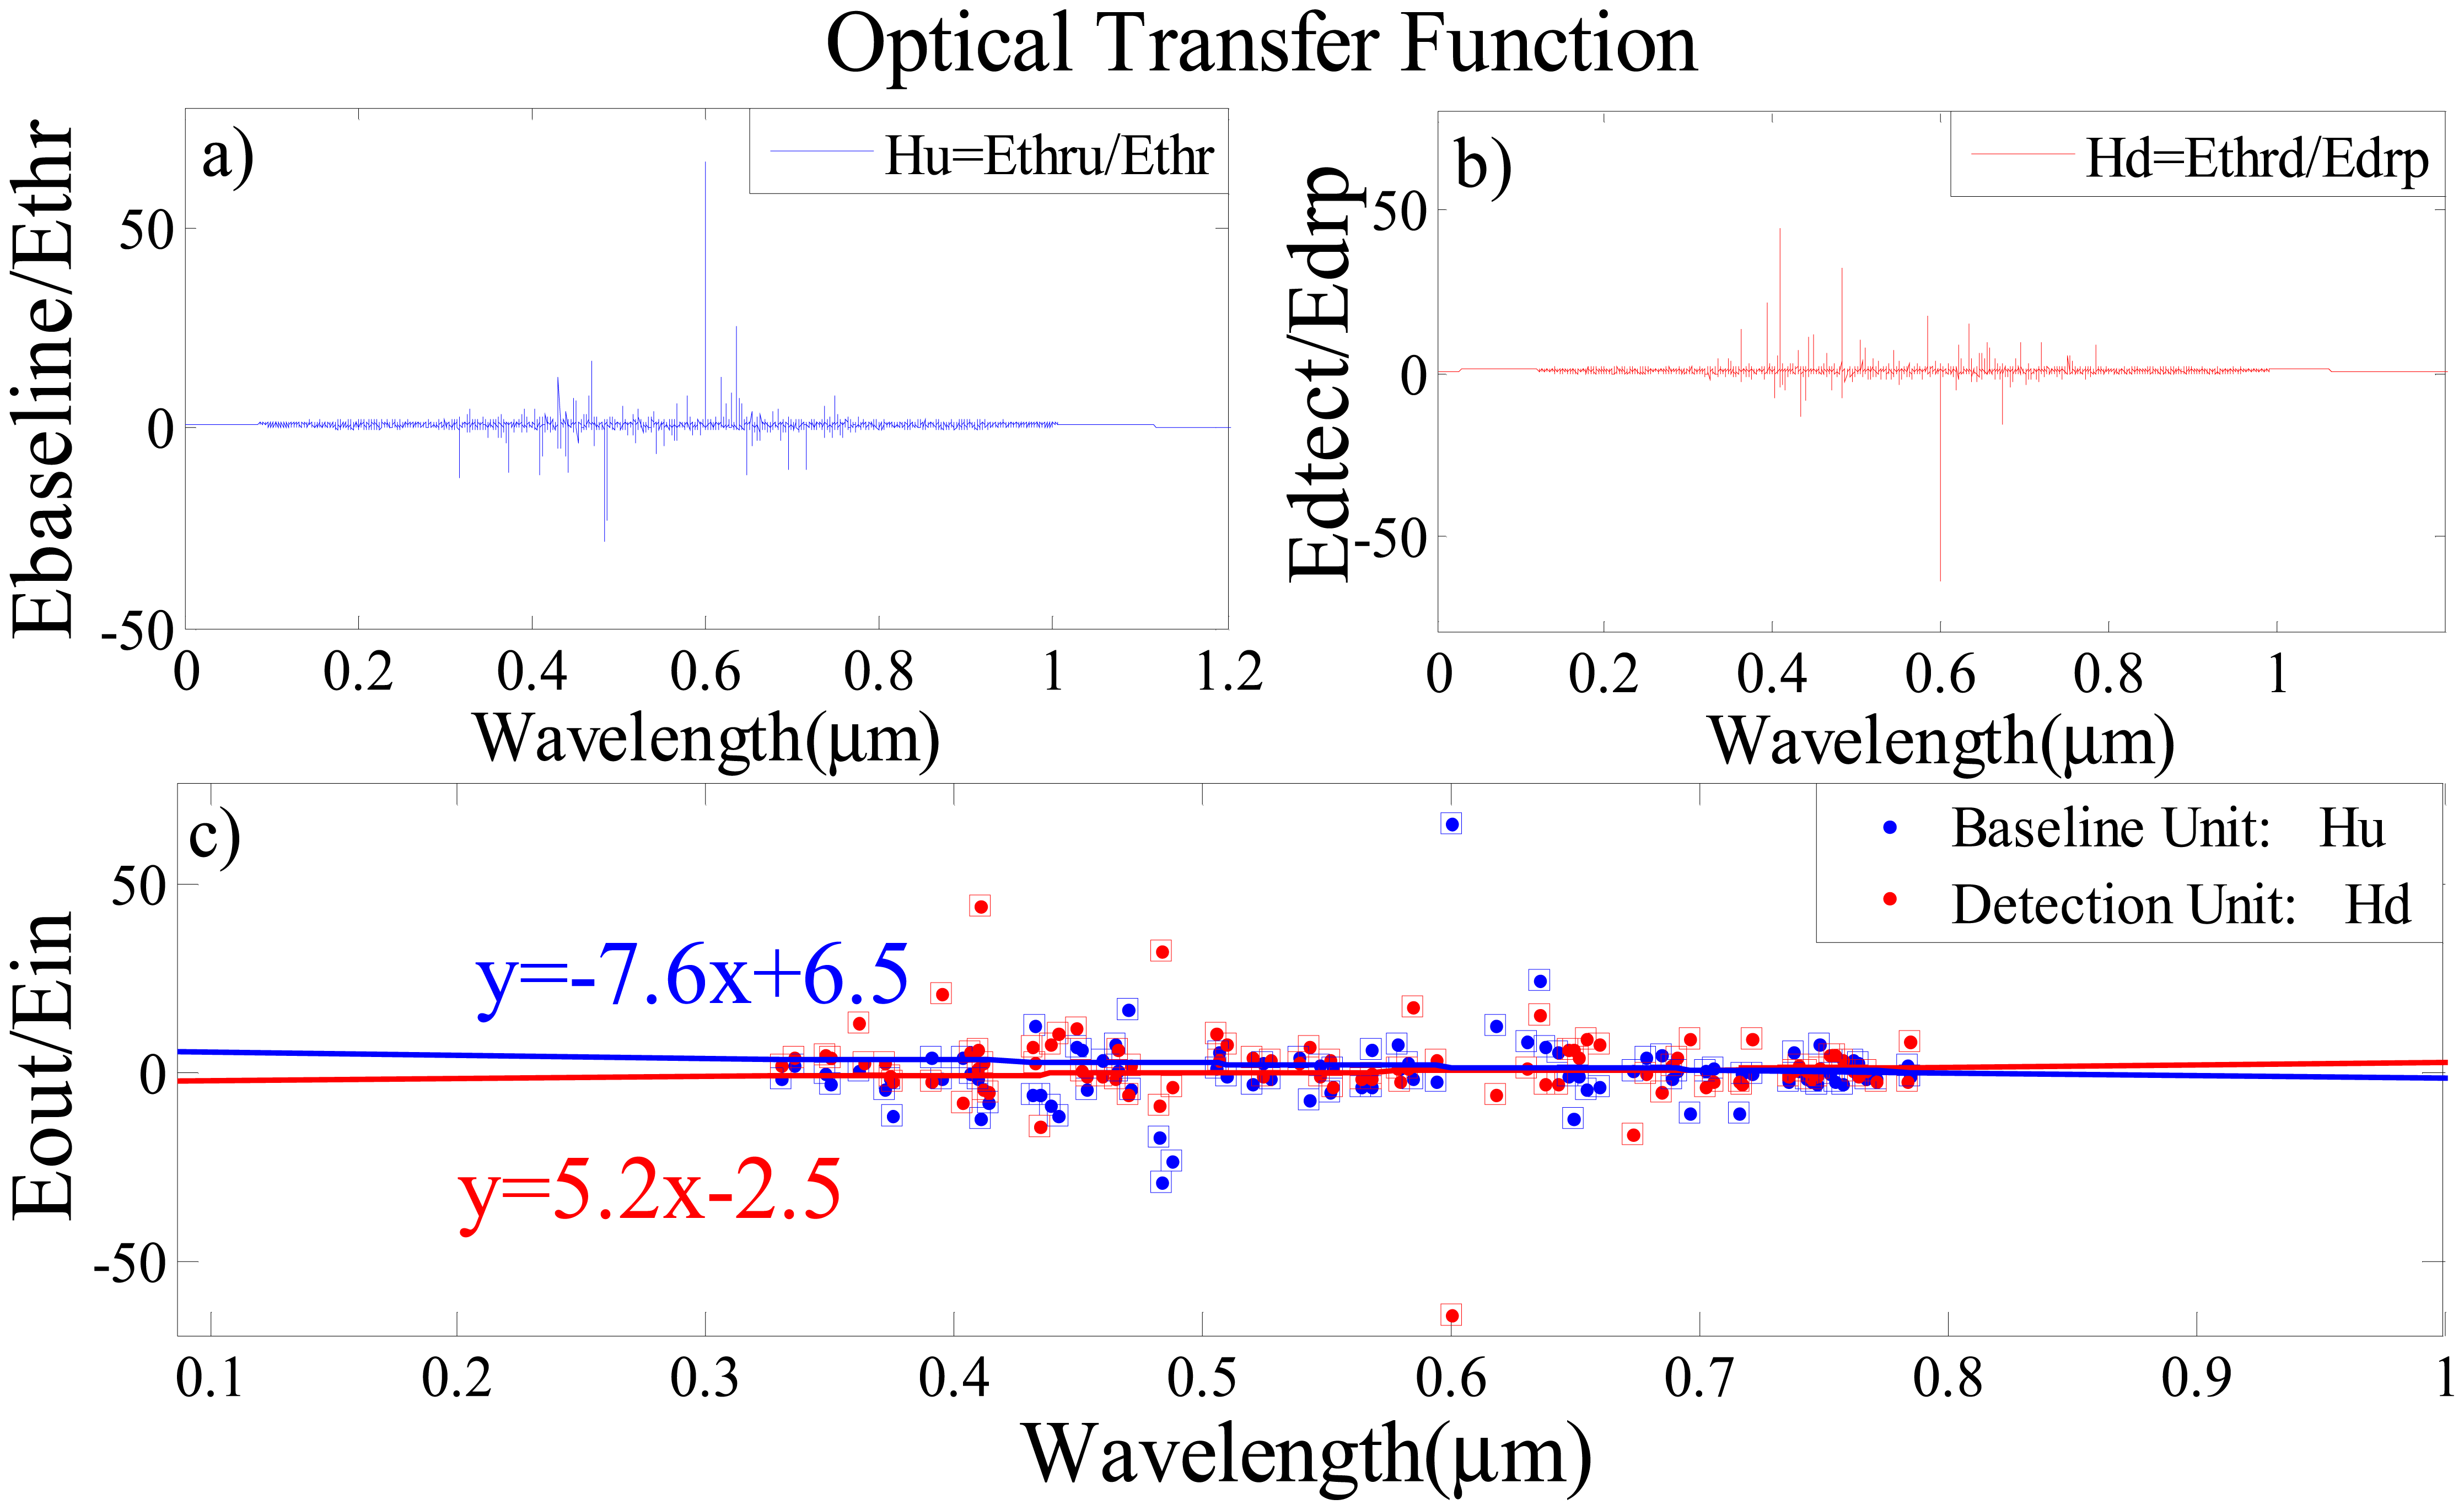
The optical transfer function (OTF), which is the output to input transmittance relation, versus wavelength for baseline and detection units are also simulated to obtain the sensing line for each unit. The OTF of baseline unit is demonstrated in Figure 8a which shows the relationship between the output signal from baseline unit (Figure 6a blue lines) and the launched filterd signals from ADF to this unit (Figure 5b). In the same procedure the relationship between the output signal from the detecting unit (Figure 6a red lines) and the launched filtered signals from the ADF into the detecting unit (Figure 5d) are simulated in Figure 8b. Two identical soliton signals are fed into the input and add ports of the sensor. Firstly, the signals are coupled into the middle ADF microresonator ring via k1 and k2 couplers. After meeting the resonant condition of the middle ADF ring, the output filtered signals are coupled into the baseline and detection single microresonators. The resonance conditions of the detection and baseline ring are changed based on the variation of the refractive index due to the attachment of Salmonella bacteria onto its antibody on the surface of the microresonators. This leads to a change in the spectrum of the optical transfer function for the baseline and detection resonators as shown in Figure 8a,b. In Figure 8c, linear least square curve fitting is used for OTF of the baseline and detecting units with considering the wavelength position of peaks points for the signals of each unit. The dots show the peak points that were measured from the changes in the refractive index due to the presence of SB, and the solid line represents the linear least square curve fitting for these points. The detection of SB can be tested by checking the slope variation of these sensing linear lines. As shown in Figure 8c for blood without SB, this line has negative slope (blue line) and the presence of the Salmonella bacteria brings about the change of slope from negative to positive.
The detection of the SB within blood is confirmed using the first order perturbation theory as the polarizability is proportional to the protein molecular weight [37]. The excess polarizability of Salmonella flagellin αex = 4.48 × 10⁻²⁰, ε0 is calculated by using Salmonella flagellin molar mass [33] which is used to characterize the Salmonella flagellin in the first order perturbation theory as Δλ/λ = αexσs/ε0 (n12 − n22) R. Here, ε0 represents the vacuum permittivity, σs is the surface density for Salmonella flagellin [38], n1 is the refractive index of MRR medium, R is the radius of the ring and n2 is the refractive index of the Salmonella flagellin. The detection of the Salmonella bacteria from the expected wavelength shift with respect to the center wavelength of the input soliton is quite concordant with the expected molecular polarizability 1.5 × 10⁻⁵ which is obtained by Salmonella flagellin properties. The detected wavelength shift due to the variation of the waveguide refractive index is specifically due to the binding between antigen (Salmonella bacteria) and applied Salmonella total antibody on the loaded flagellin sample layer coated on the ring waveguide.
4. Conclusions/Outlook
In conclusion, a biosensing system consisting of microring resonators is introduced for detection of Salmonella bacteria in the human blood. The visible red soliton laser with center wavelength 632.8 nm is used as the input pulse for the biomolecule detection. The analytical formulation is conducted for 20,000 roundtrips pulse propagation in the microring resonator system by using the scattering matrix and iterative methods. The wavelength shift of the maximum resonance intensity is obtained in the presence of Salmonella bacteria. The simulation results show that a 95.50 nm shift towards shorter wavelength is obtained in visible range, and the shift in wavelength as 16.00 nm in the infrared range with resolution of 0.01 nm. The wavelength shift is due to the change in the effective refractive index caused by the SB in the blood. The main advantage of our proposed sensor is that it satisfies both intensity and wavelength interrogation approaches in comparison with other optical sensors and can be employed for a high sensitive and fast detection of Salmonella bacteria.
The authors would like to thank the Institute of Advanced Photonics Science, Nanotechnology Research Alliance, Universiti Teknologi Malaysia (UTM) and King Mongkut's Institute of Technology (KMITL), Thailand for providing research facilities. This research work has been supported by UTM's Tier 1(Q.J130000.2509.06H46)/Flagship (Q.J130000.2426.00G26 & Q.J130000.2431.00G29) research Grants.
Author Contributions
Mahdi Bahadoran, Ahmad Fakhrurrazi Ahmad Noorden, Kashif Chaudhary, Faeze Sadat Mohajer and Muhammad Safwan Aziz have been contributed for writing, simulating and analyzing the results. Shahrin Hashim, Jalil Ali and Preecha Yupapin are the project supervisors.
Conflicts of Interest
The authors declare no conflict of interest.
References
- Zourob, M.; Lakhtakia, A. Optical Guided-Wave Chemical and Biosensors II; Springer: Berlin/Heidelberg, Germany, 2010; p. 261. [Google Scholar]
- Marty, M.T.; Sloan, C.D.K.; Bailey, R.C.; Sligar, S.G. Nonlinear analyte concentration gradients for one-step kinetic analysis employing optical microring resonators. Anal. Chem 2012, 84, 5556–5564. [Google Scholar]
- Kovacs, N.; Patko, D.; Orgovan, N.; Kurunczi, S.; Ramsden, J.J.; Vonderviszt, F.; Horvath, R. Optical anisotropy of flagellin layers: In situ and label-free measurement of adsorbed protein orientation using OWLS. Anal. Chem 2013, 85, 5382–5389. [Google Scholar]
- Benson, T.M.; Boriskina, S.V.; Sewell, P.; Vukovic, A.; Greedy, S.C.; Nosich, A.I. Micro-Optical Resonators for Microlasers and Integrated Optoelectronics. In Frontiers in Planar Lightwave Circuit Technology; Springer: Berlin/Heidelberg, Germany, 2006; pp. 39–70. [Google Scholar]
- Werquin, S.; Goes, A.; Dubruel, P.; Bienstman, P. Silicon-on-Insulator microring resonators for photonic biosensing applications. Proceedings of the 15th International Conference on Transparent Optical Networks (ICTON), Cartagena, Spain, 23–27 June 2013.
- Delezoide, C.; Lautru, J.; Zyss, J.; Ledoux-Rak, I.; Nguyen, C.T. Vertically coupled polymer microresonators for optofluidic label-free biosensors. Proceedings of the International Society for Optics and Photonics SPIE OPTO, San Francisco, CA, USA, 21 January 2012.
- Kosterev, A.; Dong, L.; Thomazy, D.; Tittel, F.; Overby, S. QEPAS for chemical analysis of multi-component gas mixtures. Appl. Phys. B 2010, 101, 649–659. [Google Scholar]
- Densmore, A.; Vachon, M.; Xu, D.X.; Janz, S.; Ma, R.; Li, Y.H.; Lopinski, G.; Delâge, A.; Lapointe, J.; Luebbert, C.C.; et al. Silicon photonic wire biosensor array for multiplexed real-time and label-free molecular detection. Opt. Lett 2009, 34, 3598–3600. [Google Scholar]
- Blanco, F.; Agirregabiria, M.; Berganzo, J.; Mayora, K.; Elizalde, J.; Calle, A.; Dominguez, C.; Lechuga, L.M. Microfluidic-optical integrated CMOS compatible devices for label-free biochemical sensing. J. Micromech. Microeng 2006, 16. [Google Scholar] [CrossRef]
- Claes, T.; Molera, J.G.; de Vos, K.; Schachtb, E.; Baets, R.; Bienstman, P. Label-free biosensing with a slot-waveguide-based ring resonator in silicon on insulator. Photonics J. IEEE 2009, 1, 197–204. [Google Scholar]
- Claes, T.; Bogaerts, W.; Bienstman, P. Experimental characterization of a silicon photonic biosensor consisting of two cascaded ring resonators based on the Vernier-effect and introduction of a curve fitting method for an improved detection limit. Opt. Exp 2010, 18, 22747–22761. [Google Scholar]
- Dai, D. Highly sensitive digital optical sensor based on cascaded high-Q ring-resonators. Opt. Exp 2009, 17, 23817–23822. [Google Scholar]
- Grego, S.; Stoner, B.R. Wavelength interrogation of optical waveguide biosensors in the input grating coupler configuration. Integr. Opt.: Devices Mater. Technol. XIII 2009, 72181A. [Google Scholar] [CrossRef]
- Heebner, J.E.; Chak, P.; Pereira, S.; Sipe, J.E.; Boyd, R.W. Distributed and localized feedback in microresonator sequences for linear and nonlinear optics. JOSA B 2004, 21, 1818–1832. [Google Scholar]
- Delezoide, C.; Lautru, J.; Zyss, J.; Ledoux-Rak, I.; Nguyen, C.T. Vertically coupled polymer microresonators for optofluidic label-free biosensors. Integr. Opt.: Devices Mater. Technol. XVI 2012, 8264. [Google Scholar] [CrossRef]
- Pui, C.; Wong, W.; Chai, L.; Tunung, R.; Jeyaletchumi, P.; Hidayah, N.; Ubong, A.; Farinazleen, M.; Cheah, Y.; Son, R. Salmonella: A foodborne pathogen. Int. Food Res. J 2011, 18, 465–473. [Google Scholar]
- Schmitt, K.; Hoffmann, C. High-refractive-index Waveguide Platforms for Chemical and Biosensing. In Optical Guided-wave Chemical and Biosensors I; Springer: Berlin/Heidelberg, Germany, 2009; pp. 21–54. [Google Scholar]
- Zhernovaya, O.; Sydoruk, O.; Tuchin, V.; Douplik, A. The refractive index of human hemoglobin in the visible range. Phys. Med. Biol 2011, 56, 4013–4021. [Google Scholar]
- Pavesi, L.; Fauchet, P.M. Biophotonics; Springer: Berlin/Heidelberg, Germany, 2008. [Google Scholar]
- Tamee, K.; Visessamit, J.; Yupapin, P. Multicolor Solitons for Biosensors. J. Biosens. Bioelectr 2013, 4, e122. [Google Scholar]
- Kudlinski, A.; Mussot, A. Visible cw-pumped supercontinuum. Opt. Lett 2008, 33, 2407–2409. [Google Scholar]
- Agrawal, G.P. Nonlinear fiber optics: Its history and recent progress [Invited]. J. Opt. Soc. Am. B. Opt. Phys. 2011, 28, A1–A10. [Google Scholar]
- Suwanpayak, N.; Jalil, M.A.; Teeka, C.; Ali, J.; Yupapin, P.P. Optical vortices generated by a PANDA ring resonator for drug trapping and delivery applications. Biomed. Opt. Exp 2011, 2, 159–168. [Google Scholar]
- Bahadoran, M.; Afroozeh, A.; Ali, J.; Yupapin, P.P. Slow light generation using microring resonators for optical buffer application. Opt. Eng 2012, 51, 044601. [Google Scholar]
- Bahadoran, M.; Ali, J.; Yupapin, P.P. Graphical Approach for Nonlinear Optical Switching by PANDA Vernier Filter. IEEE Photonics Technol. Lett 2013, 25, 1470–1473. [Google Scholar]
- Heebner, J.; Grover, R.; Ibrahim, T.A. Optical Microresonators: Theory, Fabrication, and Applications; Springer: Berlin/Heidelberg, Germany, 2008; p. 37. [Google Scholar]
- Apiratikul, P.; Rossi, A.M.; Murphy, T.E. Nonlinearities in porous silicon optical waveguides at 1550 nm. Opt. Exp 2009, 17, 3396–3406. [Google Scholar]
- D'Orazio, A.; de Sario, M.; Mescia, L.; Petruzzelli, V.; Prudenzano, F.; Chiasera, A.; Montagna, M.; Tosello, C.; Ferrari, M. Design of Er3+ doped SiO2-TiO2 planar waveguide amplifier. J. Non-Cryst. Solids 2003, 322, 278–283. [Google Scholar]
- Mikroulis, S.; Simos, H.; Roditi, E.; Syvridis, D. Ultrafast all-optical AND logic operation based on four-wave mixing in a passive InGaAsP-InP microring resonator. IEEE Photonics Technol. Lett 2005, 17, 1878–1880. [Google Scholar]
- Okamoto, K. Fundamentals of Optical Waveguides; Academic Press: Waltham, MA, USA, 2010; p. 199. [Google Scholar]
- Jin, L.; Li, M.; He, J.J. Highly-sensitive silicon-on-insulator sensor based on two cascaded micro-ring resonators with vernier effect. Opt. Commun 2011, 284, 156–159. [Google Scholar]
- Yalcin, A.; Popat, K.C.; Aldridge, J.C.; Desai, T.A.; Hryniewicz, J.; Chbouki, N.; Little, B.E.; King, O.; Van, V.; Chu, S.; et al. Optical sensing of biomolecules using microring resonators. IEEE J. Sel. Top. Quantum Electron 2006, 12, 148–155. [Google Scholar]
- McDermott, P.F.; Ciacci-Woolwine, F.; Snipes, J.A.; Mizel, S.B. High-affinity interaction between gram-negative flagellin and a cell surface polypeptide results in human monocyte activation. Infect. Immun 2000, 68, 5525–5529. [Google Scholar]
- Ymeti, A.; Kanger, J.S.; Greve, J.; Lambeck, P.V.; Wijn, R.; Heideman, R.G. Realization of a multichannel integrated Young interferometer chemical sensor. Appl. Opt 2003, 42, 5649–5660. [Google Scholar]
- Hanumegowda, N.M.; Stica, C.J.; Patel, B.C.; White, I.; Fan, X.D. Refractometric sensors based on microsphere resonators. Appl. Phys. Lett 87, 07.
- Chremmos, I.; Uzunoglu, N.; Schwelb, O. Photonic Microresonator Research and Applications; Springer: New York, NY, USA, 2010; p. 257. [Google Scholar]
- Vollmer, F.; Arnold, S. Whispering-gallery-mode biosensing: Label-free detection down to single molecules. Nat. Methods 2008, 5, 591–596. [Google Scholar]
- Vollmer, F.; Braun, D.; Libchaber, A.; Khoshsima, M.; Teraoka, I.; Arnold, S. Protein detection by optical shift of a resonant microcavity. Appl. Phys. Lett 2002, 80, 4057–4059. [Google Scholar]


© 2014 by the authors; licensee MDPI, Basel, Switzerland. This article is an open access article distributed under the terms and conditions of the Creative Commons Attribution license ( http://creativecommons.org/licenses/by/3.0/).
Share and Cite
Bahadoran, M.; Noorden, A.F.A.; Chaudhary, K.; Mohajer, F.S.; Aziz, M.S.; Hashim, S.; Ali, J.; Yupapin, P. Modeling and Analysis of a Microresonating Biosensor for Detection of Salmonella Bacteria in Human Blood. Sensors 2014, 14, 12885-12899. https://doi.org/10.3390/s140712885
Bahadoran M, Noorden AFA, Chaudhary K, Mohajer FS, Aziz MS, Hashim S, Ali J, Yupapin P. Modeling and Analysis of a Microresonating Biosensor for Detection of Salmonella Bacteria in Human Blood. Sensors. 2014; 14(7):12885-12899. https://doi.org/10.3390/s140712885
Chicago/Turabian StyleBahadoran, Mahdi, Ahmad Fakhrurrazi Ahmad Noorden, Kashif Chaudhary, Faeze Sadat Mohajer, Muhammad Safwan Aziz, Shahrin Hashim, Jalil Ali, and Preecha Yupapin. 2014. "Modeling and Analysis of a Microresonating Biosensor for Detection of Salmonella Bacteria in Human Blood" Sensors 14, no. 7: 12885-12899. https://doi.org/10.3390/s140712885