A Selective Ultrahigh Responding High Temperature Ethanol Sensor Using TiO2 Nanoparticles


Abstract
: In this research work, the sensitivity of TiO2 nanoparticles towards C2H5OH, H2 and CH4 gases was investigated. The morphology and phase content of the particles was preserved during sensing tests by prior heat treatment of the samples at temperatures as high as 750 °C and 1000 °C. Field emission scanning electron microscopy (FESEM), transmission electron microscopy (TEM) and X-ray diffraction (XRD) analysis were employed to characterize the size, morphology and phase content of the particles. For sensor fabrication, a film of TiO2 was printed on a Au interdigitated alumina substrate. The sensing temperature was varied from 450 °C to 650 °C with varying concentrations of target gases. Results show that the sensor has ultrahigh response towards ethanol (C2H5OH) compared to hydrogen (H2) and methane (CH4). The optimum sensing temperature was found to be 600 °C. The response and recovery times of the sensor are 3 min and 15 min, respectively, for 20 ppm C2H5OH at the optimum operating temperature of 600 °C. It is proposed that the catalytic action of TiO2 with C2H5OH is the reason for the ultrahigh response of the sensor.1. Introduction
Increasing demand for better control of environmental monitoring of emissions from industry and automobiles, improved processing of food and pharmaceuticals, healthcare and weather prediction require high performance gas sensors. Monitoring colorless organic compounds is a growing need in many industries due to possible health and safety concerns [1]. In many applications, ethanol (C2H5OH) sensors are being used to monitor chemical reactions, biomedical productions, quality control of food and beverages, as well as breath analysis [2,3]. Increased usage of C2H5OH raises concerns over groundwater pollution [4] and explosion hazards [5]. Thermodynamic analysis shows that C2H5OH reforms to methane (CH4) at moderate temperatures, whereas hydrogen rich gases are formed at high temperatures (427–527 °C) [6–8]. For this reason, the need for selective sensing of C2H5OH at high temperatures in presence of H2 and CH4 is attracting the attention of researchers.
Semiconducting metal oxides are being used as gas sensing materials due to their numerous benefits such as high sensitivity, easy fabrication process and low cost [9]. So far, a great variety of metal oxides such as ZnO, SnO2, TiO2, In2O3, WOx, AgVO3, CdO, MoO3, CuO, NiO and TeO2 have been investigated as sensing materials. Many of these metal oxides exhibit good sensitivity at low temperatures. A review of the literature reveals that ZnO, SnO2, In2O3, WOx, AgVO3, CdO, MoO3, CuO and TeO2 have optimum sensitivity at temperatures below 400°C, whereas TiO2 is capable of operating at temperatures as high as 600 °C [10]. Moreover, while low temperature gas sensing materials may undergo morphological and phase changes at high sensing temperatures, TiO2 is stable at high operating temperatures. Additionally, the catalytic activity of TiO2 towards alcohols offers higher electron exchange which is beneficial for C2H5OH sensing [11,12]. Non-toxicity, easy fabrication and low cost are additional benefits of TiO2 in high temperature gas sensing applications.
So far, thick film [13,14], thin film [15] and nanomaterials [16] based on TiO2 have been utilized for gas sensing applications. Increasing the surface-to-volume ratio is considered to be an effective way to improve the performance of the gas sensing devices. In particular, reduction of the grain size down to the nanometer level has been suggested as an efficient strategy to enhance the gas-sensing properties of metal oxides [17]. Availability of higher density gas adsorption sites in nano-crystalline materials is the possible reason for the high sensitivity of nanomaterials towards gas sensing [18,19].
A great variety of TiO2 nanomaterials have been used for detecting different gases. These include nanowires [20,21], nanotubes [22–25], nanofibers [26–28], nanobelts [29], spherical colloids [30] and nanoparticles [17,31]. However, in the literature TiO2 nanostructures with mostly the anatase phase have been discussed for C2H5OH sensing. It is likely that the anatase phase can transform to rutile during sensing at high temperatures. Phase changes of the material during sensing affect the reproducibility of the results. Stabilization of the phase content at temperatures higher than the sensing temperatures was ignored in most of the studies described in the literature.
In this work, commercial TiO2 nanoparticles were used for investigating their sensitivity towards C2H5OH, H2 and CH4 gases. An easy processing route was employed for the fabrication of gas sensors containing a porous film of TiO2 nanoparticles. Before starting the sensing experiments, the morphology and phase content of TiO2 nanoparticles were preserved by heat treating the particles at higher temperatures. Sensitivity, selectivity, optimum temperature, response time and recovery time were then determined and are reported here.
2. Experimental Section
Commercial TiO2 nanoparticles purchased from Sigma Aldrich (USA) were used in this study (<100 nm (BET)). To stabilize the phase content, a portion of the as-received nanoparticles were heat treated at 750 °C and 1000 °C for 3 h and 1 h, respectively. Heat treatment was conducted in Ar and ambient gas environments. The morphology and size of the particles before and after the heat treatment were measured using a high resolution field emission scanning electron microscope (FESEM: Zeiss Ultra-60, Atlanta, GA, USA) and a transmission electron microscope (HRTEM: FEI Tecnai F-20, Hillsboro, OR, USA). The phase content in the particles were characterized by an X-ray diffractometer (XRD: PANalytical Empyrean, Netherlands) using CuKα radiation (0.1540598 nm) at 40 KV and 40 mA.
An ink was formulated to disperse the particles on the substrate. For this, α-terpineol (Sigma Aldrich) and diethylene glycol dibutyl ether (DGDE: Sigma Aldrich) were mixed at a ratio of 1:1 at room temperature. Then 8 wt% of ethyl cellulose (Sigma Aldrich) was added to the solution and heated at 200 °C for 2 hours to dissolve the ethyl cellulose. Then the ink was loaded with 10 wt% TiO2 nanoparticles. The composite ink was ultrasonicated for 1 hour to disperse the particles. About 3 μL of the composite ink was taken by a micropipette and dropped on to an Au interdigitated alumina substrate having a dimension of 5 mm × 5 mm (purchased from Case Western Reserve University, Cleveland, OH, USA). After that the sensors were heat treated at 750 °C for 1 hour in Ar atmosphere at which the phase contents were stabilized.
For sensing characterization the sensors were placed in a quartz tube inside a horizontal tube furnace (Lindberg Blue M: TF55035COMA1, USA). The sensor was connected to a data acquisition system using Au wire (0.2 mm, Alfa Aesar, Ward Hill, MA, USA). Au paste (Heraeus, Hanau, Germany) was applied to the sensor/wire junction and cured at 650 °C for 1 h in Ar and in ambient environment to attach the lead wire. Before starting sensing experiments, the quartz tube was purged with Ar gas for 10 min to remove possible contaminations. The furnace was heated to 450–650 °C at a heating rate of 30 °C/min in N2 environment (purity: 99.999% with <5 ppm O2). The target gases (C2H5OH, CH4, H2) were mixed with N2 at different concentrations ranging from 20 to 1000 ppm by using digital mass flow controller (C100L-CM-NR-2-0V1-SV1-PV2-V1, Sierra, Monterey, CA, USA). The total flow rate of gases was maintained at 500 sccm throughout the experiments. The sensitivity response of the sensor is defined as Ra/Rg, where Ra and Rg is the resistance of the sensor in air and in the target gas, respectively. The response time (Tres) and recovery time (Trec) of the sensor are defined as the time to reach 90% of the total resistance change in case of gas exposure and removal, respectively. The optimum operating temperature, sensitivity, response and recovery times were also determined for different gases.
3. Results and Discussion
Figure 1 shows the field emission scanning electron microscope (FESEM) images of TiO2 nanoparticles in as-received and heat treated conditions. The global view of the as-received particles indicates that the particles had spherical shape without any agglomeration (Figure 1a). The average size of the as-received particles was about 50 nm under FESEM observation. After heat treatment at 750 °C, the particles size and shape are almost similar to that of the as-received particles (Figure 1b). However, the micrograph suggests that sintering has started to occur during the heat treatment. All TiO2 particles sintered together after heat treatment at 1000 °C (Figure 1c). The average size of the sintered particles was 3–5 μm (inset in Figure 1c).
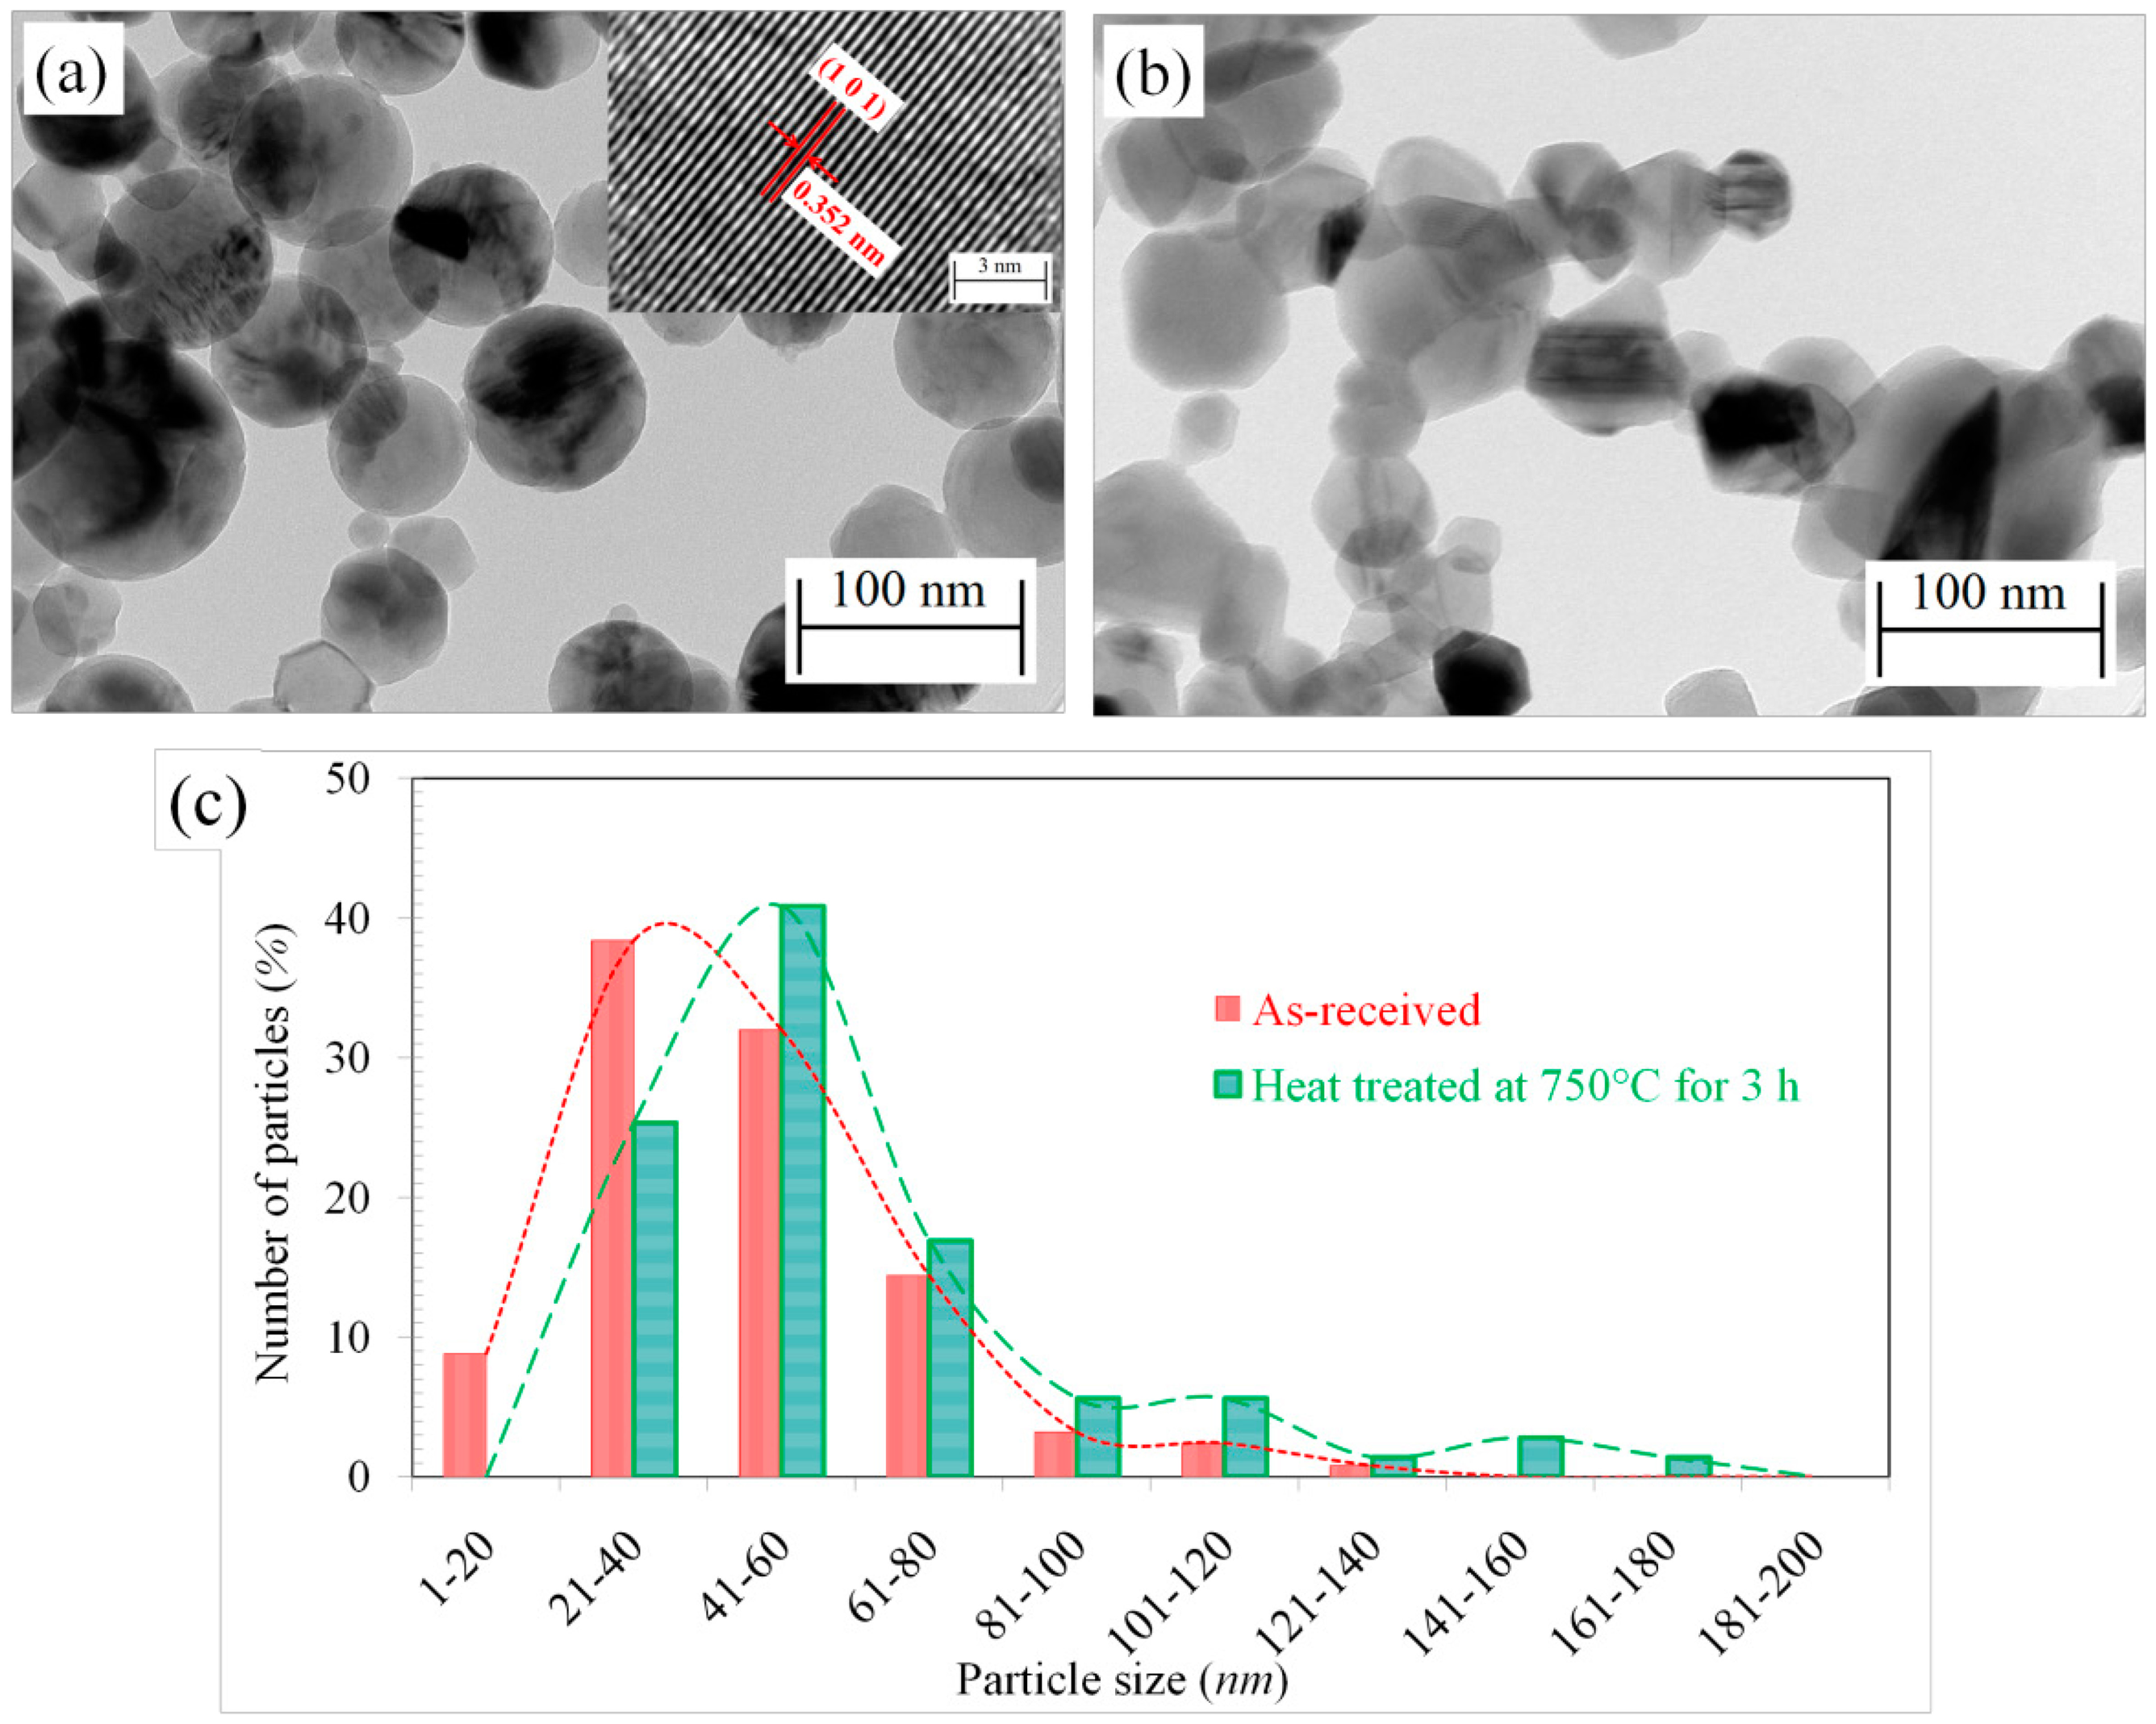
Figure 2 shows transmission electron microscope (TEM) images of the as-received particles and those heat treated at 750 °C. The average particle size was calculated from the TEM images. More than 100 particles were used to calculate the average particle size. From the TEM images the average size of the as-received particles are calculated to be 45.3 ± 21.6 nm (Figure 2a). The high resolution TEM analysis shows that the as-received particles are completely crystalline with a mixture of anatase and rutile. One such anatase crystal is shown in the inset of Figure 2a. On the other hand, after heat treatment at 750 °C the particles became faceted, with an average size of 60.1 ± 30.7 nm (Figure 2b). The faceted structure is due to the increased portion of rutile in the particles after heat treatment. The size distribution of the particles is shown in Figure 2c. Particles heat treated at 1000 °C were not transparent to electron beam and were not observable under TEM due to increased size (3–5 μm).
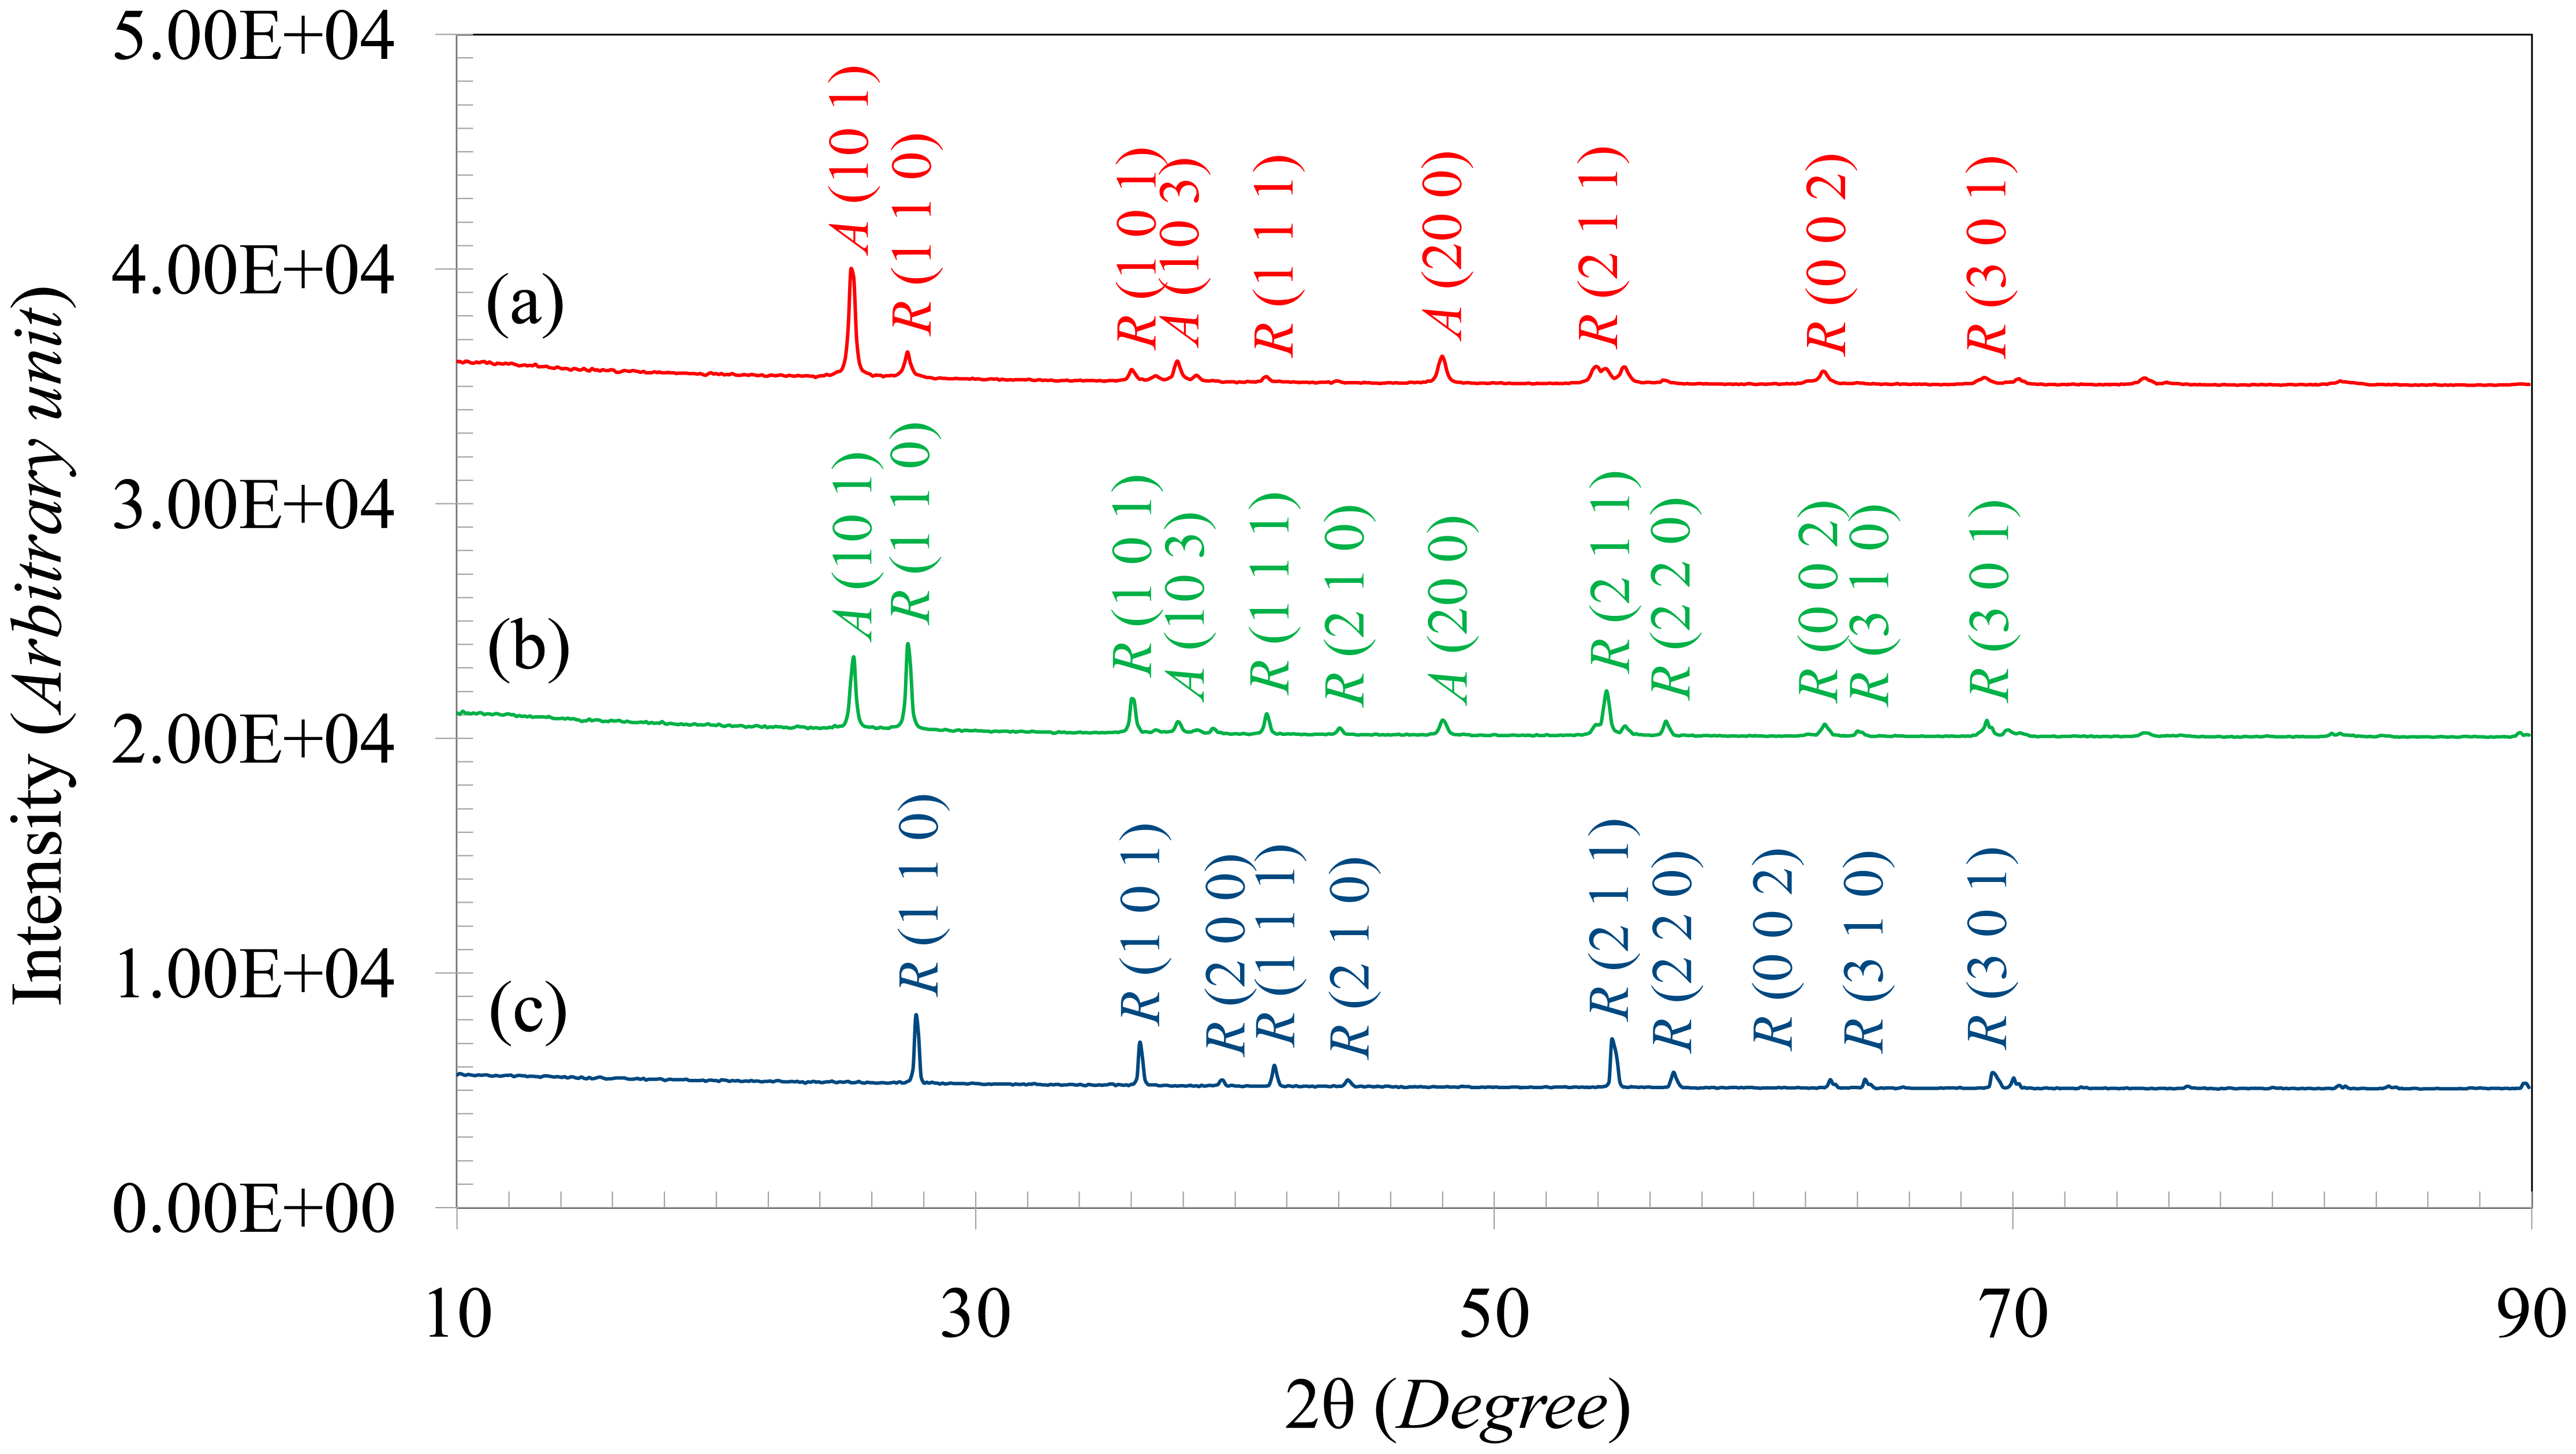
Figure 3 shows the XRD patterns of the TiO2 particles in as-received and heat treated conditions. The as-received particles contain both anatase and rutile peaks of TiO2 (Figure 3a). After heat treatment at 750 °C the rutile fraction increased (Figure 3b) and heat treatment at 1000 °C completely converted the particles to rutile, as seen in Figure 3c. The anatase and rutile content of the particles were calculated from the XRD patterns by using Spurr and Myers's equation [32] and the results are tabulated in Table 1. The as-received particles contained 76.3% anatase which was reduced to 37% after heat treating at 750 °C for 3 h. After heat treating at 1000 °C, the particles were completely converted to rutile.
The sensors are intended to operate at high temperatures, so it is necessary that the phase content and microstructure of the particles do not change during the test. As it can be seen from the images in Figures 1 and 2 in combination with the XRD results in Figure 3, the particle morphology and rutile content of the as-received particles changed after heat treatment at 750 °C. For this reason, the as-received TiO2 particles were excluded from the sensing test. Moreover, after heat treatment at 1000 °C, the particles converted to rutile, with sizes ranging from 500 nm to 1 μm (Figures 1 and 3). The sintered morphology of the particles at 1000 °C greatly reduced the sensing surface. For this reason, these particles were also excluded for sensing tests. Since, the maximum operating temperature of the sensor was 650 °C; the particles heat treated at 750 °C were chosen for sensing tests to ensure morphological and phase stability during sensing.
For the preparation of the sensor, composite ink were prepared by loading 10 wt% of TiO2 nanoparticles in an ink. About 3 μL of composite ink was dropped on to the Au interdigitated alumina substrate and then heat treated at 750 °C for 1 h in Ar and ambient environment to stabilize the particles and create some bonds between the substrate and particles. Investigation under FESEM shows that a more or less homogeneous film was created on top of the substrate (Figure 4a). The cross sectional view of the sensor shows that the film is porous with a thickness of 4.5 μm (Figure 4b). It has been reported that a porous film is beneficial for gas sensing because the accessibility of the target gas to the active surface layer is increased [33].
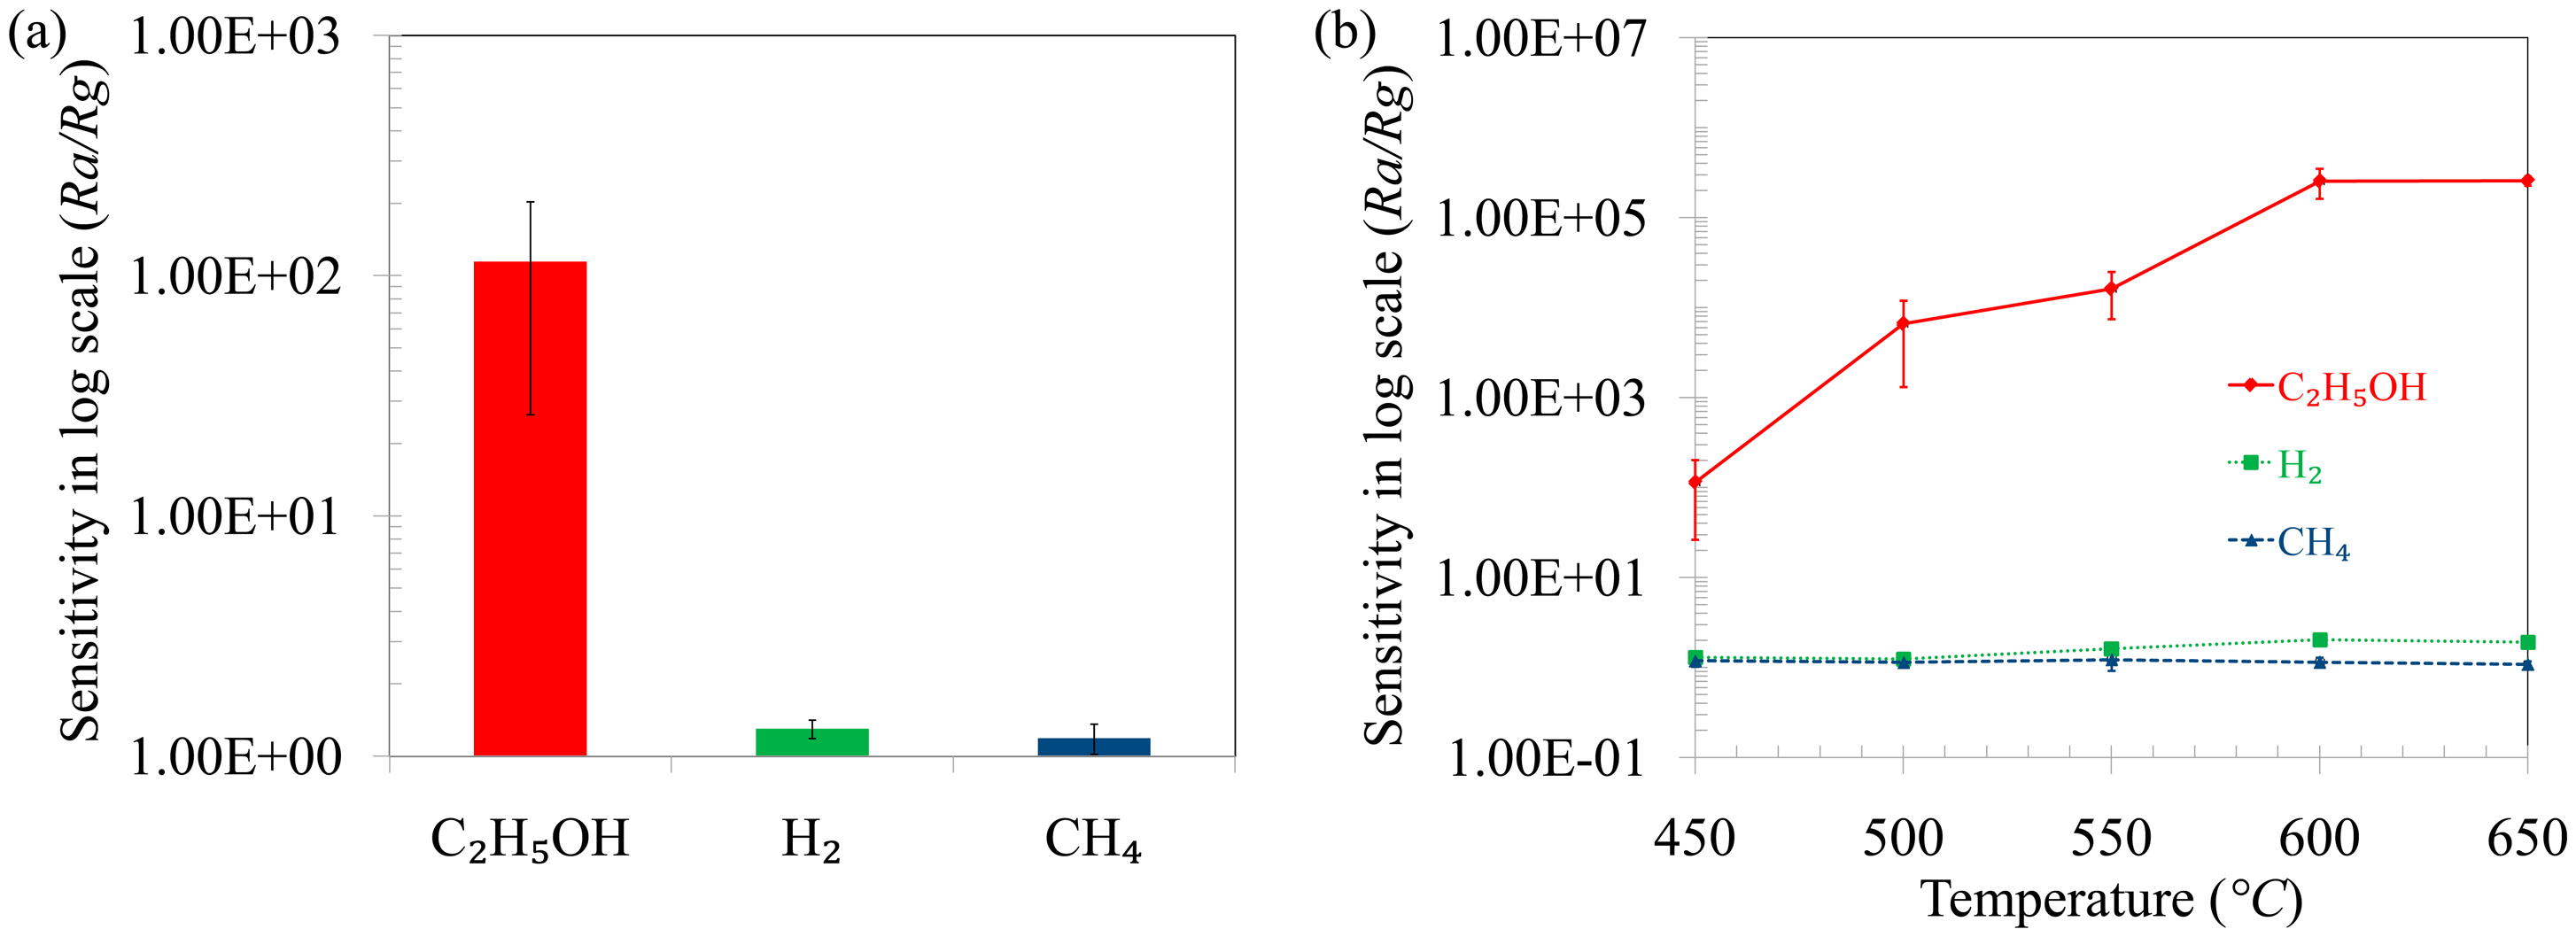
To determine the optimum operating conditions, the sensing temperature was varied from 450–650 °C at 1000 ppm target gas concentration. Figure 5a shows the sensitivity of the sensor for C2H5OH, H2 and CH4 gases at 450 °C at 1000 ppm concentration. The sensitivity of C2H5OH is much higher compared to that of H2 and CH4 at 450 °C. The sensitivity of the sensor for C2H5OH is ∼100 whereas it is only ∼1.3 and ∼1.2 for H2 and CH4, respectively, at 450 °C, so the sensor is capable of detecting C2H5OH selectively in the presence of H2 and CH4. The sensitivity of the sensor at different temperatures was also investigated and the results are shown in Figure 5b. The sensors show a much higher sensitivity towards C2H5OH at all temperatures. Moreover, with increasing temperature, the sensitivity towards C2H5OH increases until 600 °C and after that it remains more or less constant. On the other hand, the sensitivity towards H2 and CH4 is very negligible compared to that of C2H5OH. For example, the sensitivity at 600 °C is ∼2.5 × 10⁵, 2.1 and 1.5 for C2H5OH, H2 and CH4, respectively. So, from the above observations it can be stated that the sensor containing TiO2 nanoparticles selectively detects C2H5OH at all temperatures and the optimum temperature is determined to be 600 °C.
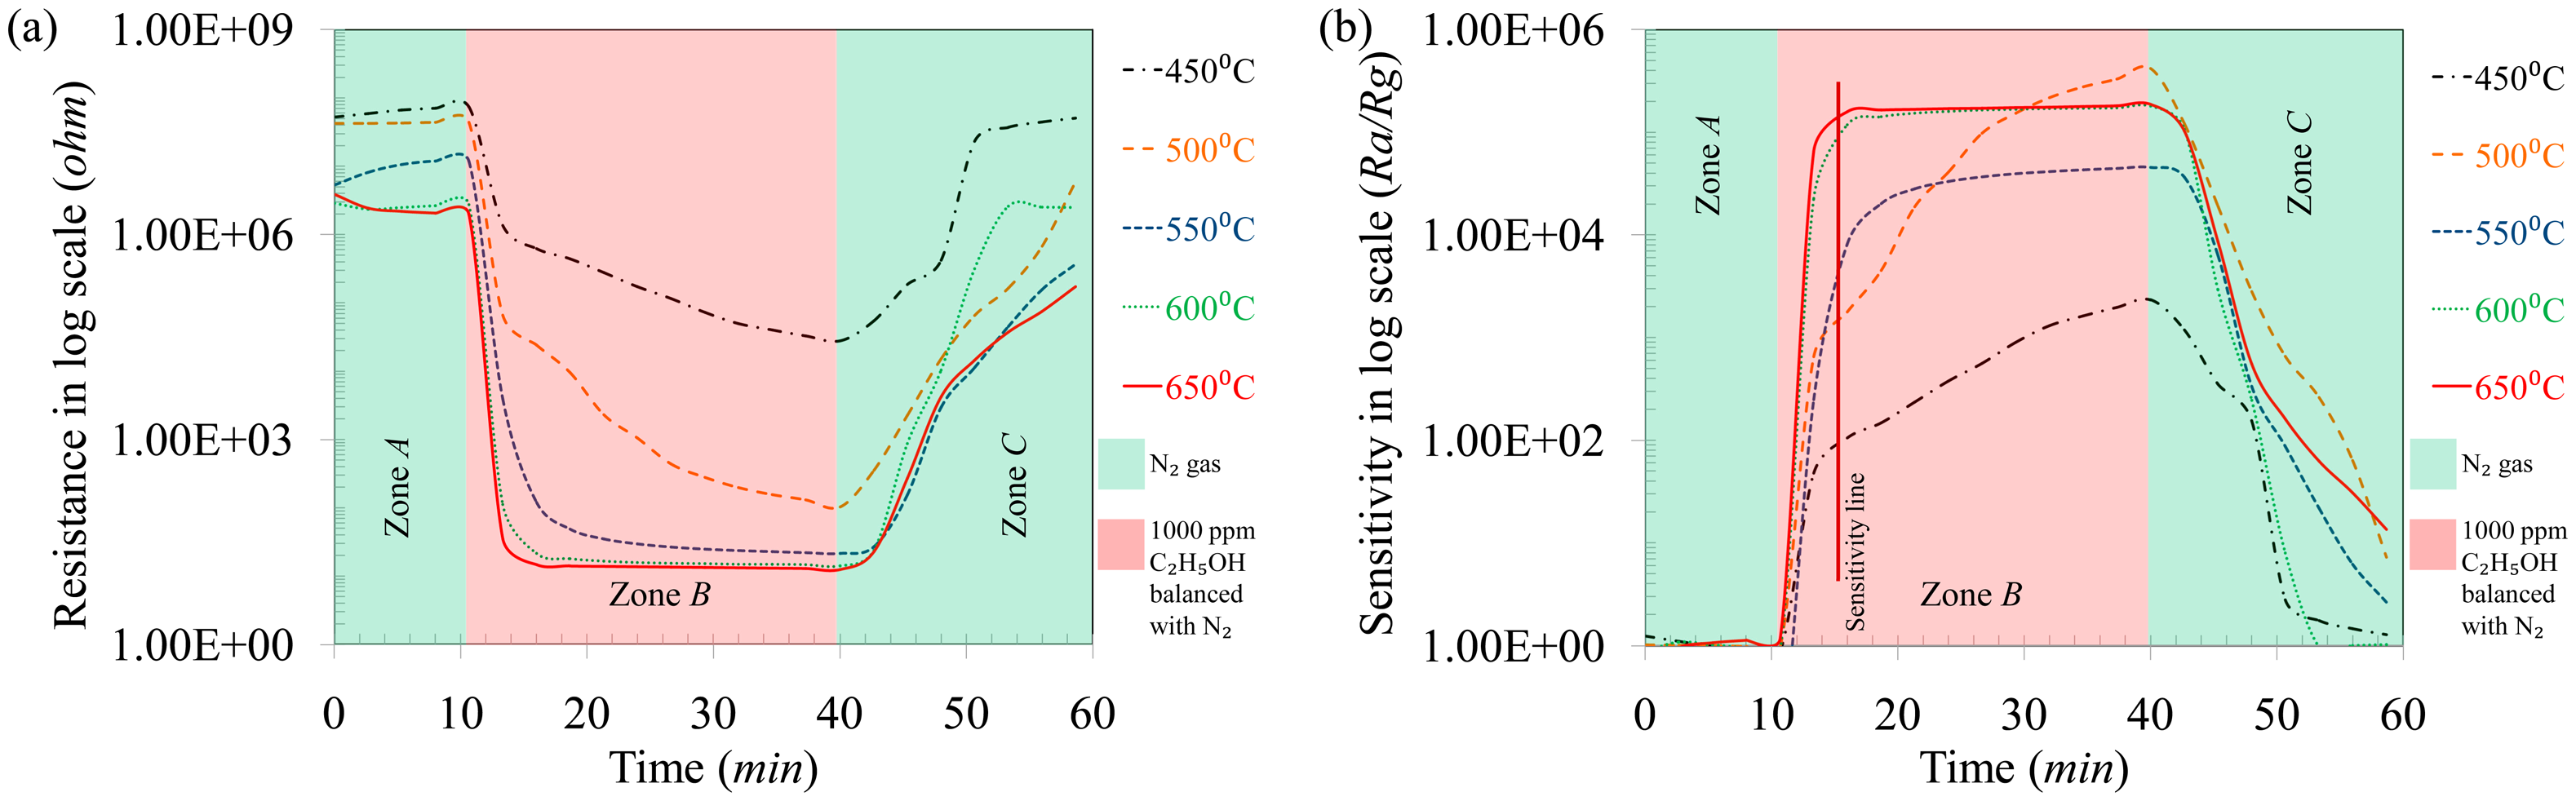
The response curves of the sensor towards C2H5OH gas at different temperatures (450–650 °C) are shown in Figure 6, where three distinct zones can be seen. Zone A is the region where pure N2 gas was flown at a rate of 500 sccm into the sensing chamber. It is clearly seen that the initial resistance of the sensor decreased with increase in the temperature. In zone B, 1000 ppm C2H5OH gas was introduced into the sensing chamber at 500 sccm flow rate. At low temperatures (450–500 °C), the resistance of the sensor was not stable in zone B and had a decreasing trend. On the other hand at higher temperatures (550–650 °C), the resistance of the sensor reached a minimum and stabilized to a more or less constant value. Finally, in zone C, again pure N2 gas was flown into the sensing chamber resulting in the recovery of the initial resistance. The sensitivity (Ra/Rg) of the sensor towards 1000 ppm C2H5OH gas was calculated from the response curves and is presented in Figure 6b. At low temperatures (450–500 °C) the sensitivity of the sensors towards C2H5OH was not constant and had an increasing trend as it can be seen in zone B in Figure 6b. On the other hand, the sensitivity reached a more or less constant value at high temperatures (550–650 °C) after the introduction of C2H5OH gas to the sensing chamber. To avoid the ambiguities in sensitivity values, a sensitivity line was drawn after 5 min of C2H5OH sensing (Figure 6b) and these values are reported in Figure 5b. From Figures 5 and 6, it is seen that the best response for C2H5OH was obtained at 600 °C and this temperature was chosen as the optimum temperature for the TiO2 sensor.
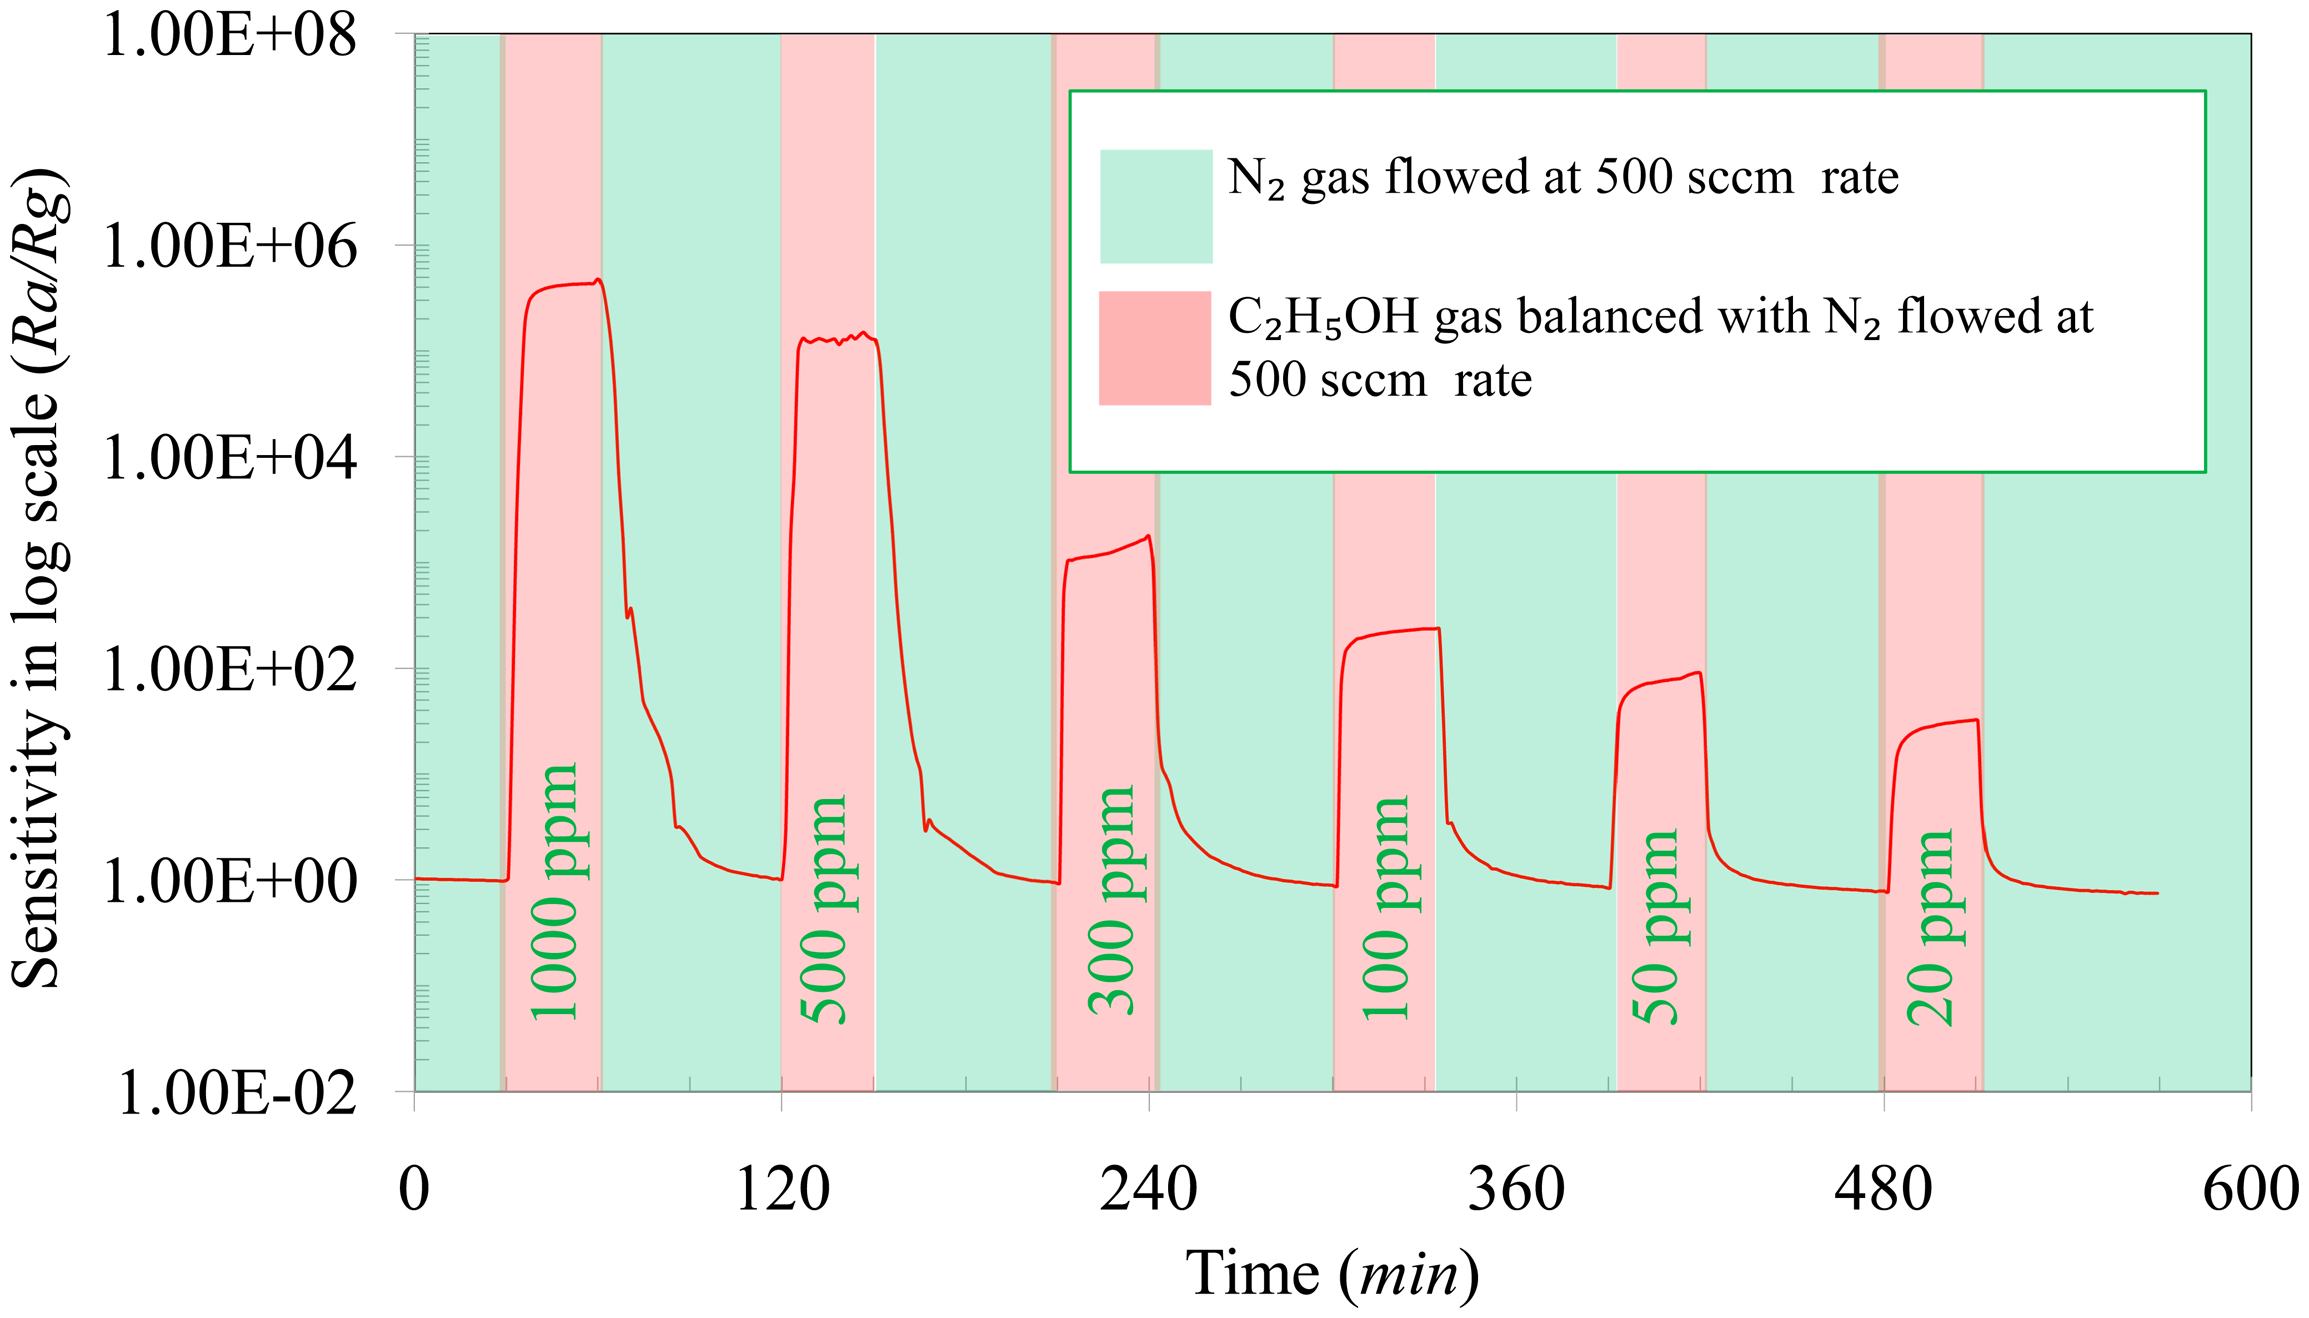
To demonstrate the effect of concentration, C2H5OH was varied from 1000 ppm to 20 ppm in a N2 environment at the optimum operating temperature of 600 °C (Figure 7). It is seen that with decreasing C2H5OH concentration the sensitivity of the sensor decreases. Within the limit of the experimental facilities it is seen that the sensor is able to detect C2H5OH levelsas low as 20 ppm in a N2 atmosphere with a sensitivity response of 31. It is also seen that the response time (Tres) and recovery time (Trec) of the sensor decreases with decreasing C2H5OH concentration. The response time was reduced from 6 min to 3 min with a decrease in the C2H5OH concentration from 1000 ppm to 20 ppm. Similarly, the recovery time of the sensor decreased from 30 min to 15 min by reducing the C2H5OH concentration from 1000 ppm to 20 ppm. The sluggish recovery of the sensor, typical of the oxide-based sensors, is possibly due to slow desorption rate of C2H5OH from the TiO2 surface [34].
From the above observation, an ultrahigh response is seen for C2H5OH detection by using heat treated TiO2 nanoparticles in Ar environment at 750 °C. It was assumed that the nanoparticles were partially reduced during the heat treatment in Ar. Partial reduction of the particles increases the oxygen vacancies which in turn results in ultrahigh responses in the sensor. For this reason another set of experiments were conducted by fabricating sensors after heat treating the TiO2 nanoparticles in air at 750 °C for 3 h. Figure 8 compares the response of the sensors towards 1000 ppm of C2H5OH, H2 and CH4 gases at the optimum operating temperature (600 °C) after heat treating the sensors at 750 °C for 3 h in Ar and air. No obvious change in response is observed from this figure. The responses toward C2H5OH, H2 and CH4 gases remain more or less constant in both types of sensors at the optimum temperature, so partial reduction of the nanoparticles during heat treatment in Ar environment is not responsible for the ultrahigh response of the sensor. Other factors such as the thickness of the electron depleted layer, catalytic activity and porosity in the film might be responsible for the ultrahigh response of these sensors.
The mechanism of C2H5OH sensing by TiO2 nanoparticles may be attributed and explained with the help of the surface depletion model [35]. During the exposure of TiO2 to ambient environment, oxygen molecules are adsorbed on the surface as O−, O2− or even O2− ions by capturing an electron from the conduction band. As a result, an electron depleted layer is formed at the surface of TiO2. The thickness of electron depleted layer of TiO2 is approximately 10–25 nm [16], which is comparable with the radius of the TiO2 nanoparticles used in this experiments (average radius of the nanoparticles is ∼30 nm), so it is expected that the major portion of the radius of a nanoparticle is electron depleted. Though a thick film of TiO2 was formed during the preparation of the sensor (4.5 μm), presence of high porosity in the film (Figure 4) effectively creates a path for oxygen molecules to reach deep inside the film for the surface reaction. As a result an electron depleted layer is created in each particle which could be a reason for the high resistance of the sensor in a nitrogen environment (on the order of 106 to 107 ohm). Upon exposing the sensor to a reducing environment, the target gases inject electrons into the TiO2 resulting in a decrease of the sensor resistance. However, the electron donating capacity of different types of molecules is not the same, and for alkyl groups this capacity increases with the increase of branches. In this regard, C2H5OH has higher electron donating capacity than CH4. This could be a reason for the higher sensitivity towards C2H5OH compared to CH4 and H2.
A relevant literature survey on the catalytic action of TiO2 nanoparticles reveals that the adsorption of C2H5OH on the surface of TiO2 is largely dissociative and yields ethoxide and surface hydroxyl groups [11]. The C2H5OH molecules adsorb on the surface of TiO2 nanoparticles and desorb as acetaldehyde (CH3CHO) with other minor products such as acetone (CH3-C(O)-CH3) and ethyl acetate (CH3CH2COOCH3). Reactions involved in the evolution of these products are dehydrogenation and coupling. It may be noted that a Au interdigitated alumina substrate was used for making the sensors and it has been reported that the presence of Au is beneficial to improve the catalytic activity of TiO2 [12]. In general, the O-H bond in C2H5OH dissociates and yields ethoxide which donates electron to the TiO2 surface. In the present experiment, it is believed that the adsorption kinetics of C2H5OH are slower at temperatures up to 500 °C compared to higher temperatures (550–650 °C). As a result, the surface slowly accumulates the adsorbed C2H5OH which results in a prolonged decreasing trend in resistance during the exposure of the target gas. It can be also seen that the resistance of the sensor did not reach to a stable minimum in zone B at temperatures of 450–500 °C (Figure 6a) due to slow reaction kinetics. Prolonged exposure to C2H5OH might result in a stable minimum value of resistance at these temperatures. But in that case, the response time will be significantly high and for this reason these temperatures are not feasible for sensing. On the other hand, at high temperatures (550–650 °C) the reaction kinetics are fast enough for surface saturation by the adsorbed species which leads the resistance of the sensors to reach a minimum value within a reasonable time. For this reason a fast response is observed in the sensors at the temperatures above 550 °C, so it can be concluded that high temperatures (550–650 °C) are beneficial to obtain a stable response from the sensors. The variant slopes in the recovery response shown in the zone C of Figure 6a could be due to desorption of different gases at different rates, which changes the resistance of the sensors to different degrees.
So far, different types of metal oxides with different morphologies have been used for detecting C2H5OH gas and the results are tabulated in Table 2 [36–49]. In comparison with other metal oxides, TiO2 exhibits higher response for C2H5OH due to its higher catalytic reaction and enhanced charge transfer compared to ZnO, SnO2, In2O3 and CuO. Increased response towards C2H5OH is also observed in ZnO and SnO2 nanostructures compared to other reducing gases [10]. Comparing with other TiO2 morphologies such as nanowire arrays [50], nanobelts [16] and spherical colloids [30], the spherical nanoparticles of TiO2 shows remarkable high sensitivity towards C2H5OH. This could be due to smaller particle size (60.1 ± 30.7 nm) which is comparable with the electron depletion thickness (10–25 nm) with high surface-to-volume ratio. Moreover, a porous film composed of TiO2 nanoparticles makes it easier for oxygen from the ambient to diffuse into the film to create an electron depleted layer by pulling electrons from the surface of the nanoparticles. As a result, all nanoparticles as well as the whole film become electron depleted under ambient conditions. Similarly, any target gas to be detected requires diffusion into the bulk to develop the desired chemical reaction(s). The change in the electrical resistance of the sensing material happens close to the reaction sites. It is obvious that a higher number of reaction sites will provide greater changes in the electrical resistance of sensor device [33]. In this regard a porous film is beneficial since it can provide a passage for the target gas moleculea to diffuse deep inside the sensing film. As it can be seen from Figure 4, a uniform porous film of TiO2 was formed in this study and this combined with almost electron depleted particles, higher catalytic activity and enhanced charge transfer are possible reasons for the observed better sensitivity towards ethanol.
4. Conclusions
In this research, the sensitivity of TiO2 nanoparticles towards C2H5OH, H2 and CH4 gases was investigated. For this, a film of TiO2 having 4.5 μm thickness was prepared on a Au interdigitated alumina substrate. Before sensing the particles were stabilized by heat treatment at 750 °C with 37% anatase and 63% rutile phase. From the experimental observations of this work the following conclusions can be drawn:
TiO2 nanoparticles selectively detect ethanol (C2H5OH) in the presence of hydrogen (H2) and methane (CH4).
The optimum operating temperature of TiO2 nanoparticles is 600 °C for C2H5OH detection.
The sensitivity of the sensor towards C2H5OH, H2 and CH4 is about ∼2.5 × 10⁵, 2.1 and 1.5, respectively at the optimum operating temperature of 600 °C.
The response time (Tres) and recovery time (Trec) of the senor varies with C2H5OH concentration. In general, Tres and Trec decrease with decreasing C2H5OH concentration. For 20 ppm C2H5OH detection at the optimum operating temperature, the Tres and Trec are 3 min and 15 min, respectively.
Acknowledgments
The authors acknowledge the financial support of High Impact Research Grant (HIR, Project No. UM.C/625/1/HIR/MOHE/ENG/26) from the University of Malaya.
Conflicts of Interest
The authors declare no conflict of interest.
Author Contributions
This research work was carried out in collaboration among the authors. M.M. Arafat did all the experimental work and prepared the draft manuscript. A.S.M.A. Haseeb and S.A. Akbar supervised M.M. Arafat for planning the experiments, participating in the discussion of the results, editing the English and finally correcting the manuscript.
References
- Wang, C.-C.; Weng, Y.-C.; Chou, T.-C. Acetone sensor using lead foil as working electrode. Sens. Actuators B Chem. 2007, 122, 591–595. [Google Scholar]
- Kolmakov, A.; Zhang, Y.X.; Cheng, G.S.; Moskovits, M. Detection of CO and O2 using tin oxide nanowire sensors. Adv. Mater. 2003, 15, 997–1000. [Google Scholar]
- Timmer, B.; Olthuis, W.; Berg, A. Ammonia sensors and their applications-a review. Sens. Actuators B Chem. 2005, 107, 666–677. [Google Scholar]
- Freitas, J.G.; Fletcher, B.; Aravena, R.; Barker, J.F. Methane production and isotopic fingerprinting in ethanol fuel contaminated sites. Ground Water 2010, 48, 844–857. [Google Scholar]
- Powers, S.E.; Hunt, C.S.; Heermann, S.E.; Corseuil, H.X.; Rice, D.; Alvarez, P.J.J. The transport and fate of ethanol and BTEX in groundwater contaminated by gasohol. Crit. Rev. Environ. Sci. Technol. 2001, 31, 79–123. [Google Scholar]
- Fishtik, I.; Alexander, A.; Datta, R.; Geana, D. A thermodynamic analysis of hydrogen production by steam reforming of ethanol via response reactions. Int. J. Hydrog. Energy 2000, 25, 31–45. [Google Scholar]
- Vasudeva, K.; Mitra, N.; Umasankar, P.; Dhingra, S.C. Steam reforming of ethanol for hydrogen production: Thermodynamic analysis. Int. J. Hydrog. Energy 1996, 21, 13–18. [Google Scholar]
- Galvita, V.V.; Semin, G.L.; Belyaev, V.D.; Semikolenov, V.A.; Tsiakaras, P.; Sobyanin, V.A. Synthesis gas production by steam reforming of ethanol. Appl. Catal. A Gen. 2001, 220, 123–127. [Google Scholar]
- Comini, E.; Faglia, G.; Sberveglieri, G.; Pan, Z.; Wang, Z.L. Stable and highly sensitive gas sensors based on semiconducting oxide nanobelts. Appl. Phys. Lett. 2002, 81, 1869–1871. [Google Scholar]
- Arafat, M.M.; Dinan, B.; Akbar, S.A.; Haseeb, A.S.M.A. Gas sensors based on one dimensional nanostructured metal-oxides: A review. Sensors 2012, 12, 7207–7258. [Google Scholar]
- Idriss, H.; Seebauer, E.G. Reactions of ethanol over metal oxides. J. Mol. Catal. A Chem. 2000, 152, 201–212. [Google Scholar]
- Nadeem, A.M.; Waterhouse, G.I.N.; Idriss, H. The reactions of ethanol on TiO2 and Au/TiO2 anatase catalysts. Catal. Today 2012, 182, 16–24. [Google Scholar]
- Birkefeld, L.D.; Azad, A.M.; Akbar, S.A. Carbon monoxide and hydrogen detection by anatase modification of titanium dioxide. J. Am. Ceram. Soc. 1992, 75, 2964–2968. [Google Scholar]
- Carotta, M.C.; Ferroni, M.; Gnani, D.; Guidi, V.; Merli, M.; Martinelli, G.; Casale, M.C.; Notaro, M. Nanostructured pure and Nb-doped TiO2 as thick film gas sensors for environmental monitoring. Sens. Actuators B Chem. 1999, 58, 310–317. [Google Scholar]
- Karunagaran, B.; Uthirakumar, P.; Chung, S.J.; Velumani, S.; Suh, E.-K. TiO2 thin film gas sensor for monitoring ammonia. Mater. Charact. 2007, 58, 680–684. [Google Scholar]
- Hu, P.; Du, G.; Zhou, W.; Cui, J.; Lin, J.; Liu, H.; Liu, D.; Wang, J.; Chen, S. Enhancement of ethanol vapor sensing of TiO2 nanobelts by surface engineering. Appl. Mater. Inter. 2010, 2, 3263–3269. [Google Scholar]
- Rella, R.; Spadavecchia, J.; Manera, M.G.; Capone, S.; Taurino, A.; Martino, M.; Caricato, A.P.; Tunno, T. Acetone and ethanol solid-state gas sensors based on TiO2 nanoparticles thin film deposited by matrix assisted pulsed laser evaporation. Sens. Actuators B Chem. 2007, 127, 426–431. [Google Scholar]
- Gas'kov, A.M.; Rumyantseva, M.N. Nature of gas sensitivity in nanocrystalline metal oxides. Russ. J. Appl. Chem. 2001, 74, 440–444. [Google Scholar]
- Vlachos, D.S.; Xenoulis, A.C. Gas detection sensitivity and cluster size. Nanostruct. Mater. 1998, 10, 1355–1361. [Google Scholar]
- Yoo, S.; Akbar, S.A.; Sandhage, K.H. Nanocarving of titania (TiO2): a novel approach for fabricating chemical sensing platform. Ceram. Int. 2004, 30, 1121–1126. [Google Scholar]
- Rout, C.S.; Kulkarni, G.U.; Rao, C.N.R. Room temperature hydrogen and hydrocarbon sensors based on single nanowires of metal oxides. J. Phys. D Appl. Phys. 2007, 40, 2777–2782. [Google Scholar]
- Varghese, O.K.; Gong, D.; Paulose, M.; Ong, K.G.; Grimes, C.A. Hydrogen sensing using titania nanotubes. Sens. Actuators B Chem. 2003, 93, 338–344. [Google Scholar]
- Paulose, M.; Varghese, O.K.; Mor, G.K.; Grimes, C.A.; Ong, K.G. Unprecedented ultra-high hydrogen gas sensitivity in undoped titania nanotubes. Nanotechnology 2006, 17, 398–402. [Google Scholar]
- Han, C.-H.; Hong, D.-W.; Kim, I.-J.; Gwak, J.; Han, S.-D.; Singh, K.C. Synthesis of Pd or Pt/titanate nanotube and its application to catalytic type hydrogen gas sensor. Sens. Actuators B Chem. 2007, 128, 320–325. [Google Scholar]
- Lu, H.F.; Li, F.; Liu, G.; Chen, Z.-G.; Wang, D.-W.; Fang, H.-T.; Lu, G.Q.; Jiang, Z.H.; Cheng, H.-M. Amorphous TiO2 nanotube arrays for low-temperature oxygen sensors. Nanotechnology 2008, 19, 405504. [Google Scholar]
- Biao, W.; Dong, Z.Y.; Ming, H.L.; Sheng, C.J.; Li, G.F.; Yun, L.; Jun, W.L. Improved and excellent CO sensing properties of Cu-doped TiO2 nanofibers. Chin. Sci. Bull. 2010, 55, 228–232. [Google Scholar]
- Landau, O.; Rothschild, A.; Zussman, E. Processing-microstructure-properties correlation of ultrasensitive gas sensors produced by electrospinning. Chem. Mater. 2009, 21, 9–11. [Google Scholar]
- Carney, C.M.; Yoo, S.; Akbar, S.A. TiO2-SnO2 nanostructures and their H2 sensing behavior. Sens. Actuators B Chem. 2005, 108, 29–33. [Google Scholar]
- Galatsis, K.; Li, Y.X.; Wlodarski, W.; Comini, E.; Sberveglieri, G.; Cantalini, C.; Santucci, S.; Passacantando, M. Comparison of single and binary oxide MoO3, TiO2 and WO3 sol-gel gas sensors. Sens. Actuators B Chem. 2002, 83, 276–280. [Google Scholar]
- Cheng, X.; Xu, Y.; Gao, S.; Zhao, H.; Huo, L. Ag nanoparticles modified TiO2 spherical heterostructures with enhanced gas-sensing performance. Sens. Actuators B Chem. 2011, 155, 716–721. [Google Scholar]
- Seo, M.-H.; Yuasa, M.; Kida, T.; Huh, J.-S.; Shimanoe, K.; Yamazoe, N. Gas sensing characteristics and porosity control of nanostructured films composed of TiO2 nanotubes. Sens. Actuators B Chem. 2009, 137, 513–520. [Google Scholar]
- Spurr, R.A.; Myers, H. Quantitative analysis of anatase-rutile mixtures with an X-Ray diffractometer. Anal. Chem. 1957, 29, 760–762. [Google Scholar]
- Gardon, M.; Guilemany, J.M. A review on fabrication, sensing mechanisms and performance of metal oxide gas sensors. J. Mater. Sci. Mater. Electron. 2013, 24, 1410–1421. [Google Scholar]
- Monroy, J.G.; González-Jiménez, J.; Blanco, J.L. Overcoming the slow recovery of MOX gas sensors through a system modeling approach. Sensors 2012, 12, 13664–13680. [Google Scholar]
- Akbar, S.A.; Younkman, L.B. Sensing mechanism of a carbon monoxide sensor based on anatase titania. J. Electrochem. Soc. 1997, 144, 1750–1753. [Google Scholar]
- Daryakenari, A.A.; Daryakenari, M.A.; Bahari, Y.; Omivar, H. Preparation and ethanol sensing properties of ZnO nanoparticles via a novel sol-gel method. ISRN Nanotechnol 2012. 879480. [Google Scholar]
- Wan, Q.; Li, Q.H.; Chen, Y.J.; Wang, T.H.; He, X.L.; Li, J.P.; Lin, C.L. Fabrication and ethanol sensing characteristics of ZnO nanowire gas sensors. Appl. Phys. Lett. 2004, 84, 3654–3656. [Google Scholar]
- Hsueh, T.-J.; Hsu, C.-L.; Chang, S.-J.; Chen, I.-C. Laterally grown ZnO nanowire ethanol gas sensors. Sens. Actuators B Chem. 2007, 126, 473–477. [Google Scholar]
- Feng, P.; Wan, Q.; Wang, T.H. Contact-controlled sensing properties of flowerlike ZnO nanostructures. Appl. Phys. Lett. 2005, 87, 213111. [Google Scholar]
- Li, C.C.; Du, Z.F.; Li, L.M.; Yu, H.C.; Wan, Q.; Wang, T. H. Surface-depletion controlled gas sensing of ZnO nanorods grown at room temperature. Appl. Phys. Lett. 2007, 91, 032101. [Google Scholar]
- Yang, Z.; Li, L.-M.; Wan, Q.; Liu, Q.-H.; Wang, T.-H. High-performance ethanol sensing based on an aligned assembly of ZnO nanorods. Sens. Actuators B Chem. 2008, 135, 57–60. [Google Scholar]
- Chiu, H.-C.; Yeh, C.-S. Hydrothermal synthesis of SnO2 nanoparticles and their gas-sensing of alcohol. J. Phys Chem. C 2007, 111, 7256–7259. [Google Scholar]
- Ying, Z.; Wan, Q.; Song, Z.T.; Feng, S.L. SnO2 nanowhiskers and their ethanol sensing characteristics. Nanotechnology 2004, 15, 1682–1684. [Google Scholar]
- Shi, S.; Liu, Y.; Chen, Y.; Zhang, J.; Wang, Y.; Wang, T. Ultrahigh ethanol response of SnO2 nanorods at low working temperature arising from La2O3 loading. Sens. Actuators B Chem. 2009, 140, 426–431. [Google Scholar]
- Choi, J.-K.; Hwang, I.-S.; Kim, S.-J.; Park, J.-S.; Park, S.-S.; Jeong, U.; Kang, Y.C.; Lee, J-H. Design of selective gas sensors using electrospun Pd-doped SnO2 hollow nanofibers. Sens. Actuators B Chem. 2010, 150, 191–199. [Google Scholar]
- Zheng, W.; Lu, X.; Wang, W.; Li, Z.; Zhang, H.; Wang, Y.; Wang, Z.; Wang, C. A highly sensitive and fast-responding sensor based on electrospun In2O3 nanofibers. Sens. Actuators B Chem. 2009, 142, 61–65. [Google Scholar]
- Chu, X.F.; Wang, C.H.; Jiang, D.L.; Zheng, C.M. Ethanol sensor based on indium oxide nanowires prepared by carbothermal reduction reaction. Chem. Phys. Lett. 2004, 399, 461–464. [Google Scholar]
- Xu, J.; Chen, Y.; Shen, J. Ethanol sensor based on hexagonal indium oxide nanorods prepared by solvothermal methods. Mater. Lett. 2008, 62, 1363–1365. [Google Scholar]
- Gou, X.; Wang, G.; Yang, J.; Park, J.; Wexler, D. Chemical synthesis, characterisation and gas sensing performance of copper oxide nanoribbons. J. Mater. Chem. 2008, 18, 965–969. [Google Scholar]
- Francioso, L.; Taurino, A.M.; Forleo, A.; Siciliano, P. TiO2 nanowires array fabrication and gas sensing properties. Sens. Actuators B Chem. 2008, 130, 70–76. [Google Scholar]


| Treatment of the Particles | Particle Size | Crystal Structure | Phase Content | |
|---|---|---|---|---|
| Anatase Content (%) | Rutile Content (%) | |||
| TiO2 as-received | 45.3 ± 21.6 nm | Anatase and rutile | 76.3 | 23.7 |
| TiO2 heat treated at 750 °C for 3 h | 60.1 ± 30.7 nm | Anatase and rutile | 37 | 63 |
| TiO2 heat treated at 1000 °C for 1 h | 3–5 μm | Rutile | 0 | 100 |
| Material | Crystal Structure | Morphology | Size | Sensitivity | Test Concentration (ppm) | Operating Temperature (°C) | Response Tine (sec) | Recovery Time (sec) | Reference | |
|---|---|---|---|---|---|---|---|---|---|---|
| Diameter | Length | |||||||||
| ZnO | Wurtzite | Nanoparticles | 39, 42 nm | - | 25 a | 1000 | 370 | ∼50 | ∼450 | 37 |
| - | Nanowire | 25 ± 5 nm | - | 32 a | 100 | 300 | - | - | 38 | |
| Wurtzite | Nanowire | 80 nm | 1 μm | 43 b | 100 | 300 | - | - | 39 | |
| - | Nanorod (flowerlike) | 150 nm | Few micron | 14.6 a | 100 | 300 | - | - | 40 | |
| Wurtzite | Nanorod (bushlike) | 15 nm | 1 μm | 29.7 a | 100 | 300 | - | - | 41 | |
| Wurtzite | Nanorod (vertically aligned) | 50 nm | 500 nm | 100 a | 100 | 300 | - | - | 42 | |
| SnO2 | Tetragonal | Nanoparticles | 3.3 ± 6 nm | - | ∼175 a | 500 | 220 | 18 | 44 | 43 |
| Tetragonal | Nanowhisker | 50–200 nm | Tens of micrometers | 23 a | 50 | 300 | - | 600 | 44 | |
| Tetragonal | Nanorod (flowerlike) | 5–20 nm | 100-200 nm | 45.1 a | 100 | 200 | - | - | 45 | |
| Tetragonal | Nanorods (flowerlike loaded with La2O3) | 5–20 nm | 100–200 nm | 213 a | 100 | 200 | - | - | 45 | |
| Tetragonal | Nanofiber (Pd doped) | 200–300 nm | Tens of micrometers | 1,020.6 a | 100 | 330 | <10 | 503 | 46 | |
| In2O3 | Cubic | Nanofiber | 60 nm | - | 379 a | 15,000 | 300 | 1 | 5 | 47 |
| - | Nanowire | 60–160 nm | 0.5 to a few micrometer | 25.3 a | 1000 | 370 | 10 | 20 | 48 | |
| Hexagonal | Nanorod | 20–50 nm | > 100 nm | 11.5 a | 50 | 330 | 6 | 11 | 49 | |
| CuO | Monoclinic | CuO Nanoribbon | 2–8 nm | 30–100 nm | ∼3.5c | 1000 | 200 | 3-6 | 4–9 | 50 |
| Monoclinic | CuO Nanoribbon (Au loaded) | 2–8 nm | 30–100 nm | ∼3.5c | 1000 | 200 | - | - | 50 | |
| Monoclinic | CuO Nanoribbon (Pt loaded) | 2–8 nm | 30–100 nm | ∼6c | 1000 | 200 | - | - | 50 | |
| TiO2 | Anatase | Nanowire array | 90–180 nm (Width) | 1400 μm | 50 a | 20,000 | 550 | - | - | 36 |
| Anatase | Nanotubes | 50 nm | 1 μm | ∼15 a | 47 | 500 | - | - | 31 | |
| Anatase | Nanobelt | 50 nm (thickness) | 100–150 nm (width) | 46.153 a | 500 | 200 | 1-2 | 1–2 | 16 | |
| Anatase | Spherical colloids | 250 nm | - | 15.1 a | 10,000 | 350 | 115 | 340 | 30 | |
| Anatase | Spherical colloids (Ag loaded) | 250 nm | - | 41.7 a | 10,000 | 350 | 1 | 35 | 30 | |
| 37% Anatase and 67% Rutile | Spherical nanoparticles | 60.1 ± 30.7 nm | - | 2.5 × 10⁵ a | 1000 | 600 | 180 (20 ppm) | 360 (20 ppm) | Present work | |
Note:
aS = Ra/Rg,bS=[(Ra-Rg)/Ra] × 100% andcS = Rg /Ra.© 2014 by the authors; licensee MDPI, Basel, Switzerland. This article is an open access article distributed under the terms and conditions of the Creative Commons Attribution license ( http://creativecommons.org/licenses/by/3.0/).
Share and Cite
Arafat, M.M.; Haseeb, A.S.M.A.; Akbar, S.A. A Selective Ultrahigh Responding High Temperature Ethanol Sensor Using TiO2 Nanoparticles. Sensors 2014, 14, 13613-13627. https://doi.org/10.3390/s140813613
Arafat MM, Haseeb ASMA, Akbar SA. A Selective Ultrahigh Responding High Temperature Ethanol Sensor Using TiO2 Nanoparticles. Sensors. 2014; 14(8):13613-13627. https://doi.org/10.3390/s140813613
Chicago/Turabian StyleArafat, M. M., A. S. M. A. Haseeb, and Sheikh A. Akbar. 2014. "A Selective Ultrahigh Responding High Temperature Ethanol Sensor Using TiO2 Nanoparticles" Sensors 14, no. 8: 13613-13627. https://doi.org/10.3390/s140813613