Enhanced Ethanol Gas Sensing Properties of SnO2-Core/ZnO-Shell Nanostructures


Abstract
: An inexpensive single-step carbon-assisted thermal evaporation method for the growth of SnO2-core/ZnO-shell nanostructures is described, and the ethanol sensing properties are presented. The structure and phases of the grown nanostructures are investigated by field-emission scanning electron microscopy (FESEM), transmission electron microscopy (TEM) and X-ray diffraction (XRD) techniques. XRD analysis indicates that the core-shell nanostructures have good crystallinity. At a lower growth duration of 15 min, only SnO2 nanowires with a rectangular cross-section are observed, while the ZnO shell is observed when the growth time is increased to 30 min. Core-shell hierarchical nanostructures are present for a growth time exceeding 60 min. The growth mechanism for SnO2-core/ZnO-shell nanowires and hierarchical nanostructures are also discussed. The sensitivity of the synthesized SnO2-core/ZnO-shell nanostructures towards ethanol sensing is investigated. Results show that the SnO2-core/ZnO-shell nanostructures deposited at 90 min exhibit enhanced sensitivity to ethanol. The sensitivity of SnO2-core/ZnO-shell nanostructures towards 20 ppm ethanol gas at 400 °C is about ∼5-times that of SnO2 nanowires. This improvement in ethanol gas response is attributed to high active sensing sites and the synergistic effect of the encapsulation of SnO2 by ZnO nanostructures.1. Introduction
Solid state gas sensors are widely used for detecting various concentrations of toxic and combustible gases [1–3]. These sensors can be categorized into three main groups according to their sensing mechanisms: solid electrolyte gas sensors, semiconductor gas sensors and catalytic combustion gas sensors [4]. Among these sensors, oxide-based semiconductor gas sensors play an important role in various applications, such as environmental monitoring, personal safety and the control of industrial processes [4,5]. ZnO, SnO2, WO3, In2O3 and TiO2 are widely studied oxides for gas sensing applications [6–8]. Various approaches have been used to improve the response and selectivity of these oxides [9]. These include the addition of noble metals [10–13], the doping of metal oxide catalyst [14,15], developing hybrid sensing materials consisting of binary or ternary phase metal oxide systems [16,17] and the development of nanostructures with different morphologies, a large surface area and a smaller size [18–21]. Among the approaches used, tailoring of oxide nanostructures presents a good potential for tuning the sensitivity and selectivity during gas sensing. The use of a core-shell structure has been of particular interest. To date, α-Fe2O3/SnO2 [22–24], GaN/WO3 [25], TiO2/ZnO [26,27], multi-walled CNT/SnO2 [28], ZnO/SnO2 [29–31], CeO2/TiO2 [32], Fe2O3/ZnO [33,34], MoO3/TiO2 [35] and Fe2O3/TiO2 [36] core-shell nanostructures have been investigated for gas sensing.
Important progress was made recently by Park et al. [26], who reported a five-fold increase in sensitivity for ethanol sensors based on TiO2/ZnO core-shell nanorods as compared with mere TiO2 nanorods. Chen et al. [28] reported that multi-walled CNT/SnO2 core/shell nanostructures showed enhanced sensitivity of ethanol up to 24.5 at 50 ppm. These results showed that enhanced sensing was due to the small size of SnO2 nanoparticles formed on top of multi-walled CNT and the special morphology of the core-shell heterostructure. Park et al. [31] demonstrated that SnO2-core/ZnO-shell nanowire sensors exhibited an especially increased response under UV illumination. The sensitivity of core-shell nanowire sensors towards 1–5 ppm of NO2 was improved by 2–3-times compared with pristine SnO2 or ZnO nanowires. Zhang et al. [34] reported that an α-Fe2O3/ZnO core-shell nanospindle sensor showed a sensitivity of 17.8 to an ethanol concentration of 100 ppm, which was more than two-times higher as compared with that of pristine α-Fe2O3 nanospindles sensor. The significant enhancement in the sensor response was attributed to its unique core-shell structure.
In this study, SnO2/ZnO core-shell-type nanowires and hierarchical nanostructures are prepared by a single-step carbon-assisted thermal evaporation method under ambient pressure. The fabrication of these nanostructures simply involves the evaporation of commercial metal oxide powders mixed with activated carbon at elevated temperatures in an inert gas atmosphere. In this process, all nanostructures are formed directly from the vapor phase in the absence of a metal catalyst, which is referred to as the vapor-solid (VS) growth [37]. In some cases, vacuum conditions [38] and strict temperature control [39] are necessary for the formation of nanowires in the vapor phase, because some materials may not sublimate under ambient pressure (normal atmosphere). An effective way to generate the necessary vapor phase under ambient pressure is to add activated carbon [40]. In our previous work [41], we reported the formation of SnO2-core/ZnO-shell nanowires at a growth time of 30 min and hierarchical SnO2-core/ZnO-shell nanostructures at a growth time of 120 min. In this paper, detailed structural characterizations of fabricated SnO2-core/ZnO-shell nanostructures are reported for various growth times. Gas sensors are fabricated using these nanostructures and tested for ethanol, hydrogen and methane gases.
2. Experimental Section
2.1. Preparation of SnO2-Core/ZnO-Shell Nanostructures
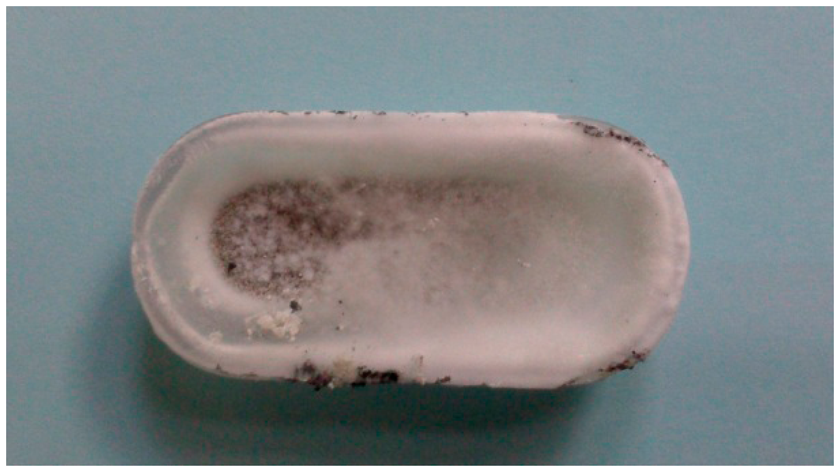
SnO2-core/ZnO-shell nanostructures were synthesized on the top and the edges of a quartz boat by the single-step carbon-assisted thermal evaporation method, as reported earlier [41]. Zinc oxide, tin (IV) oxide and activated carbon powders at a ratio of 9:1:10 were loaded in a quartz boat after being mixed in a ball mill for 8 h. Then, the quartz boat was placed at the center of a horizontal tube furnace. The furnace was heated to 900 °C, and the temperature was maintained for different growth times of 15, 30, 60, 90 and 120 min, followed by cooling down to room temperature. A carrier gas of Ar (purity 99.99%) was flowed at a rate of 25 mL/min during the growth period. A white fluffy mass was formed on the top and the edges of the quartz boat, as shown in Figure 1.
2.2. Characterization
The white fluffy mass was collected from the quartz boat and spread on a carbon tape for characterization. The structure of the SnO2/ZnO nanostructures grown for different time periods was examined by X-ray diffraction (XRD) using a Siemens D-5000 model with a monochromatic CuKα radiation (λ = 1.5406 Å) and Ni filter. The current and operating voltage were 40 mA and 40 kV, respectively. The scanning was performed between 25° to 70°, with a scanning step of 0.03°/s. Electron microscopy was used to investigate the structure and morphology of SnO2-core/ZnO-shell nanostructures. A morphological investigation of the fabricated nanostructures was carried out by Auriga Zeiss Ultra-60 field emission scanning electron microscopy (FESEM). The high magnification image and the elemental distribution in the SnO2/ZnO nanostructures were obtained by the transmission electron microscope (TEM, FEI Tecnai F-20 microscopy) equipped with an energy dispersive X-ray spectroscope. Samples for TEM imaging were prepared by scratching samples from the quartz boat and dispersed in deionized water followed by sonication for 5 min. A drop of the suspension was then dropped onto a carbon-coated Cu grid (300 mesh) using a micropipette.
2.3. Fabrication of Sensor and Measurements
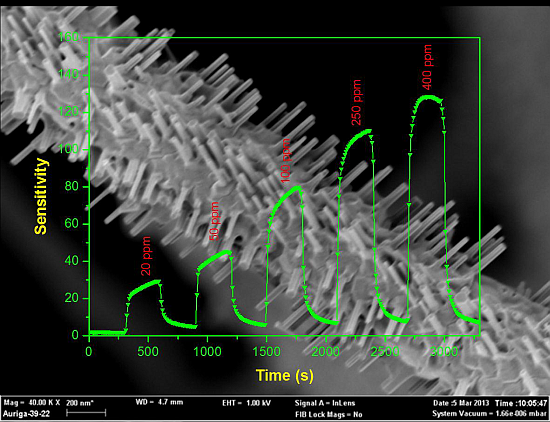
Inks for fabricating the sensors were prepared by suspending the nanostructures as follows: Initially, 46 wt % of α-terpineol, 8 wt % of ethyl cellulose and 46 wt % of diethylene glycol dibutyl ether (DGDE) were weighed individually. Then, α-terpineol and DGDE were mixed at room temperature in a glass container. Ethyl cellulose was then added to the mixture and heated on a hotplate until it was completely dissolved. The synthesized nanostructures (1 mg) were added to the ink and ultrasonicated for 5 min. Finally, the ink was drop-coated on alumina substrate having dimensions of 5 mm × 5 mm with a printed Au electrode to form the gas sensor. After drying in air at room temperature, the as-prepared sensor device was heat treated at 700 °C for 2 h. The sensor was placed inside a horizontal tube furnace, and a sensing measurement was carried out using the desired test gas at various gas concentrations of 20, 50, 100, 250 and 400 ppm with N2 background. The sensor response was defined as the ratio of (Ra−Rg)/Ra, where Ra and Rg are the resistances measured in nitrogen and tested gas, respectively. The response and recovery times are defined as the time taken by the sensor to attain 90% of the response and recovery signals, respectively [42].
3. Results and Discussion
Figure 1 shows the white fluffy mass that was deposited in the quartz boat during the growth of the nanostructure. In this process, the metal vapor is created by the reaction between zinc oxide, tin oxide and activated carbon. The vapor is transported by Ar carrier gas and condenses around the edges and the top of the boat. According to the Ellingham diagram [43], possible reactions involved in the growth process of nanostructures at the deposition temperature used in the present study are:
3.1. Structural Analysis of Nanostructures
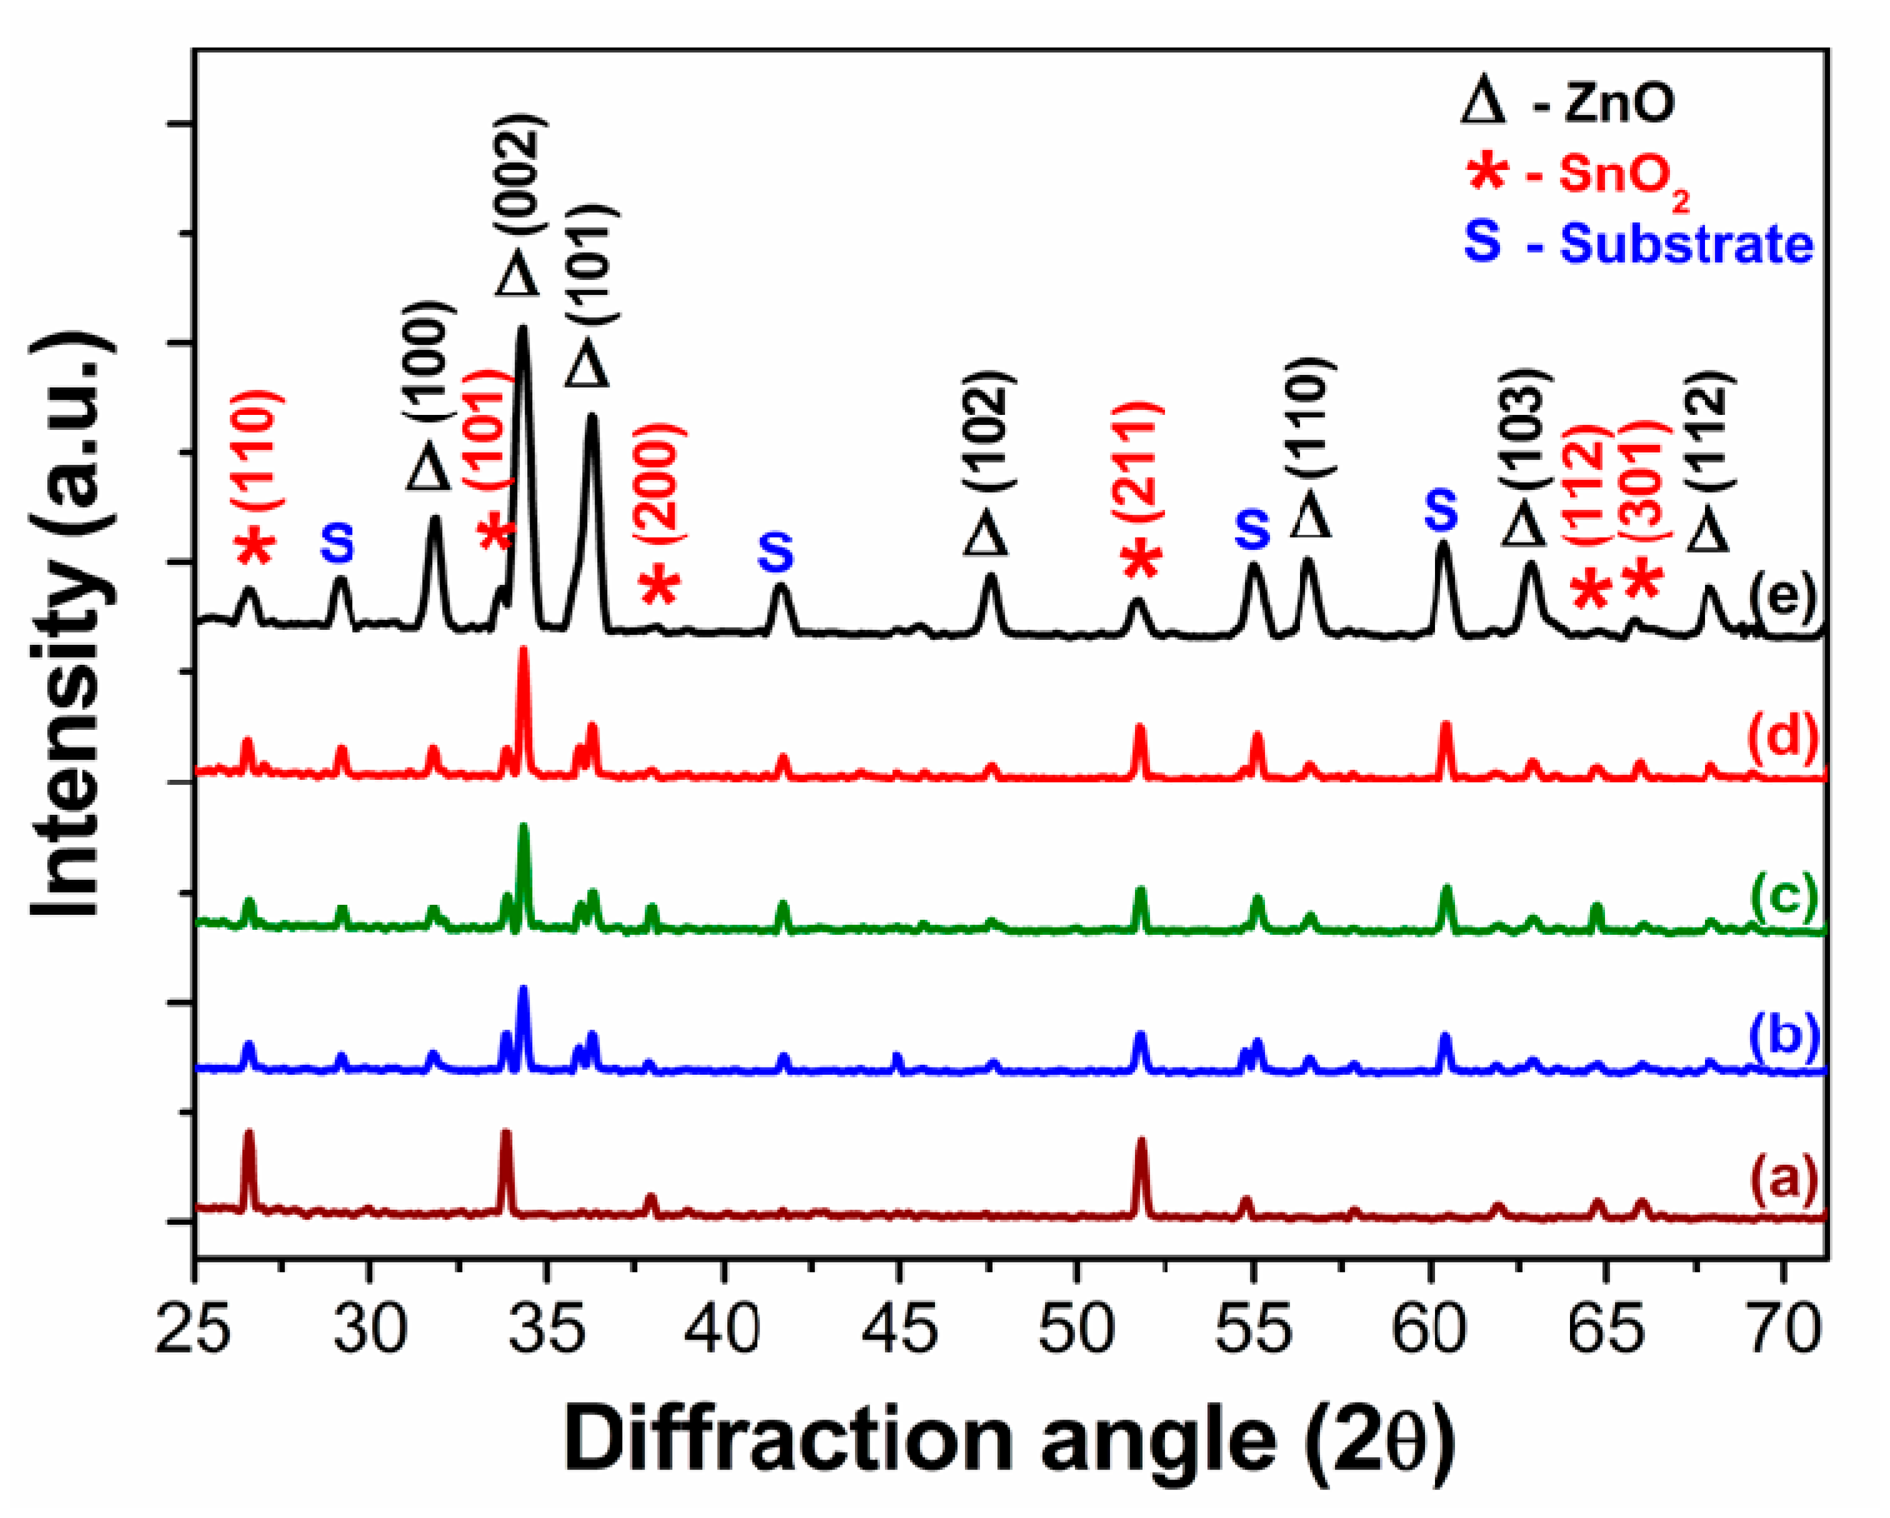
XRD diffraction patterns of nanostructures (Figure 2) confirmed the crystal structure of the as-grown SnO2/ZnO nanostructures. XRD results show that SnO2 and ZnO nanostructures exhibit the tetragonal rutile structure and hexagonal wurtzite structure, respectively. These agree well with those in the standard powder diffraction files Nos. 88-0287 and 79-0208, respectively. Some peaks in XRD diffraction patterns are identified to be from the carbon substrate that was used to hold the nanostructures on the XRD stub. Pure SnO2 nanowires were identified only at a lower growth time of 15 min. With the increase of the growth time from 30 min to 120 min, the intensity of ZnO peaks increased, and the presence of the SnO2 phase was identified. Sharp diffraction peaks confirm that the phases possess good crystallinity.
Figure 3 shows FESEM images of SnO2/ZnO nanostructures grown for different growth times. Insets in the figures represent the magnified FESEM images of a single nanostructure. From Figure 3, it is obvious that the nanowires are transformed to a hierarchical nanostructure with increasing growth time. Rectangular cross-sectional nanowires are observed, when the growth time is 15 min (Figure 3a). Similar morphologies of SnO2 nanowires were previously reported by other authors [44–48]. The inset of Figure 3a exhibits the width-to-thickness aspect ratio of the nanowire to be around 2:1. Actually, the width ranges from 20 to 50 nm with an average length of ∼30 μm. The nanowires grown for 30 min have a circular cross-section with several tens of micrometers in length and a diameter ranging from 50 to 100 nm (Figure 3b). The inset of Figure 3b shows the magnified view of a circular nanowire with a diameter of ∼70 nm. With the increase of the growth time from 60 min to 120 min, the amount of hierarchical nanostructures increased (Figure 3c–e). At the same time, the length of the branch in hierarchical nanostructures increased from 50 nm to 150 nm, and the diameter also increased. For a long growth time of 120 min, all nanowires were completely changed to hierarchical nanostructures and individual branches merged into thicker branches (Figure 3e).
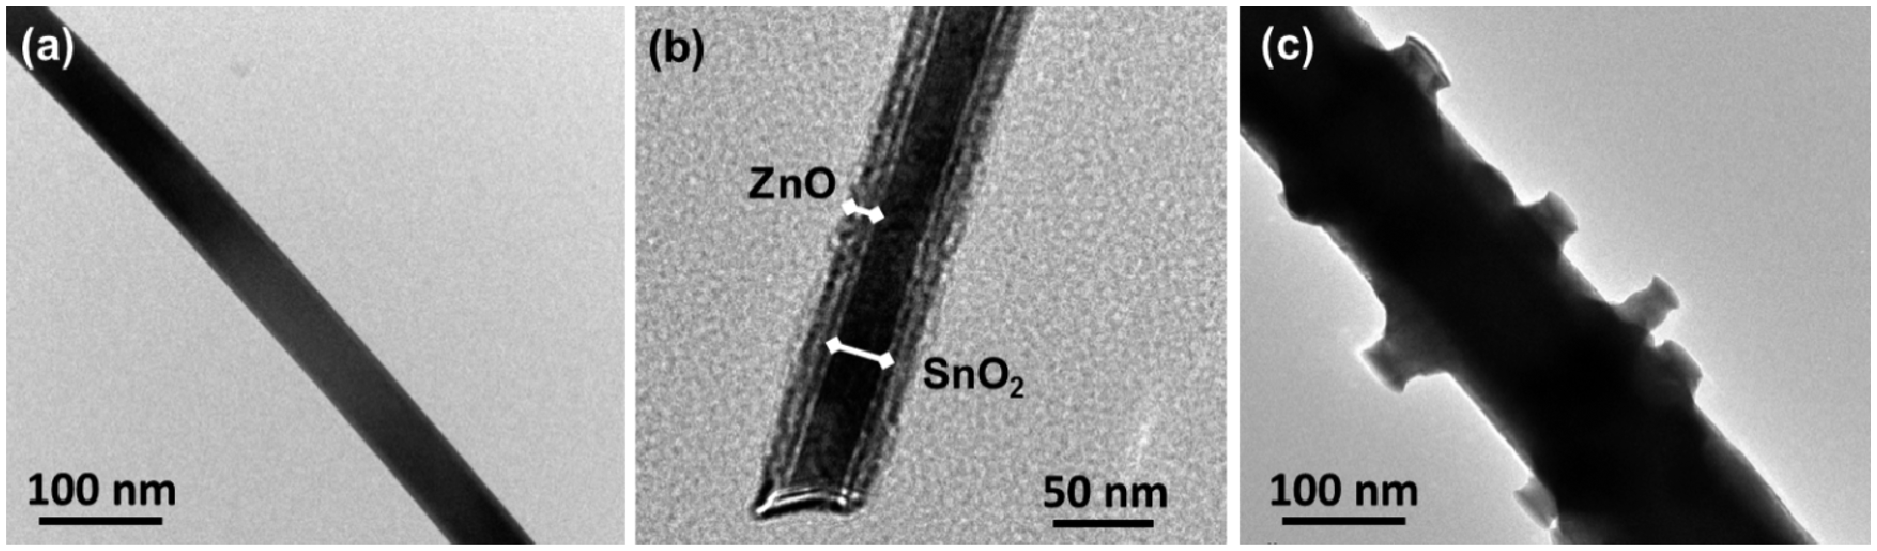
Figure 4 shows TEM images of SnO2/ZnO nanostructures grown for different time periods. The TEM image of a SnO2 nanowire grown for 15 min (Figure 4a) reveals that its average width is around 40 nm, and it is very uniform along its length. Figure 4b shows the TEM image of a typical SnO2-core/ZnO-shell nanowire obtained at a growth time of 30 min. The image shows that the diameter of the core is around 40 nm and the thickness of the shell layer is ∼20 nm. Catalyst tips are not observed, indicating that the growth of the nanostructures is not a vapor-liquid-solid (VLS), but a vapor-solid (VS) mechanism [49]. A low magnification TEM image of the hierarchical nanostructure obtained for a growth time of 120 min is shown in Figure 4c. The most part of the branches presumably broke off during TEM sample preparation by ultrasonication. It can be seen that the diameter of nanostructures increased with increasing deposition time.
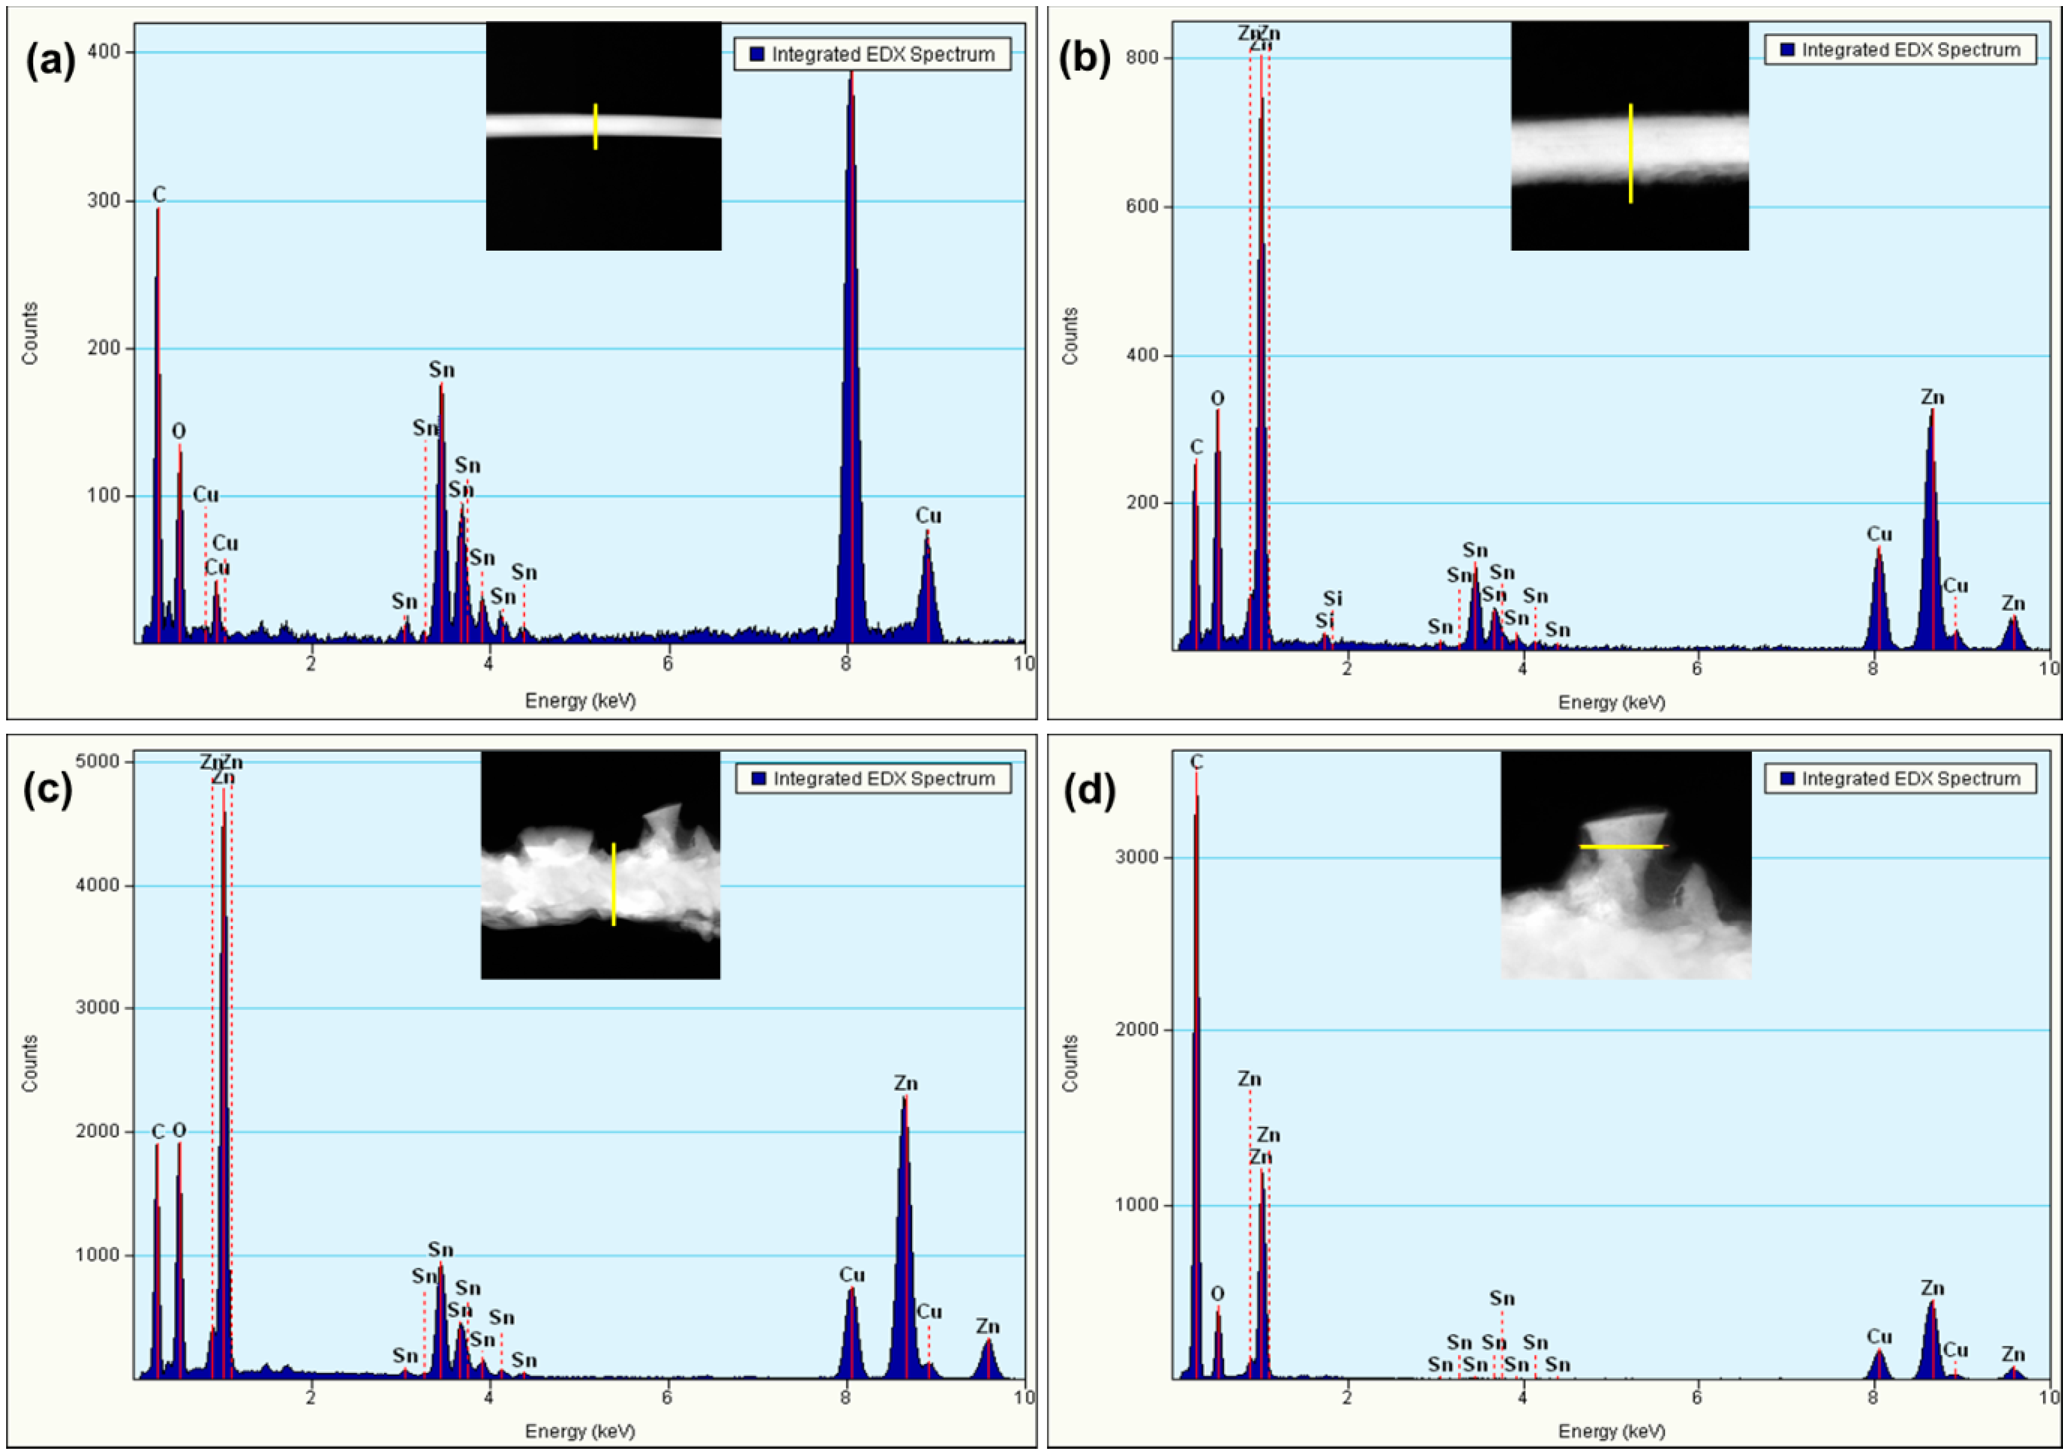
Integrated EDS spectra collected along a line on the SnO2/ZnO nanostructures under the TEM at various growth times are shown in Figure 5a–d. It reveals that the intensity of Zn content increases with increasing growth time. Figure 5a shows the integrated line profile EDS spectrum obtained for the growth time of 15 min. It clearly exhibits that only pure SnO2 nanowires are observed. The EDS spectrum of SnO2-core/ZnO-shell nanowires grown for 30 min shown in Figure 5b exhibits that both Sn and Zn are seen in the nanostructure. Figure 5c,d shows the EDS spectra taken at the trunk and branch of the hierarchical nanostructure, which is obtained for the growth time of 120 min. As seen in Figure 5c, both Sn and Zn are detected in the trunk of the hierarchical nanostructures. However, only Zn and O are detected for the branch of the hierarchical nanostructure (Figure 5d). Therefore, we can conclude that all branches are made up of pure ZnO, which are grown on top of SnO2-core/ZnO-shell nanostructures.
3.2. Growth Mechanism of SnO2-Core/ZnO-Shell Nanostructures
At a lower growth time of 15 min, SnO2 nanowires with a rectangular cross-section were obtained (inset Figure 3a). Generally, a compound with a lower vapor pressure condenses easily to form a solid phase as compared with a compound possessing a higher vapor pressure. It is reported that SnO2 has a lower vapor pressure than ZnO at the deposition temperature of 900 °C [50]. Due to the lower pressure, SnO2 starts to nucleate first and forms the core of the nanowires at a shorter growth time of 15 min. If the growth time is further increased to 30 min, the partial pressure of SnO2 goes down, as the source (ZnO:SnO2 = 9:1) contains more ZnO than SnO2. This makes the vapor saturated in ZnO(v) and creates a condition for ZnO to condense on top of the SnO2 nanowires in the form of a shell. Therefore, SnO2-core/ZnO-shell nanowires are observed at a deposition time of 30 min (inset of Figure 3b). Furthermore, hierarchical nanostructures are observed when the growth time further increases from 60 min to 120 min. We suggest that the growth of hierarchical nanostructures can be divided into two steps. In the first step, the SnO2 trunk nanowires grow, while the second step involves the growth of the ZnO shell layer on top of the SnO2 core. The thickness of the ZnO shell increases as more Zn vapor condenses with increased growth time. When the thickness of the ZnO shell layer reaches a critical value, then it acts as the seed layer for the growth of ZnO branches on top of the ZnO shell layer [51]. When the growth time increases to 120 min, SnO2(v) is mostly consumed, as source mixture contains more ZnO(s) than SnO2(s). Therefore, ZnO hierarchical nanostructures can grow with a further increase of growth time; whereas for longer growth time of 120 min, nanorods branches tend to merge into wider structures. All branches exhibit a hexagonal cross-section, which consist of ZnO only (inset Figure 3e). These branches come out perpendicular to the trunk of nanowires. While, most of the hybrid nanostructures have four-fold symmetry branches, a few six-fold symmetry nanowires were also reported [52].
The morphology of the nanostructures depends on the growth parameters, including growth temperature, and the amount of starting materials [53]. Zhang et al. [53] found that a starting mixture of aluminum and alumina powder around 200 mg in weight favored the growth of regular Al2O3 nanowires, while a larger amount of starting material around 500 mg induced the hierarchical nanostructures. In our case, the amount of ZnO and SnO2 powder in the starting material is around 732 mg and 151 mg, respectively. A larger amount of ZnO in the starting mixture is another reason for the growth of ZnO nanorod branches at a longer deposition time (120 min).
3.3. Gas Sensing Properties of SnO2-Core/ZnO-Shell Nanostructures
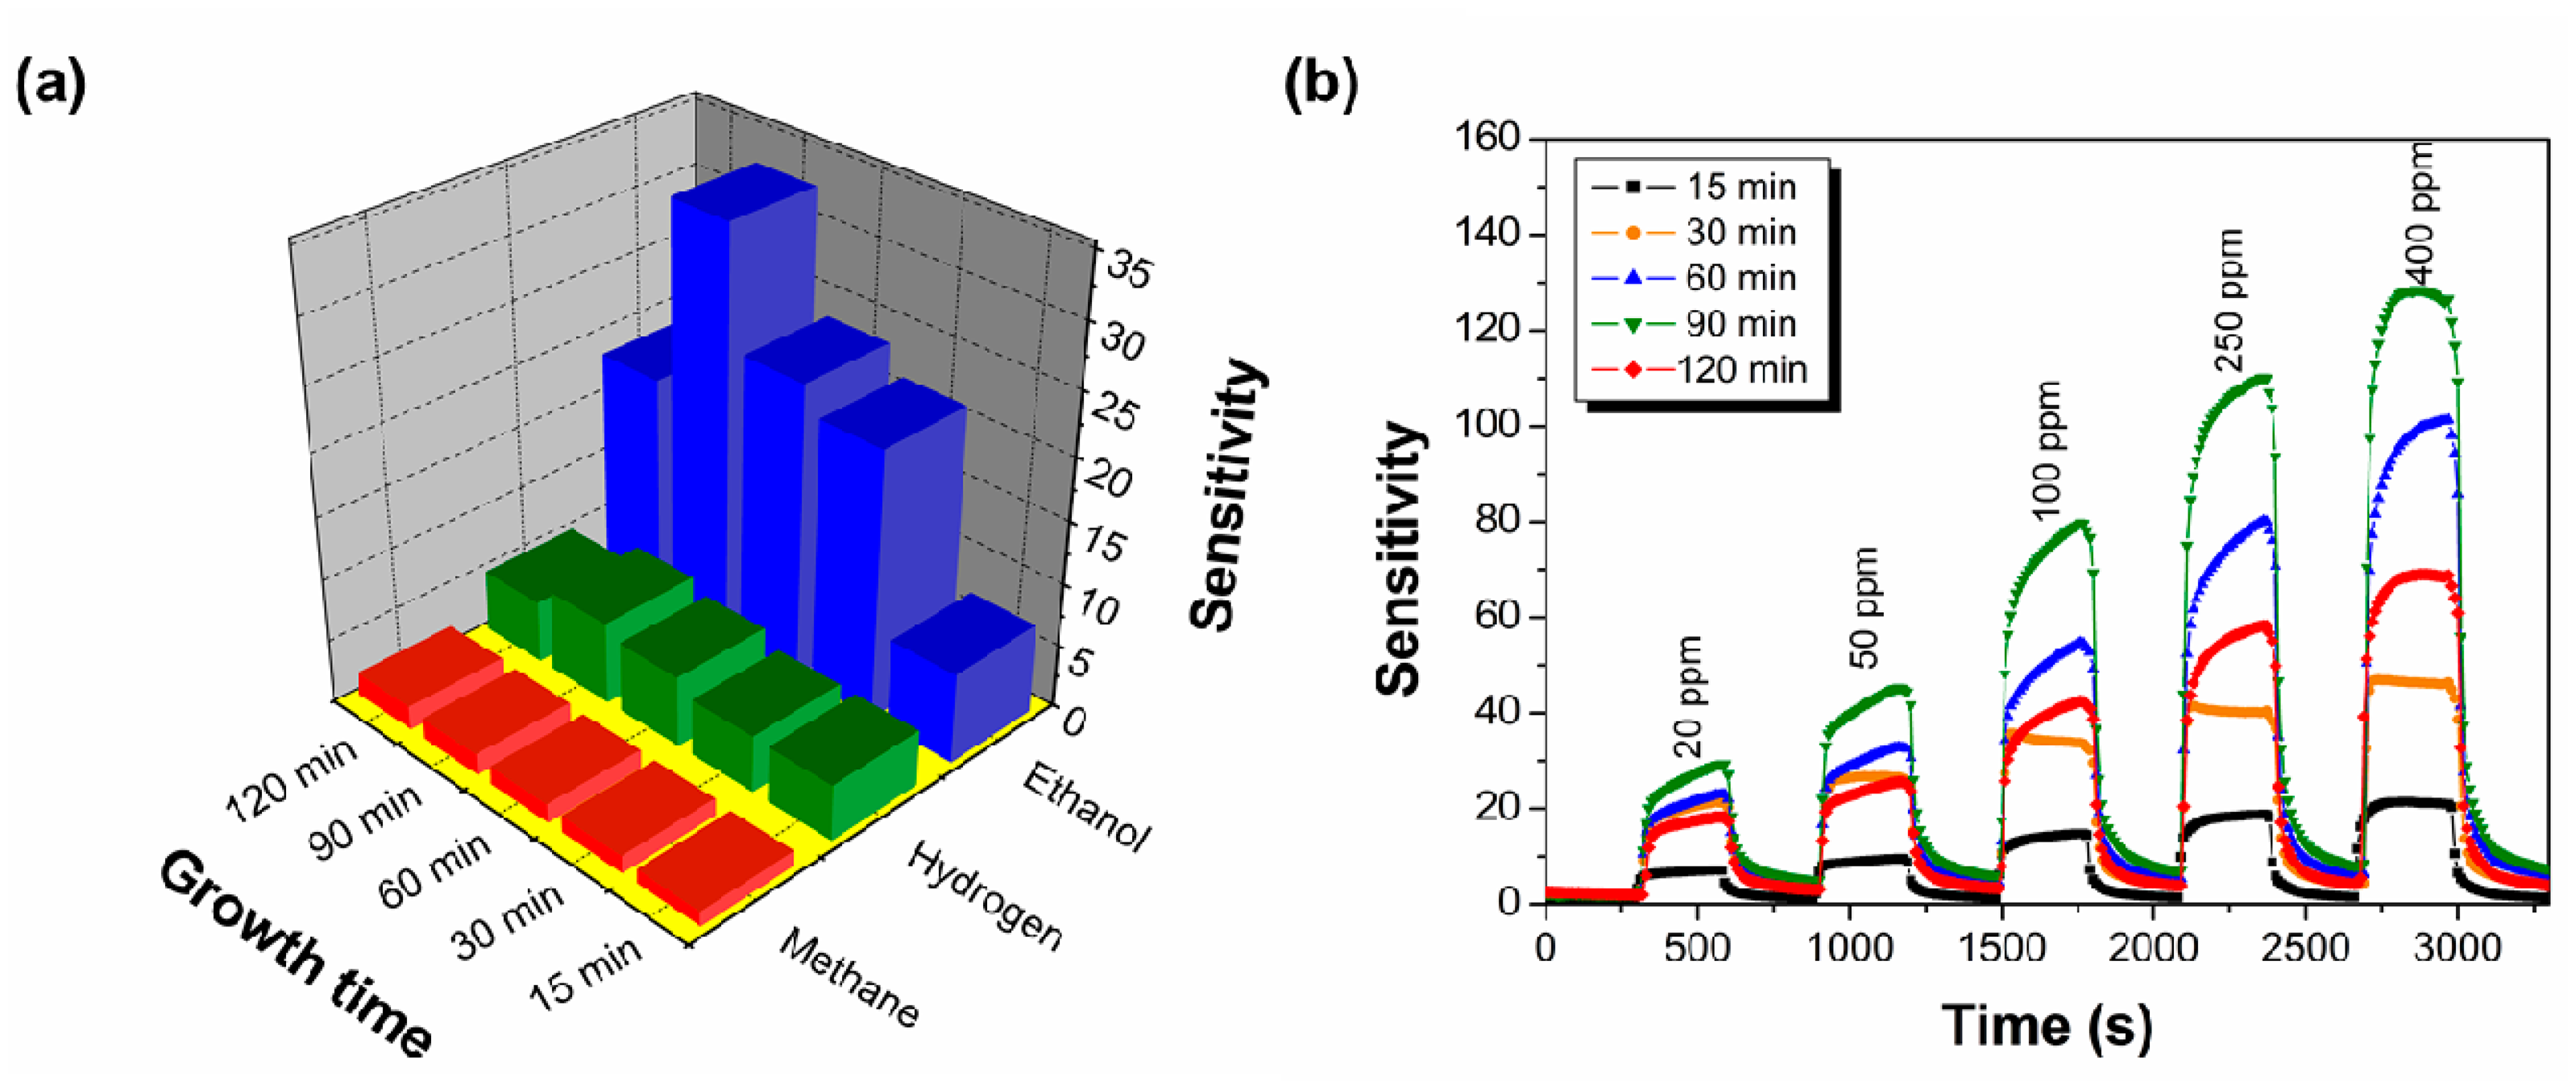
The bar chart of sensor responses of SnO2-core/ZnO-shell nanostructures in terms of sensitivity towards various gases at a fixed concentration of 20 ppm and a sensing temperature of 400 °C is illustrated in Figure 6a. It is noteworthy that SnO2-core/ZnO-shell nanostructures exhibit higher sensitivity towards ethanol than just SnO2 nanowires (growth time of 15 min). As shown in Figure 6, SnO2-core/ZnO-shell nanostructures grown for 90 min have the highest response towards ethanol. It is also seen that the sensors exhibit a poor response to hydrogen and are almost insensitive to methane. Selectivity coefficients are calculated between the highest response of the test gas and the other test gases. The selectivity coefficients of Kethanol/hydrogen and Kethanol/methane (where, Kethanol/hydrogen and Kethanol/methane are the sensitivity ratio between ethanol and hydrogen, and ethanol and methane, respectively) for SnO2-core/ZnO-shell nanostructures grown for 90 min are determined to be around eight and 32, respectively, to 20 ppm of test gases. The results indicate that the fabricated SnO2-core/ZnO-shell nanostructures grown for 90 min have a much higher selectivity toward ethanol. Liu et al. [54] reported that a sensor prepared using a 3D hierarchical porous ZnO structure functionalized by Au nanoparticles exhibited a sensitivity of 8.9 towards 50 ppm ethanol. Xue et al. [55] demonstrated that a Pt-loaded SnO2 nanorod sensor showed a sensitivity up to 9.5 towards 50 ppm of ethanol. Compared with the reported results, our results show that high sensitivity and selectivity towards ethanol sensors can be achieved without additives.
Figure 6b represents the dynamic gas response of the SnO2-core/ZnO-shell nanostructures to various ethanol concentrations of 20, 50, 100, 250 and 400 ppm at 400 °C. Obviously, SnO2-core/ZnO-shell hierarchical nanostructures exhibit higher sensitivity to ethanol than just SnO2 nanowires, which is obtained for a deposition time of 15 min. The enhancement of the ethanol gas sensing performance of hierarchical SnO2-core/ZnO-shell nanostructures can be attributed to the greater sensing surface area due to the hierarchical structure. It can be seen from Figure 6b that when exposed to 20 ppm ethanol, the responses are about 6.1, 20.4, 22.5, 31.9 and 17.3 for SnO2/ZnO nanostructures grown for 15, 30, 60, 90 and 120 min, respectively. The results show that optimum sensing was observed for the nanostructures grown for 90 min. As the ethanol concentration increased from 20 ppm to 400 ppm, the sensitivity increased from 32.9 to 128. Therefore, nanostructures grown for 90 min exhibit nearly a five-fold enhanced sensitivity compared to just SnO2 nanowires (which was obtained for a growth time of 15 min). A sudden drop in the ethanol response was observed when the nanostructures were grown for 120 min. A possible explanation for this is given later in the discussion of the mechanism.
3.4. Gas Sensing Mechanism of SnO2-Core/ZnO-Shell Nanostructures
According to the above sensing results, SnO2-core/ZnO-shell nanostructure sensors exhibit significantly improved ethanol sensing properties compared with just SnO2 nanowires grown for 15 min. The improvement in the sensing property is thought to be related to the core/shell nanostructures. ZnO and SnO2 are n-type semiconductors with different band gaps, electron affinities and work functions. The electron affinity (χ), work function (φ) and band gap (Eg) of ZnO are 4.3 eV, 5.2 eV and 3.37 eV, respectively, while for SnO2, these are 4.5 eV, 4.9 eV and 3.6 eV, respectively [56–58]. As seen in Figure 4b, a heterojunction has formed at the interface between SnO2-core and ZnO-shell. Figure 7 shows the possible energy band diagram of the fabricated SnO2-core/ZnO-shell nanostructures. Figure 7a shows that ZnO has a lower work function than SnO2. Therefore, electrons are transferred from SnO2 to ZnO until both Fermi levels become equal [56], which is shown in Figure 7b. An electron depletion layer is formed at the interface between SnO2 and ZnO, leading to a heterojunction barrier due to band bending. The enhanced sensing properties is ascribed to the variation of the heterojunction barrier when exposed to various kinds of gases [32].
Electron depletion region theory is widely used for sensing mechanism [59]. Electrons in the ZnO shell is depleted by adsorbing oxygen molecules from the air, leading to the formation of various ionized forms (O2−, O2−, O−) [60] when the SnO2-core/ZnO-shell nanostructures are exposed to air. When the core/shell sensor is exposed to ethanol, it reacts with adsorbed oxygen and releases the trapped electrons back to the conduction band of the ZnO shell by the dehydrogenation process [36], because ZnO and SnO2 are basic oxides. Thus, the resistance of the core/shell sensor is decreased, and the response is augmented. This fact is also supported by the fact that the resistance of just SnO2 nanowires is ∼7.5 MΩ, which is greater than that of the SnO2-core/ZnO-shell nanostructures (∼3.5 MΩ). The thickness of the shell is also another important parameter in gas sensing [32]. In gas sensors, the thickness of the shell material must be close to the Debye length of nanomaterials for the sensor to exhibit enhanced sensitivity [31]. This effect is called a synergistic effect. The value of the Debye length for metal oxides is in the range of 3–30 nm, which depends on the sensing material, charge carrier concentration and the ambient temperature [61,62]. Our result shows that the shell thickness of the nanostructures grown for 30 min is ∼20 nm (see Figure 4b). Therefore, SnO2-core/ZnO-shell nanowires grown for 30 min exhibit enhanced ethanol sensing compared to just SnO2 nanowire, because of the mechanisms explained above.
As described above, the proposed mechanism for the enhanced ethanol sensing of the SnO2-core/ZnO-shell hierarchical nanostructures grown for 60 min and 90 min is attributed to the synergistic effect of the encapsulation of SnO2 by ZnO nanostructures and the increased surface sites in the hierarchical structure. On the other hand, if the thickness of the shell is larger than 45 nm, the core/shell nanostructures have weak sensing characteristics [32]. In our previous work [41], we reported that the thickness of the ZnO shell increased to ∼50 nm when the core/shell nanostructures were grown for a longer time of 120 min. Thus, this sensor could not meet the synergistic effect, due to the increased shell thickness of 50 nm. Moreover, the thickness of the ZnO shell is larger compared to other core-shell nanostructures, due to the added amount of Zn condensed on the nanostructures with increased growth time. Therefore, SnO2-core/ZnO-shell nanostructures grown for 120 min behave just like ZnO nanowire sensors. For a longer growth time of 120 min, the branches of the SnO2-core/ZnO-shell hierarchical nanostructures tend to merge into coarser structures (see Figure 3e). As a result, sensing surface areas are reduced compared to other hierarchical core/shell nanostructures. Therefore, the sensor fabricated using SnO2-core/ZnO-shell hierarchical nanostructures deposited at 120 min exhibits lower sensing response than SnO2-core/ZnO-shell hierarchical nanostructures deposited at 90 min, because of their reduced sensing surface and shell thickness being greater than the Debye length. From these results, we can conclude that the size and morphology of nanostructures have significant influence on their sensing response to ethanol gas.
4. Conclusions
In conclusion, a highly sensitive device for ethanol gas sensing at 400 °C has been successfully developed using SnO2-core/ZnO-shell nanostructures by a single-step carbon-assisted thermal evaporation method. For an optimal growth time of 90 min of SnO2-core/ZnO-shell nanostructures exhibit high sensitivity (31.9 for 20 ppm), high selectivity (Kethanol/methane reaches 32 for 20 ppm of test gas) and a fast response and recovery behavior at 400 °C. Thus, SnO2-core/ZnO-shell nanostructures prepared by a facile fabrication method are promising candidates for the detection of ethanol gas with desired performances. This improvement in ethanol gas response is attributed to the large surface area providing active sites for gas-solid interactions and the synergistic effect of the encapsulation of SnO2 by ZnO nanostructures.
Acknowledgments
The authors would like to acknowledge the financial support from the High Impact Research (HIR) Grant, University of Malaya (Project No. UM.C/625/1/HIR/MOHE/ENG/26). T.T acknowledges the Bright Spark Unit, University of Malaya, for a Bright Spark scholarship.
Conflicts of Interest
The authors declare no conflict of interest.
Author Contributions
This research work was carried out in collaboration among the authors. T.T. carried out the experimental work and prepared the draft manuscript. A.S.M.A.H and S.A.A supervised the work of T.T. and contributed to the technical discussion and language editing. M.F.M.S and Y.H.W. contributed to the writing of the paper and the editing of the English. All authors read and approved the final manuscript.
References
- Sberveglieri, G. Recent developments in semiconducting thin-film gas sensors. Sens. Actuators B 1995, 23, 103–109. [Google Scholar]
- Yamazoe, N.; Miura, N. Environmental gas sensing. Sens. Actuators B 1994, 20, 95–102. [Google Scholar]
- Song, X.; Liu, L. Characterization of electrospun ZnO-SnO2 nanofibers for ethanol sensor. Sens. Actuators A Phys. 2009, 154, 175–179. [Google Scholar]
- Azad, A.; Akbar, S.; Mhaisalkar, S.; Birkefeld, L.; Goto, K. Solid-state gas sensors: A review. J. Electrochem. Soc. 1992, 139, 3690–3704. [Google Scholar]
- Wan, Q.; Li, Q.; Chen, Y.; Wang, T.; He, X.; Li, J.; Lin, C. Fabrication and ethanol sensing characteristics of ZnO nanowire gas sensors. Appl. Phys. Lett. 2004, 84, 3654–3656. [Google Scholar]
- Arafat, M.M.; Dinan, B.; Akbar, S.A.; Haseeb, A.S.M.A. Gas sensors based on one dimensional nanostructured metal-oxides: A review. Sensors 2012, 12, 7207–7258. [Google Scholar]
- Dar, G.N.; Umar, A.; Zaidi, S.A.; Baskuotas, S.; Hwang, S.W.; Abaker, M.; Al-Hajry, A.; Al-Sayari, S.A. Ultra-high sensitive ammonia chemical sensor based on ZnO nanopencils. Talanta 2012, 89, 155–161. [Google Scholar]
- Ibrahim, A.A.; Dar, G.N.; Zaidi, S.A.; Umar, A.; Abaker, M.; Bouzid, H.; Baskoutas, S. Growth and properties of Ag-doped ZnO nanoflowers for highly sensitive phenyl hydrazine chemical sensor application. Talanta 2012, 93, 257–263. [Google Scholar]
- Yamazoe, N. Toward innovations of gas sensor technology. Sens. Actuators B 2005, 108, 2–14. [Google Scholar]
- Yang, D.J.; Kamienchick, I.; Youn, D.Y.; Rothschild, A.; Kim, I.D. Ultrasensitive and highly selective gas sensors based on electrospun SnO2 nanofibers modified by Pd loading. Adv. Funct. Mater. 2010, 20, 4258–4264. [Google Scholar]
- Penza, M.; Rossi, R.; Alvisi, M.; Cassano, G.; Serra, E. Functional characterization of carbon nanotube networked films functionalized with tuned loading of Au nanoclusters for gas sensing applications. Sens. Actuators B Chem. 2009, 140, 176–184. [Google Scholar]
- Kim, S.J.; Hwang, I.S.; Na, C.W.; Kim, I.D.; Kang, Y.C.; Lee, J.H. Ultrasensitive and selective C2H5OH sensors using Rh-loaded In2O3 hollow spheres. J. Mater. Chem. 2011, 21, 18560–18567. [Google Scholar]
- Shen, Y.; Zhang, B.; Cao, X.; Wei, D.; Ma, J.; Jia, L.; Gao, S.; Cui, B.; Jin, Y. Microstructure and enhanced H2S sensing properties of Pt-loaded WO3 thin films. Sens. Actuators B Chem. 2014, 193, 273–279. [Google Scholar]
- Nanto, H.; Morita, T.; Habara, H.; Kondo, K.; Douguchi, Y.; Minami, T. Doping effect of SnO2 on gas sensing characteristics of sputtered ZnO thin film chemical sensor. Sens. Actuators B Chem. 1996, 36, 384–387. [Google Scholar]
- Qi, Q.; Zhang, T.; Zheng, X.; Fan, H.; Liu, L.; Wang, R.; Zeng, Y. Electrical response of Sm2O3 doped SnO2 to C2H2 and effect of humidity interference. Sens. Actuators B Chem. 2008, 134, 36–42. [Google Scholar]
- Tang, Z.H.; Yan, M.; Zhang, H.; Li, S.; Ma, X.; Wang, M.; Yang, D. A selective NH3 gas sensor based on Fe2O3-ZnO nanocomposites at room temperature. Sens. Actuators B Chem. 2006, 114, 910–915. [Google Scholar]
- Yu, J.; Choi, G. Current-voltage characteristics and selective CO detection of Zn2SnO4 and ZnO/Zn2SnO4, SnO2/Zn2SnO4 layered-type sensors. Sens. Actuators B Chem. 2001, 72, 141–148. [Google Scholar]
- Xu, X.; Zhao, P.; Wang, D.; Sun, P.; You, L.; Sun, Y.; Liang, X.; Liu, F.; Chen, H.; Lu, G. Preparation and gas sensing properties of hierarchical flower-like In2O3 microspheres. Sens. Actuators B Chem. 2013, 176, 405–412. [Google Scholar]
- Khoang, N.D.; Trung, D.D.; Van Duy, N.; Hoa, N.D.; Van Hieu, N. Design of SnO2/ZnO hierarchical nanostructures for enhanced ethanol gas-sensing performance. Sens. Actuators B Chem. 2012, 174, 594–601. [Google Scholar]
- Zhang, Y.; Xu, J.; Xiang, Q.; Li, H.; Pan, Q.; Xu, P. Brush-like hierarchical ZnO nanostructures: synthesis, photoluminescence and gas sensor properties. J. Phys. Chem. C 2009, 113, 3430–3435. [Google Scholar]
- Zhang, H.J.; Wu, R.F.; Chen, Z.W.; Liu, G.; Zhang, Z.N.; Jiao, Z. Self-assembly fabrication of 3D flower-like ZnO hierarchical nanostructures and their gas sensing properties. CrystEngComm. 2012, 14, 1775–1782. [Google Scholar]
- Zhang, S.; Ren, F.; Wu, W.; Zhou, J.; Xiao, X.; Lingling, S.; Liu, Y.; Jiang, C. Controllable synthesis of recyclable core-shell γ-Fe2O3@SnO2 hollow nanoparticles with enhanced photocatalytic and gas sensing properties. Phys. Chem. Chem. Phys. 2013, 15, 8228–8236. [Google Scholar]
- Wang, B.B.; Fu, X.X.; Liu, F.; Shi, S.L.; Cheng, J.P.; Zhang, X.B. Fabrication and gas sensing properties of hollow core–shell SnO2/α-Fe2O3 heterogeneous structures. J. Alloys Compd. 2014, 587, 82–89. [Google Scholar]
- Chen, Y.J.; Zhu, C.L.; Wang, L.J.; Gao, P.; Cao, M.S.; Shi, X.L. Synthesis and enhanced ethanol sensing characteristics of α-Fe2O3/SnO2 core–shell nanorods. Nanotechnology 2009, 20, 045502. [Google Scholar]
- Park, S.; Ko, H.; Kim, S.; Lee, C. Gas sensing properties of multiple networked GaN/WO3 core-shell nanowire sensors. Ceram. Int. 2014, 40, 8305–8310. [Google Scholar]
- Park, S.; An, S.; Ko, H.; Lee, S.; Kim, H.; Lee, C. Enhanced ethanol sensing properties of TiO2/ZnO core–shell nanorod sensors. Appl. Phys. A 2013, 1–7. [Google Scholar]
- Park, J.Y.; Choi, S.W.; Lee, J.W.; Lee, C.; Kim, S.S. Synthesis and gas sensing properties of TiO2–ZnO core-shell nanofibers. J. Am. Ceram. Soc. 2009, 92, 2551–2554. [Google Scholar]
- Chen, Y.; Zhu, C.; Wang, T. The enhanced ethanol sensing properties of multi-walled carbon nanotubes/SnO2 core/shell nanostructures. Nanotechnology 2006, 17, 3012. [Google Scholar]
- Choi, S.W.; Park, J.Y.; Kim, S.S. Synthesis of SnO2-ZnO core-shell nanofibers via a novel two-step process and their gas sensing properties. Nanotechnology 2009, 20, 465603. [Google Scholar]
- Hwang, I.S.; Kim, S.J.; Choi, J.K.; Choi, J.; Ji, H.; Kim, G.T.; Cao, G.; Lee, J.H. Synthesis and gas sensing characteristics of highly crystalline ZnO-SnO2 core-shell nanowires. Sens. Actuators B Chem. 2010, 148, 595–600. [Google Scholar]
- Park, S.; An, S.; Mun, Y.; Lee, C. UV-enhanced NO2 gas sensing properties of SnO2-core/ZnO-shell nanowires at room temperature. ACS Appl. Mater. Interfaces 2013, 5, 4285–4292. [Google Scholar]
- Chen, Y.J.; Xiao, G.; Wang, T.S.; Zhang, F.; Ma, Y.; Gao, P.; Zhu, C.L.; Zhang, E.; Xu, Z.; Li, Q. Synthesis and enhanced gas sensing properties of crystalline CeO2/TiO2 core/shell nanorods. Sens. Actuators B Chem. 2011, 156, 867–874. [Google Scholar]
- Si, S.; Li, C.; Wang, X.; Peng, Q.; Li, Y. Fe2O3/ZnO core–shell nanorods for gas sensors. Sens. Actuators B Chem. 2006, 119, 52–56. [Google Scholar]
- Zhang, J.; Liu, X.; Wang, L.; Yang, T.; Guo, X.; Wu, S.; Wang, S.; Zhang, S. Synthesis and gas sensing properties of α-Fe2O3@ZnO core–shell nanospindles. Nanotechnology 2011, 22, 185501. [Google Scholar]
- Chen, Y.J.; Xiao, G.; Wang, T.S.; Zhang, F.; Ma, Y.; Gao, P.; Zhu, C.L.; Zhang, E.; Xu, Z.; Li, Q. α-MoO3/TiO2 core/shell nanorods: Controlled-synthesis and low-temperature gas sensing properties. Sens. Actuators B Chem. 2011, 155, 270–277. [Google Scholar]
- Zhu, C.L.; Yu, H.L.; Zhang, Y.; Wang, T.S.; Ouyang, Q.Y.; Qi, L.H.; Chen, Y.J.; Xue, X.Y. Fe2O3/TiO2 Tube-like nanostructures: synthesis, structural transformation and the enhanced sensing properties. ACS Appl. Mater. Interfaces 2012, 4, 665–671. [Google Scholar]
- Umar, A.; Kim, S.; Lee, Y.S.; Nahm, K.; Hahn, Y. Catalyst-free large-quantity synthesis of ZnO nanorods by a vapor–solid growth mechanism: structural and optical properties. J. Cryst. Growth 2005, 282, 131–136. [Google Scholar]
- Lan, C.; Gong, J.; Su, Y.; Li, K.; Yang, S. Synthesis and photoluminescence properties of SnO2/ZnO hierarchical nanostructures. Physica E 2012, 44, 791–796. [Google Scholar]
- Yao, B.; Chan, Y.; Wang, N. Formation of ZnO nanostructures by a simple way of thermal evaporation. Appl. Phys. Lett. 2002, 81, 757–759. [Google Scholar]
- Fouad, O.; Glaspell, G.; El-Shall, M. Growth and characterization of ZnO, SnO2 and ZnO/SnO2 nanostructures from the vapor phase. Top. Catal. 2008, 47, 84–96. [Google Scholar]
- Tharsika, T.; Haseeb, A.S.M.A.; Akbar, S.A.; Sabri, M.F.M. Catalyst free single-step fabrication of SnO2/ZnO core–shell nanostructures. Ceram. Int. 2014, 40, 7601–7605. [Google Scholar]
- Yang, H.; Zhang, X.; Tang, A. Mechanosynthesis and gas-sensing properties of In2O3/SnO2 nanocomposites. Nanotechnology 2006, 17, 2860. [Google Scholar]
- Ellingham, H.J.T. Reducibility of oxides and sulphides in metallurgical processes. J. Soc. Chem. Ind. 1944, 63, 125–133. [Google Scholar]
- Wang, J.; Liu, D.; Yan, X.; Yuan, H.; Ci, L.; Zhou, Z.; Gao, Y.; Song, L.; Liu, L.; Zhou, W. Growth of SnO2 nanowires with uniform branched structures. Solid State Commun. 2004, 130, 89–94. [Google Scholar]
- Nguyen, P.; Ng, H.T.; Kong, J.; Cassell, A.M.; Quinn, R.; Li, J.; Han, J.; McNeil, M.; Meyyappan, M. Epitaxial directional growth of indium-doped tin oxide nanowire arrays. Nano Lett. 2003, 3, 925–928. [Google Scholar]
- Ma, L.; Guo, T. Synthesis and field emission properties of needle-shaped SnO2 nanostructures with rectangular cross-section. Mater. Lett. 2009, 63, 295–297. [Google Scholar]
- Yu, W.; Li, X.; Gao, X.; Wu, F. Large-scale synthesis and microstructure of SnO2 nanowires coated with quantum-sized ZnO nanocrystals on a mesh substrate. J. Phys. Chem. B 2005, 109, 17078–17081. [Google Scholar]
- Leonardy, A.; Hung, W.Z.; Tsai, D.S.; Chou, C.C.; Huang, Y.S. Structural features of SnO2 nanowires and raman spectroscopy analysis. Cryst. Growth Des. 2009, 9, 3958–3963. [Google Scholar]
- Xue, X.; Chen, Y.; Wang, Y. Synthesis and ethanol sensing properties of ZnSnO3 nanowires. Appl. Phys. Lett. 2005, 86, 233101–233103. [Google Scholar]
- Lamoreaux, R.; Hildenbrand, D.; Brewer, L. High-temperature vaporization behavior of oxides II. oxides of Be, Mg, Ca, Sr, Ba, B, Al, Ga, In, Tl, Si, Ge, Sn, Pb, Zn, Cd, and Hg. J. Phys. Chem. Ref. Data 1987, 16, 419. [Google Scholar]
- Liu, J.; She, J.; Deng, S.; Chen, J.; Xu, N. Ultrathin seed-layer for tuning density of ZnO nanowire arrays and their field emission characteristics. J. Phys. Chem. C 2008, 112, 11685–11690. [Google Scholar]
- Cheng, C.; Liu, B.; Yang, H.; Zhou, W.; Sun, L.; Chen, R.; Yu, S.F.; Zhang, J.; Gong, H.; Sun, H. Hierarchical assembly of ZnO nanostructures on SnO2 backbone nanowires: Low-temperature hydrothermal preparation and optical properties. ACS nano 2009, 3, 3069–3076. [Google Scholar]
- Zhang, Y.; Li, R.; Zhou, X.; Cai, M.; Sun, X. Hierarchical Al2O3 nanobelts and nanowires: morphology control and growth mechanism. Cryst. Growth Des. 2009, 9, 4230–4234. [Google Scholar]
- Liu, X.; Zhang, J.; Wang, L.; Yang, T.; Guo, X.; Wu, S.; Wang, S. 3D hierarchically porous ZnO structures and their functionalization by Au nanoparticles for gas sensors. J. Mater. Chem. 2011, 21, 349–356. [Google Scholar]
- Xue, X.; Chen, Z.; Ma, C.; Xing, L.; Chen, Y.; Wang, Y.; Wang, T. One-step synthesis and gas-sensing characteristics of uniformly loaded Pt@SnO2 nanorods. J. Phys. Chem. C 2010, 114, 3968–3972. [Google Scholar]
- Zheng, L.; Zheng, Y.; Chen, C.; Zhan, Y.; Lin, X.; Zheng, Q.; Wei, K.; Zhu, J. Network structured SnO2/ZnO heterojunction nanocatalyst with high photocatalytic activity. Inorg. Chem. 2009, 48, 1819–1825. [Google Scholar]
- Zhang, Z.; Shao, C.; Li, X.; Zhang, L.; Xue, H.; Wang, C.; Liu, Y. Electrospun nanofibers of ZnO-SnO2 heterojunction with high photocatalytic activity. J. Phys. Chem. C 2010, 114, 7920–7925. [Google Scholar]
- Robertson, J.; Xiong, K.; Clark, S.J. Band gaps and defect levels in functional oxides. Thin Solid Films 2006, 496, 1–7. [Google Scholar]
- Wang, C.; Yin, L.; Zhang, L.; Xiang, D.; Gao, R. Metal oxide gas sensors: Sensitivity and influencing factors. Sensors 2010, 10, 2088–2106. [Google Scholar]
- Hsueh, T.J.; Hsu, C.L.; Chang, S.J.; Chen, I.C. Laterally grown ZnO nanowire ethanol gas sensors. Sens. Actuators B Chem. 2007, 126, 473–477. [Google Scholar]
- Ogawa, H.; Nishikawa, M.; Abe, A. Hall measurement studies and an electrical conduction model of tin oxide ultrafine particle films. J. Appl. Phys. 1982, 53, 4448–4455. [Google Scholar]
- Barsan, N.; Weimar, U. Conduction model of metal oxide gas sensors. J. Electroceram 2001, 7, 143–167. [Google Scholar]


© 2014 by the authors; licensee MDPI, Basel, Switzerland. This article is an open access article distributed under the terms and conditions of the Creative Commons Attribution license ( http://creativecommons.org/licenses/by/3.0/).
Share and Cite
Tharsika, T.; Haseeb, A.S.M.A.; Akbar, S.A.; Sabri, M.F.M.; Hoong, W.Y. Enhanced Ethanol Gas Sensing Properties of SnO2-Core/ZnO-Shell Nanostructures. Sensors 2014, 14, 14586-14600. https://doi.org/10.3390/s140814586
Tharsika T, Haseeb ASMA, Akbar SA, Sabri MFM, Hoong WY. Enhanced Ethanol Gas Sensing Properties of SnO2-Core/ZnO-Shell Nanostructures. Sensors. 2014; 14(8):14586-14600. https://doi.org/10.3390/s140814586
Chicago/Turabian StyleTharsika, T., A. S. M. A. Haseeb, Sheikh A. Akbar, Mohd Faizul Mohd Sabri, and Wong Yew Hoong. 2014. "Enhanced Ethanol Gas Sensing Properties of SnO2-Core/ZnO-Shell Nanostructures" Sensors 14, no. 8: 14586-14600. https://doi.org/10.3390/s140814586