An Ultrasonic Contactless Sensor for Breathing Monitoring

Abstract
: The monitoring of human breathing activity during a long period has multiple fundamental applications in medicine. In breathing sleep disorders such as apnea, the diagnosis is based on events during which the person stops breathing for several periods during sleep. In polysomnography, the standard for sleep disordered breathing analysis, chest movement and airflow are used to monitor the respiratory activity. However, this method has serious drawbacks. Indeed, as the subject should sleep overnight in a laboratory and because of sensors being in direct contact with him, artifacts modifying sleep quality are often observed. This work investigates an analysis of the viability of an ultrasonic device to quantify the breathing activity, without contact and without any perception by the subject. Based on a low power ultrasonic active source and transducer, the device measures the frequency shift produced by the velocity difference between the exhaled air flow and the ambient environment, i.e., the Doppler effect. After acquisition and digitization, a specific signal processing is applied to separate the effects of breath from those due to subject movements from the Doppler signal. The distance between the source and the sensor, about 50 cm, and the use of ultrasound frequency well above audible frequencies, 40 kHz, allow monitoring the breathing activity without any perception by the subject, and therefore without any modification of the sleep quality which is very important for sleep disorders diagnostic applications. This work is patented (patent pending 2013-7-31 number FR.13/57569).1. Introduction
Breathing is one of the essential functions for the survival of most living beings. Many processes to measure the respiration rate have been proposed: using a stretch sensor or impedance meter to detect chest expansion [1–3], a pulse oximeter and extracting the respiration rate from the raw data [4], an accelerometer to detect chest expansion and contraction [5,6], measuring airflow pressure by oral or nasal cannula, and many others. In case of sleep apnea diagnosis for example, polysomnography (PSG), the commonly used test, employs nasal cannula and chest belts. The main problem common to all these techniques is the presence of a device directly in contact with the subject. As an example, for children this may induce rejection behavior leading them to remove the device. This is also true in the case of sleeping subjects, where the presence of the device can significantly disrupt the falling asleep and sleep. There have been several attempts to devise contactless methods. Electromagnetic waves can sense chest movement by Doppler effect [7–10] or by analyzing the signal backscattered by breathing movements [11] and ultrasound waves telemeters permits detection of small body displacements during respiration [12,13]. These solutions give good results but remain indirect because they do not analyze the true air flow and therefore cannot easily detect obstructive sleep apnea (OSA). Contactless direct air flow analysis is far less common in the literature. A microphone to detect exhalation sounds is proposed in [14], a high precision single point infrared sensor is use in [15] and a US patent [16] was granted for a method based on phase differences between two ultrasonic waves traveling in opposite directions. Nevertheless, the first method is perturbed by ambient noises and so the microphone needs to be placed close to the face of the subject to obtain good results. Concerning the second method, the sensor has to be fixed in an accurate position while the third method is complicated to implement because the two waves must travel exactly the same distance in absence of air flow.
This study proposes a new ultrasonic contactless device [17] to measure the presence or the absence of respiration and in the first case its relative intensity and rate. This sensor can be used alone in low cost systems or in conjunction with other remote sensors to increase reliability in sleep apnea diagnostic applications.
The physical principle of this measure is to “illuminate” the subject's head with an acoustic wave emitted by a transducer, then recovering and analyzing the reflected wave. Under these conditions, any movement, both in the subject himself and in the exhaled airflow, induce a frequency shift in the signal which is the Doppler effect. Every part of the head which participate to the reflection has approximately the same relative speed component in the direction of the receiver. Moreover, this speed is mostly low except in the case of very rapid movements. Hence, the surface of the skin returns a wave that remains nearly coherent and gives a single (or narrow) low Doppler frequency shift. In contrast the exhaled air flow returns a wave with a wide Doppler shift due to the presence of turbulence. The relative speeds are also higher than in the case of the movement which leads to a higher and broader Doppler shift. By frequency filtering and averaging, it therefore becomes possible to obtain and discriminate air flow signal and head and shoulder movement signal.
2. Experimental Section
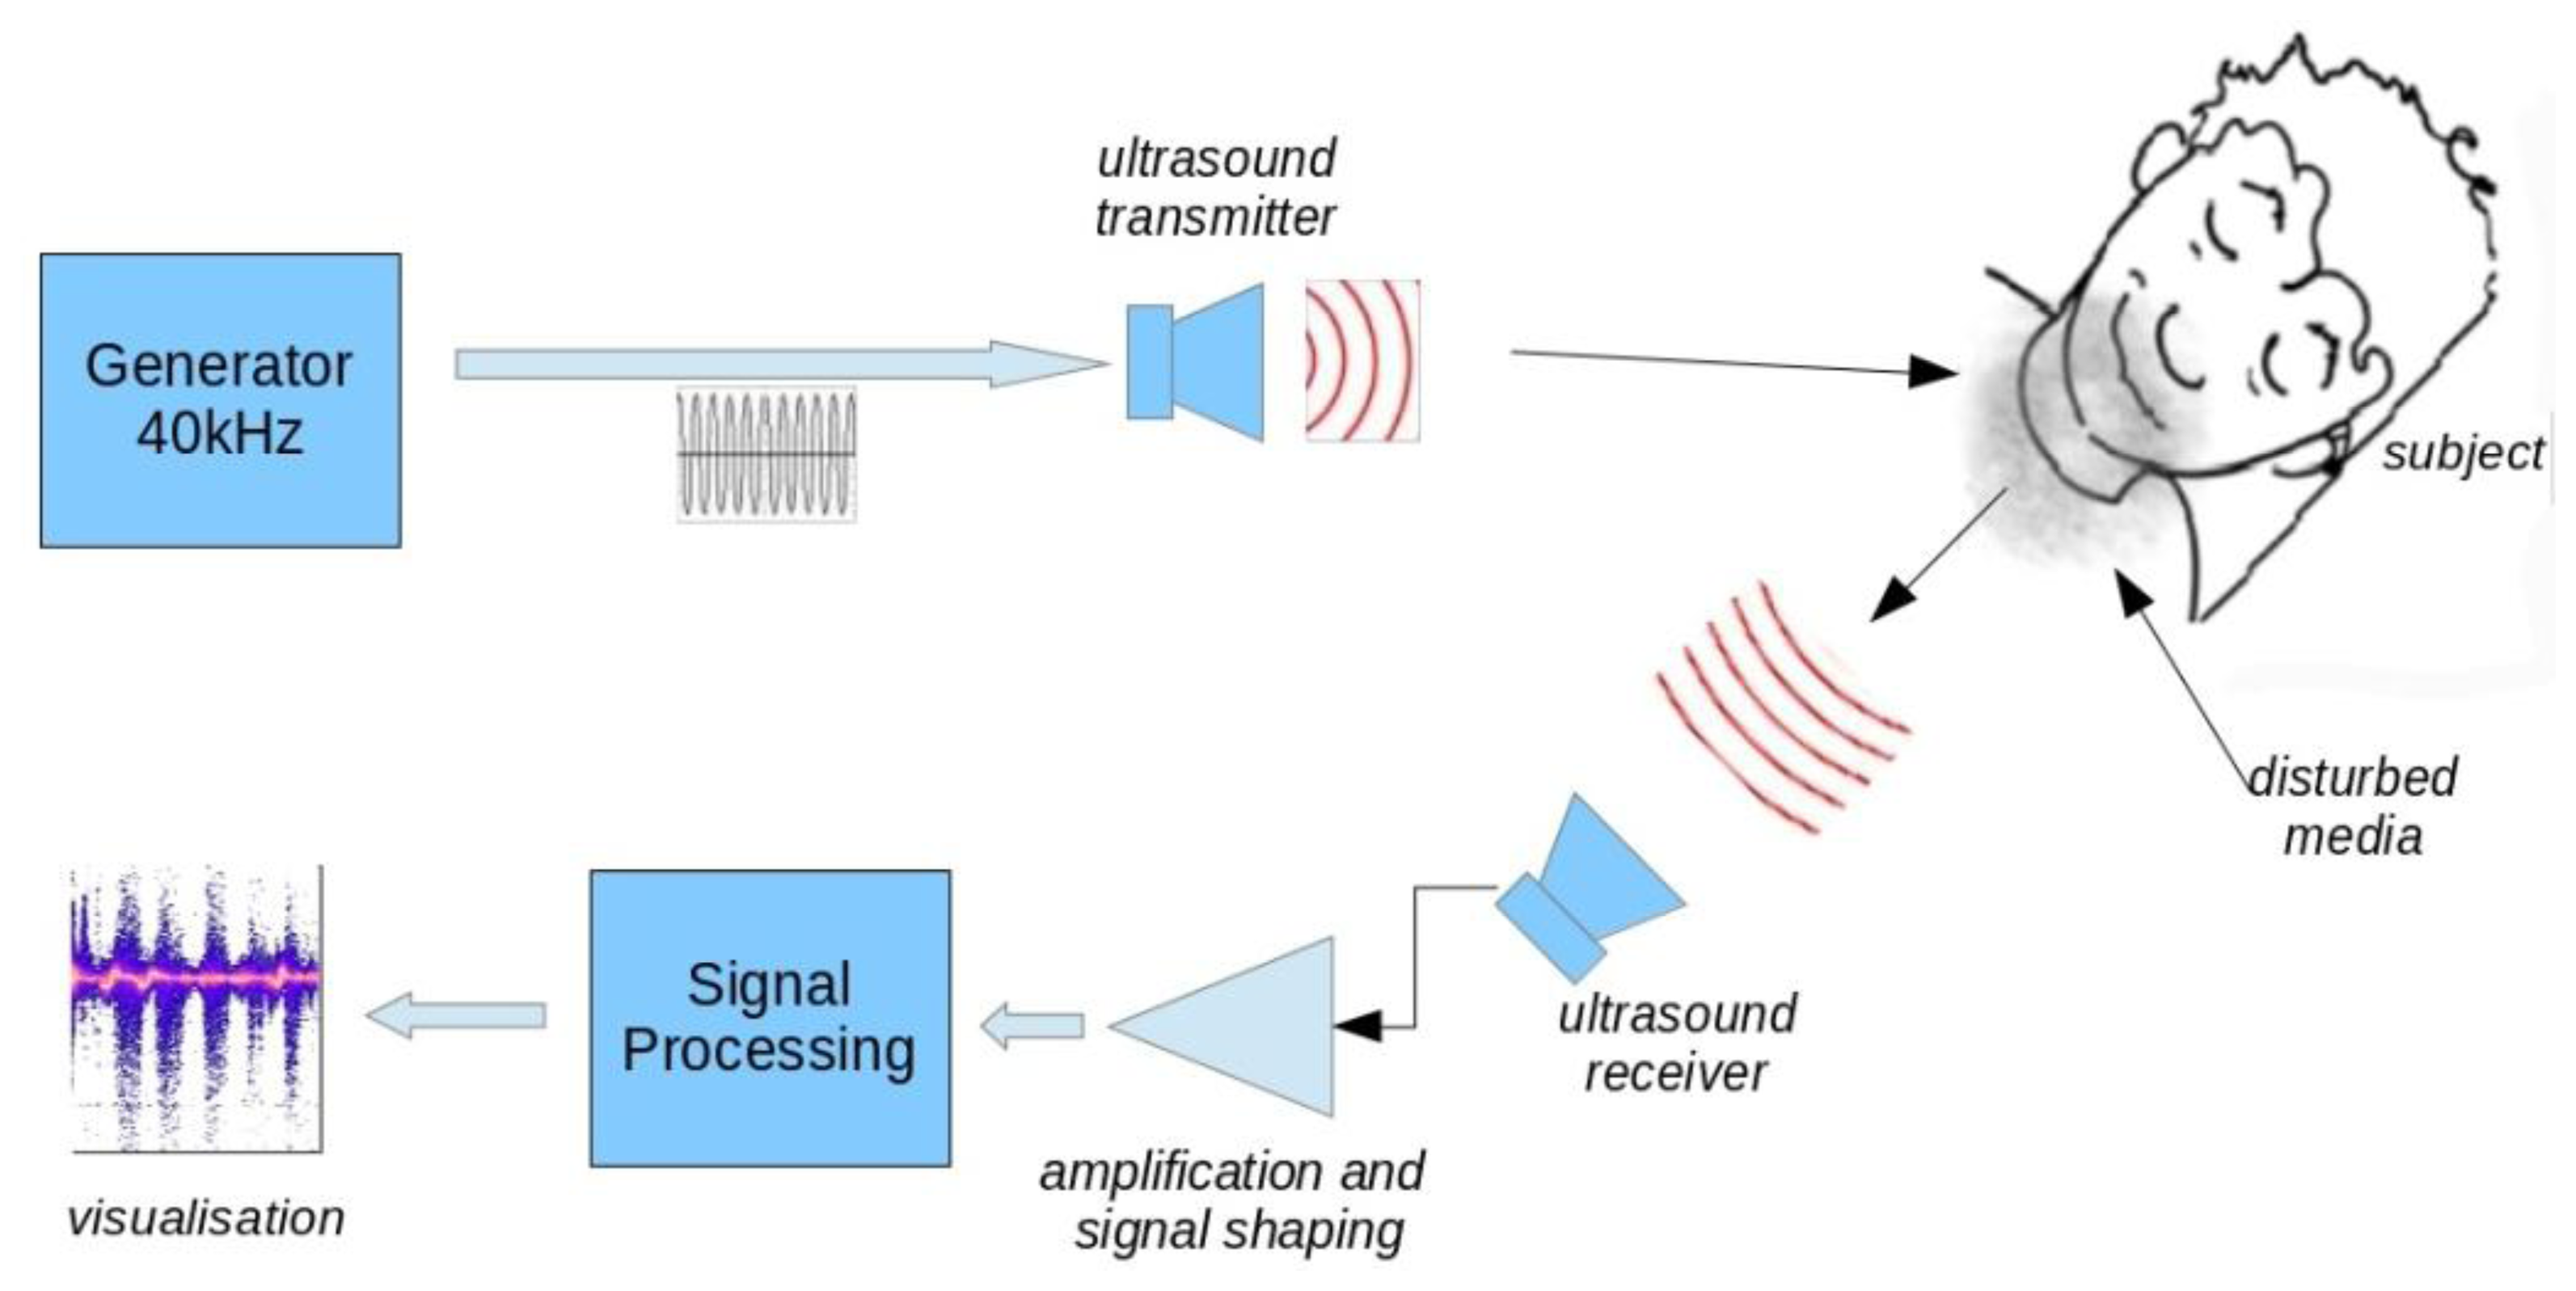
The apparatus developed in the context of this work, allows monitoring the breathing of a subject lying on his back. These conditions correspond to the situation encountered in breath monitoring during sleep, like sleep apnea diagnosis. A 40 kHz ultrasound transmitter illuminates an area widely including the subject's head. One receiver, tuned to the same frequency, recovers the signal reflected from the scene. After reflection on the local environment, the incident wave is subject to various transformations related to physical and chemical characteristics of the media encountered, but also, to the movements of the neighboring objects. The result is a combination of a level attenuation, a frequency shift, (i.e., Doppler effect), and a more complex effect resulting in a modification of spectral energy repartition versus time when the subject breathes out. The phenomenon, that we call “spectrum widening”, characterizes precisely the breath events and represents the core of this work.
Figure 1 shows the block diagram of the device. We used inexpensive 40 kHz ultrasonic transducers with a 6 dB beamwidth of 55°. The emitted level was set to about 100 dB/0.0002 μbar. The transmitter was placed above patient head at a distance of 50 cm. We found that transmitter to head distance was not critical due to the ultrasound level and large beamwidth used. Receiver sensitivity is −65 dB versus 1 V/μbar. The receiver placement is a compromise between the signal strength and the need to allow the subject to move without hitting the sensor. The best signal is obtained when the receiver is close to the subject and directed to the nostrils. We used a distance of 30 cm for all data presented in this work. This distance could be increased with better receiver sensitivity and higher transmitted level but there is a physical limit where the exhaled air flow effect on the environment becomes insignificant.
2.1. Acquisition and Shaping of the Received Signal
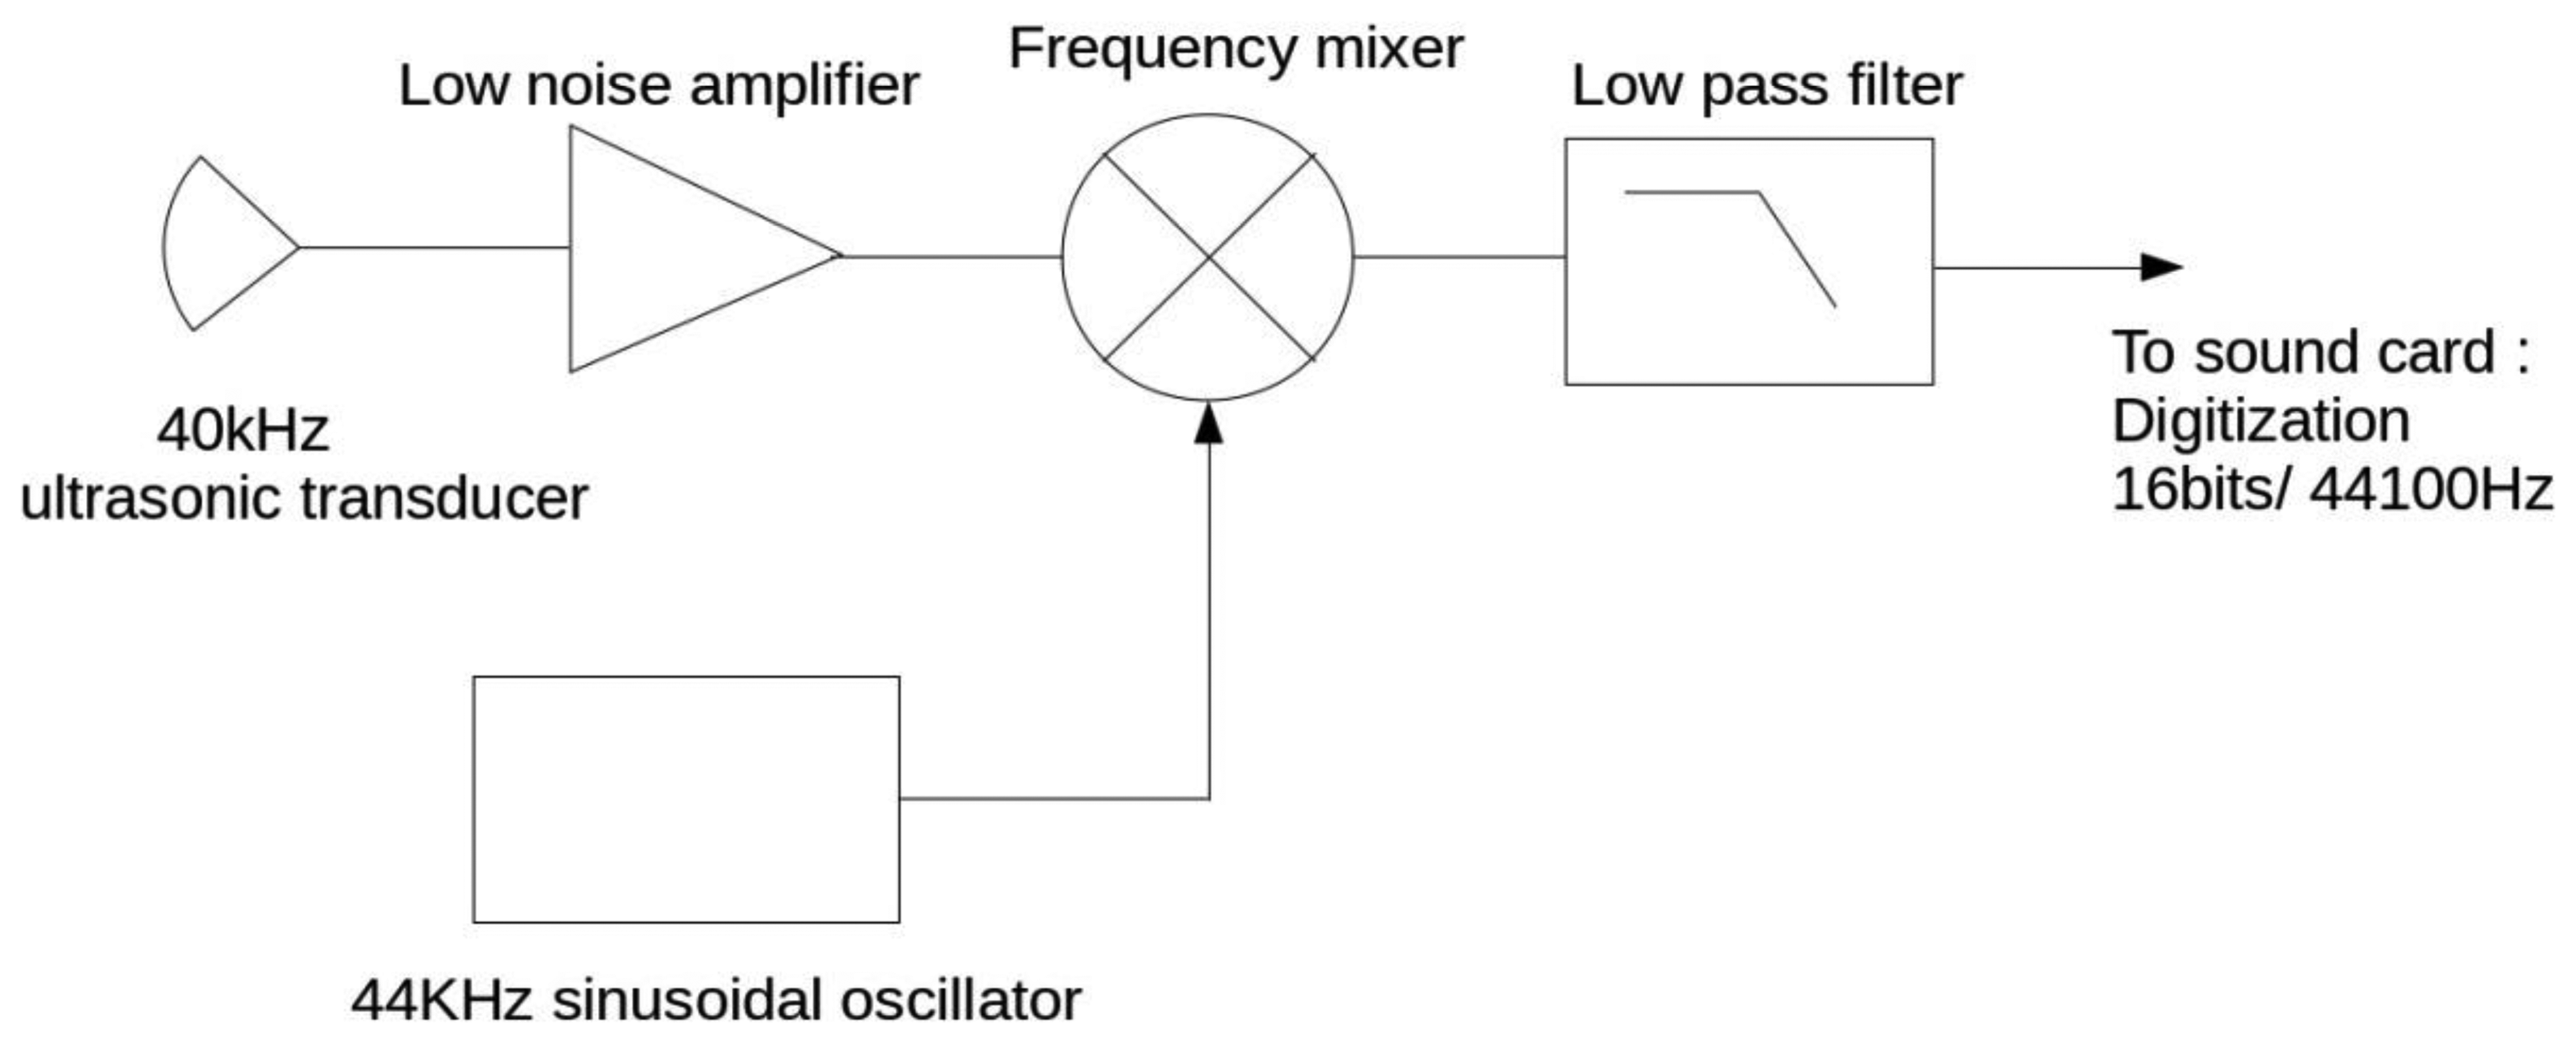
The signal received by the ultrasonic receiver is centered around the source frequency, 40 kHz. To digitize that signal by respecting the Nyquist–Shannon sampling theorem, a high sampling frequency and a fast A/D converter would be necessary. As the received signal is narrow band, spanning about 2 kHz below and above 40 kHz, frequency translation to a much lower intermediate frequency is possible. We have chosen to translate it around 4 kHz using a frequency mixer. The received signal is mixed with a 44 kHz sinusoidal signal to generate 4 kHz and 84 kHz beat products. The high frequency product is removed with a low pass anti-aliasing filter before digitization. The block diagram is shown in Figure 2. This solution presents the technical advantage to allow a low frequency digitization as, for example, with an inexpensive computer sound card.
To visualize the spectral widening, we have used a time/frequency representation based on a short time Fourier transform (STFT) as:
For computation, a 44.1 kHz sampled signal is used with a Kaiser-Bessel windowing function [18] of size 65,536. This respects the Heisenberg inequality and allows a good compromise between time and frequency resolutions.
2.2. Physical Principles
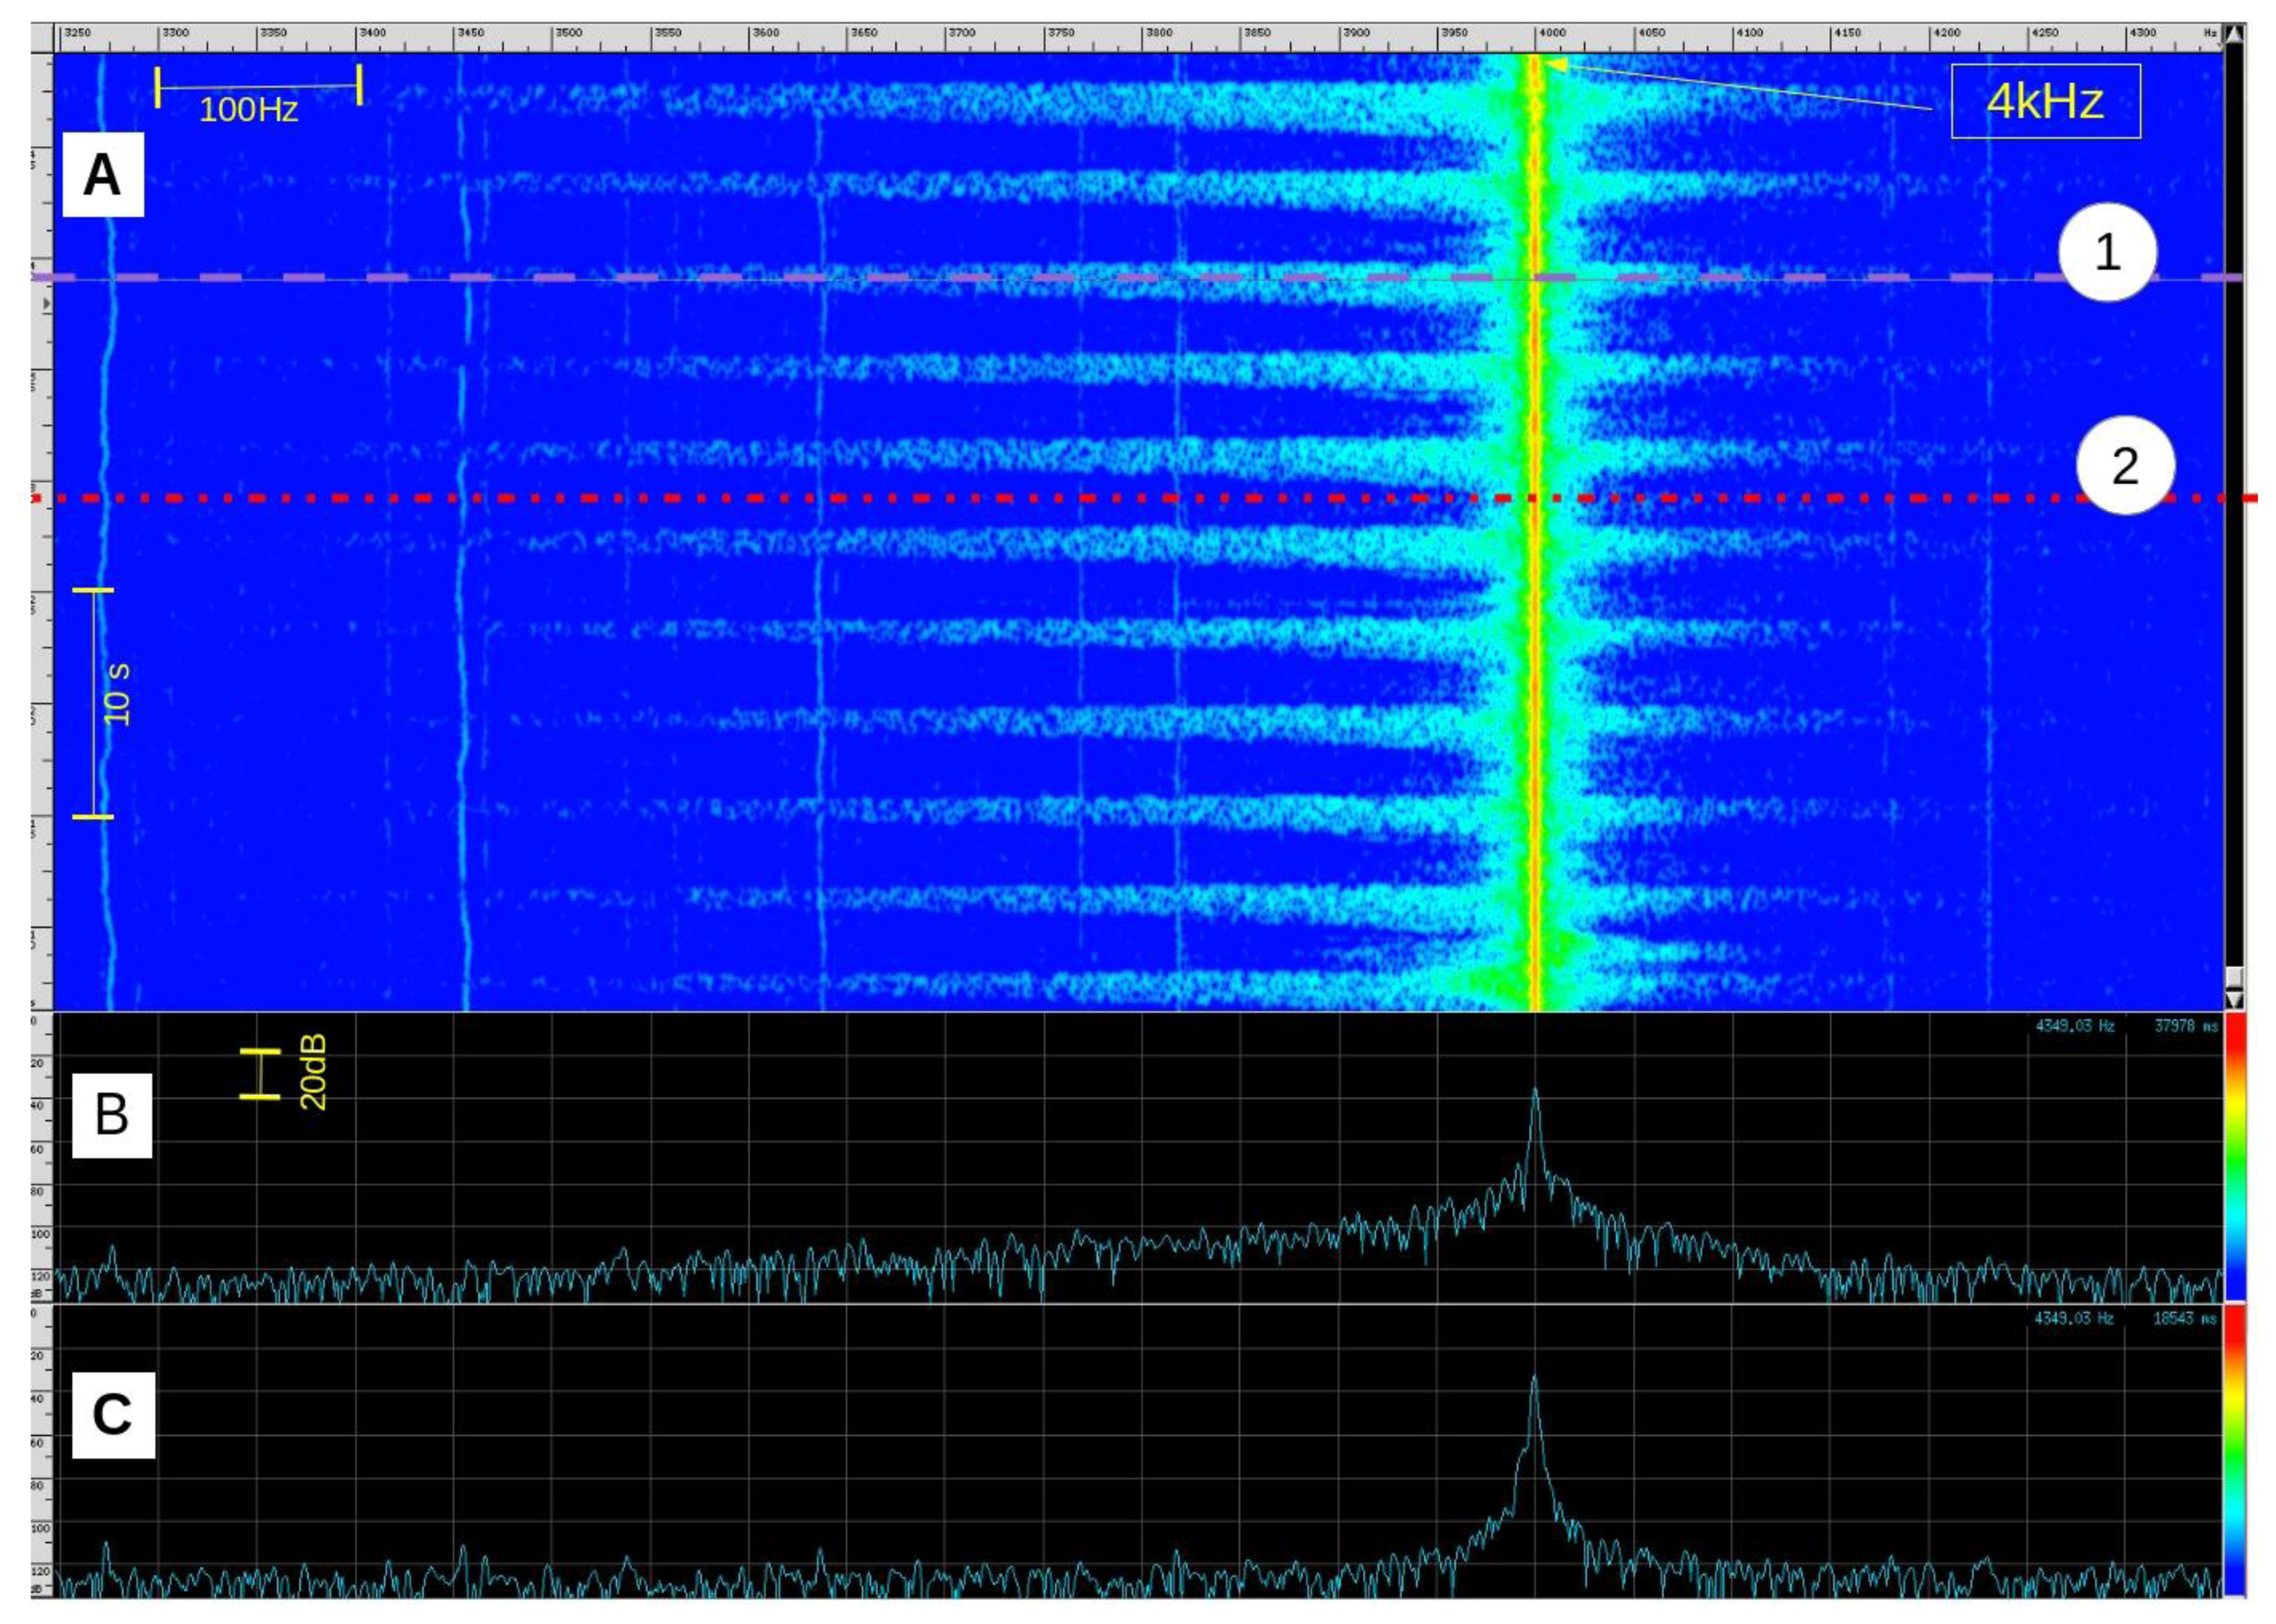
The observed phenomenon (Figure 3) is the result of several combined physical effects whose principal is the Doppler effect. We can nevertheless separate two main parts: the overall effect generated by the mean speed of expired airflow (mean speed v ≈ 1 m·s−1 and Doppler frequency shift Δf ≈ 100 Hz) and local effects caused by turbulence which produce greater frequency extensions (several hundreds of Hz above and/or below the transmit frequency).
The breathing exhalation flow can be assumed turbulent near its source (i.e., nose or mouth). In such a flow, unsteady vortices appear on many scales and interact with each other. The friction between the exhaled flow and the static surrounding environment increases and interacts with the ultrasound wave.
2.3. Sound-Vorticity Interaction
The phenomenon of scattering of sound by vorticity is known since the 1950's. Obukhov [19] showed that an incident ultrasonic plane wave passing through an area with flow vorticity is scattered by it.
Inside a flow, we can show that any velocity field can be decomposed into modes as:
Chu [20], in 1958, showed the existence of a coupling between these different modes. More recently, Lund and Rojas [21] have derived a convenient expression that connects the acoustic scattered pressure, pscat directly to the Fourier transform of the vorticity field:
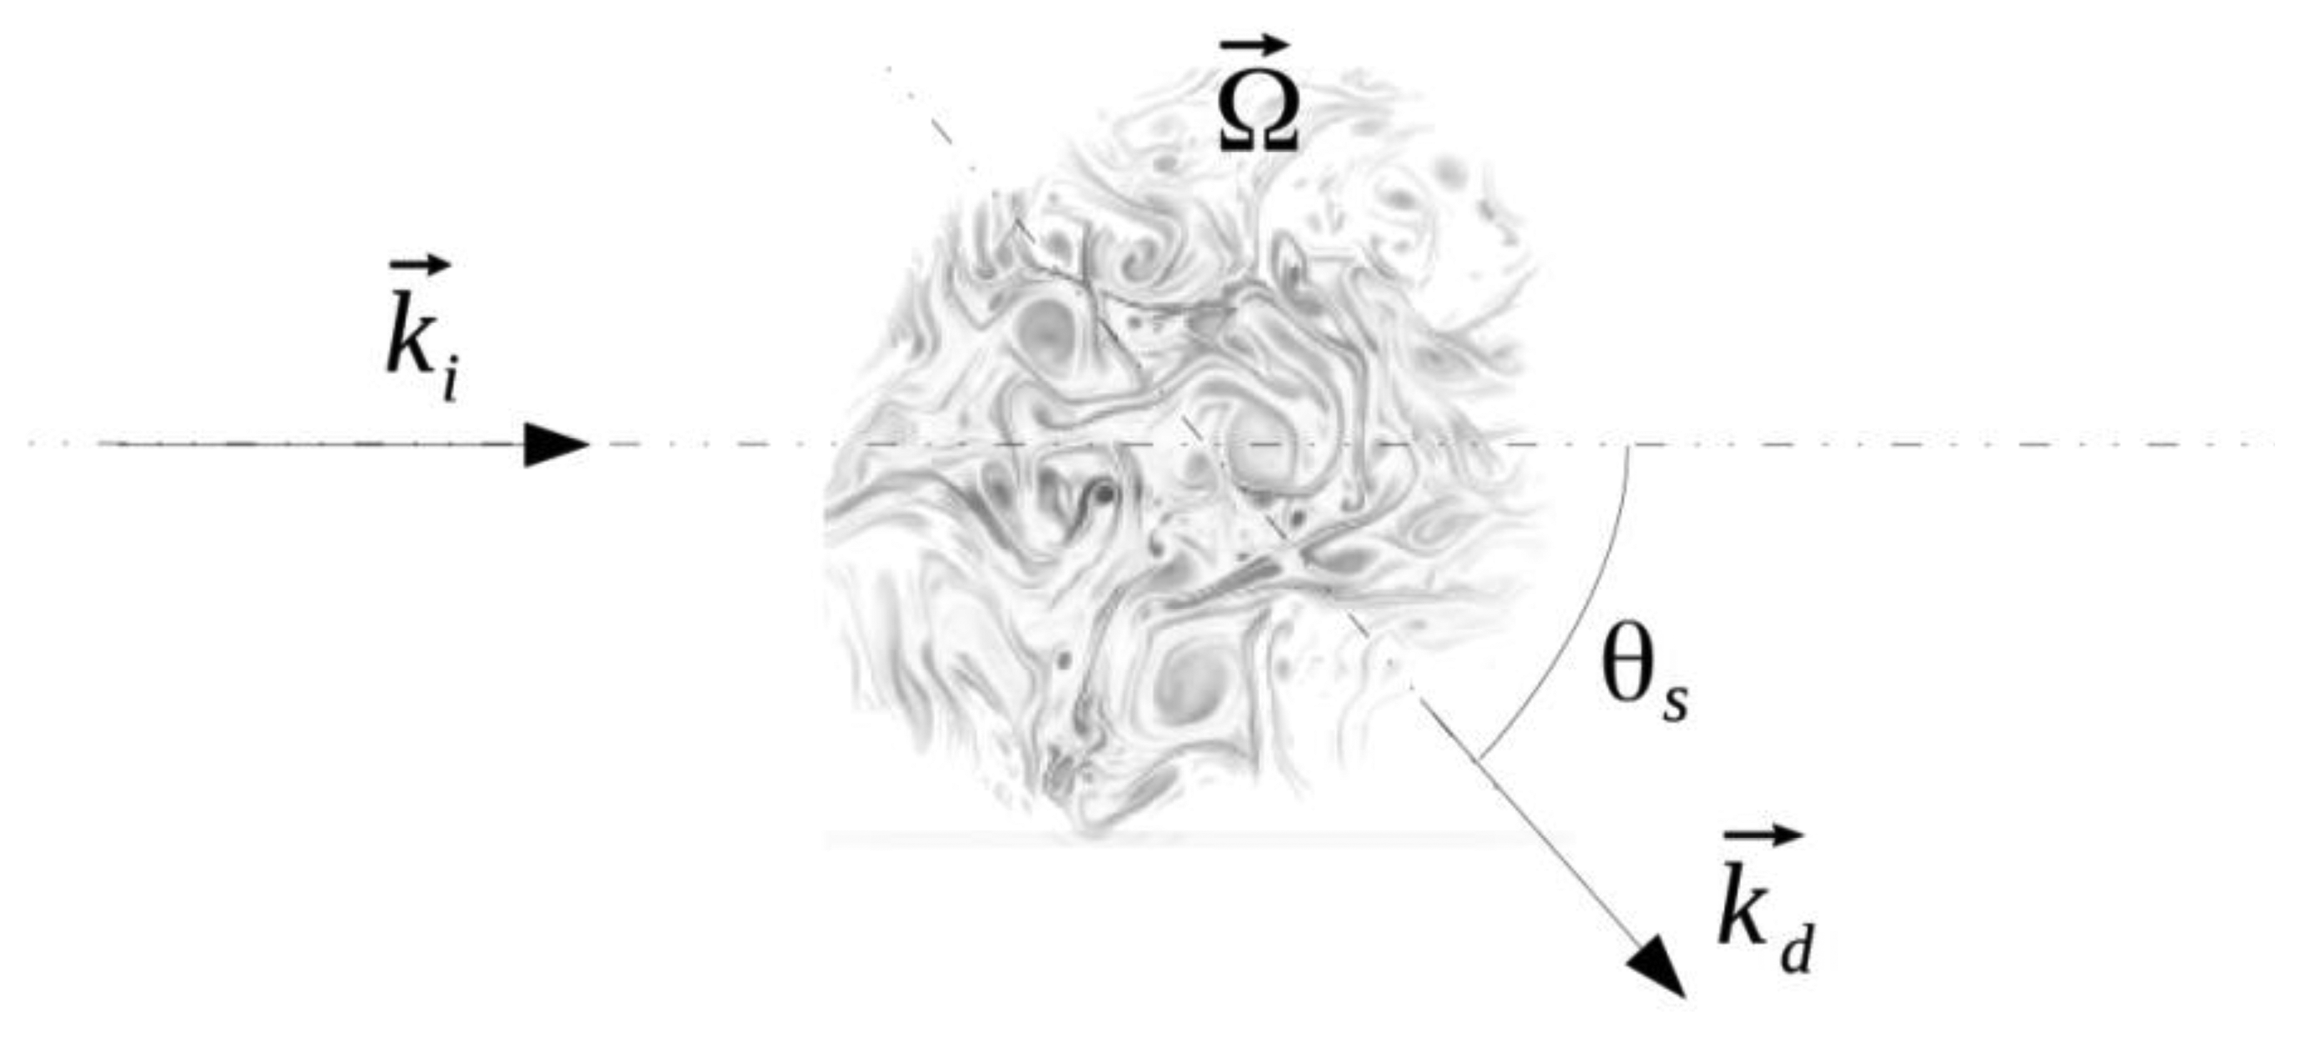
pinc the pressure amplitude of the plane incident wave of frequency v0 and wave vector ,
θs the diffusion angle (Figure 4),
v the scattered wave frequency of wave vector ,
the scattered wave vector,
Ω the vorticity component perpendicularly to the plane.
This shows a linear relationship between the acoustic scattered pressure pscat, the incident pressure pinc and the wave frequency v, thus the system would benefit from increasing the transmit level and the wave frequency. However, practical transducers of high frequency tend to have a reduced beamwidth which could limit the ability to detect breathing for all head positions.
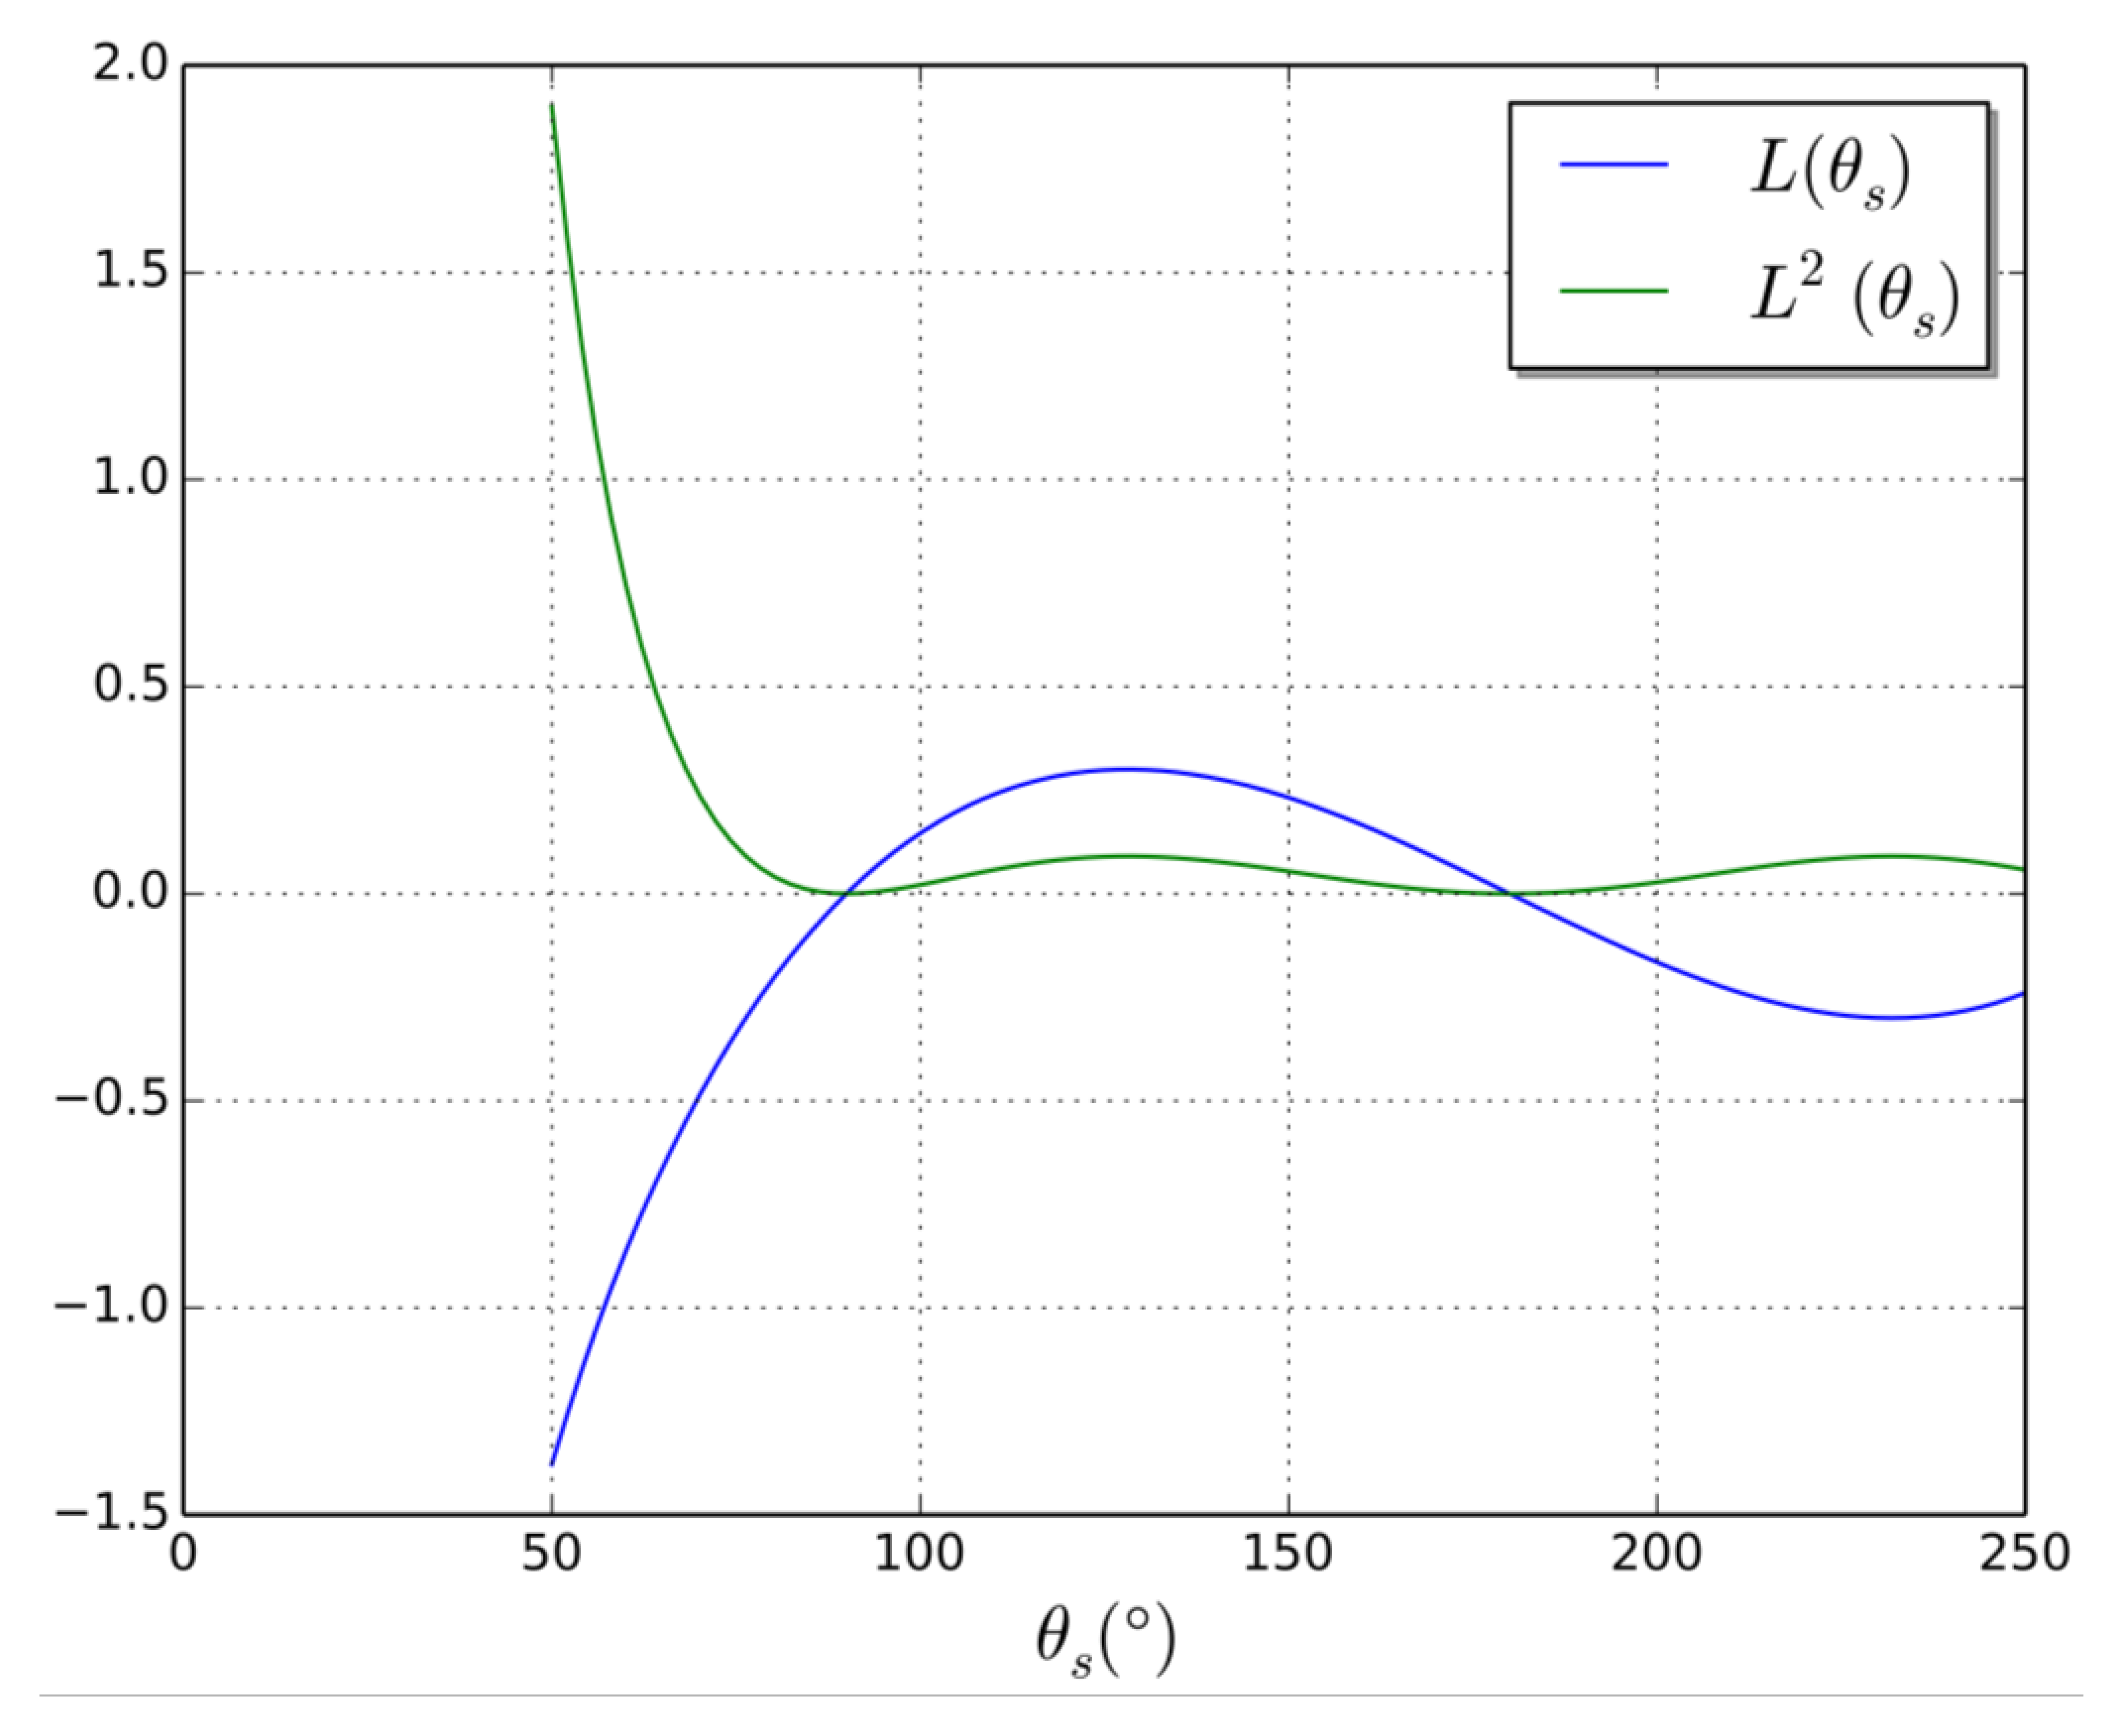
The angular term of the Lund formula that modulates the acoustic scattering intensity will be denoted by:
Figure 5, shows the evolution of L(θs) and L2(θs). This latter term modulates the acoustic scattering intensity. Note that the apparent divergence of this expression for small scattering angles is an artifact due to the conditions of validity of the Lund formula. Low angles would allow better scattered signal, but are not practical in our application. The optimum angle, experimentally determined, is in accordance with the second local maximum.
This shows that it is theoretically possible to measure the vorticity of a flow by diffusion of ultrasounds that corresponds to what is done by interpreting the spectrum of the acoustic received signal.
More physically, when the wave excites a vortex, this latter is advected by the oscillating velocity field of small amplitude u⃗p, the sound wave, and begins to oscillate. As an unsteady vortex is a sound source, the oscillating vortex will emit sound. Thus, the excitation by the incident wave will be scattered by the vorticity, in the same way that light is scattered by matter.
2.4. Influence of Experimental Conditions
Oral or Nasal Breathing
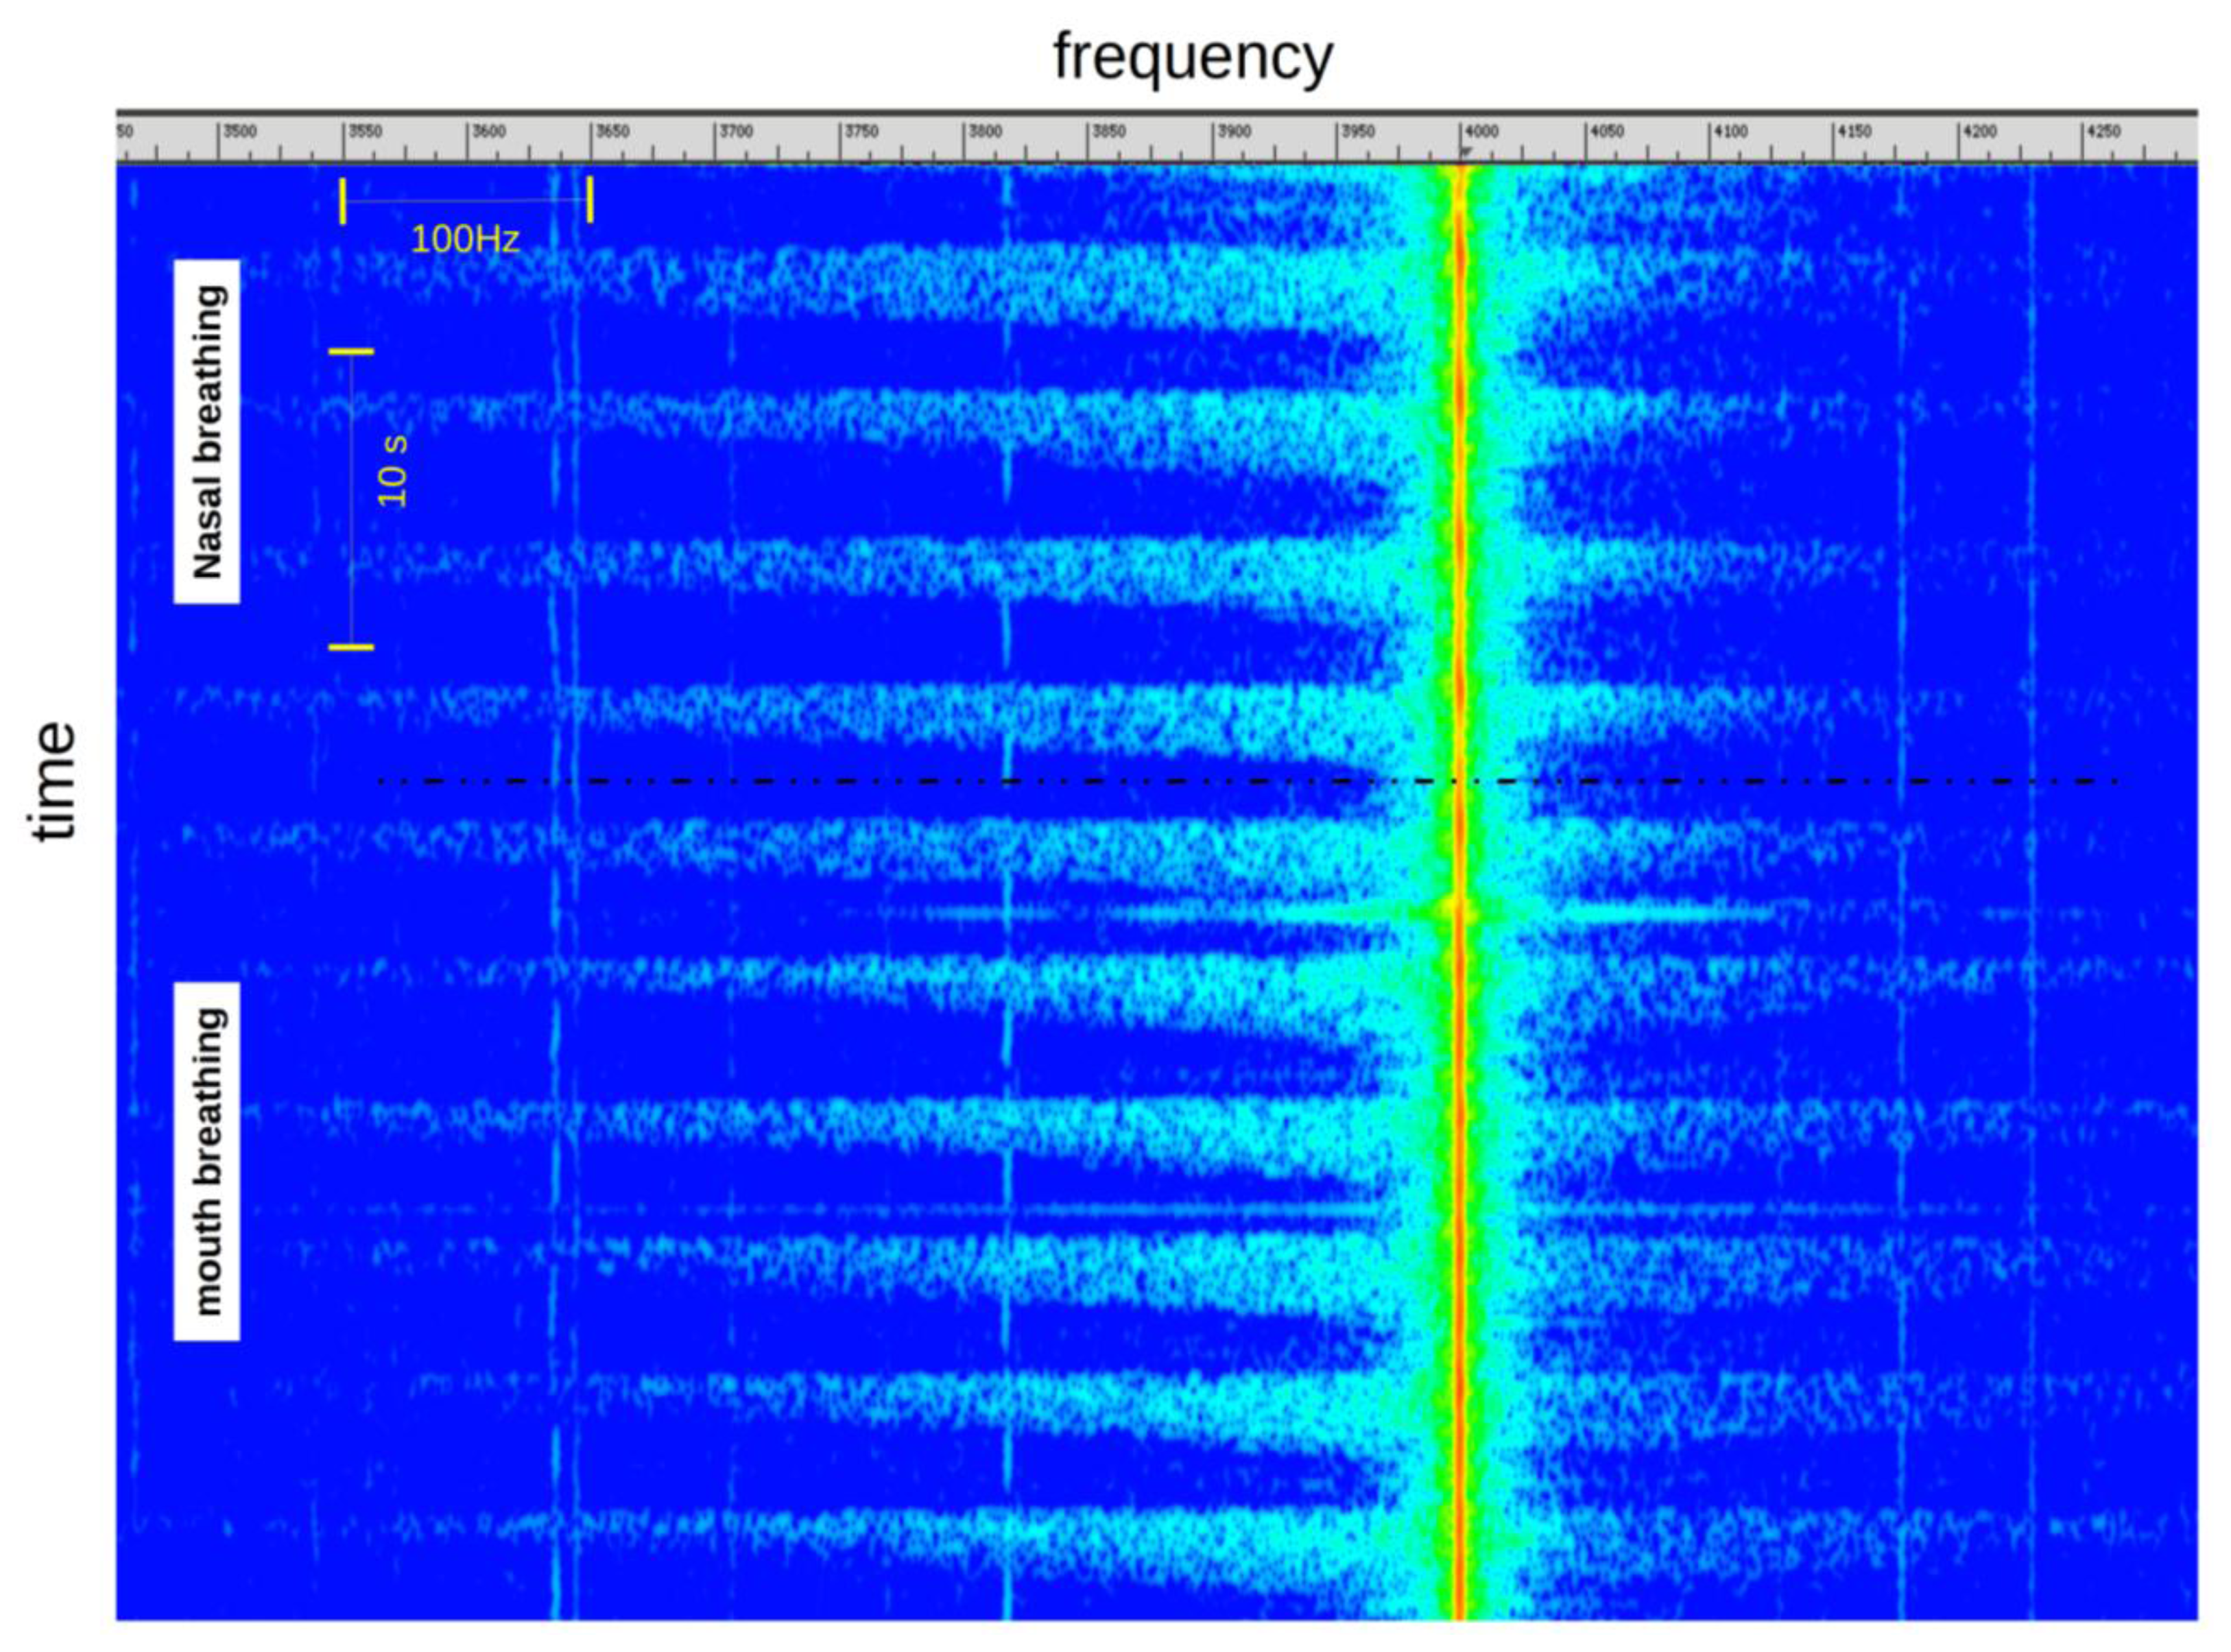
Typically, the phenomenon is similar whatever the type of breathing (nasal or oral). We can just observe a slightly lower level of the signal in case of nasal breathing (Figure 6).
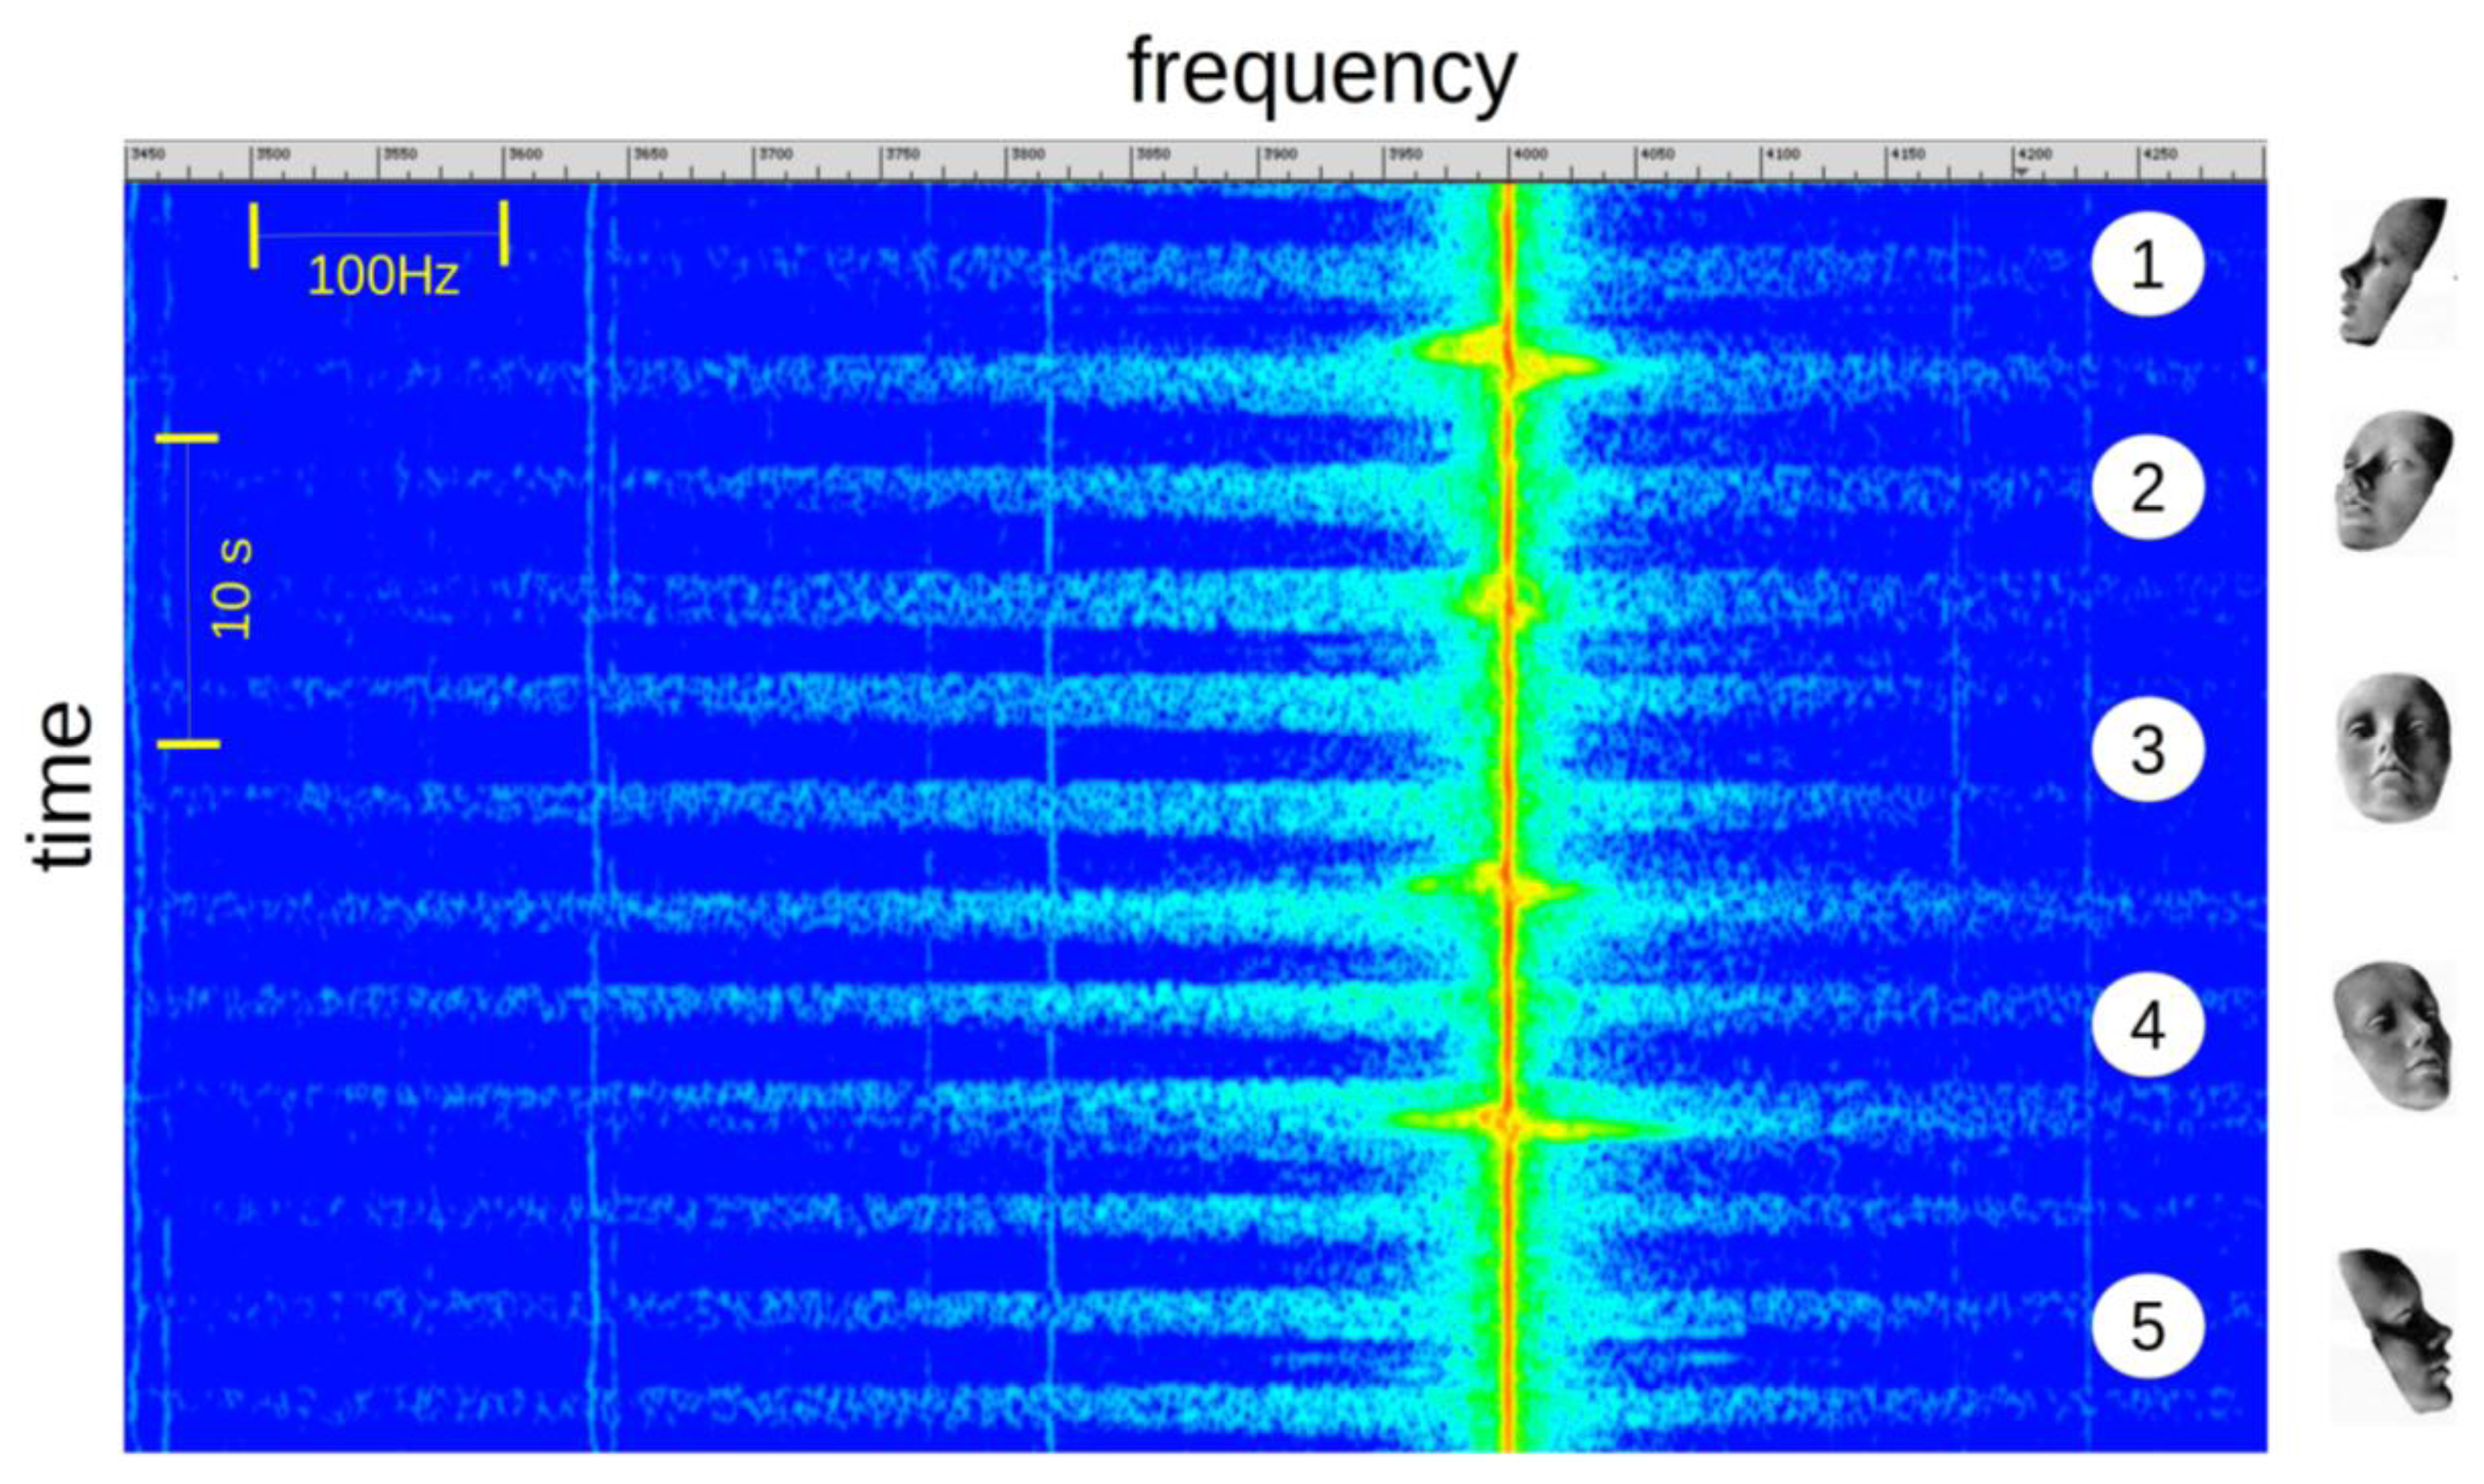
Position of the Subject Head, Relative to the Sensor
The Figure 7 shows the change in the signal intensity according of the inclination of the subject's head. The signal level is maximum in front of the sensor (3) and gradually decreases with the angle of incidence. This level variation is not a problem for the application of apnea detection as the signal to noise ratio is acceptable for all positions. We can observe a high level Doppler offset of the incident wave frequency when the subject changes his position.
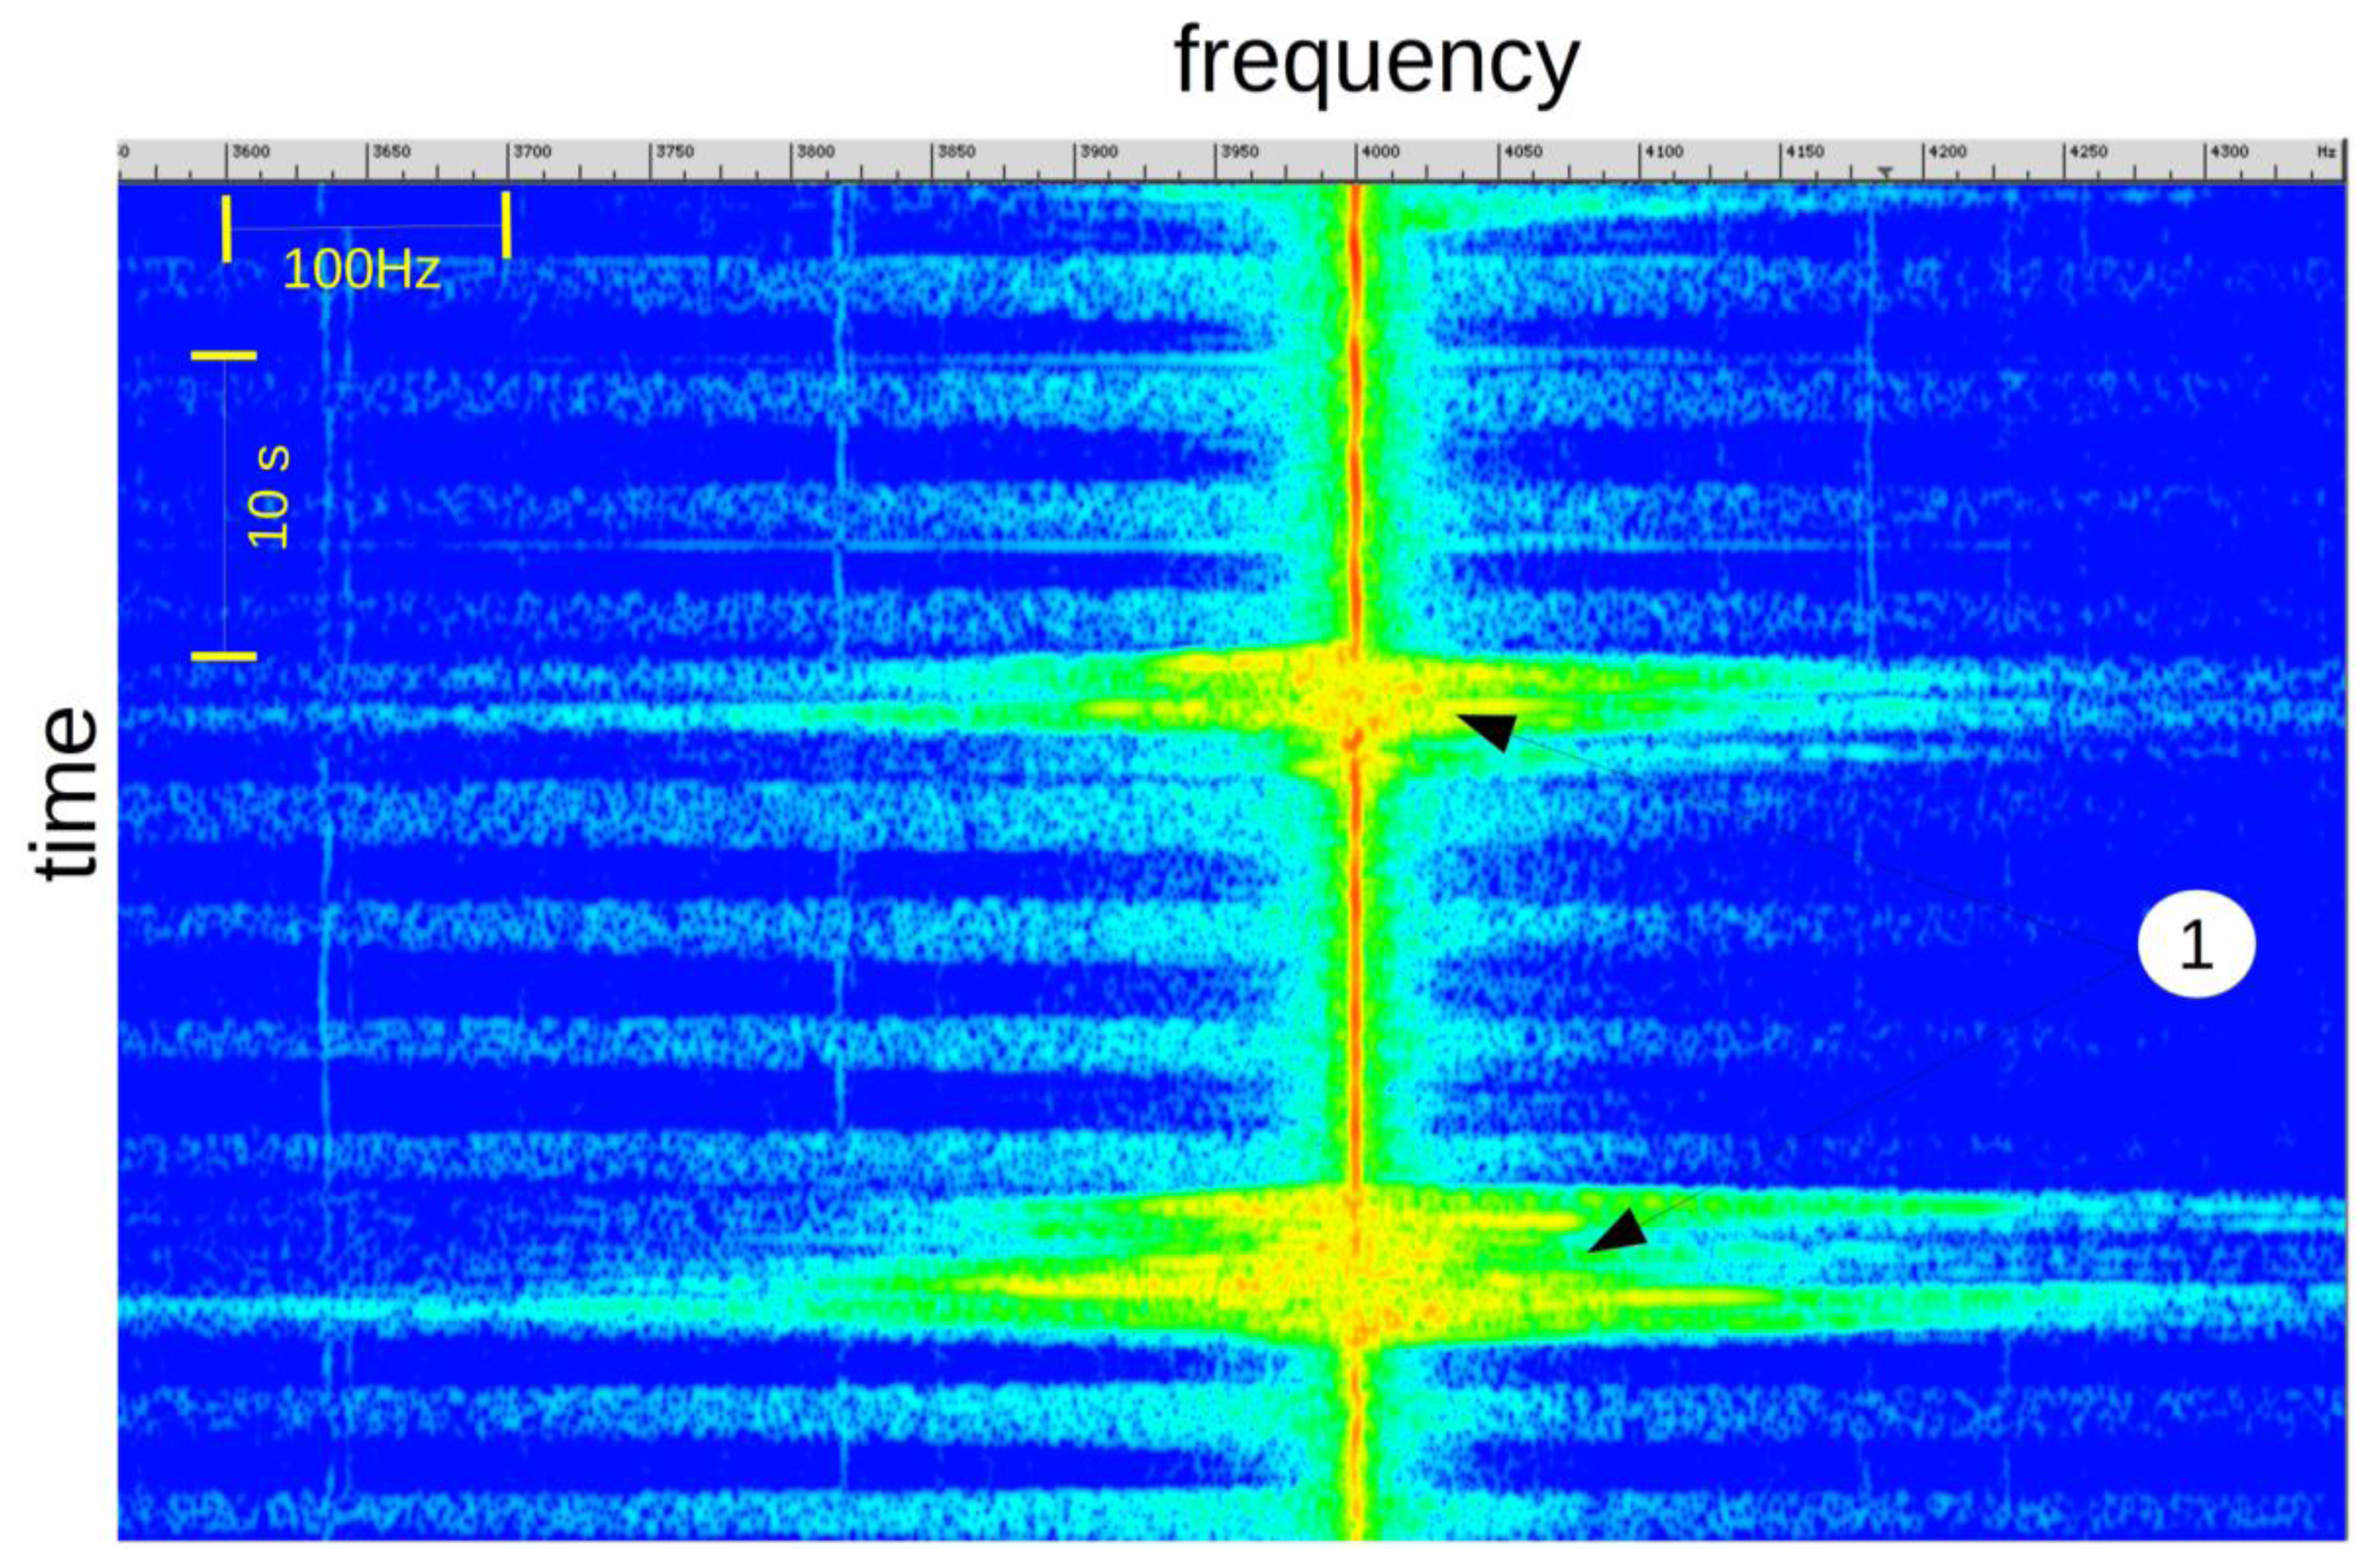
2.5. Influence of Subject or Surrounding Movements
During rapid subject movements (Figure 8, mark 1), like sleeping position changes, the breathing signal is embedded in the Doppler shift. In this situation, it is difficult to verify the presence, or absence, of breathing activity.
2.6. Obtaining a Breathing Signal
In order to characterize respiration, we need a scalar signal from which breathing intensity and respiratory rate can be calculated.
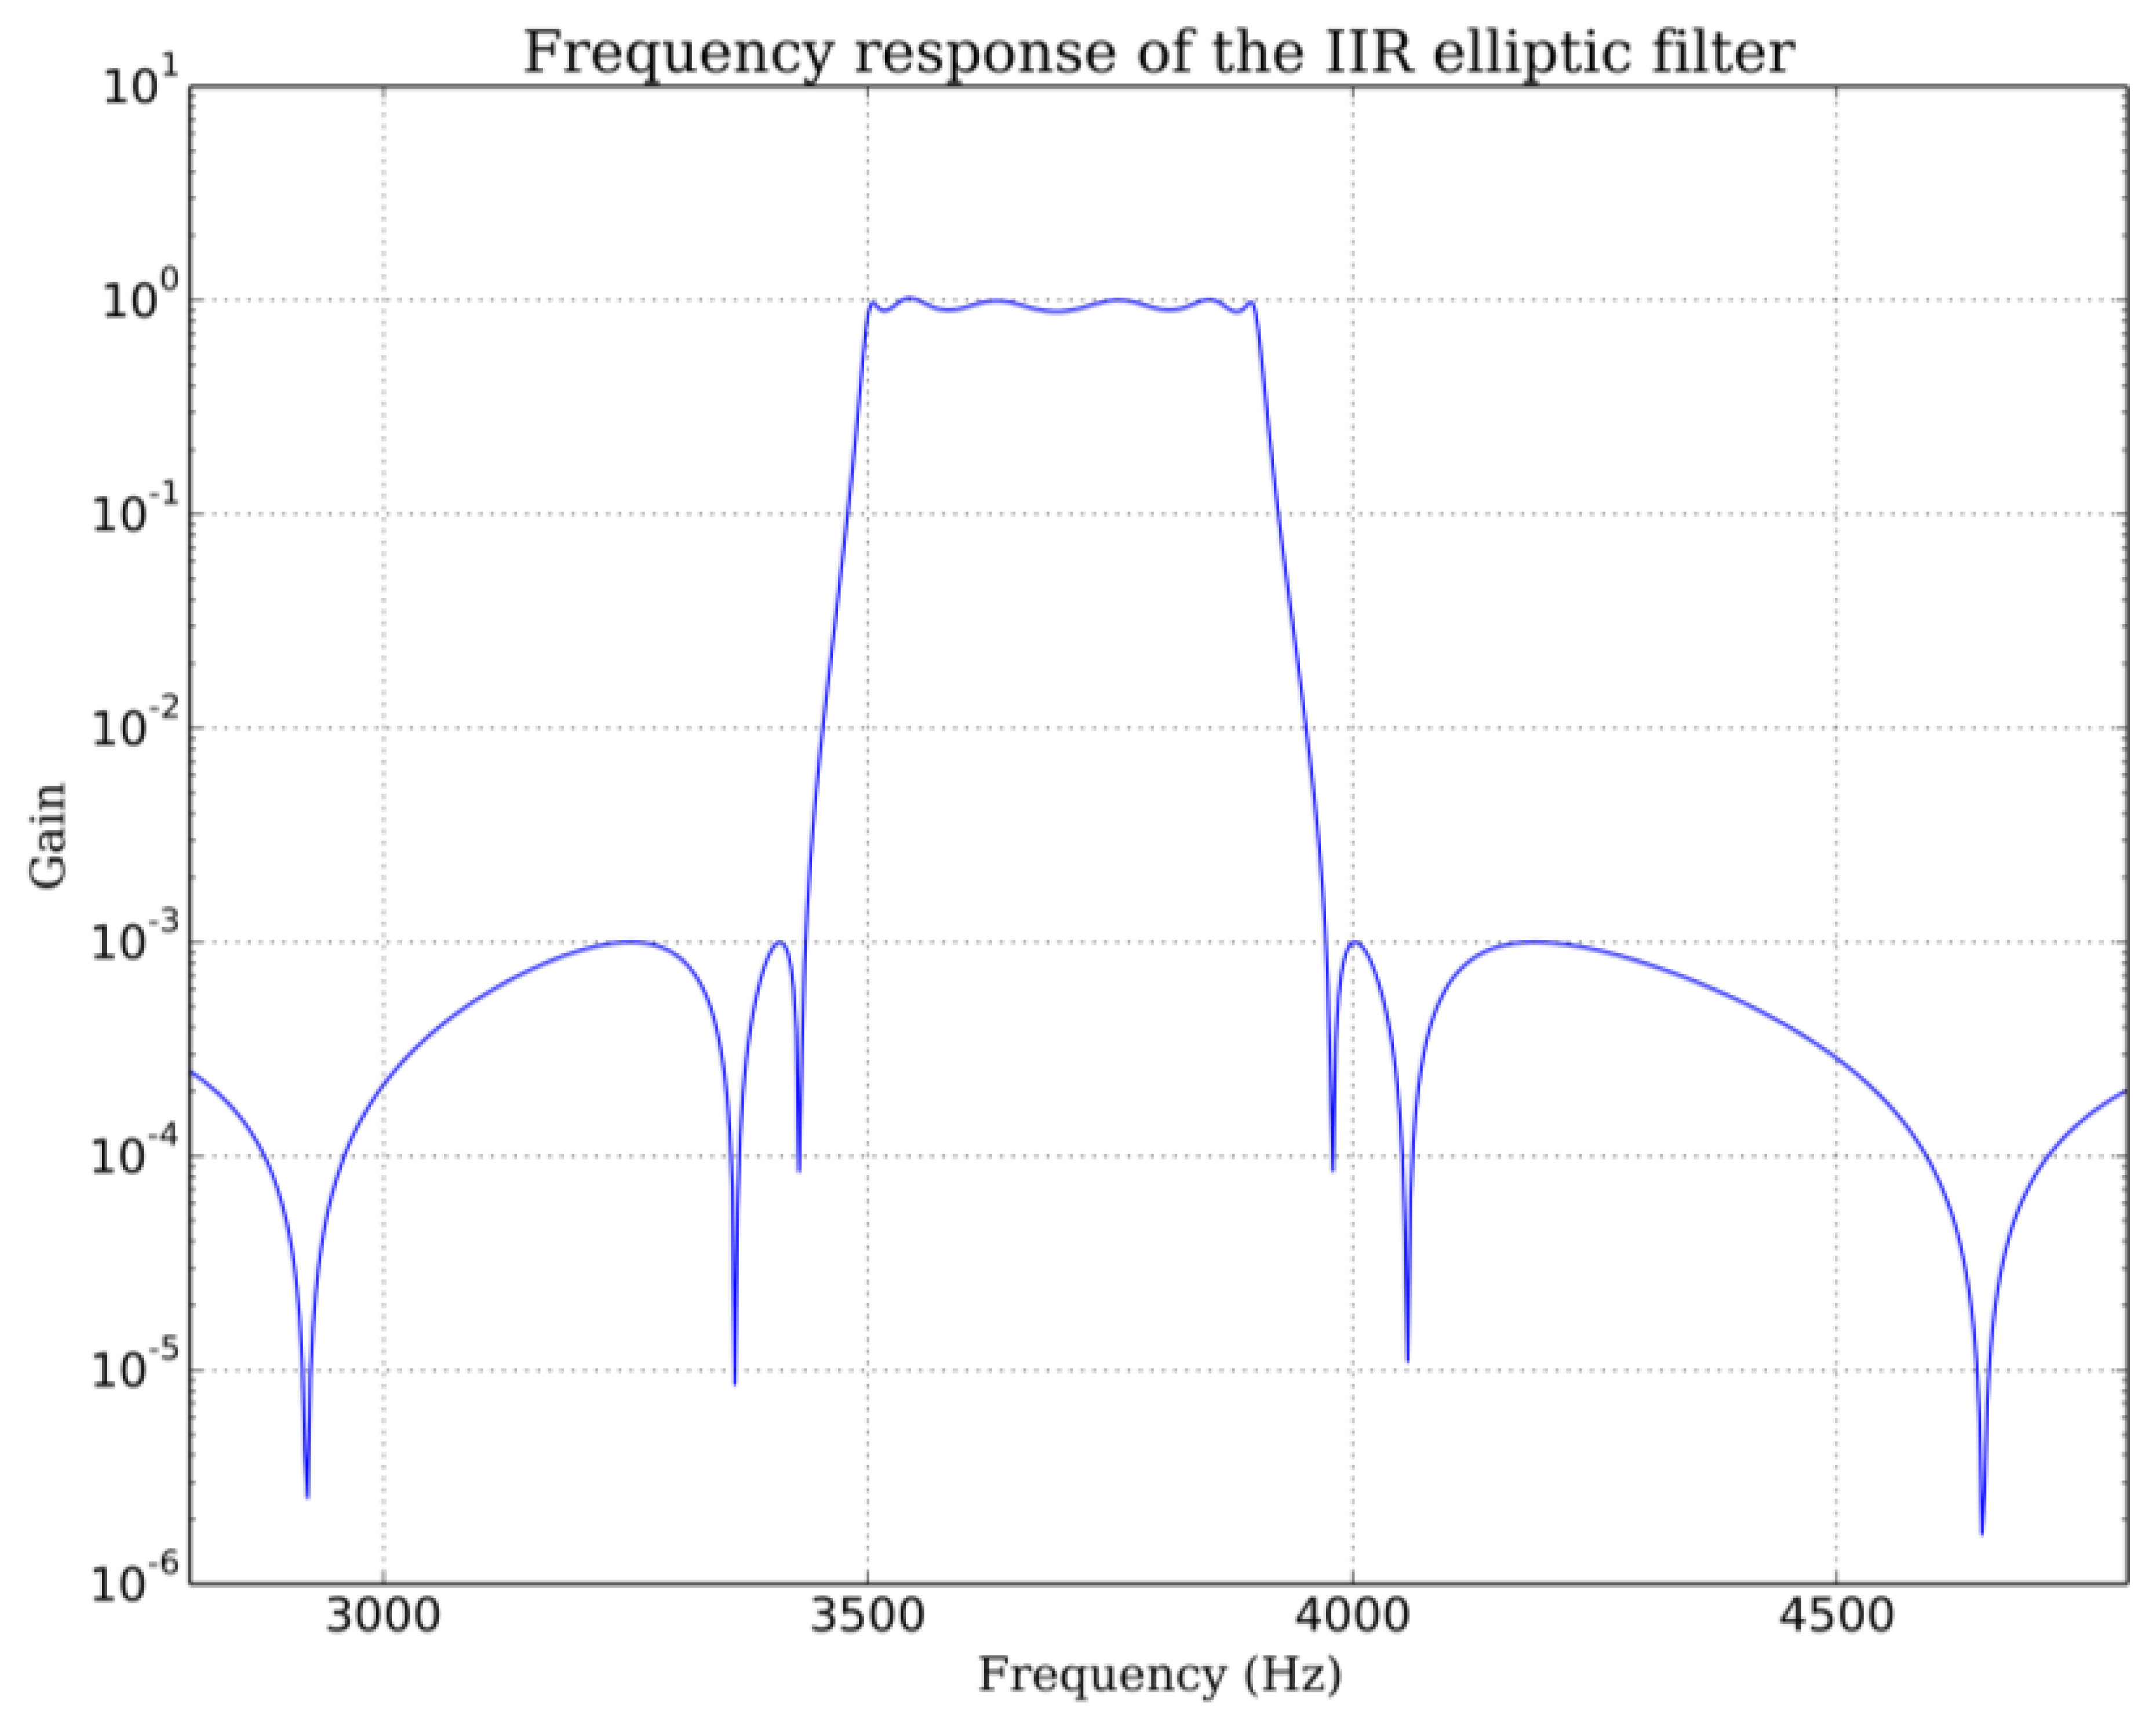
The received signal is first bandpass filtered by an infinite impulse filter (IIR). The bandpass is chosen to avoid the noisy “movement region” near the transmit frequency. One can use either the low or high frequency “breathing zone” or both. Breathing signal intensity on these two zones depends on sensor orientation relative to the subject. In our experimental configuration, signal strength is greater on the low frequency side (Figure 3). For a 4 kHz carrier received after down-mixing, we use a 3500–3900 Hz bandpass elliptic IIR filter with 60 dB stop band attenuation and 1 dB bandpass ripple (Figure 9). To further improve rejection, we apply this filter twice. The 3900 Hz highpass frequency is chosen to exclude the frequency components close to the carrier frequency because the signal level in this zone varies with head position and head movements. The choice of the lower frequency is a compromise. On very deep exhalations, spectral widening can extent down to 3000 Hz but average exhalations do not produce significant signal down to 3500 Hz. Lowering the lowpass frequency further than 3500 Hz would not add more information and would introduce unwanted noise on average exhalations. This would decrease the average signal to noise ratio.
Adult respiratory rate can vary from 0.2 to 0.5 Hz, children and newborn can show rate up to 1 Hz. Thus we choose a 10 Hz sample rate for our breathing signal. The root mean square (RMS) value of the bandpass filtered signal is computed every 100 ms (1/10 Hz). This RMS signal is low-pass filtered with a Butterworth filter to give the breathing signal. The optimal low pass frequency was determined by the residual analysis method [22]. The residual Res, defined mathematically as the root mean square value of the difference between filtered and unfiltered data, was plot over a set of 100 cutoff frequencies fc evenly spaced from 0.1 Hz up to the Nyquist frequency (5 Hz for 100 ms sample time in our case):
Ns is the number of samples,
xi is the ith unfiltered RMS value,
is the ith filtered RMS value.
If we make the assumption that data is contaminated by a white noise, the residual would vary linearly with the cutoff frequency. This is the case for our breathing data above 2.5 Hz and up to 4.5 Hz. If we extrapolate this linear region up to the point it intercepts the y-axis, we can estimate the RMS value of the noise (dash red line in Figure 10). The optimal frequency is chosen at the point where noise contribution to the residual equals signal contribution. This is a compromise between the amount of noise allowed to pass through the filter and the signal distortion. This analysis, repeated other a range of breathing data obtained from adults at rest leads to optimal cutoffs between 1.2 to 1.5 Hz. The lowpass frequency was set to 1.5 Hz for all data presented in this work (Figure 11). A typical breathing signal is shown in Figure 12.
2.7. Obtaining a Signal Representing the Subject Motion
The breathing signal is disturbed in presence of large and rapid movements because the received spectrum is also widened during such events. Little head or shoulder motions as they occurred during sleep have no effect on the breathing signal but when the patient changes sleeping position or moves his arms, the breathing signal should not be taken into account. Thus we need a movement signal to detect situations where the breathing signal is too perturbed to give meaningful information.
We derived a movement signal by tracking energy variation (using standard deviation) in a very narrow window below and above the center frequency. This was done by computing the Fourier transform of the received signal other a 371 ms time slice (16,384 samples at 44,100 Hz) and keeping only bins of interest. Figure 13 shows the two movement zones of approximately 12 Hz apart the center frequency from where the signal movement is computed. A 25 Hz zone centered on the center frequency was excluded because the signal value in this area can vary widely due to patient position. Figure 14 shows a movement signal and a breathing signal. The movement signal increases when the patient changes position. When the movement signal increases the breathing signal is meaningless.
3. Results and Discussion
Several validations were performed with our sensor to determine its performance. A first one, qualitative, consisted of positioning a breathing subject under the sensor and observing in real time the spectrogram (time/frequency representation). Under these conditions, we can verify the perfect correspondence between the spectrogram and the breathing activity during normal breathing, simulated apnea or movements.
A second validation, more quantitative, was to equip the subject with a polygraph currently used in sleep laboratories to diagnose sleep apnea syndrome (Cid102L, Cidelec®, Sainte Gemmes sur Loire, France). It consists in a pressure sensor connected to a nasal cannula and to record both signals over a period of about 1 h which corresponds to about 1000 breathing cycles (Figure 15). During this period, the subject breathes through the mouth, the nose and simulates apnea and performs movements compatible with sleep. This experience showed the synchronization of the pressure signal provided by the nasal cannula with our signal spectrogram. However, the presence of the cannula in the nostrils derives a significant part of the exhaled air flow and therefore reduces the sensitivity of our device.
4. Conclusion
The sensor presented in this work represents a good solution for contactless breathing monitoring. Its applications span from real-time monitoring to sleep apnea diagnosis. Its contactless feature makes it suitable for breathing monitoring of infants or premature, and more generally monitoring of subjects at risk of having respiratory distress.
In future works, we plan to use several receivers evenly spaced around the subject head to allow us to remove the angular dependence of the breathing signal. Using a Fleish pneumotachograph we should be able to calibrate our system in order to obtain absolute measurements. In a second experiment, we will try a different signal processing methodology based on pattern matching classification of the different breathing states. To do this, and complete this study, a large measurement campaign on real patients is planned in collaboration with the CHITS (Toulon Hospital).
Acknowledgments
We thank the members of the Centre Hospitalier Intercommunal Toulon La Seyne, Sainte Musse Hospital for their contribution to this project:
Daniel D'amore, pulmonologist, Marie-Françoise Mateo-Champion, neurophysiologist, the staff of the sleep laboratory and Jean-Philippe Suppini, head of the Clinical Research Unit.
We would like to thank Cidelec® Company, 20 rue des Métiers 49130 Sainte Gemmes sur Loire, France, http://www.cidelec.net/fr/en.html who lent us the polygraph to establish a comparison with our device.
Author Contributions
All the authors contributed equally to this work.
Conflicts of Interest
The authors declare no conflict of interest.
References
- Grenvik, A.; Ballou, S.; McGinley, E.; Millen, J.E.; Cooley, W.L.; Safar, P. Impedance pneumography: Comparison between chest impedance changes and respiratory volumes in II healthy volunteers. CHEST J. 1972, 62, 439–443. [Google Scholar]
- Prutchi, D.; Norris, M. Design and Development of Medical Electronic Instrumentation: A Practical Perspective of the Design, Construction, and Test of Medical Devices; Wiley Interscience: Hoboken, NJ, USA, 2004. [Google Scholar]
- Kelkar, S.P.; Khambete, N.D.; Agashe, S.S. Development of movement artefacts free breathing monitor. J. Instrum. Soc. India 2004, 38, 34–43. [Google Scholar]
- Lee, J.; Florian, J.P.; Chon, H.C. Respiratory rate extraction from pulse oximeter and electrocardiographic recordings. Physiol. Meas. 2001, 32. [Google Scholar] [CrossRef]
- Mann, J.; Rabinovich, R.; Bates, A.; Giavedoni, S.; MacNee, W.; Arvind, D.K. Simultaneous activity and respiratory monitoring using an accelerometer. Proceedings of the International Conference on Body Sensor Networks, Dallas, TX, USA, 23–25 May 2011; pp. 139–143.
- Bates, A.; Ling, M.; Geng, C.; Turk, A.; Arvind, D.K. Accelerometer-based respiratory measurement during speech. Proceedings of the International Conference on Body Sensor Networks, Dallas, TX, USA, 23–25 May 2011; pp. 95–100.
- Jelen, M.; Biebl, E.M. Multi-frequency sensor for remote measurement of breath and heartbeat. Adv. Radio Sci. 2006, 4, 79–83. [Google Scholar]
- Suzuki, S.; Matsui, T.; Kawahara, H.; Ichiki, H.; Shimizu, J.; Kondo, Y.; Gotoh, S.; Yura, H.; Takase, B.; Ishihara, M. A non-contact vital sign monitoring system for ambulances using dual-frequency microwave radars. Med. Biol. Eng. Comput. 2009, 47, 101–105. [Google Scholar]
- Uenoyama, M.; Matsui, T.; Yamada, K.; Suzuki, S.; Takase, B.; Suzuki, S.; Ishihara, M.; Kawakami, M. Non-contact respiratory monitoring system using a ceiling-attached microwave antenna. Med. Biol. Eng. Comput. 2006, 44, 835–840. [Google Scholar]
- Lazaro, A.; David Girbau, D.; Villarino, R. Techniques for clutter suppression in the presence of body movements during the detection of respiratory activity through UWB radars. Sensors 2014, 14, 2595–2618. [Google Scholar]
- Dei, D.; Grazzini, G.; Luzi, G.; Pieraccini, M.; Atzeni, C.; Boncinelli, S.; Camiciottoli, G.; Castellani, W.; Marsili, M.; Lo Dico, J. Non-contact detection of breathing using a microwave sensor. Sensors 2009, 9, 2574–2585. [Google Scholar]
- Min, S.D.; Yoon, D.J.; Yoon, S.; Lee, M. A study on a non-contacting respiration signal monitoring system using doppler ultrasound. Med. Biomed. Eng. Comput. 2007, 45, 1113–1119. [Google Scholar]
- Min, S.D.; Kim, J.K.; Shin, H.S.; Yun, Y.H.; Lee, C.K.; Lee, M. Noncontact respiration rate measurement system using an ultrasonic proximity sensor. IEEE Sens. J. 2010, 10, 1732–1739. [Google Scholar]
- Avalur, D.S. Human Breath Detection using a Microphone. M.Sc. Thesis, University of Groningen, Groningen, The Netherlands, 30 August 2013. [Google Scholar]
- Boccanfuso, L.; O'Kane, J.M. Remote measurement of breath analysis in real-time using a high precision, single point, infrared temperature sensor. Proceedings of the 4th IEEE RAS & EMBS International Conference on Biomedical Robotics and Biomechatronics (BioRob), Rome, Italy, 24–27 June 2012.
- Hök, B. Apparatus and Method for Non-contacting Detection of Respiration. U.S. Patent 5,509,414, 23 April 1996. [Google Scholar]
- Arlotto, P.; Grimaldi, M.; Naeck, R.; Ginoux, J.M. Procédé et système d'identification d'une activité respiratoire. Patent FR.13/57569, 31 July 2013. [Google Scholar]
- Kaiser, J.F.; Ronald, W.S. On the use of the I0-Sinh window for spectrum analysis. IEEE Trans. Acoust. Speech Signal Process. 1980, 28, 105–107. [Google Scholar]
- Obukhov, A.M. Effect of weak inhomogeneities in the atmosphere on sound and light propagation. Izv. Akad. Nauk. Seriya Geofiz. 1953, 2, 155–165. [Google Scholar]
- Chu, B.T.; Kovsznay, L.S.G. Non-Linear interactions in a viscous heat-conducting compressible gas. J. Fluid Mech. 1958, 3, 494–514. [Google Scholar]
- Lund, F.C.; Rojas, C. Ultrasound as a probe of turbulence. Phys. D Nonlinear Phenom. 1989, 37, 508–514. [Google Scholar]
- Winter, D.A. Biomechanics and Motor Control of Human Movement, 4th ed.; John Wiley & Sons: Hoboken, NJ, USA, 2009; pp. 70–72. [Google Scholar]


© 2014 by the authors; licensee MDPI, Basel, Switzerland. This article is an open access article distributed under the terms and conditions of the Creative Commons Attribution license ( http://creativecommons.org/licenses/by/3.0/).
Share and Cite
Arlotto, P.; Grimaldi, M.; Naeck, R.; Ginoux, J.-M. An Ultrasonic Contactless Sensor for Breathing Monitoring. Sensors 2014, 14, 15371-15386. https://doi.org/10.3390/s140815371
Arlotto P, Grimaldi M, Naeck R, Ginoux J-M. An Ultrasonic Contactless Sensor for Breathing Monitoring. Sensors. 2014; 14(8):15371-15386. https://doi.org/10.3390/s140815371
Chicago/Turabian StyleArlotto, Philippe, Michel Grimaldi, Roomila Naeck, and Jean-Marc Ginoux. 2014. "An Ultrasonic Contactless Sensor for Breathing Monitoring" Sensors 14, no. 8: 15371-15386. https://doi.org/10.3390/s140815371