1. Introduction
CO is a colorless, odorless gas with molecular mass equal to the atmosphere, which is present indoors and outdoors [
1]. CO will explode and burn in the condition of improper storage. Moreover, CO is an excellent fuel. Compared with coal, CO does not produce dust and sulfur during combustion and it is easy for transportation. For the coal-producing countries, it is a wise choice to choose CO as fuel. However, CO will explode at the concentration from 12.5% to 74.5% and burn beyond the concentration of 75% in the air in case of fire. Also, CO can directly affect the health of people. After being inhaled into the respiratory system, it will eventually prohibit hemoglobin (Hb) in blood cells binding and carrying oxygen molecules because it reacts with hemoglobin faster than oxygen does [
2,
3].
In order to reduce the harm of CO, it is meaningful to monitor the concentration of CO in a timely manner. So, CO monitoring can be considered as a promising practical application, which combines a Wireless Sensor Network (WSN) with the Internet of Things [
4,
5]. A wireless sensor network provides real-time monitoring of multiple distributed nodes, and then predicts environmental conditions in the area, which creates new opportunities for chemical and biological sensor systems in healthcare, environmental monitoring, process and quality control, and chemical and biological threat detection.
Wifi-based WSN is an emerging aspect of wireless technology, which consists of several nodes and access points. Wifi is suitable for industrial monitoring with the advantages of fast transmission rate and long transmission distance. In summary, Wifi-based WSNs are opening new markets for distributed sensors and sensor networks [
6].
There are many detectable methods for sensor nodes. Currently, the United States Environmental Protection Agency (U.S. EPA) recommends non-dispersive infrared (NDIR) as a standard reference method. The principle of this technology is based on absorption of infrared radiation by CO molecules in the wavelength of 4.6 μm region [
7]. This method has the advantages of not being easily affected by temperature, fast response and high sensitivity [
8]. We have made some progress in the carbon dioxide concentration detected based on NDIR technology, and the accuracy of carbon dioxide concentration monitoring device by using pyroelectric sensor can be up to 0.23 mmHg.
In this study, a new hardware platform for CO sensor nodes is developed based on NDIR technology. To prevent jittering, a low frequency modulation method is proposed. Wireless communication between each sensor node and routers is fulfilled through a Wifi wireless network which can locate every sensor node and transport data from sensor node to PC or smartphone through routers. The sensor nodes and wireless network constitute a wireless sensor network,which is used in industrial plants in the storage of CO, and we can determine the location and concentration of CO leak points by the transmitted data nodes. The targeted experiments have demonstrated that this system has a strong stability.
The remainder of this paper is organized as follows.
Section 2 presents a hardware solution to the system. The corresponding networks architecture for system is described in
Section 3. We show experimental results and provide analysis in
Section 4. And the study is concluded in
Section 5.
2. System Hardware
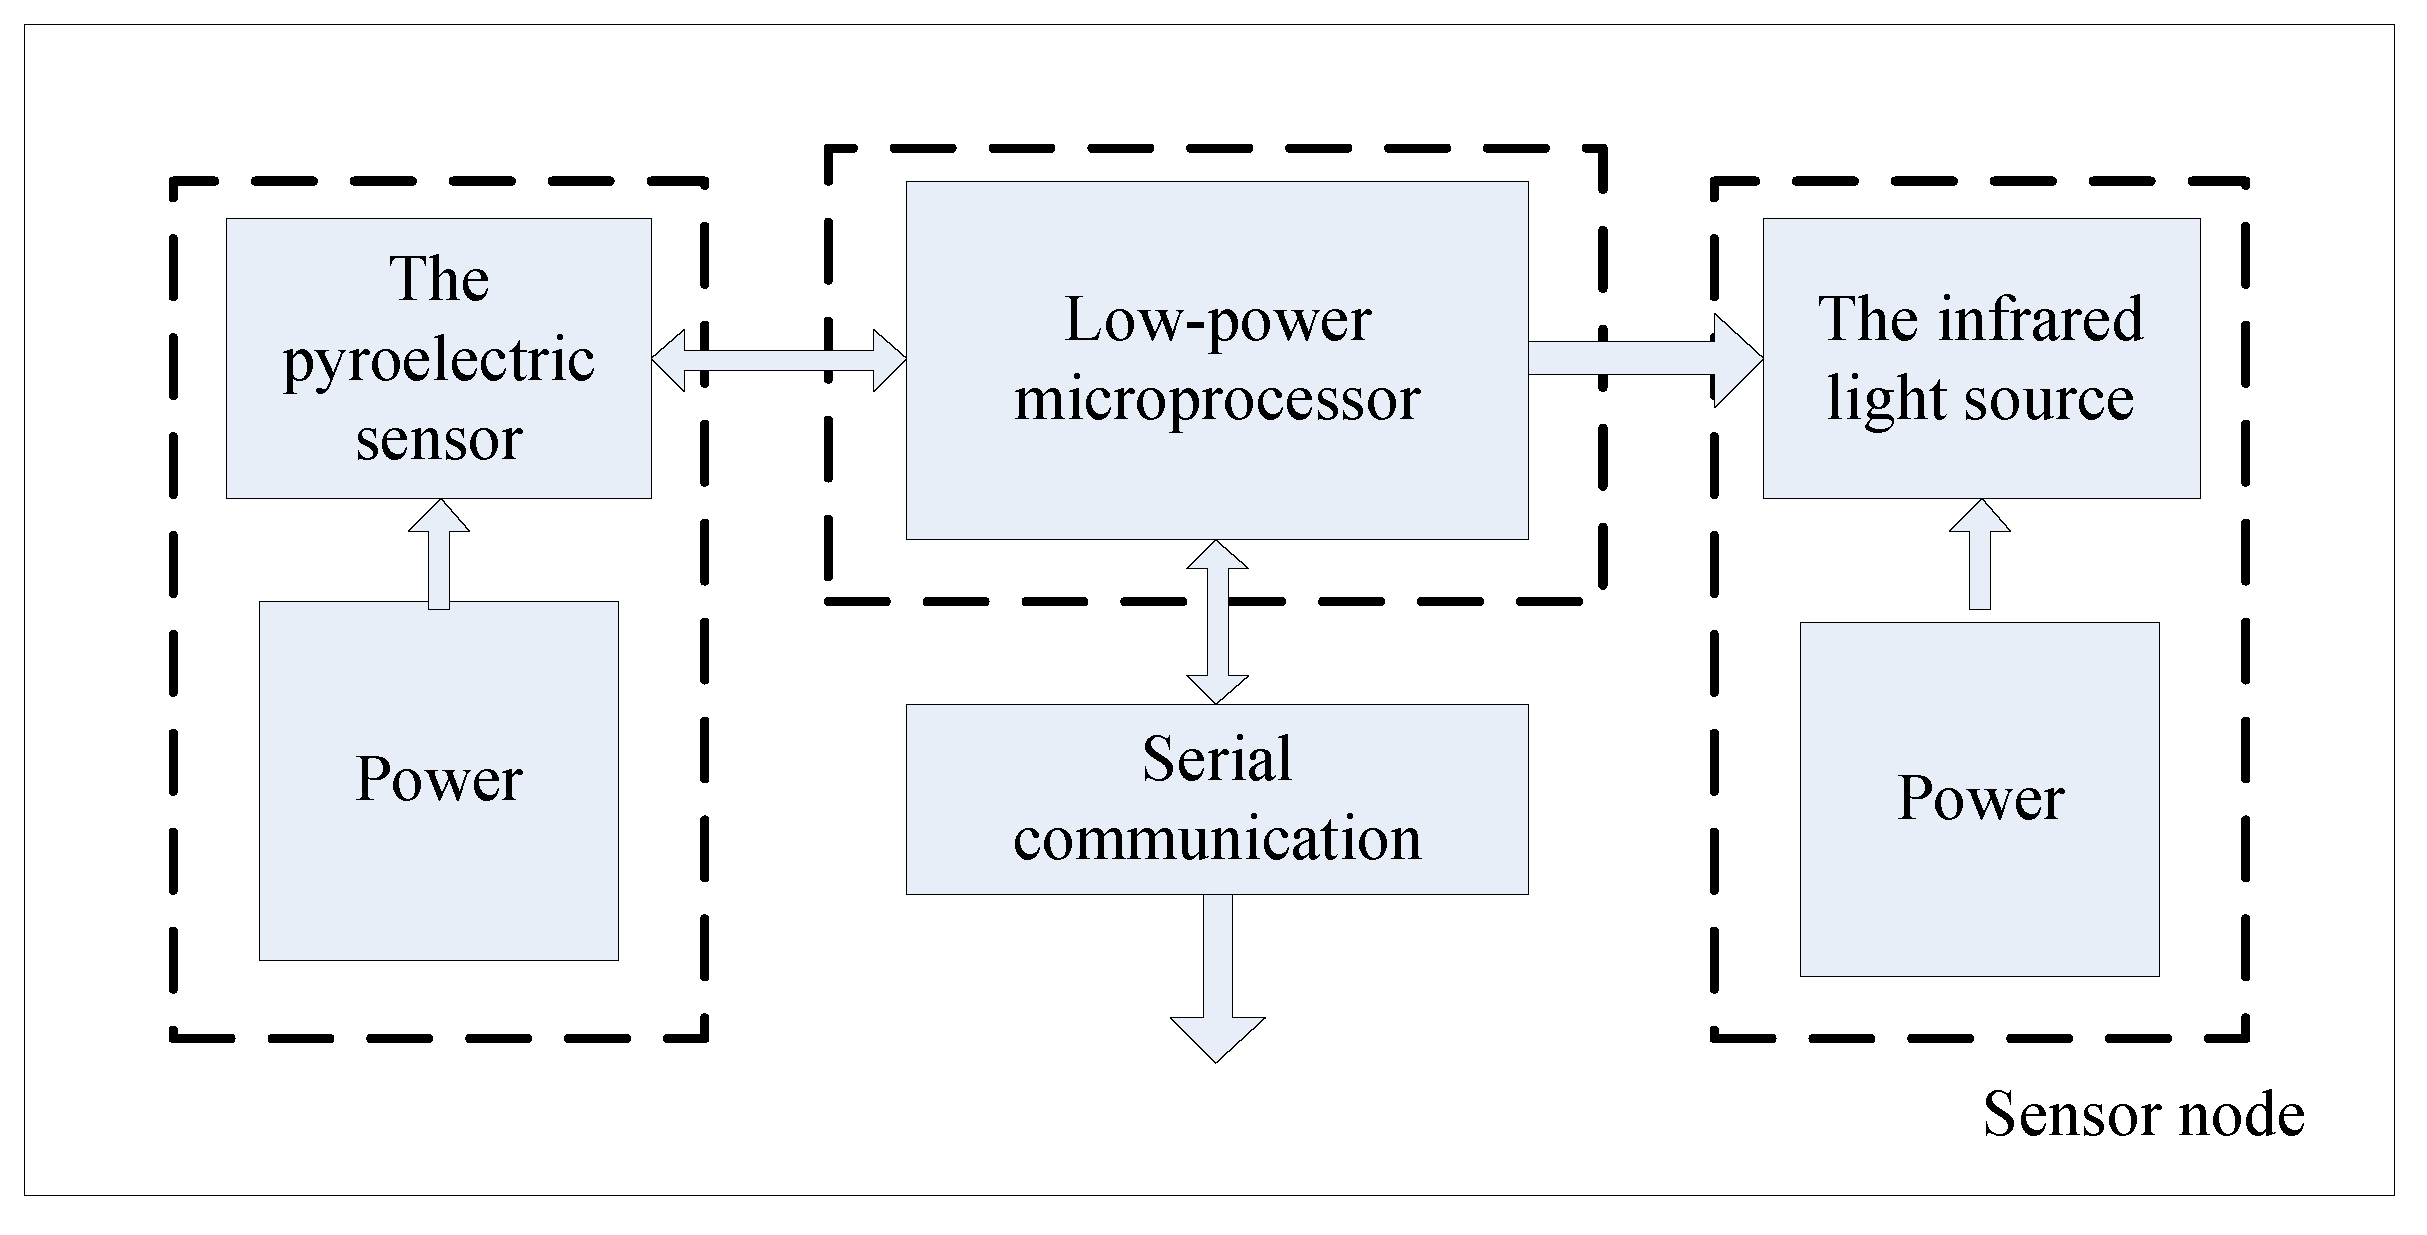
As the monitoring systems are often applied in the industrial and flammable gas detection, the detection module should be small and easy to carry and transport. Moreover, considering the explosion hazard of CO, we need a fast response system with precise detection node. In view of these reasons, the monitoring module adopts pyroelectric sensor, and the sensor node mainly comprises airway tube, CO concentration measurement module.
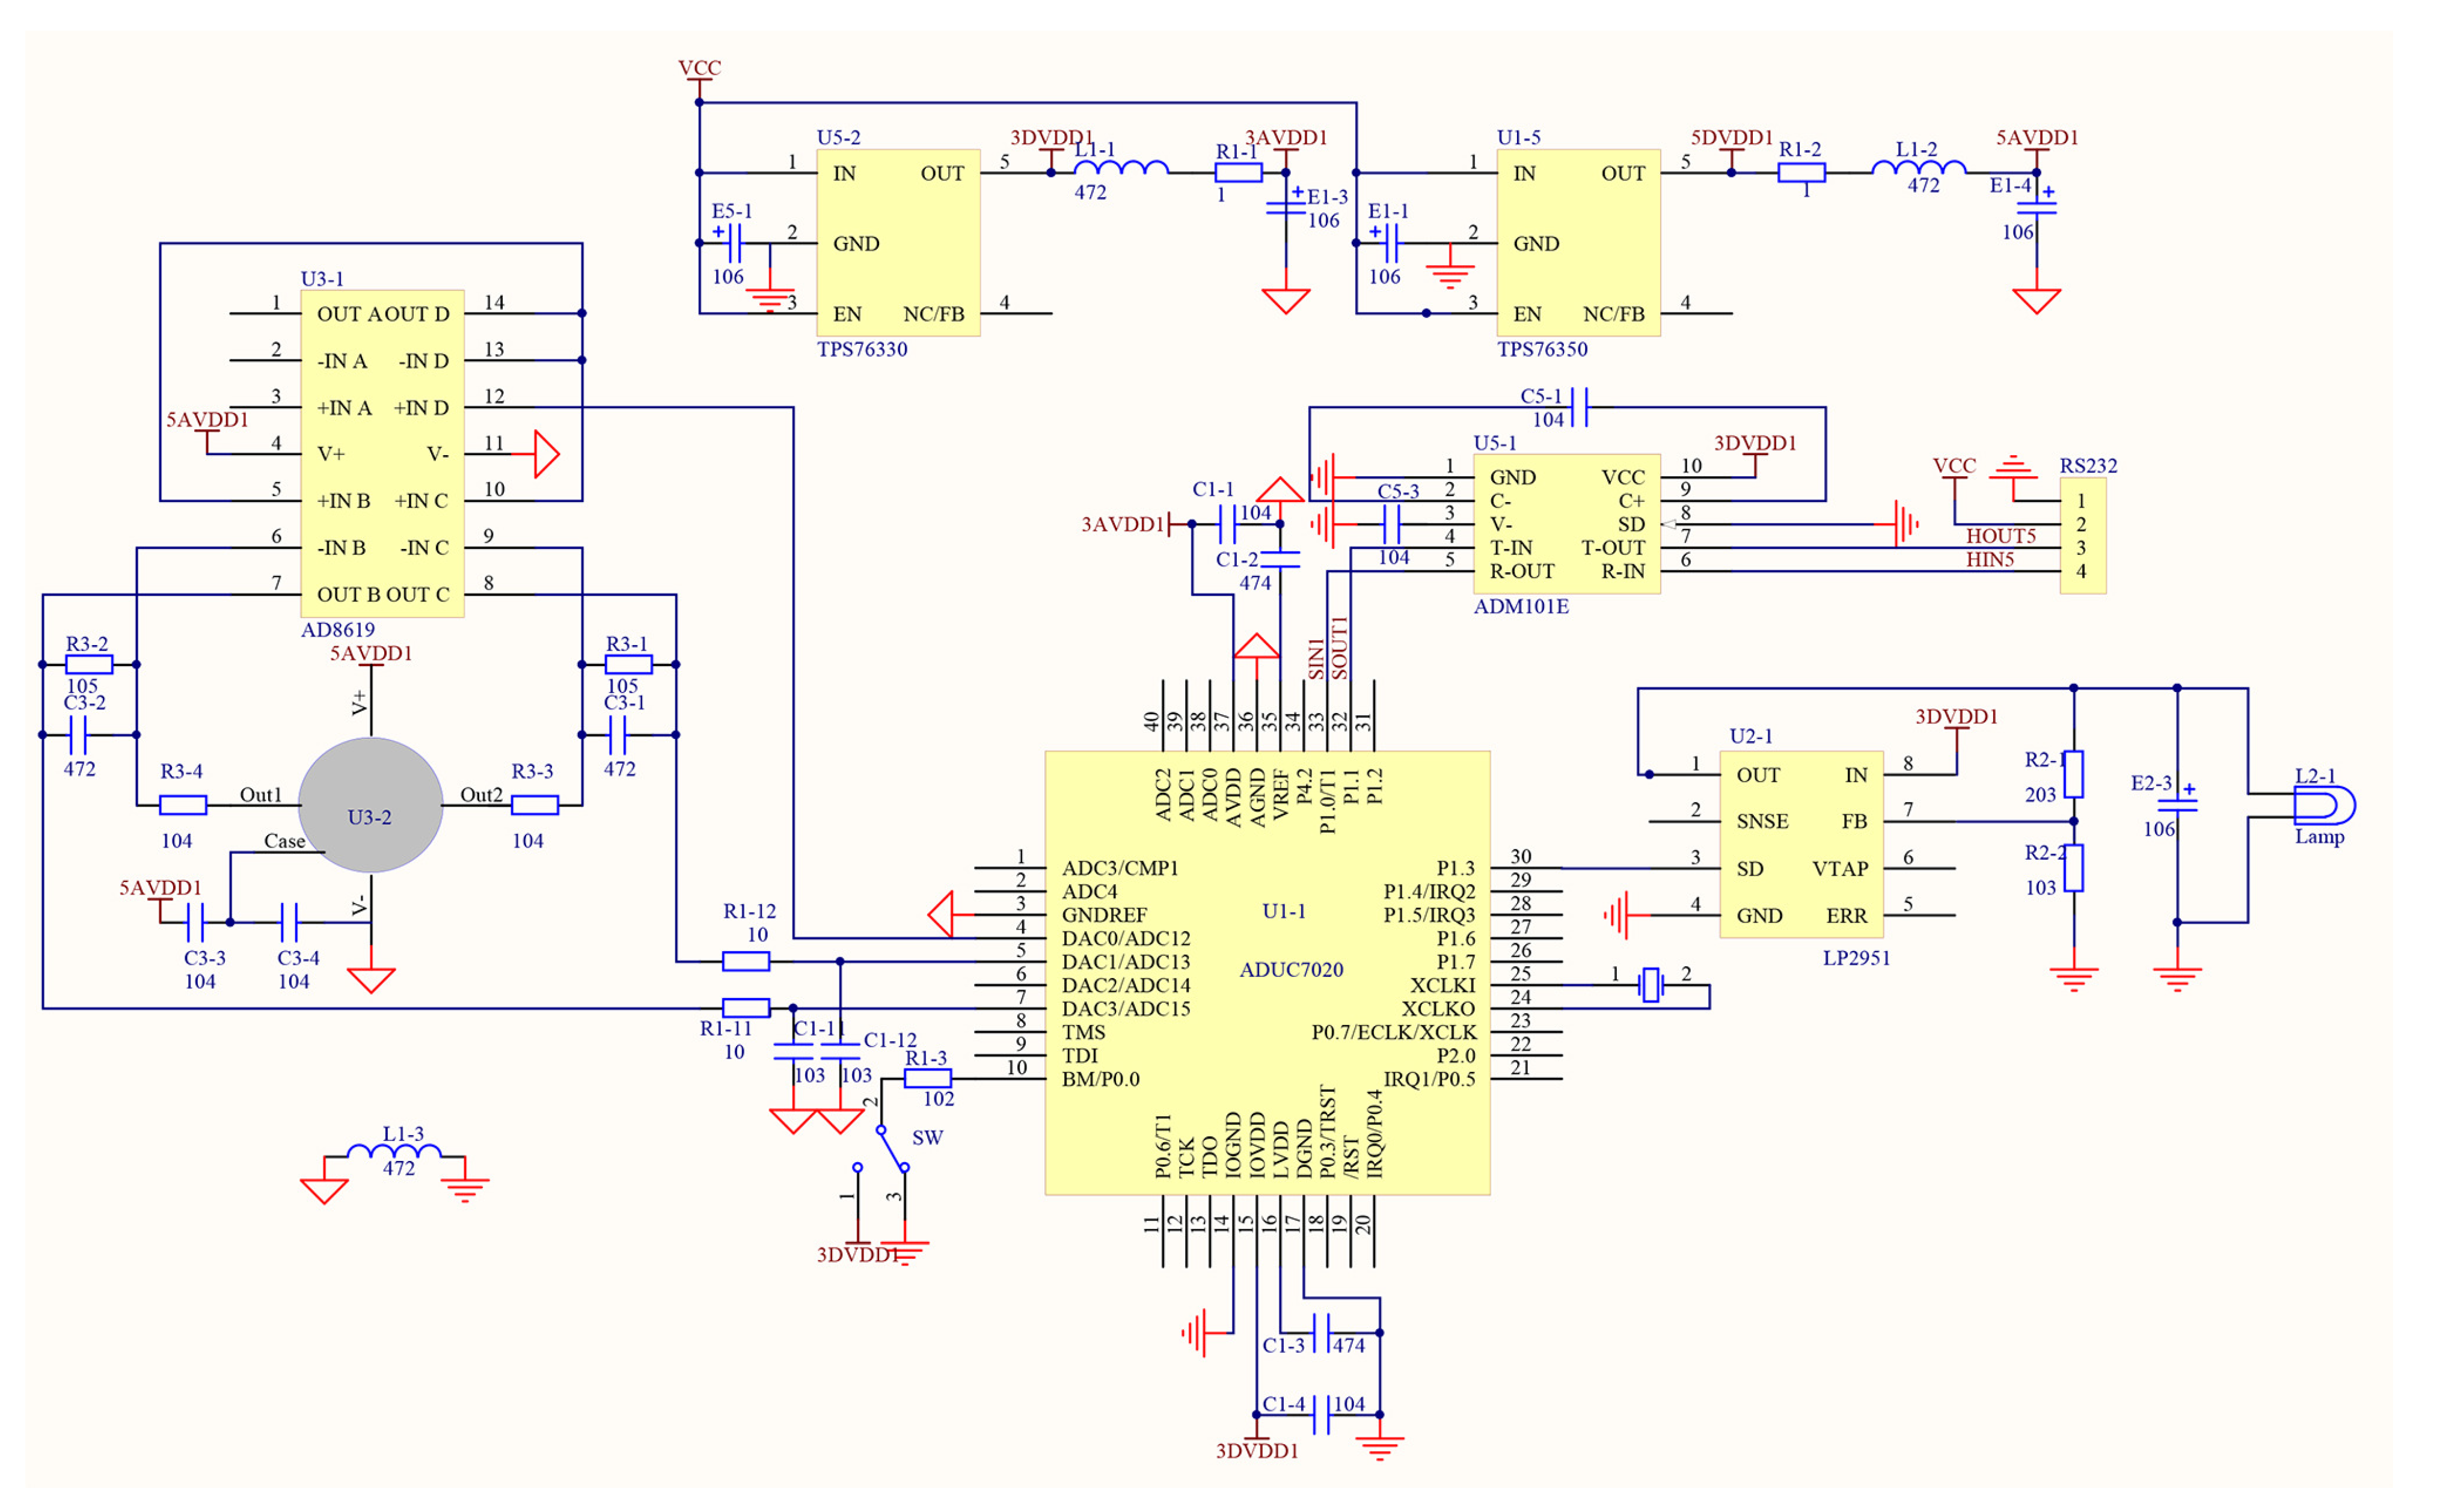
Figure 1 shows the main monitoring modules, and the circuit schematics of sensor node are shown in
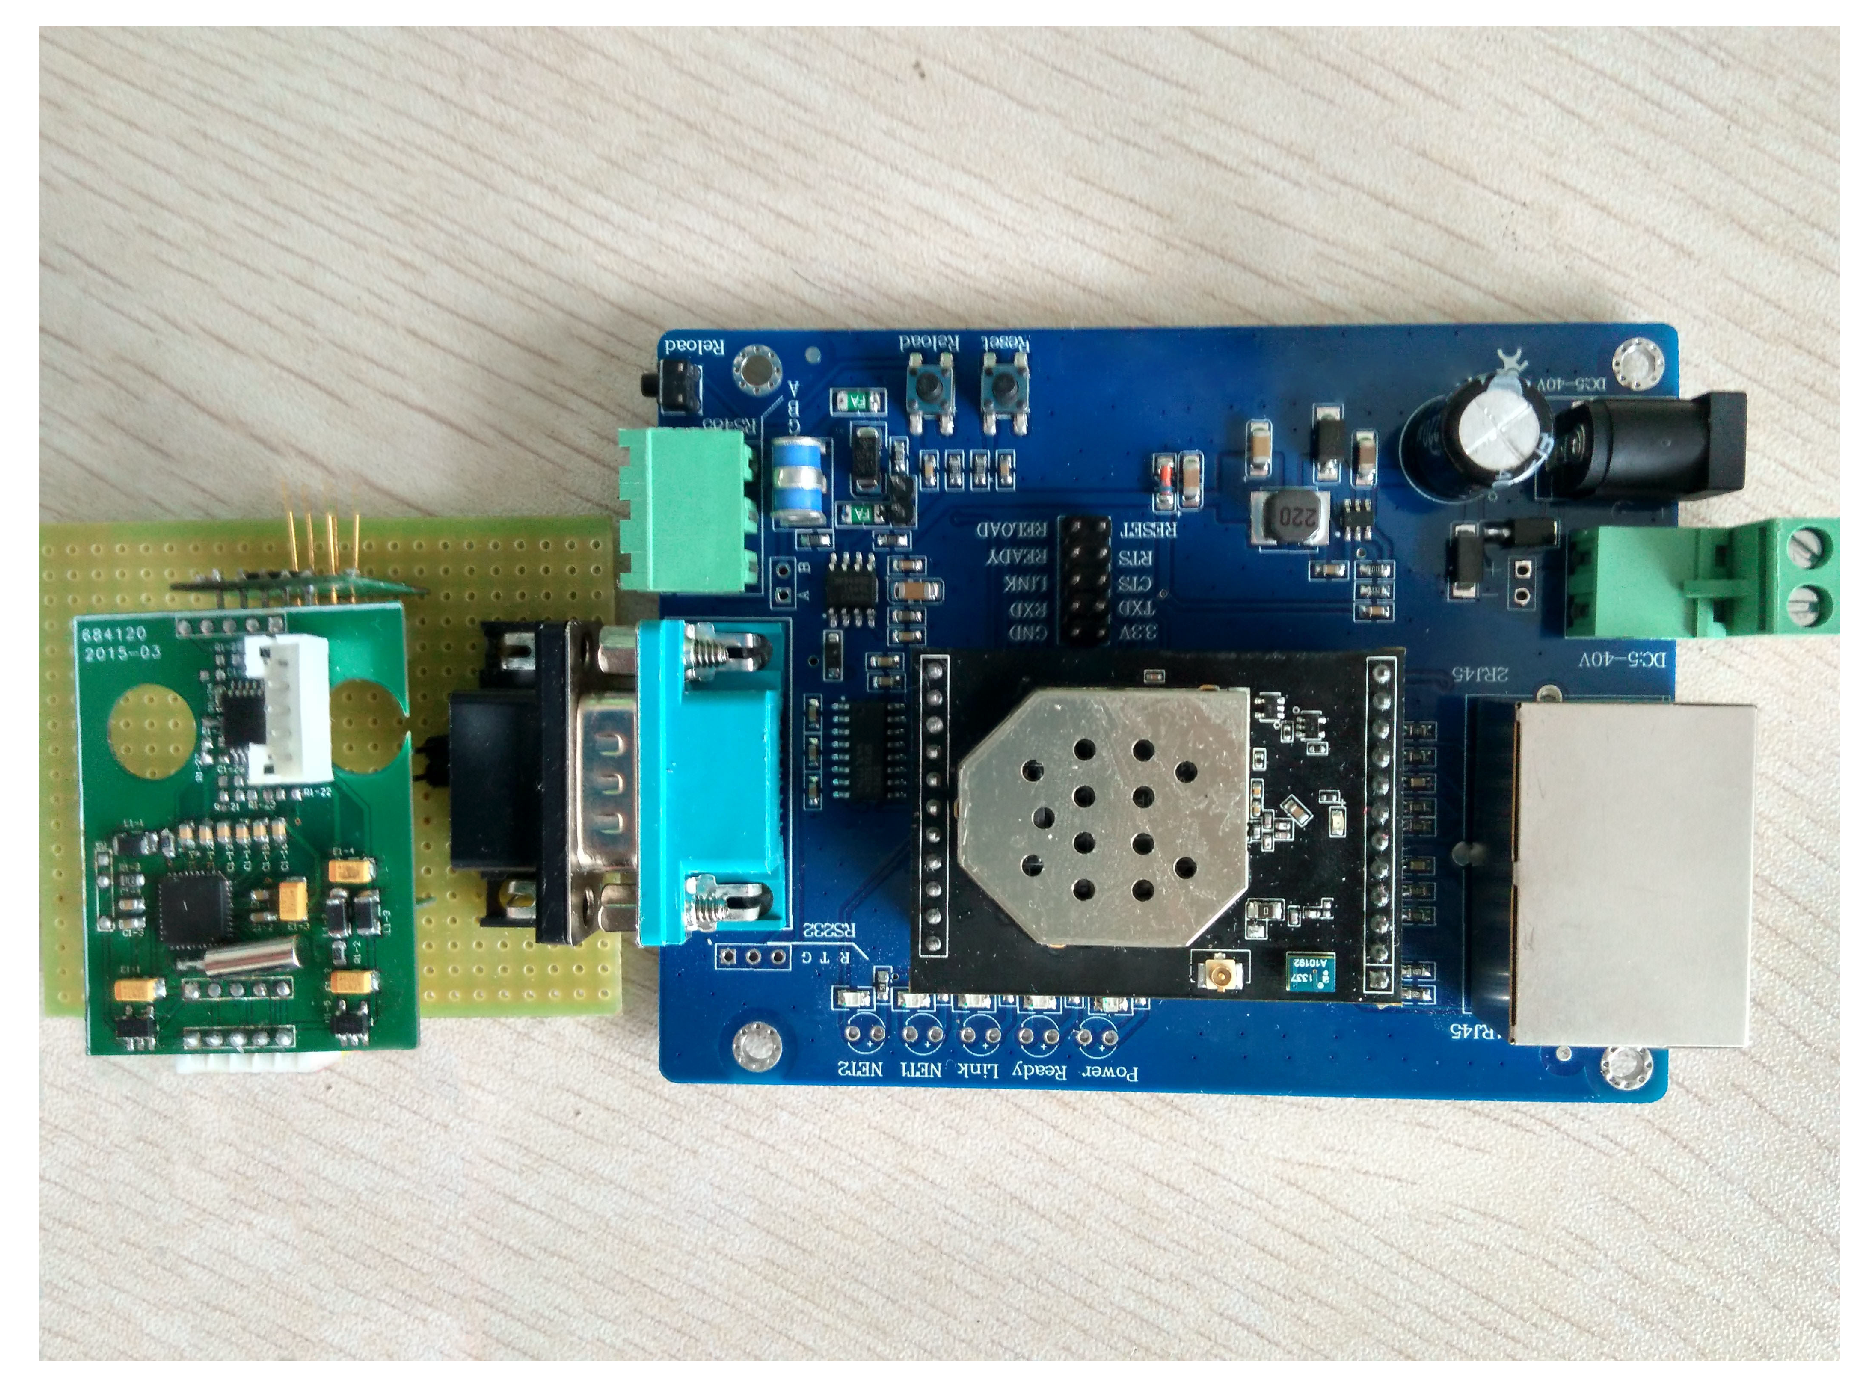
Figure 2. In
Figure 3, the actual picture of system hardware is displayed.
Figure 1.
Sensor node monitoring modules.
Figure 1.
Sensor node monitoring modules.
Figure 2.
Circuit schematics of sensor node.
Figure 2.
Circuit schematics of sensor node.
The new material possesses the pyroelectric sensor of a high precision and its thermal response time which is about 150 ms makes the sensor have a fast response rate, real-time monitoring. Hence,this sensor can satisfy the needs of CO monitoring. CO concentration is measured in accordance with Lambert-Beer Law [
9], also, dual pyroelectric sensor can reduce external interference:
where
I is the intensity of light striking the detector (
I,
),
is the measured intensity of an empty sample chamber (
,
),
α is the absorption coefficient (
α,
),
C is the CO concentration (
C,
), and
L is the absorption path length (
L,
) [
10,
11,
12].
Figure 3.
Actual picture of system hardware.
Figure 3.
Actual picture of system hardware.
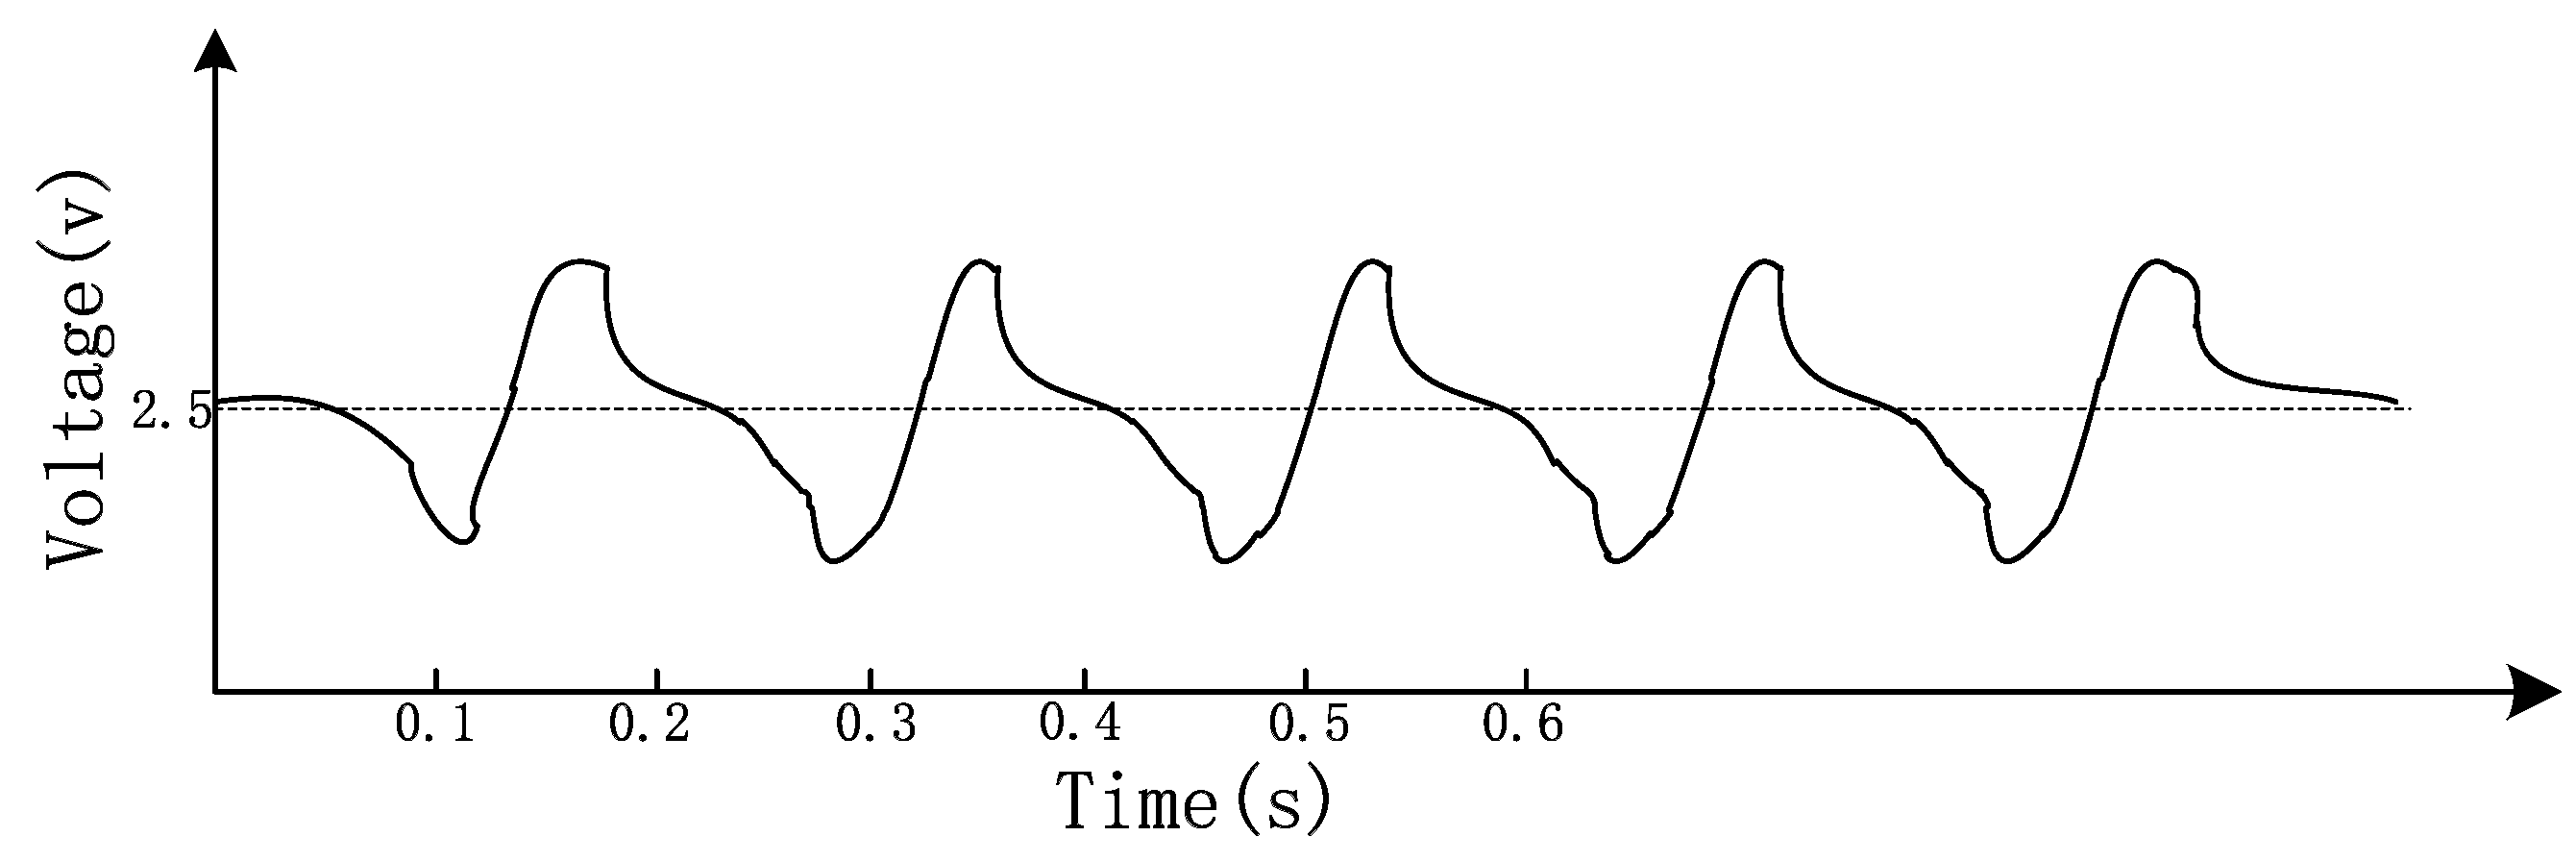
The level of CO concentration is represented at regular time intervals in the form of an electrical signal by a pyroelectric sensor. However, weak signal is vulnerable to interference by circuit. In order to improve the stability of the output signal, we adopt low frequency electric modulation techniques [
13,
14]. The data obtained by multiple experiments have proven that the modulation parameters T = 180 ms and D = 50% and they were adopted in the system to eliminate the fluctuations, as shown in
Figure 4 [
15].
Figure 4.
Sensor waveform by electrical modulation.
Figure 4.
Sensor waveform by electrical modulation.
The output waveform is relatively stable after modulation.However, the modulated waveform inevitably contains noise components, so the digital filtering methods are used to filter the modulated waveform. In addition, compensation is needed for the impact of environment humidity on the gas concentration [
16]. Having filtered and compensated the waveform on the basis of
Figure 4, we obtained the final waveform shown in
Figure 5.
According to the Lambert-Beer Law, attenuation of light intensity happens while the infrared goes through a gas cell containing CO. So, peak-to-peak of waveform value is associated with concentration of CO. Fixed CO concentration is measured by the system, according to correspondence between concentrations and peak-to-peak values, we can draw a curve fitting. Every waveform can get the corresponding concentration of CO referencing curve fitting.
Figure 5.
Waveform after digital filtered.
Figure 5.
Waveform after digital filtered.
3. System Network
The monitoring system is applied to industrial plants in the monitoring of CO leakage, which requires to take into account of toxicity and real-time monitoring. Wireless sensor networks (WSNs) have been extensively used for addressing such challenges [
17].
There are many Wireless networks such as Zigbee, Wifi, Bluetooth and RFID. However, while Zigbee technology provides greater accuracy, its price is very high, and therefore it is discarded as an option, leaving active RFID and Wifi as the most viable alternatives. It also seems that Bluetooth is gaining ground once again when the Bluetooth presents incompatibilities with many devices. As for RFID, it can also provide one to one transmission, which does not form a data network [
18].
Depending on the plant monitoring features and given the limitations in the range of radio transmission and network depth of common WSN solutions like Zigbee, it is infeasible to use them for such applications. Wifi promises to deliver high data rates over large areas to a large number of users, and forms network to transfer data directly to a computer and cell phone. So, Wifi is the most viable alternative.
Figure 6.
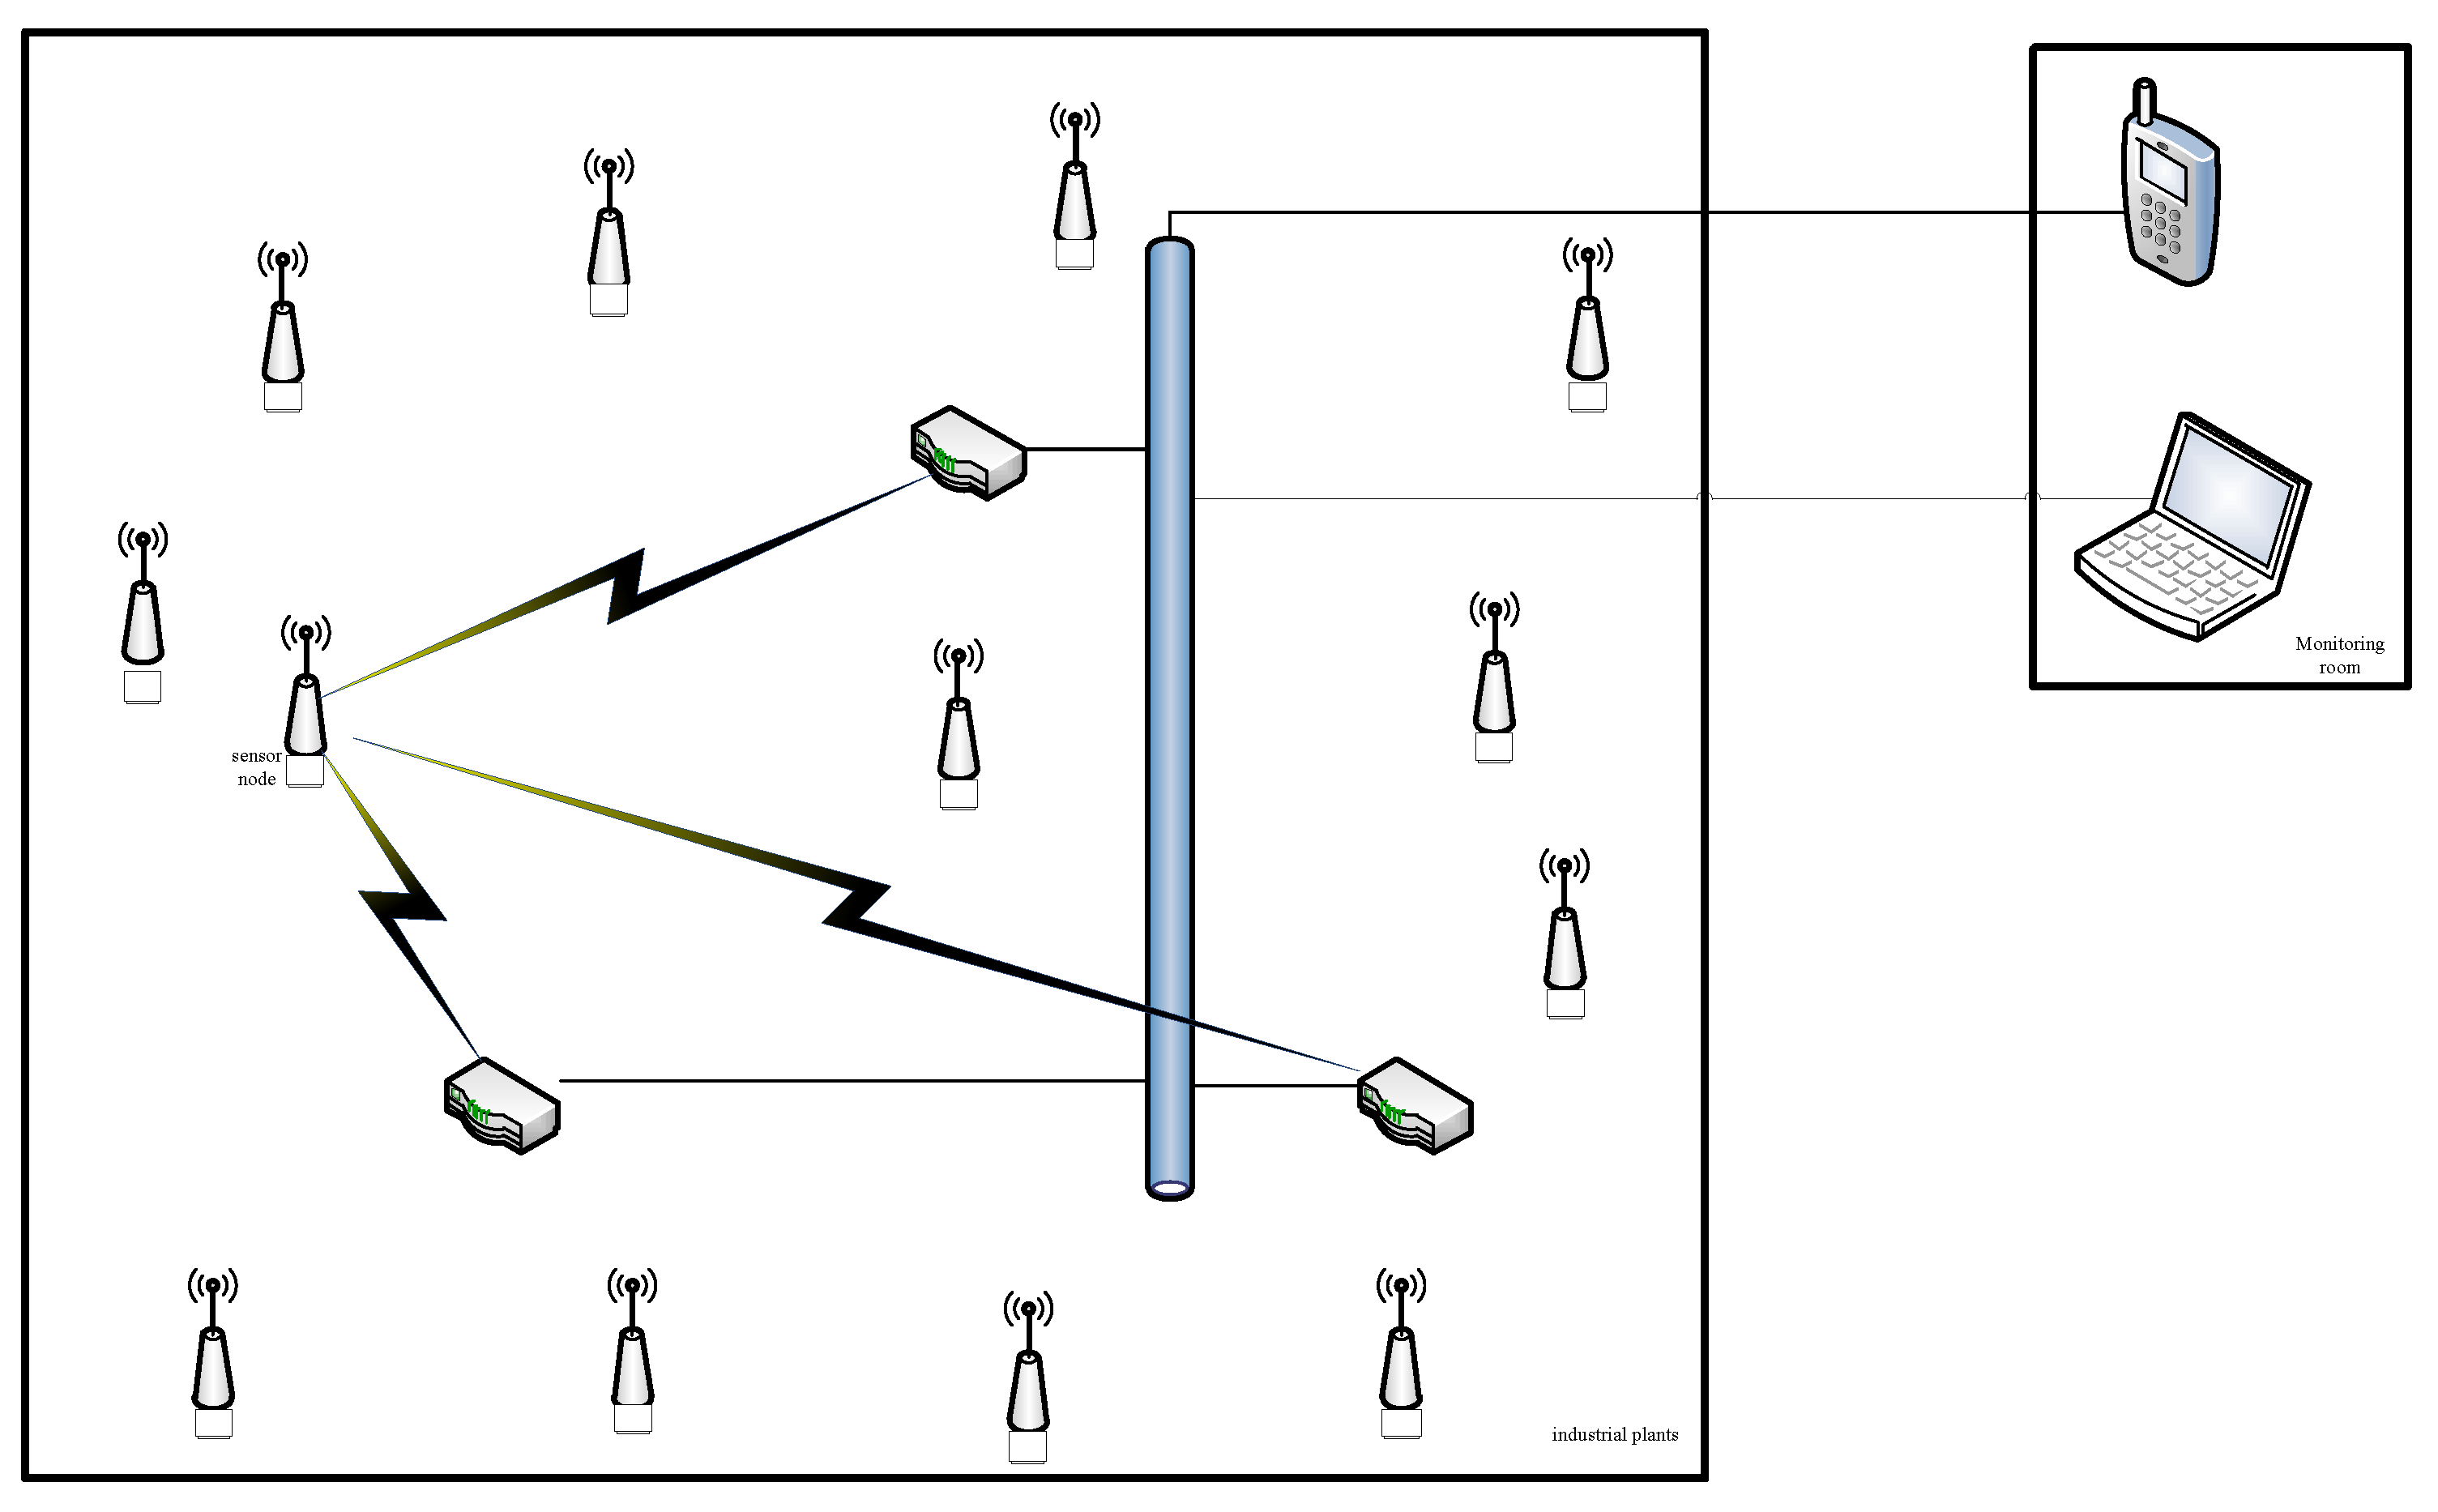
Architecture of the wireless sensor networks (WSNs).
Figure 6.
Architecture of the wireless sensor networks (WSNs).
The system network consists of station, Access Point (AP) and Personal Computer (PC), as shown in
Figure 6. The station is a Wifi transceiver module, which connects the sensor node with RS232, communicating sensor node with AP. AP is also known as router, which collects data from many sensor nodes to PC or smartphone.
3.1. Network Configuration
3.1.1. Base Station
The base station is based on Million Instructions Per Second program (MIPS) architecture, running at 360 MHz and featuring two wired Ethernet ports and one RS232 port. The device is equipped with programmable FLASH of 1 MB, random-access memory (RAM) of 8 MB, with maximum transmission distance up to 400 m when the environment is an open area. The TCP connections can be up to 32, which means the router can receive information from 32 base stations. The parameters of base station are as shown in
Table 1. The base station connects the sensor node with RS232, and sends data to routers. In turn, routers can transmit instructions by base station to the sensor node to control the sensor switch. To reduce energy consumption, the radio parameters such as signal modulation and antenna were optimized [
19].
Table 1.
Parameters of base station.
Table 1.
Parameters of base station.
| System Message | Parameters | Wifi | Parameters |
|---|
| processor | MIPS program
(32 bit, 360 MHz) | transmission distance | Max 400 m
(open areas, 3 dB antenna) |
| RAM/Flash | 8 M/1 M | frequency range | 2.412∼2.484 GHz |
3.1.2. Access Point
The AP is also called the router, as shown in
Figure 6, which is the intermediary base station and computers. The routers achieve each base station data transmission through the routers to the computer, and send instructions from the computer to the base station. The router is based on a 32-bit ARM7TDMI RISC processor, and running on linux operating system. The device is also equipped with programmable FLASH of 8 MB, random-access memory (RAM) of 32 MB, and peripheral function modules, which include Universal Asynchronous Receiver/Transmitter (UART), timers, programmable I/O ports and an interrupt controller.
3.2. Network Architecture
The network architecture of the system is as shown in
Figure 6. We place three routers in industrial plants. Each station has the Service Set Identifier (SSID) and mac address. The router receives the station mac address and signal strength, then acquires the distance to each base station based on the Receive Signal Strength Indicator (RSSI) [
20]. Given the distance of every station to three routers, the triangle positioning method is proposed [
21,
22,
23], and its principle is roughly shown in
Figure 7.
Figure 7.
The schematic of algorithm.
Figure 7.
The schematic of algorithm.
We can build a plane Cartesian coordinate system for industrial plants, in which three routers are named
r,
r,
r respectively, with coordinates (
x,
y), (
x,
y), (
x,
y). When routers receive the same mac address, they will define the sensor node as
p, and we will obtain the distance between
p with every router as
d,
d,
d. If the coordinate of sensor node
p is (
x,
y), the following formulas are formed:
From Equation (2a,b) , we can get (
x,
y) = (
x,
y), similarly, from Equation (2b,c), we can get (
x,
y) = (
x,
y), from Equation (2a,c), we can get (
x,
y) = (
x,
y); then,
So, the coordinate of sensor node p is (, ). With the same method, we can get the sensor node. The address of the node is shown on the PC or smartphone in the form of coordinates. With the triangulation, we can locate the address of every sensor node; if one fails to work, the monitor react quickly. Of course, the new nodes added can be shown simultaneously.
3.3. Network Implementation
The sensor nodes obtain concentration of CO all the time. However, because of the power consumption of Wifi module [
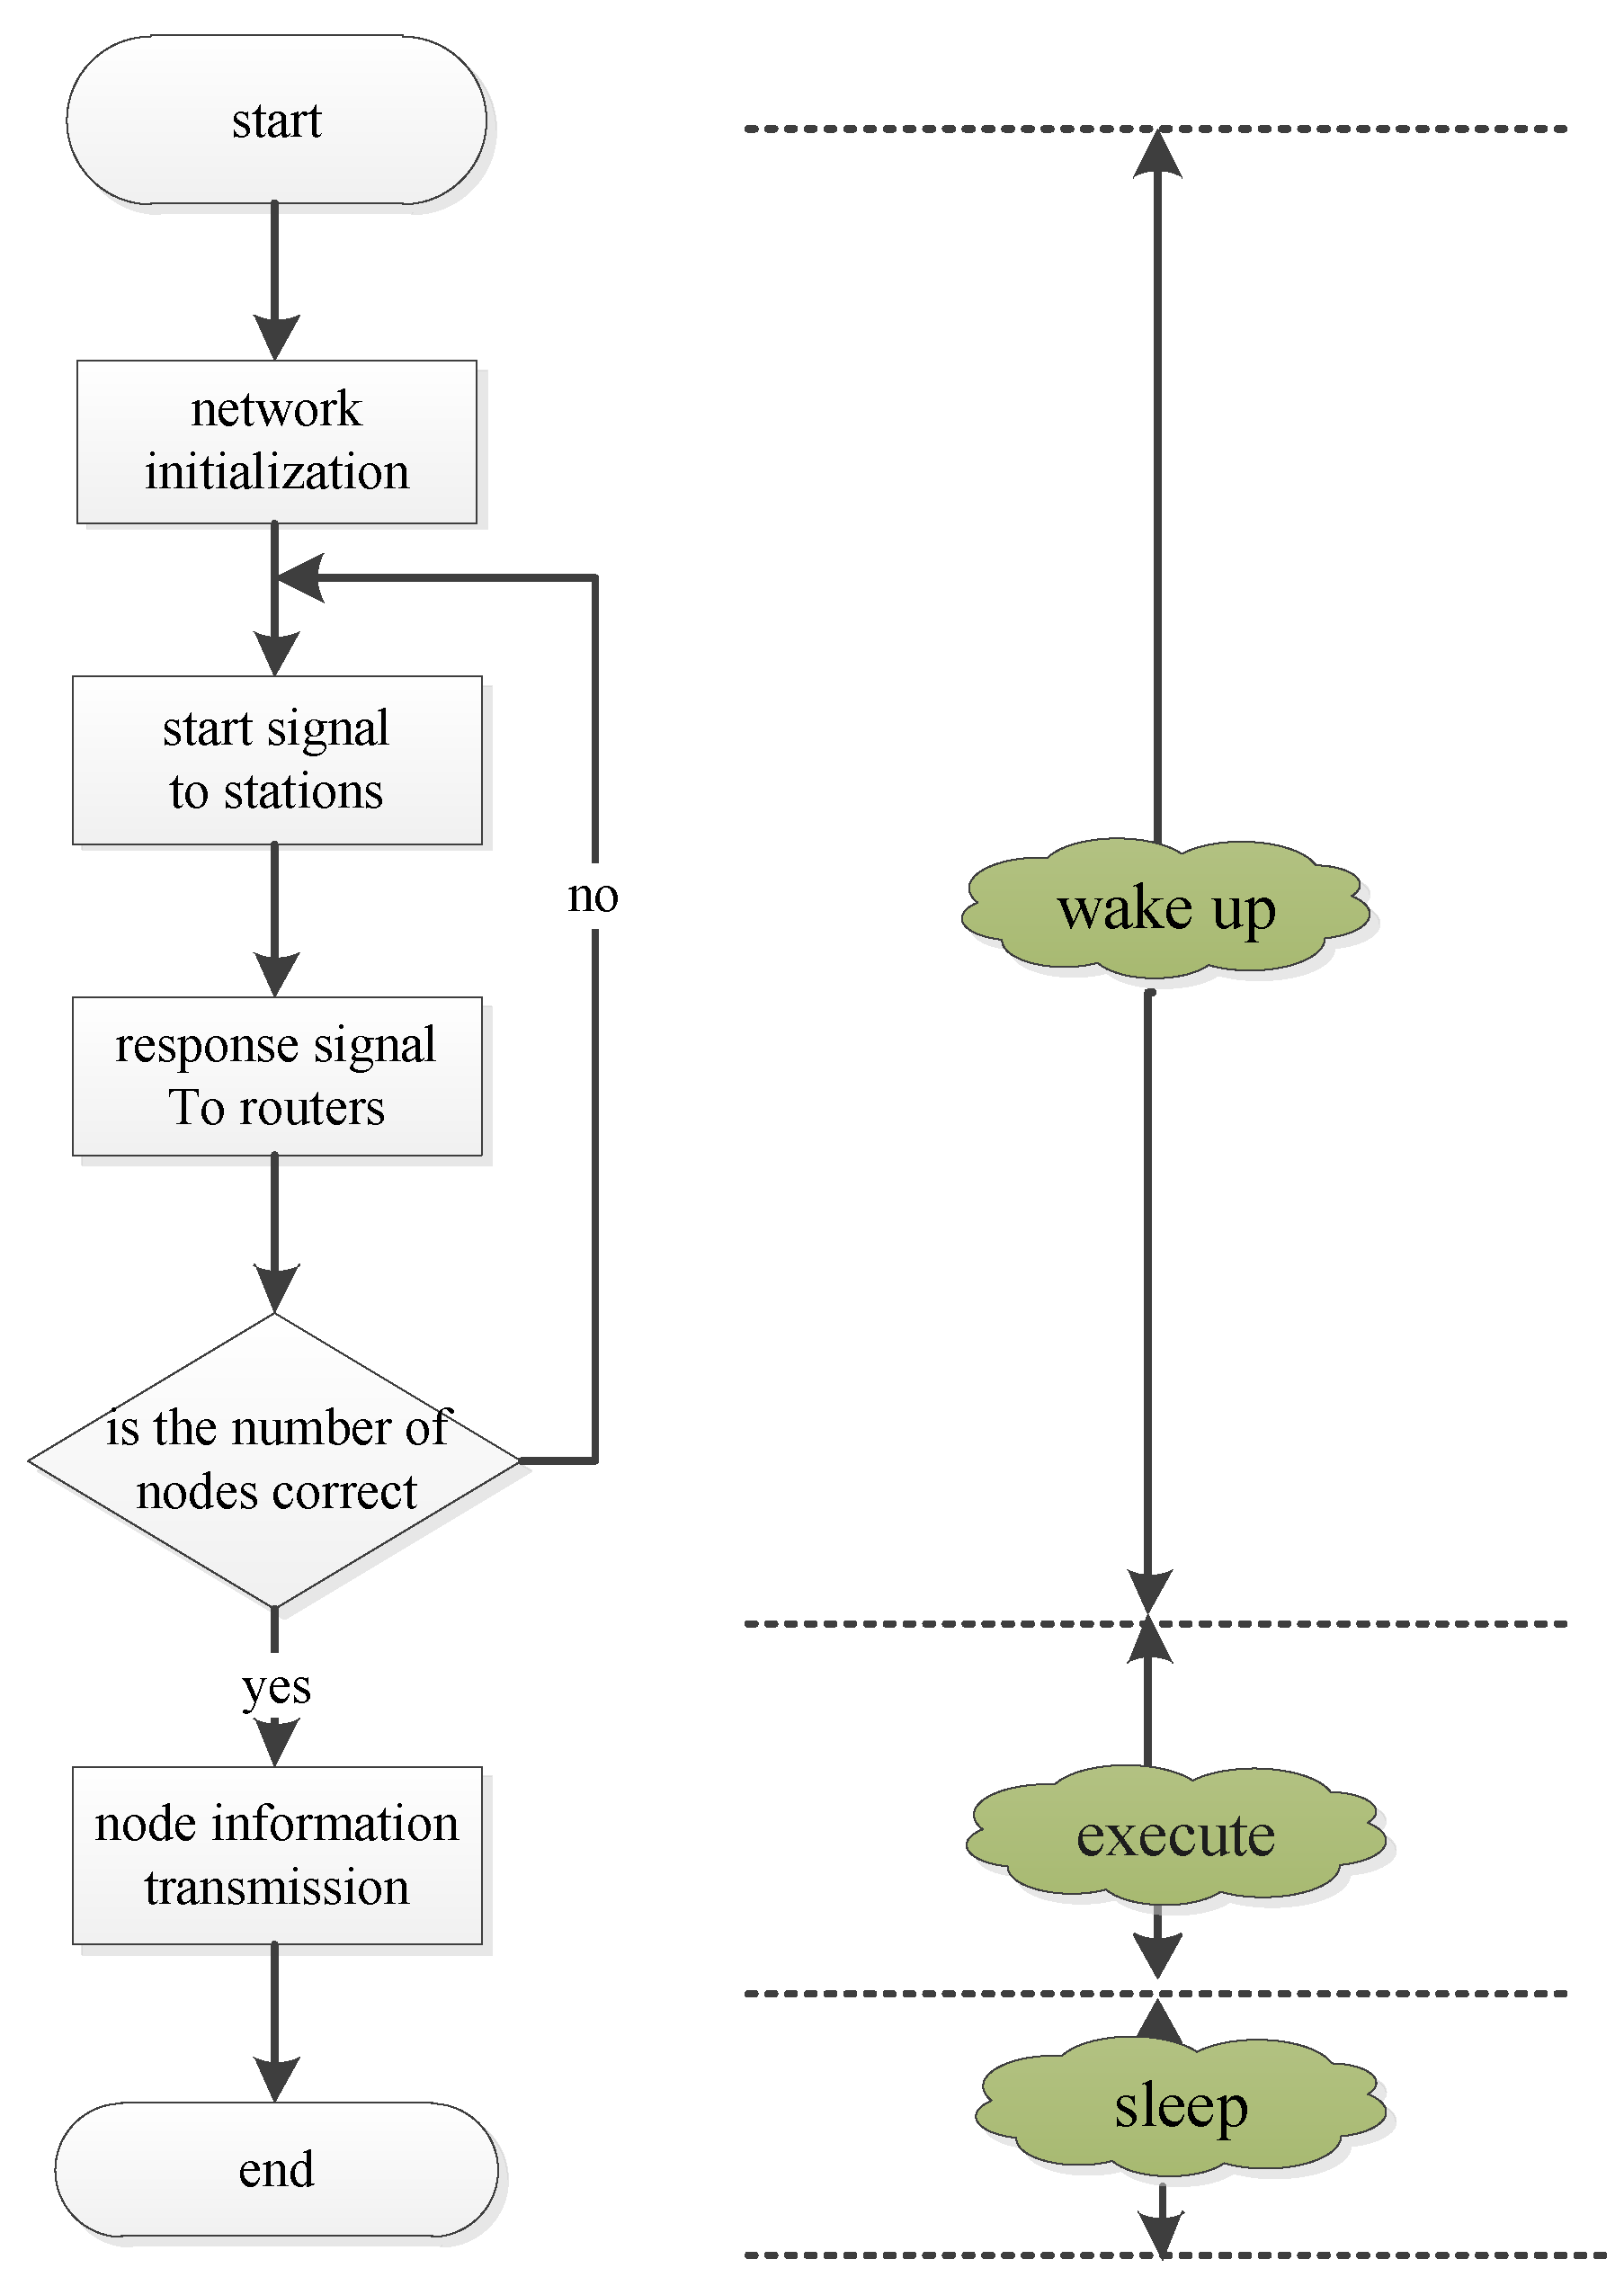
24], it is unwise with the Wifi module to open all the time. Additionally, it is not necessary to show the status of CO concentration continuously. Wifi module is designed with three different states: sleeping, wakeup, and execution. The state of sleeping lasts for 5 min, when 5 min is passed, one router issues a directive to every station for starting up. Every sensor node returns a response signal, and the position in coordinate system of PC or smartphone is located. So, we can determine the quality of the sensor and the newly added sensor nodes will be displayed in real time on a coordinate system. After a minute of data acquisition, the CO concentration of each node can be displayed. Then the network enters the state of Sleeping.
Figure 8 shows the work state of the network.
Figure 8.
The network working status.
Figure 8.
The network working status.
4. Experimental Results
The purpose of this paper is to describe a real-time monitoring system for the monitoring of CO concentration. Based on this purpose, the system mainly consists of three parts: the sensor nodes, Wifi modules and routers. The sensor nodes monitor CO concentration a time point by Wifi modules; routers receive the information of each point, and transport it to a PC or smartphone.
To validate the accuracy of the system, we put the sensor nodes in a closed container, the temperature was kept between 28
C and 29
C and relative humidity was maintained at 50%–60%. First the sensor node was calibrated under the condition that the container was filled with nitrogen. Then the container was filled with CO under the conditions of different concentrations. The sensor node measured the level of these different concentrations. The measurement lasted three hours at each level of concentration and adjacent measurements were at an interval of one hour. The results are shown in
Table 2.
The experimental data indicates that the minimum concentration detected by our sensor node is 15 ppm and the relative error is 4.2%, which means that the sensor node meets the requirements of the industry.
To verify the reliability of this monitoring system, we conducted the experiment in a plant (40 m long and 30 m wide) covered with pipes inside. The environmental state of industrial plants is as follows: all windows and doors were closed, the temperature was kept between 28 C and 29 C and relative humidity was maintained at 50%–60%. We placed a CO storage tank in industrial plants and the CO release rate is 5 ccm/min.
Table 2.
Measurements of sensor node.
Table 2.
Measurements of sensor node.
| Concentration (ppm) | Measurements | Average | Relative Error |
|---|
| (1) | (2) | (3) |
|---|
| 15 | 14.6 | 16.1 | 16.2 | 15.5 | 4.2% |
| 30 | 30.5 | 30.9 | 31.4 | 30.9 | 3.1% |
| 50 | 49.8 | 51.6 | 52.1 | 51.2 | 2.3% |
| 100 | 97.7 | 101.4 | 106.5 | 102.5 | 1.87% |
| 200 | 200.8 | 205.9 | 202.7 | 203.1 | 1.57% |
| 300 | 299.2 | 306.6 | 303.3 | 303.0 | 1.01% |
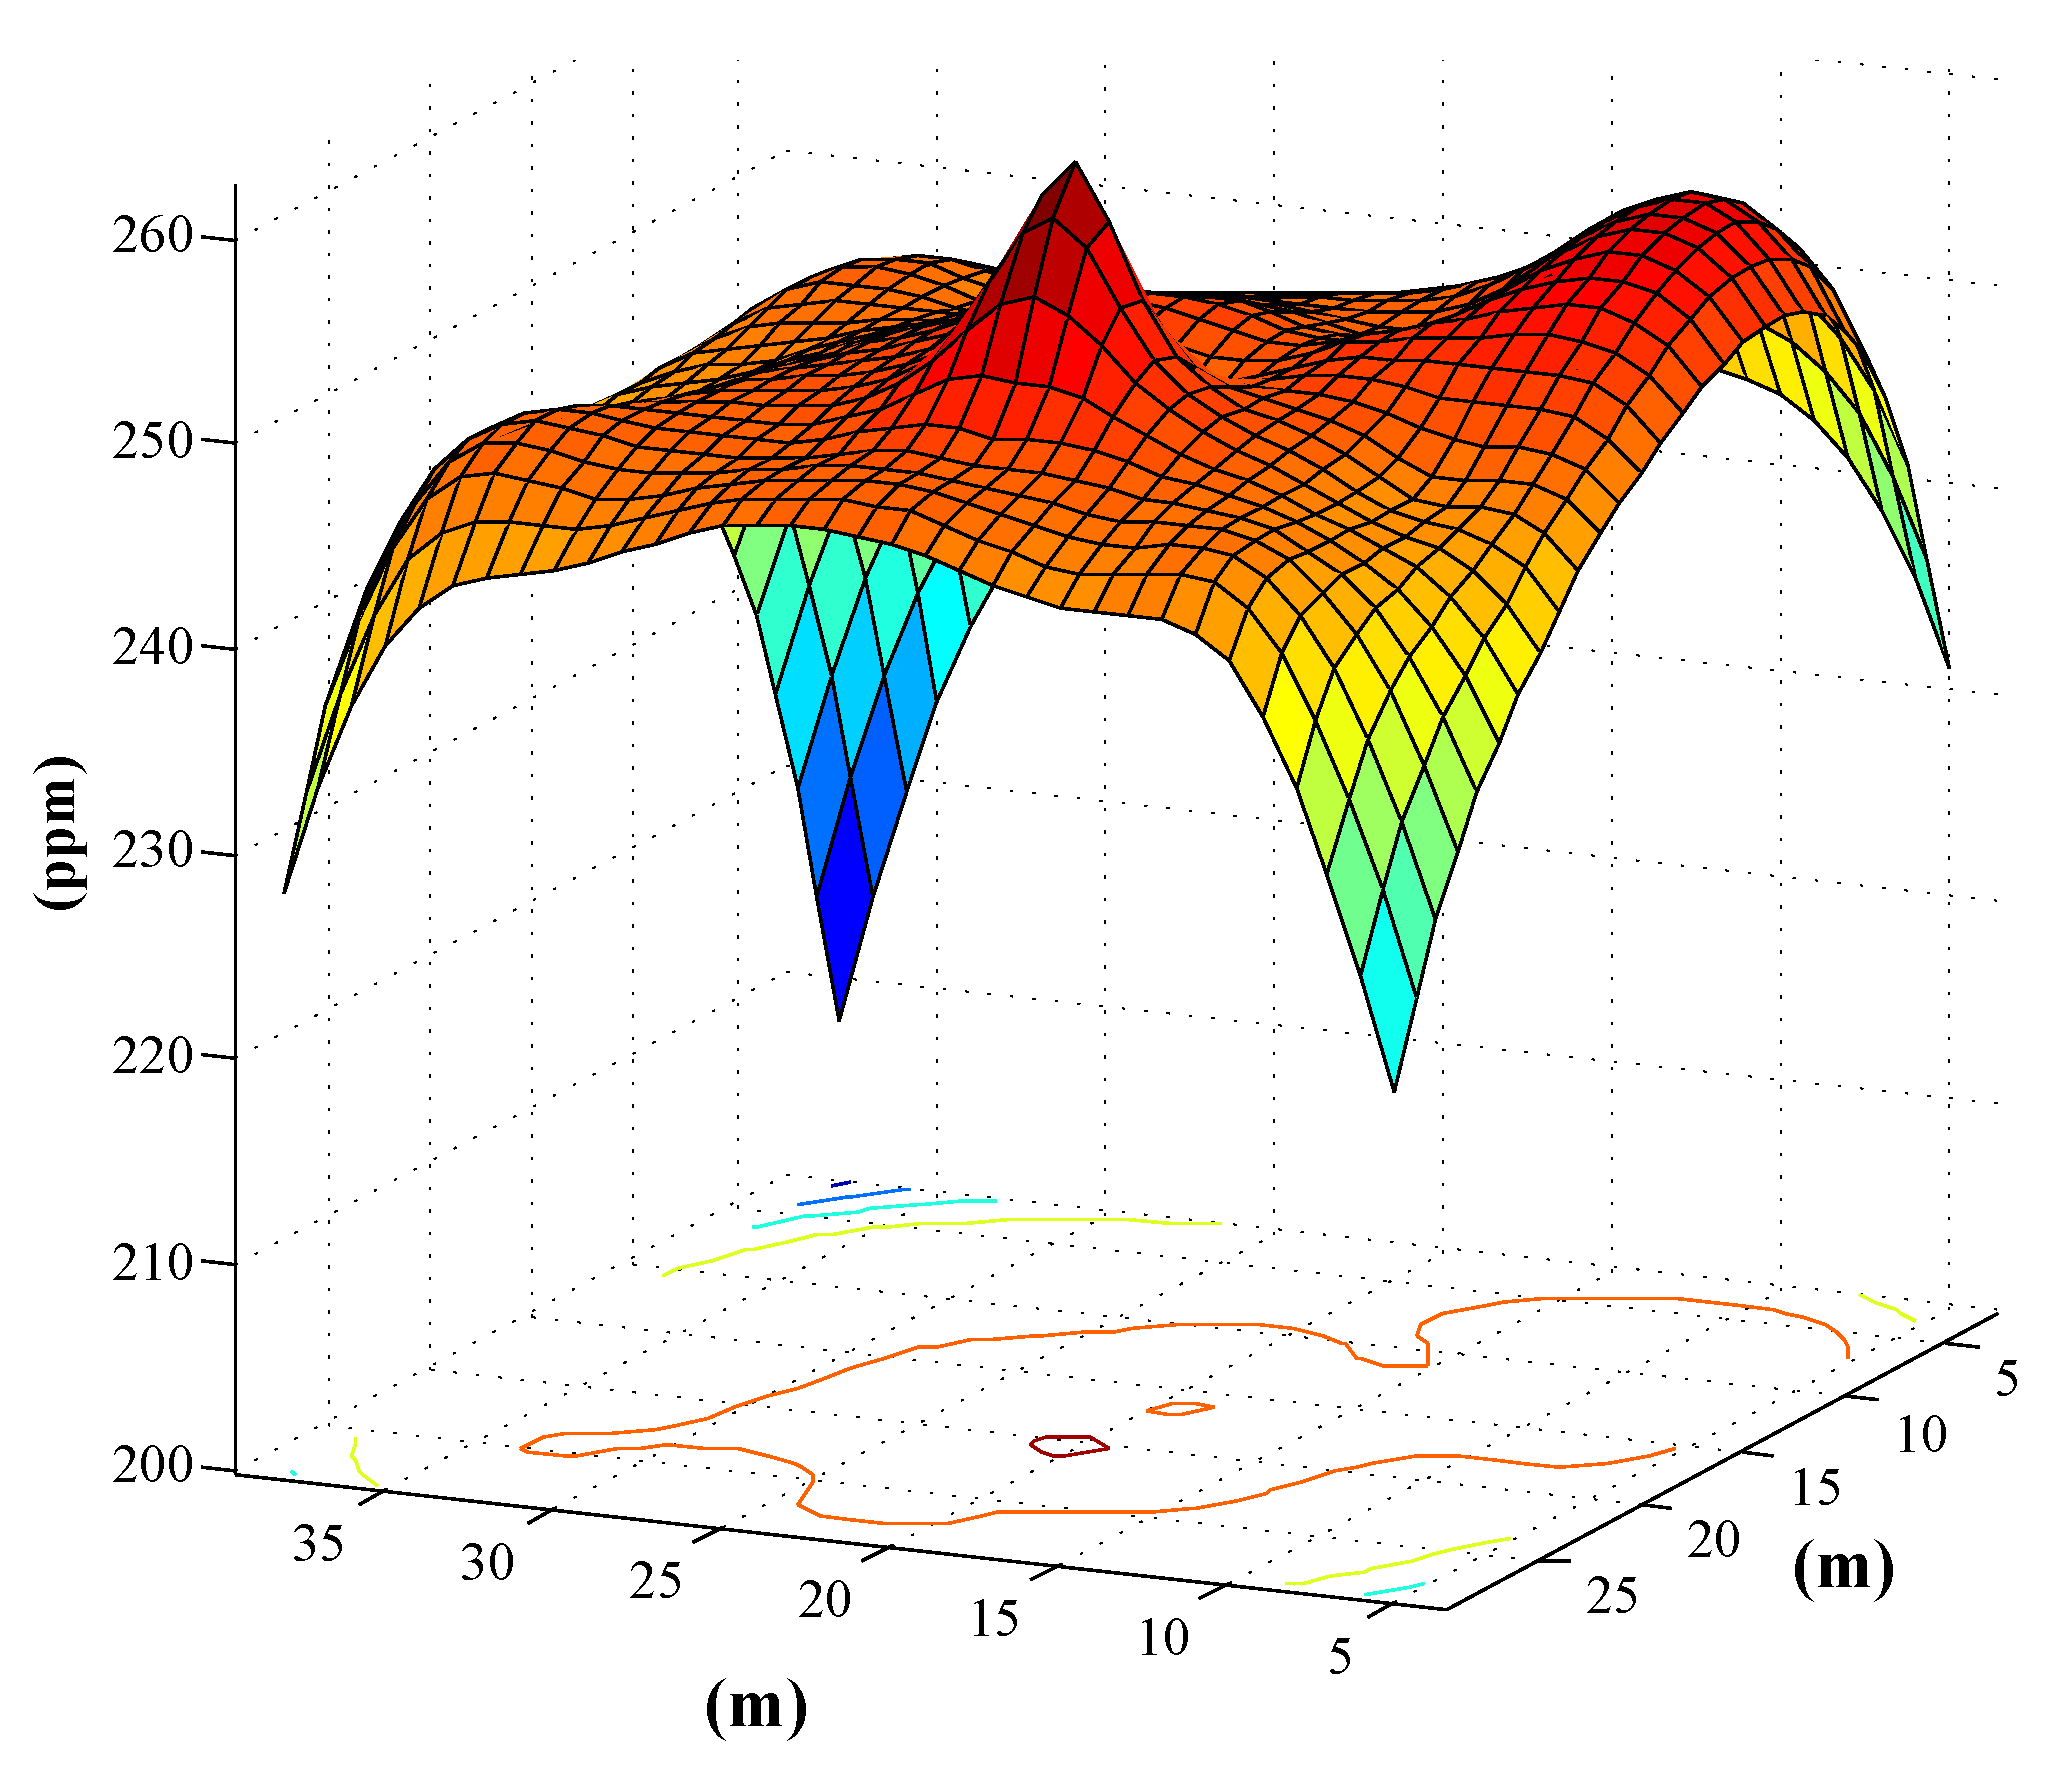
At a specific moment, every sensor node returned data to the PC, and we were able to acquire the concentration of CO in the place of sensor nodes. The spatial distribution of the indoor CO in the system was computed based on these sampling points, and the CO concentrations at points without sensors can be inferred from the distribution model. An effective Gaussian Process (GP) representation [
25] is used for the data regression to establish the CO distribution model.
Figure 9 shows the CO distribution model-based Gaussian Process, and the contour map can reflect the position of CO leakage points.
Figure 9.
Predicted based on Gaussian Process (GP).
Figure 9.
Predicted based on Gaussian Process (GP).
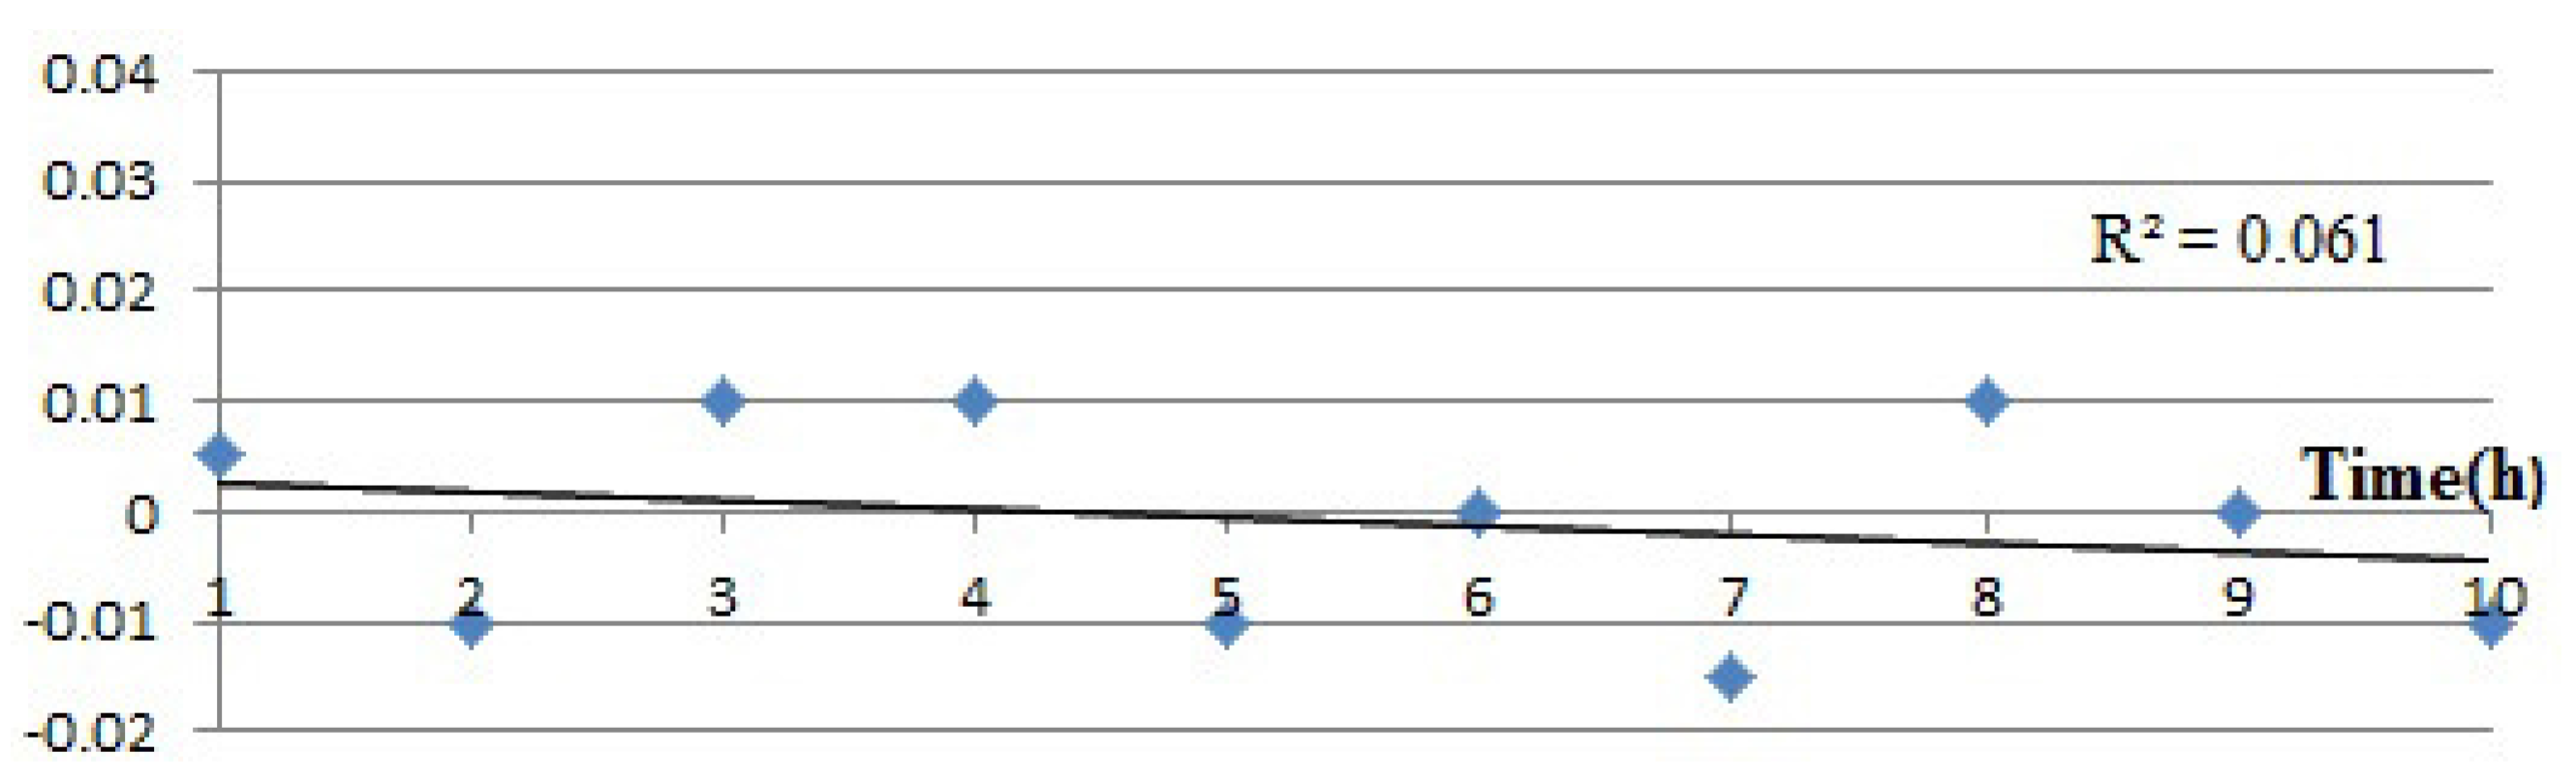
In order to verify the stability of the system, we ran 10 experiments on the same basis for one hour a day, and dozens of data about the maximum concentration of CO have been acquired. A simple normalization method is adopted, and these values are normalized according to the following equation:
Figure 10 shows the change of CO concentrations in the leakage point during 10 days’ continuous test. It can be inferred that the normalized values are within −0.02–0.01, in other words, the percentage of every value deviated from the mean is within −0.02–0.01, which indicates that the device has a better performance of stability.
Figure 10.
Stability test of the system.
Figure 10.
Stability test of the system.
5. Conclusions
We describe a real-time monitoring system for the concentration of CO based on Wifi WSN. For this purpose, a hardware system is designed to detect the CO concentration, and a low-frequency modulation method is proposed to improve the stability and accuracy. A wireless network using Wifi technology can transmit the information of sensor nodes, and the triangulation achieves the function of monitoring the location and operational status of each node. The system is deployed within an experimental environment, and the experimental results show that the system meets the stability and accuracy expectations.
Acknowledgments
This research is supported by the National Natural Science Foundation of China (No. 61471260). Program for New Century Excellent Talents in University (NCET-12-0400) and the Specialized Research Fund for the Doctoral Program of Higher Education of China (Grant No. 20136118120010).
Author Contributions
Jiachen Yang and Jianxiong Zhou designed the overall monitoring system. In addition, they wrote and revised the paper. Zhihan Lv, Wei Wei, and Houbing Song contributed to the experiment and statistic analysis of data.
Conflicts of Interest
The authors declare no conflict of interest.
References
- Goldstein, M. Carbon monoxide poisoning. J. Emerg. Nurs. 2008, 34, 538–542. [Google Scholar] [CrossRef] [PubMed]
- Postolache, O.A.; Pereira, J.M.D.; Girao, P.M.B. Smart sensors network for air quality monitoring applications. IEEE Trans. Instrum. Meas. 2009, 58, 3253–3262. [Google Scholar] [CrossRef]
- West, J.B. Respiratory Physiology: The Essentials; Lippincott Williams & Wilkins: Philadelphia, PA, USA, 2012. [Google Scholar]
- Chehri, A.; Farjow, W.; Mouftah, H.T.; Fernando, X. Design of wireless sensor network for mine safety monitoring. In Proceedings of the 2011 24th IEEE Canadian Conference on Electrical and Computer Engineering (CCECE), Marriott Gateway Niagara Falls, ON, Canada, 8–11 May 2011; pp. 001532–001535.
- Tsow, F.; Forzani, E.; Rai, A.; Wang, R.; Tsui, R.; Mastroianni, S.; Knobbe, C.; Tao, N.; Gandolfi, A.J. A wearable and wireless sensor system for real-time monitoring of toxic environmental volatile organic compounds. IEEE Sens. J. 2009, 9, 1734–1740. [Google Scholar] [CrossRef]
- Aime, M.D.; Calandriello, G.; Lioy, A. Dependability in wireless networks: Can we rely on WiFi? IEEE Secur. Priv. 2007, 5, 23–29. [Google Scholar] [CrossRef]
- Bishop, G.A.; Starkey, J.R.; Ihlenfeldt, A.; Williams, W.J.; Stedman, D.H. IR long-path photometry: A remote sensing tool for automobile emissions. Anal. Chem. 1989, 61, 671A–677A. [Google Scholar] [CrossRef] [PubMed]
- Chaiwatpongsakorn, C.; Lu, M.; Keener, T.C.; Khang, S.J. The Deployment of Carbon Monoxide Wireless Sensor Network (CO-WSN) for Ambient Air Monitoring. Int. J. Environ. Res. Public Health 2014, 11, 6246–6264. [Google Scholar] [CrossRef] [PubMed]
- Wu, C.H.; Horng, S.J. Run-length chain coding and scalable computation of a shape’s moments using reconfigurable optical buses. IEEE Trans. Syst. Man Cybern. B Cybern. 2004, 34, 845–855. [Google Scholar] [CrossRef] [PubMed]
- Kuhn, K.; Pignanelli, E.; Schutze, A. Versatile gas detection system based on combined ndir transmission and photoacoustic absorption measurements. IEEE Sens. J. 2013, 13, 934–940. [Google Scholar] [CrossRef]
- Yang, J.; An, K.; Wang, B.; Wang, L. New mainstream double-end carbon dioxide capnograph for human respiration. J. Biomed. Opt. 2010, 15. [Google Scholar] [CrossRef] [PubMed]
- Yang, J.; Wang, B.; Fan, C.; Wang, L. A new single-end mainstream CO2 capnograph. Comput. Methods Biomech. Biomed. Eng. 2011, 14, 1033–1039. [Google Scholar] [CrossRef] [PubMed]
- Xie, Q.; Li, J.; Gao, X.; Jia, J. Fourier domain local narrow-band signal extraction algorithm and its application to real-time infrared gas detection. Sens. Actuators B Chem. 2010, 146, 35–39. [Google Scholar] [CrossRef]
- Zhu, Z.; Xu, Y.; Jiang, B. A one ppm NDIR methane gas sensor with single frequency filter denoising algorithm. Sensors 2012, 12, 12729–12740. [Google Scholar] [CrossRef]
- Yang, J.; Wang, H.; Wang, B.; Wang, L. Accurate and stable continuous monitoring module by mainstream capnography. J. Clin. Monit. Comput. 2014, 28, 363–369. [Google Scholar] [CrossRef] [PubMed]
- Yang, J.; Wang, H.; Chen, B.; Wang, B.; Wang, L. Use of signal decomposition to compensate for respiratory disturbance in mainstream capnometer. Appl. Opt. 2014, 53, 2145–2151. [Google Scholar] [CrossRef] [PubMed]
- Peng, C.; Qian, K.; Wang, C. Design and Application of a VOC-Monitoring System Based on a ZigBee Wireless Sensor Network. IEEE Sens. J. 2015, 15, 2255–2268. [Google Scholar] [CrossRef]
- Villarrubia, G.; Bajo, J.; de Paz, J.F.; Corchado, J.M. Monitoring and detection platform to prevent anomalous situations in home care. Sensors 2014, 14, 9900–9921. [Google Scholar] [CrossRef] [PubMed]
- Rault, T.; Bouabdallah, A.; Challal, Y. Energy efficiency in wireless sensor networks: A top-down survey. Comput. Netw. 2014, 67, 104–122. [Google Scholar] [CrossRef]
- Kumar, P.; Reddy, L.; Varma, S. Distance measurement and error estimation scheme for RSSI based localization in Wireless Sensor Networks. In Proceedings of the 2009 Fifth IEEE Conference on Wireless Communication and Sensor Networks (WCSN), Allahabad, India, 15–19 December 2009; pp. 1–4.
- Zhou, Y. A closed-form algorithm for the least-squares trilateration problem. Robotica 2011, 29, 375–389. [Google Scholar] [CrossRef]
- Manolakis, D.E. Efficient solution and performance analysis of 3-D position estimation by trilateration. IEEE Trans. Aerosp. Electron. Syst. 1996, 32, 1239–1248. [Google Scholar] [CrossRef]
- Makki, A.; Siddig, A.; Saad, M.; Bleakley, C. Survey of WiFi Positioning Using Time-Based Techniques. Comput. Netw. 2015, 88, 218–233. [Google Scholar] [CrossRef]
- Park, S.; Hong, S.W.; Lee, E.; Kim, S.H.; Crespi, N. Large-scale mobile phenomena monitoring with energy-efficiency in wireless sensor networks. Comput. Netw. 2015, 81, 116–135. [Google Scholar] [CrossRef]
- Deisenroth, M.P.; Fox, D.; Rasmussen, C.E. Gaussian processes for data-efficient learning in robotics and control. IEEE Trans. Pattern Anal. Mach. Intell. 2015, 37, 408–423. [Google Scholar] [CrossRef] [PubMed]
© 2015 by the authors; licensee MDPI, Basel, Switzerland. This article is an open access article distributed under the terms and conditions of the Creative Commons Attribution license (http://creativecommons.org/licenses/by/4.0/).


