
Physical Human Activity Recognition Using Wearable Sensors

Abstract
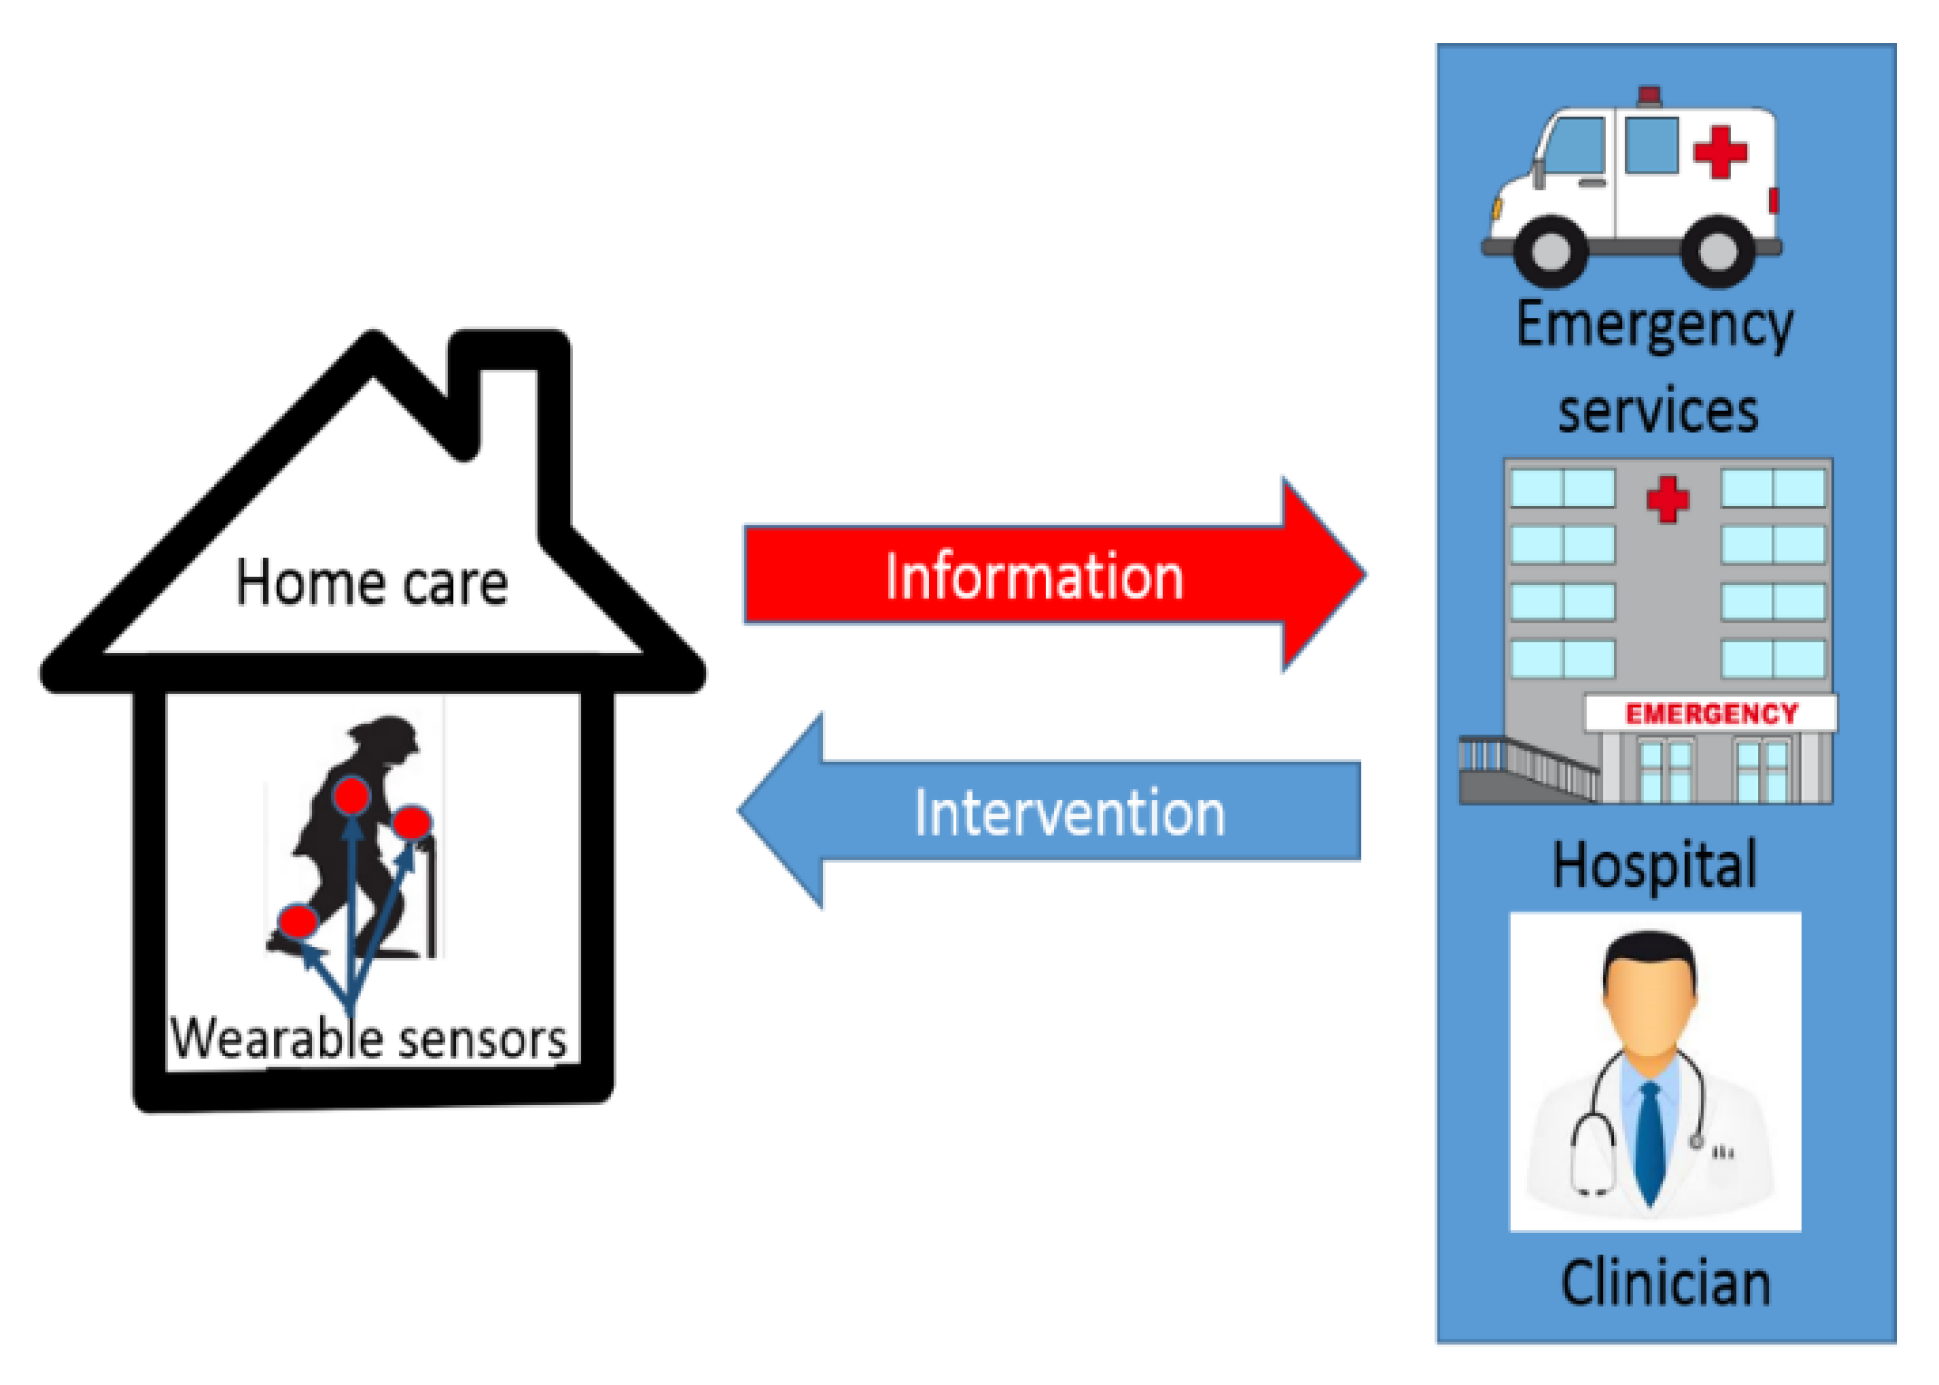
:1. Introduction

2. Backgrounds on Sensors’ Placement, Data Pre-Processing and Classification Techniques
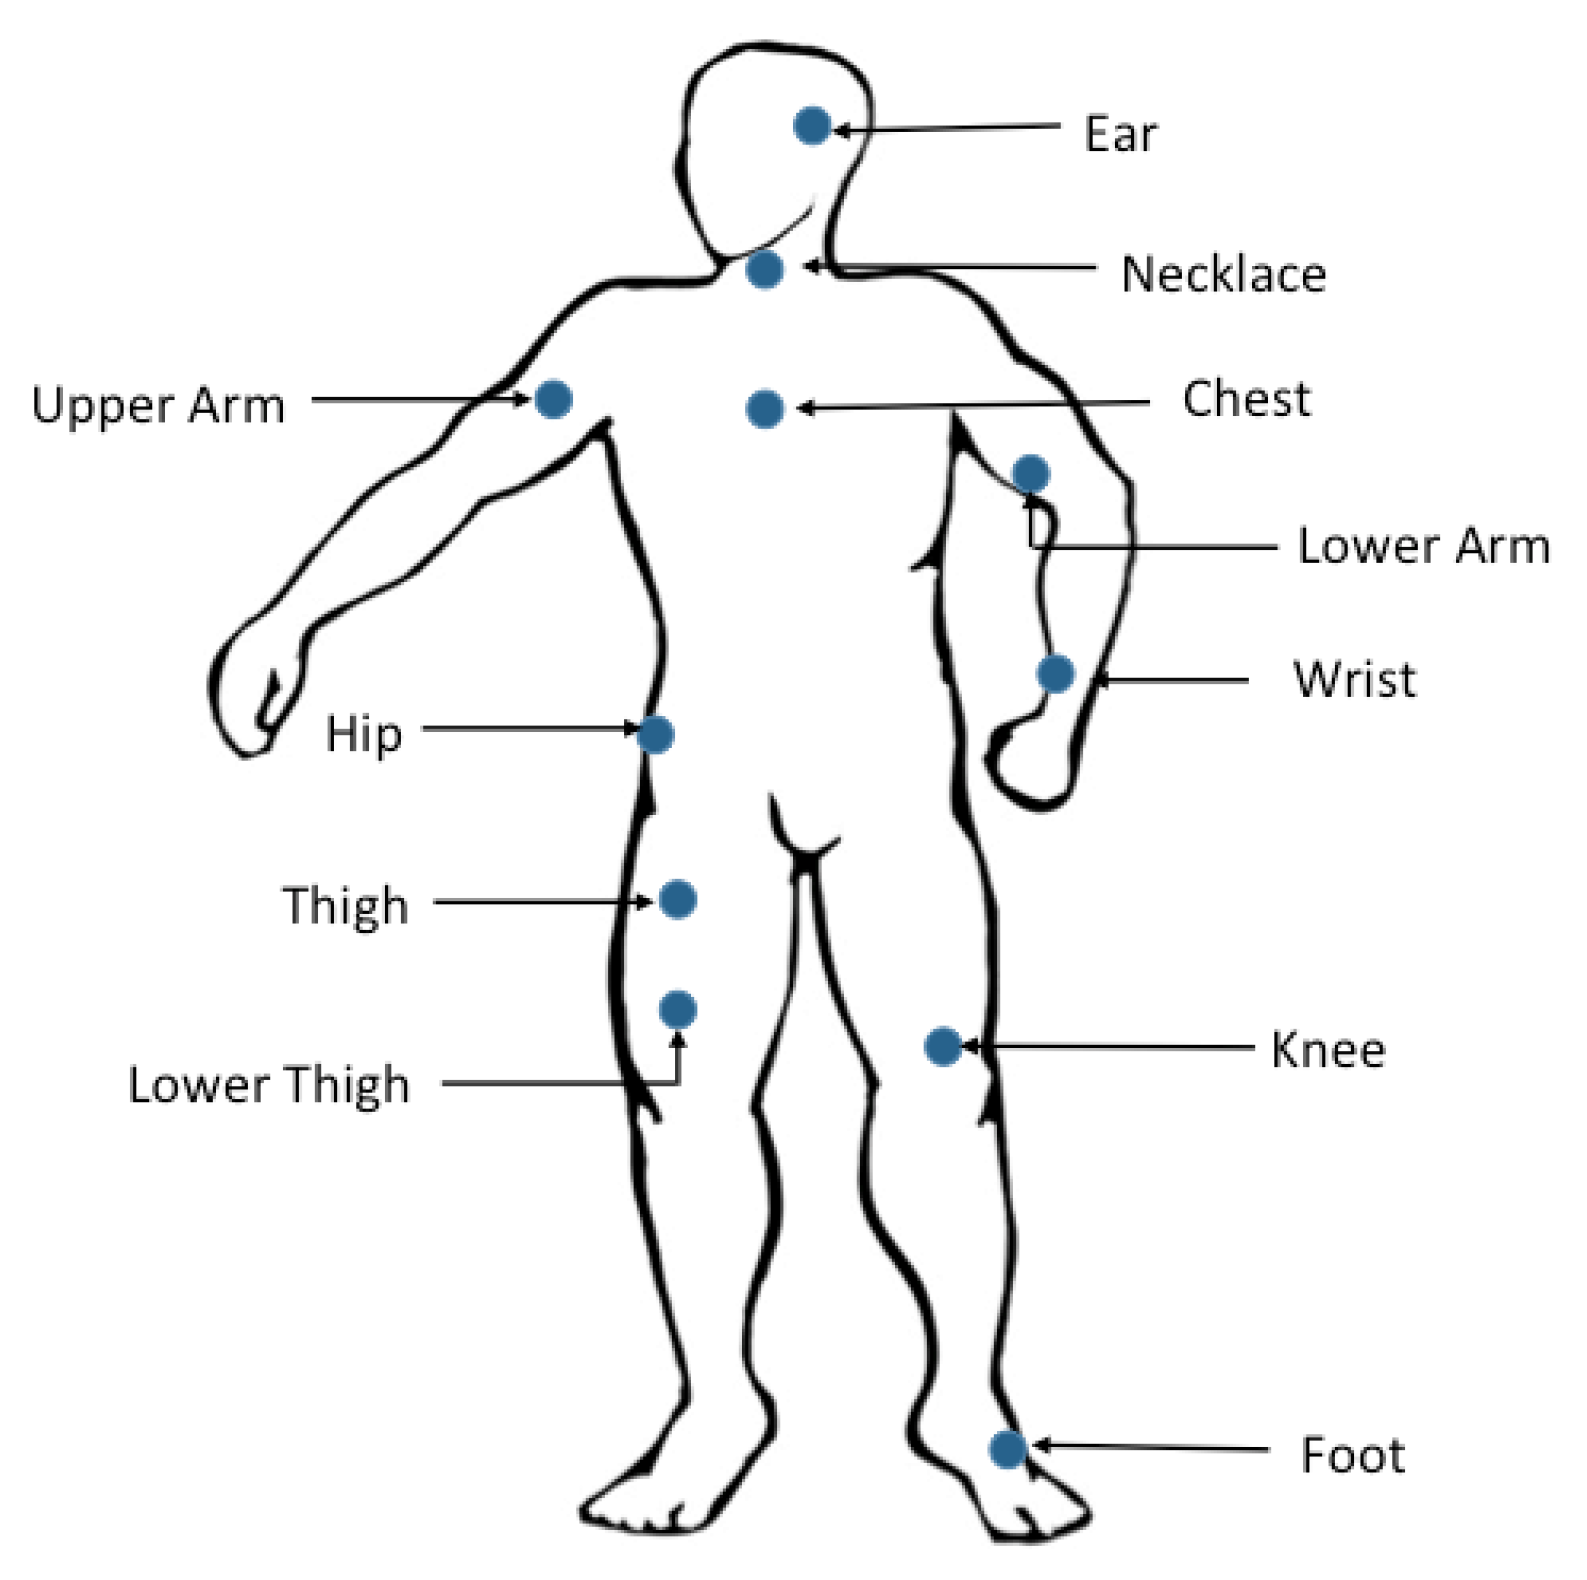
2.1. Wearable Sensors’ Placement

| Reference | Placement ofAccelerometers | Detected Activities | Average (%) ofClassification Accuracy |
|---|---|---|---|
| Karantonis et al., 2006 [15] | Waist | Walking, Falling | 90.8% |
| Mathie, 2004 [18] | Waist | Falling, Walking, Sitting, Standing, Lying | 98.9% |
| Yang et al., 2008 [20] | Wrist | Walking, Running, Scrubbing, Standing, Working at a PC, Vacuuming, Brushing teeth Sitting | 95% |
| Pirttikangas, 2006 [21] | Thigh, Necklace, Wrists | Typing, Watching TV, Drinking, Stairs Ascent and Descent | 91.5% |
| Parkka, 2006 [17] | Wrist, Chest | Lying, Sitting, Walking, Rowing And Cycling | 83.3% |
| Olguın, 2006 [22] | Wrist, Chest, Hip | Sitting, Running, Walking, Standing, Lying, Crawling | 92.13% |
| Bonomi, 2009 [14] | Lower Back | Lying, Sitting, Standing, Working on a Computer, Walking, Running, Cycling | 93% |
| Yeoh, 2008 [19] | Thigh, Waist | Sitting, Lying, Standing And Walking Speed | 100% |
| Lyons, 2005 [23] | Thigh, Trunk | Sitting, Standing, Lying, Moving | 92.25% |
| Salarian et al., 2007 [24] | Trunk , shanks (IMU sensor) | 14 daily living activities | - |
| Gjoreski, 2011 [25] | Thigh, Waist, Chest, Ankle | Lying, Sitting, Standing, All Fours, Transitional | 91% |
| Chamroukhi, 2013 [7] | Chest, Thigh, Ankle | Stairs Ascent and Descent, Walking, Sitting, Standing Up, Sitting on the Ground | 90.3% |
| Bayat et al., 2014 [26] | pocket, Hand | Slow Walking, Fast Walking, Running, Stairs-Up, Stairs-Down, and Dancing | 91.15% |
| Moncada-Torres, 2014 [27] | Chest, Thigh, Ankle | 16 daily living activities | 89.08% |
| Gupta et al. 2014 [28] | Waist | walking, jumping, running, sit-to-stand/stand-to-sit, stand-to-kneel-to-stand, and being stationary | 98% |
| Garcia-Ceja et al., 2014 [29] | Wrist | long-term activities (Shopping, Showering, Dinner, Working, Commuting, Brush Teeth) | 98% |
| Gao et al., 2014 [8] | Chest, waist, thigh, side | standing, sitting, lying, walking and transition | 96.4% |
| Massé et al. [30] | Trunk (IMU and barometric pressure sensor) | sitting, standing, walking, lying | 90.4% |

2.2. Pre-Processing
2.2.1. Features Computation
- Time-domain features
- Frequency-domain features
2.2.2. Feature Selection
2.2.3. Feature Extraction
2.3. Classification Techniques
2.3.1. k-Nearest Neighbors
2.3.2. Support Vector Machines
2.3.3. Random Forests
2.3.4. Gaussian Mixture Models
2.3.5. K-Means
2.3.6. Markov Chains and Hidden Markov Models
2.3.7. Other Classification Techniques Used in Activity Recognition
2.4. Discussion

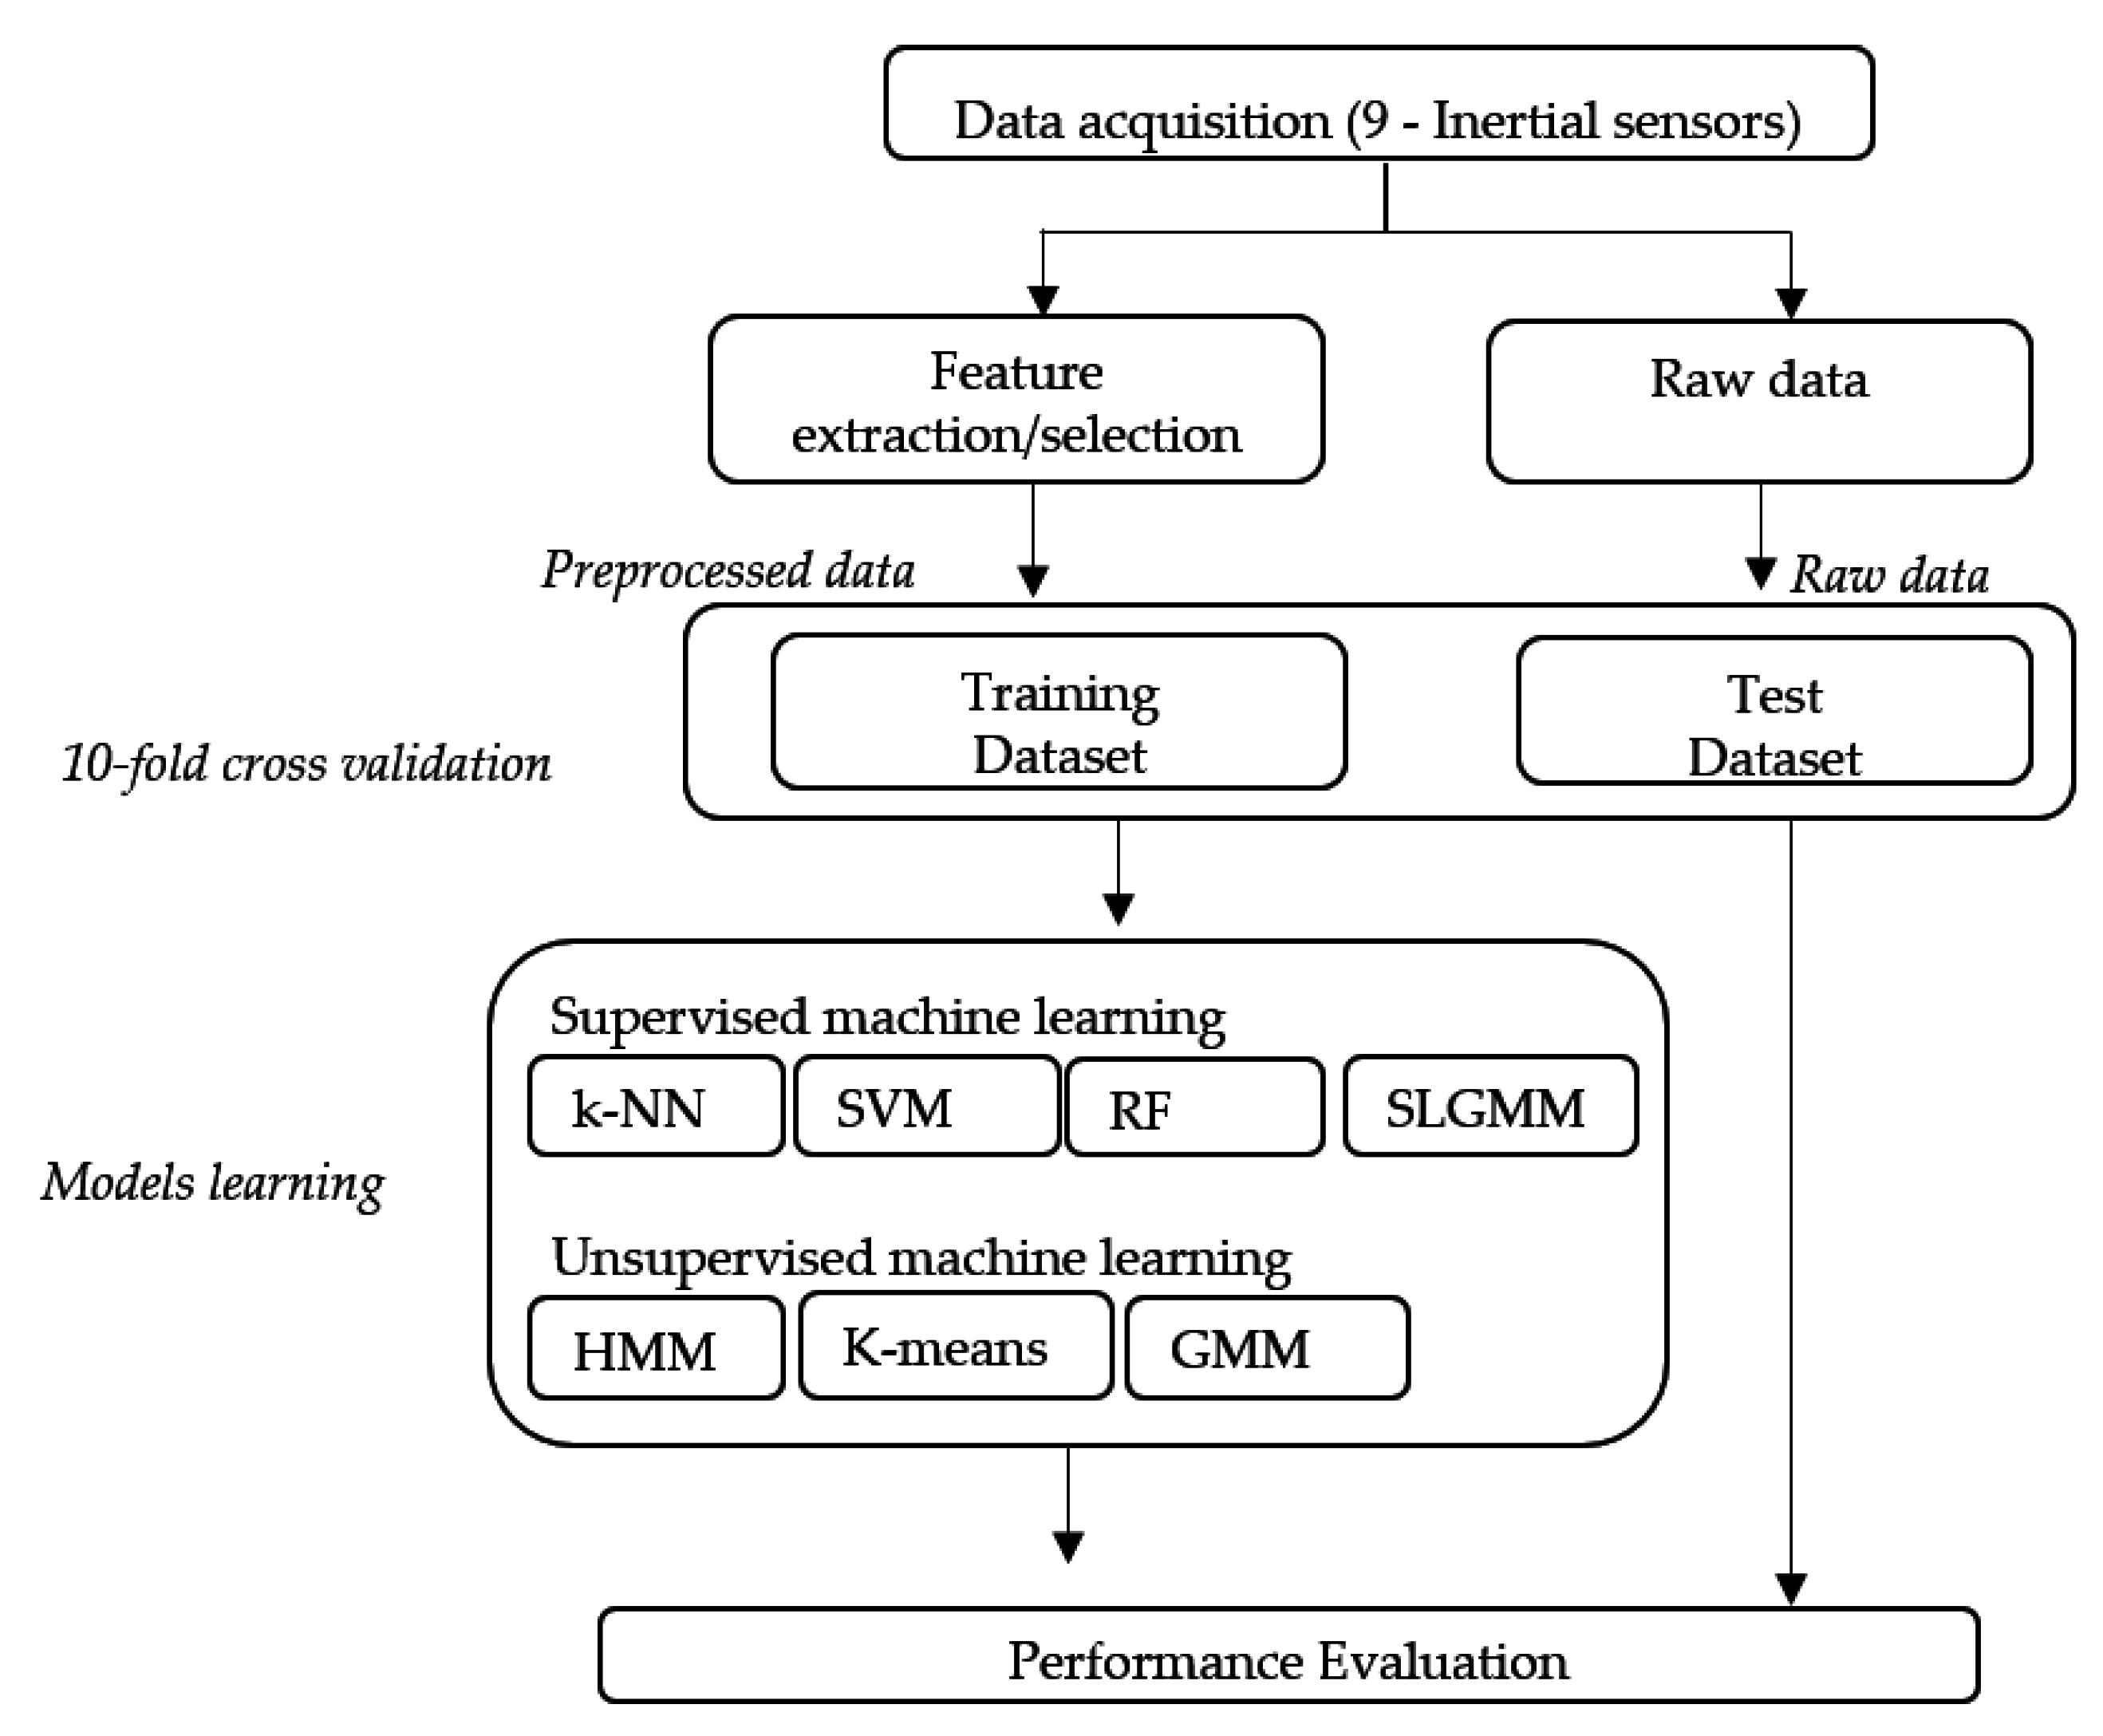
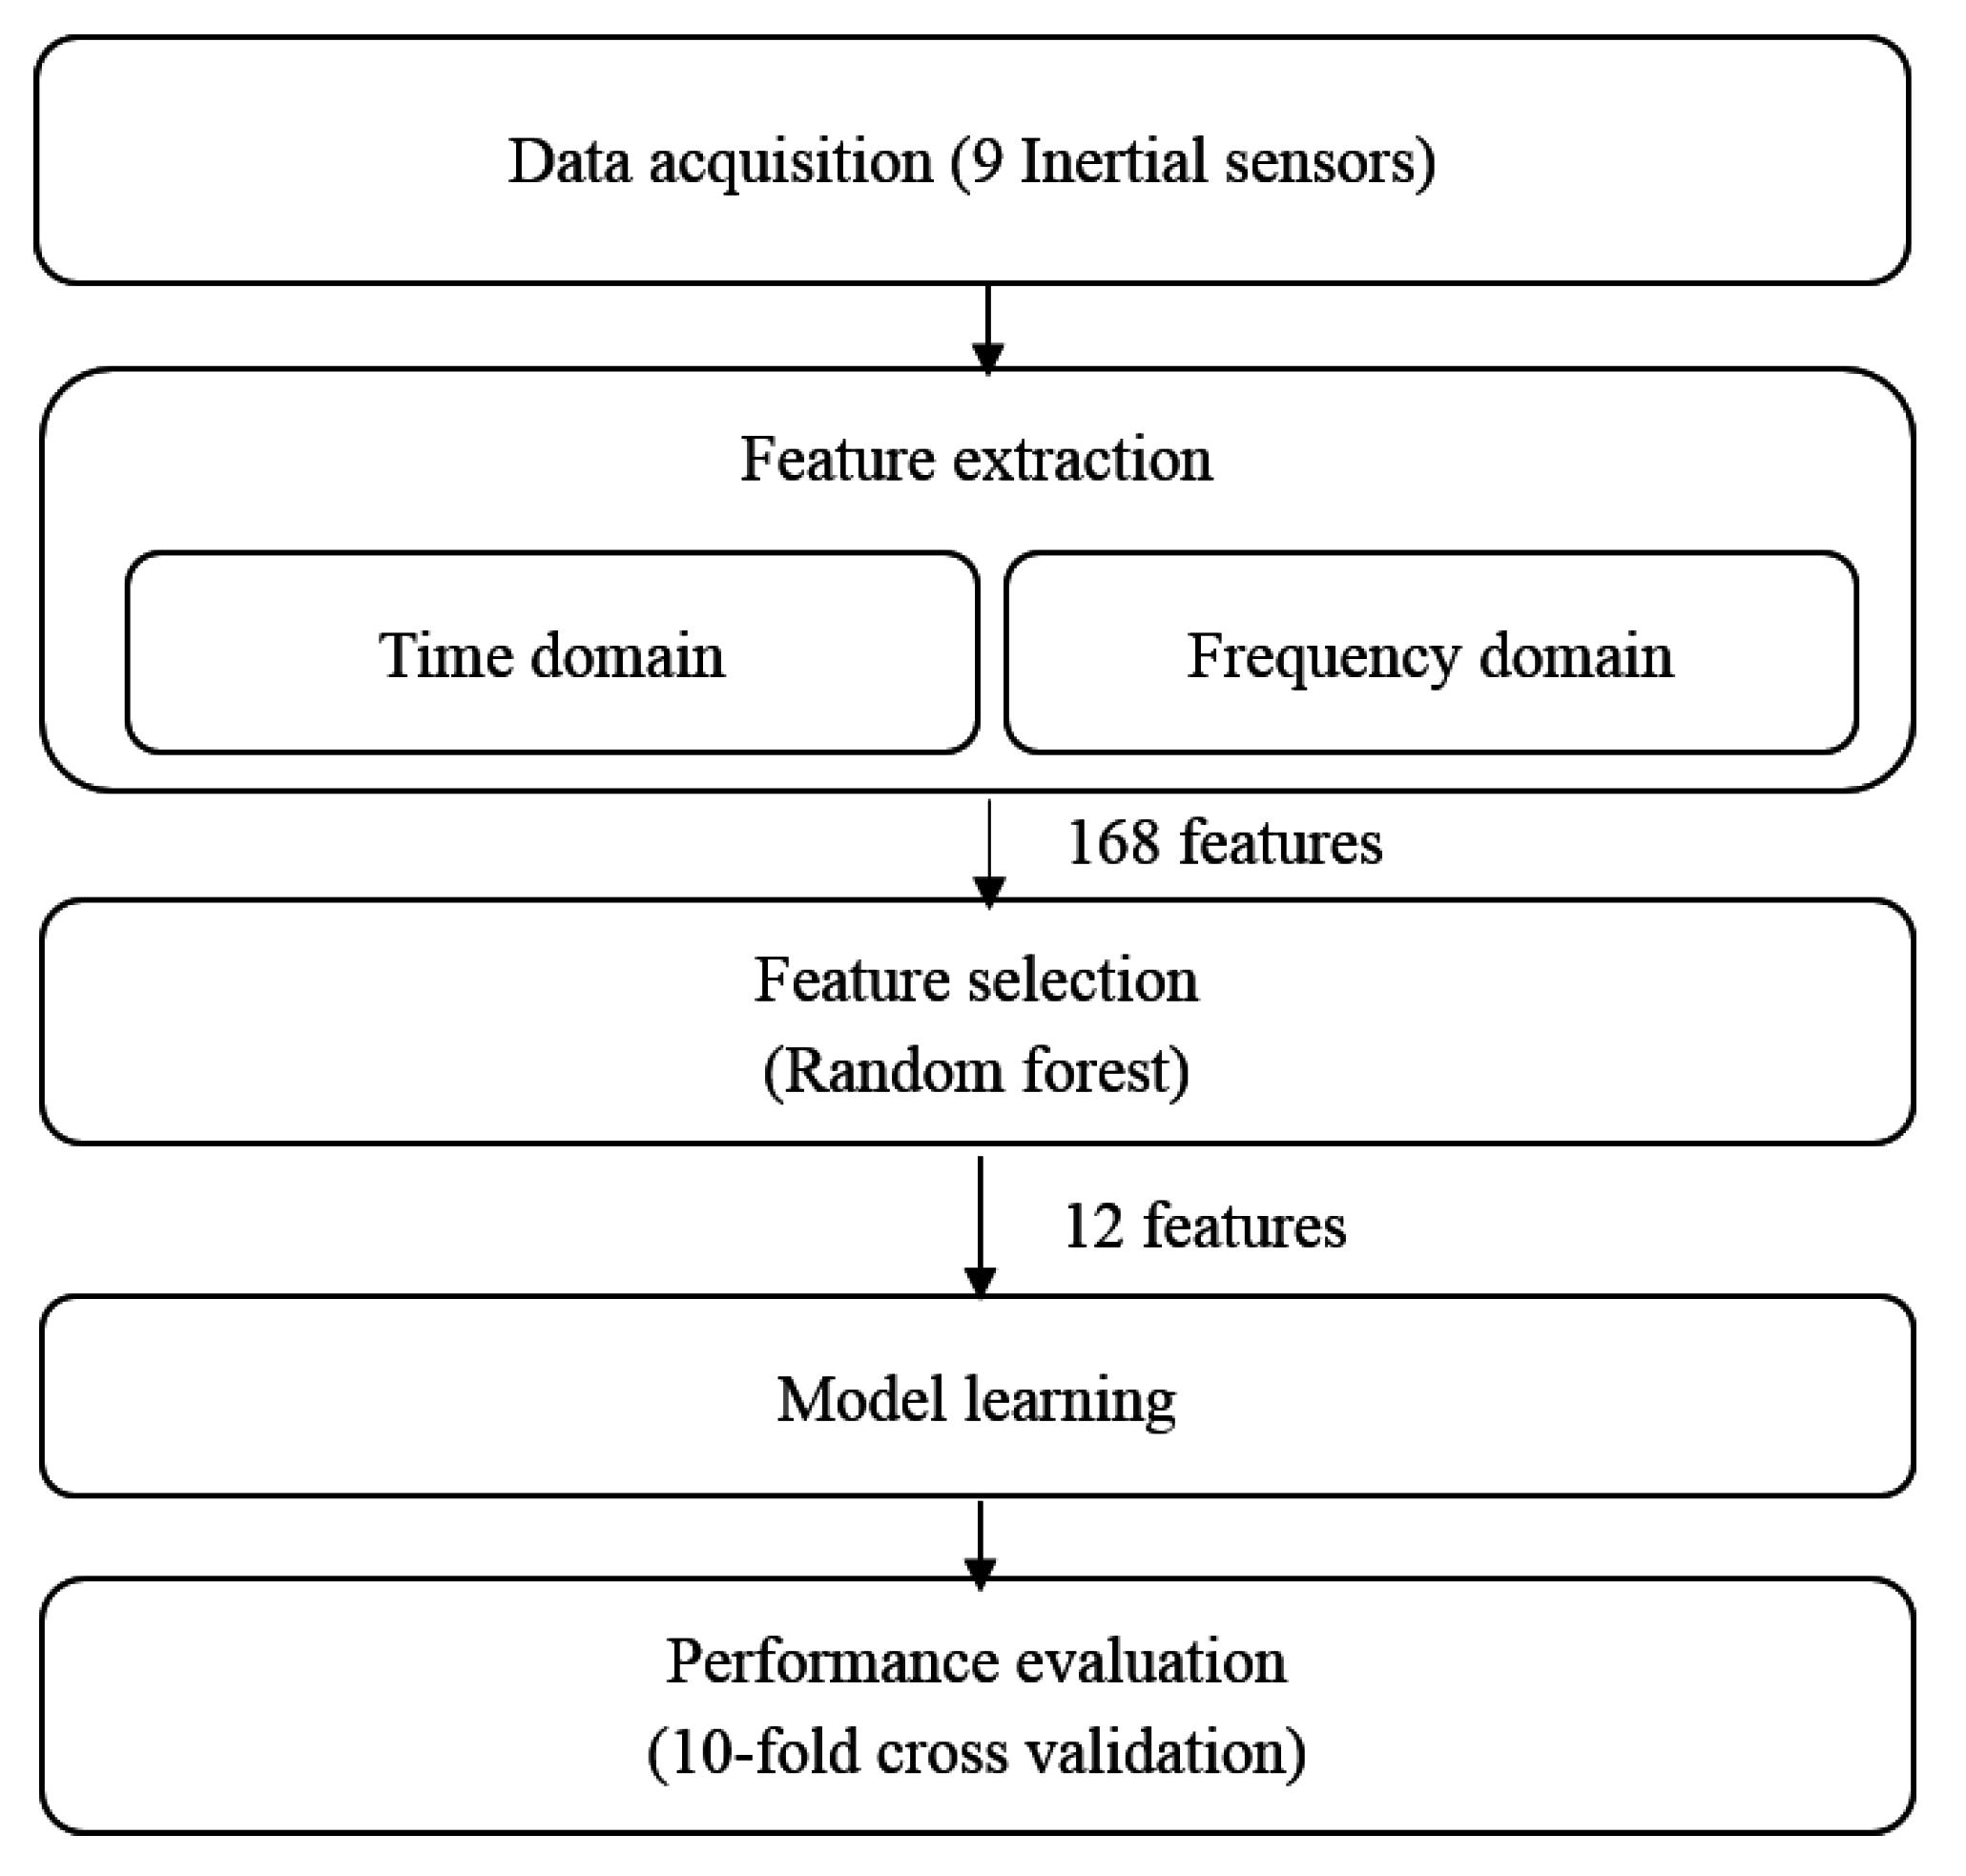
3. Methods
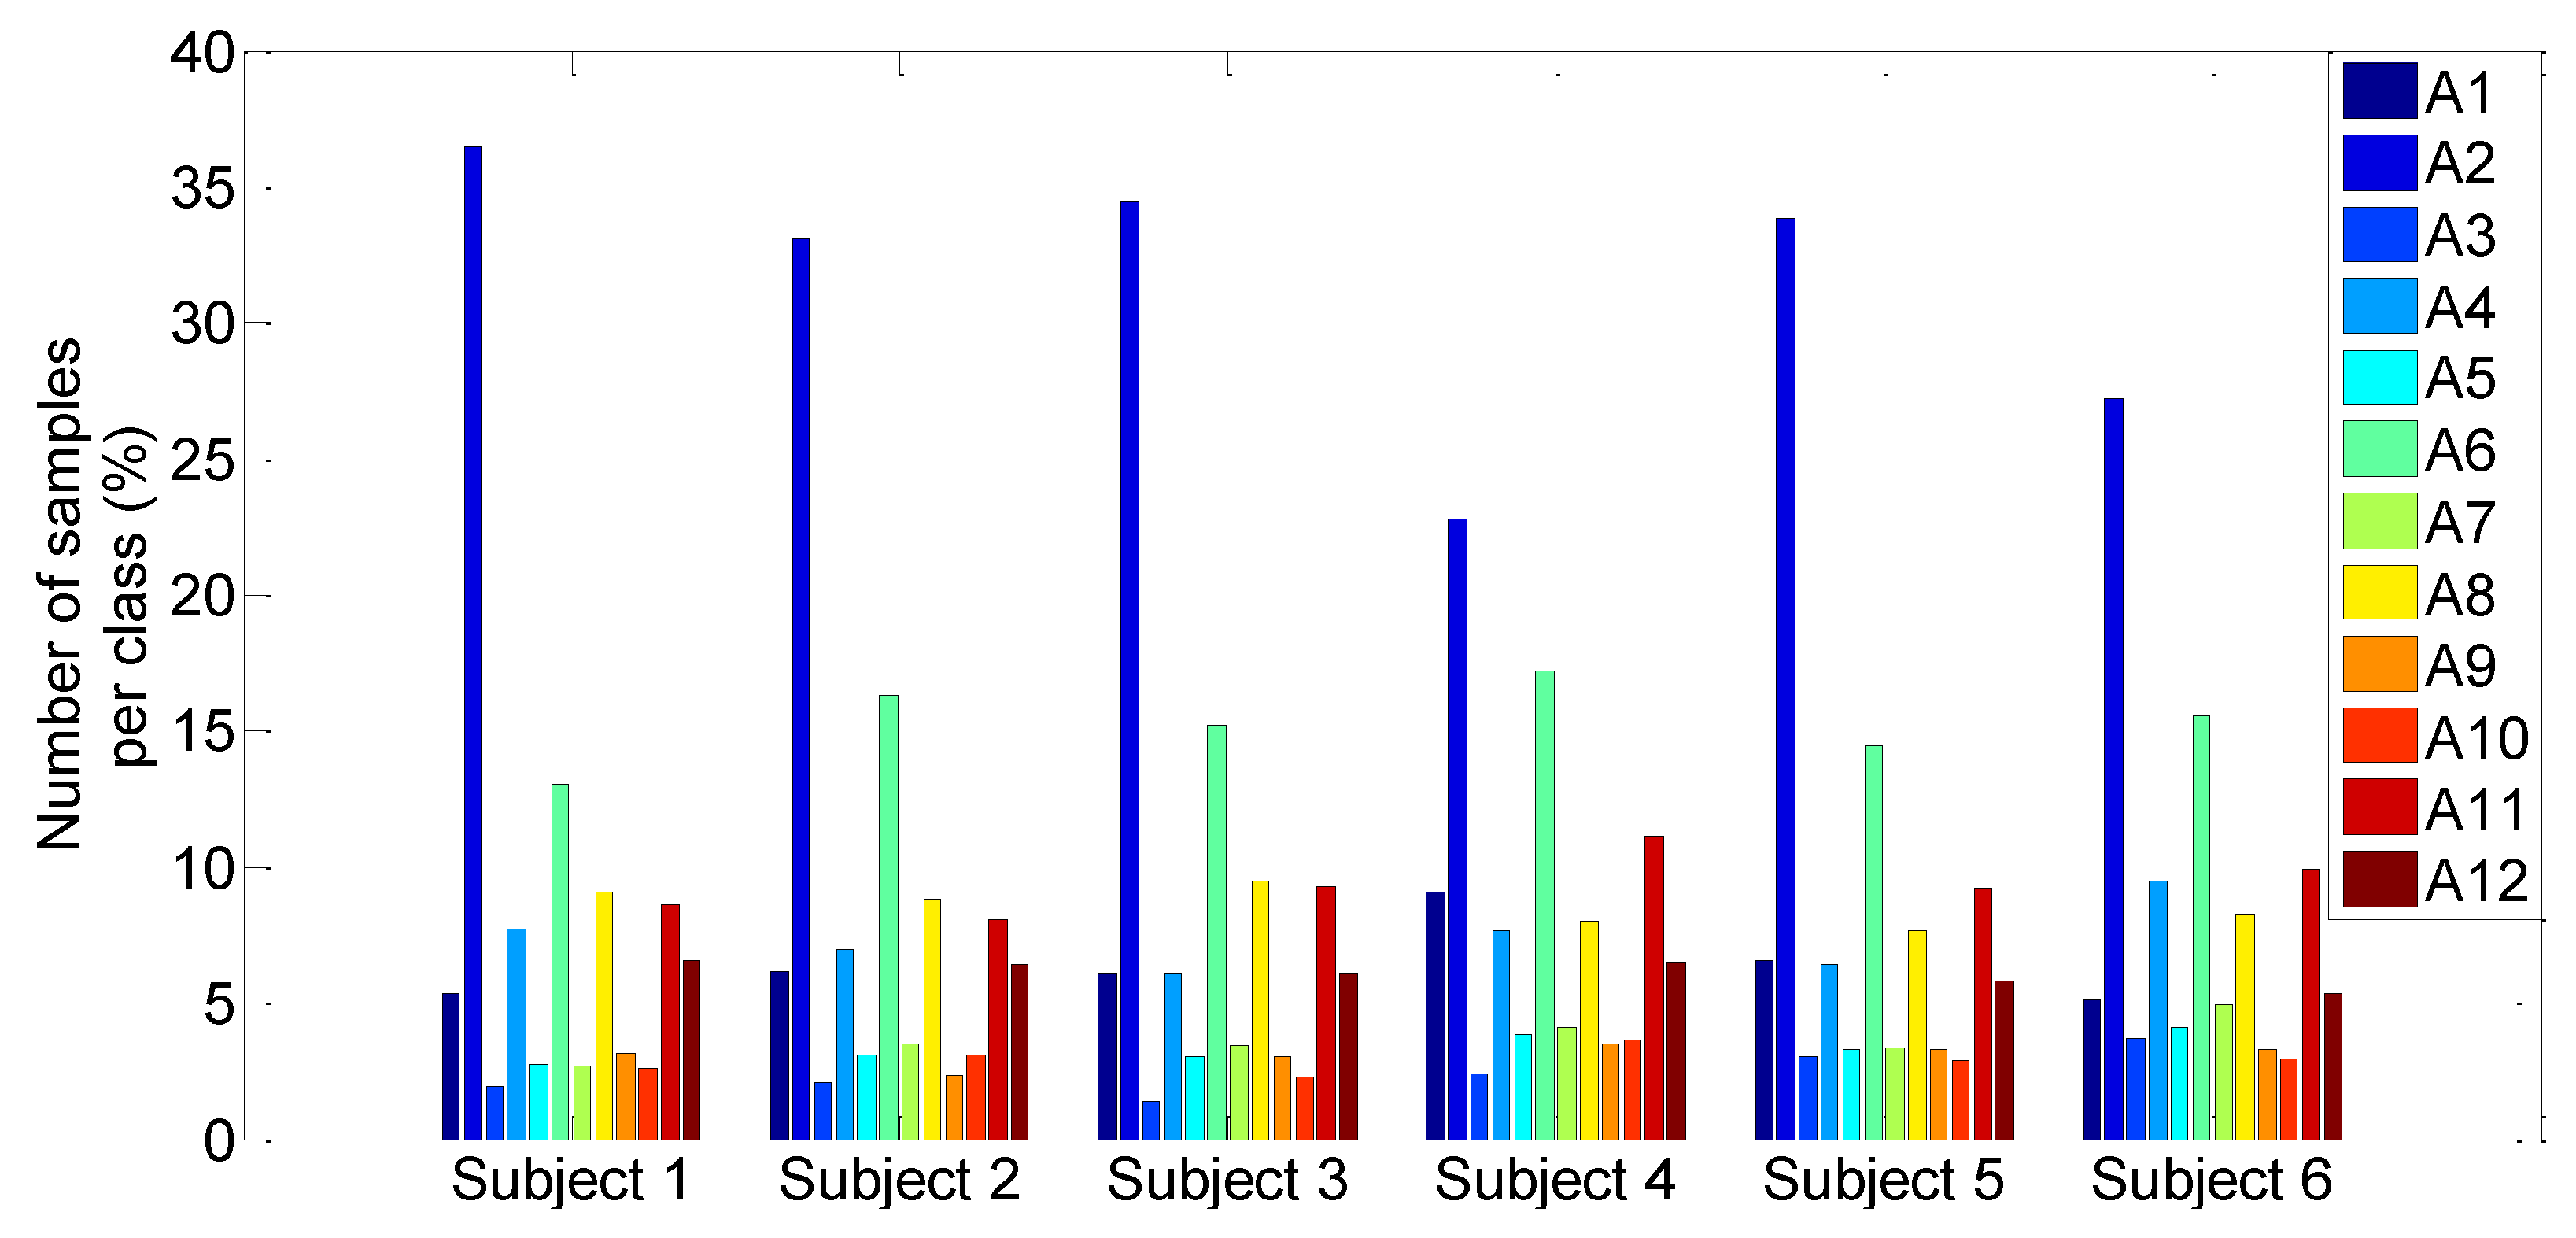
3.1. Data Acquisition

| Activity Reference | Description of Activity |
|---|---|
| A1 | Stair descent |
| A2 | Standing |
| A3 | Sitting down |
| A4 | Sitting |
| A5 | From sitting to sitting on the ground |
| A6 | Sitting on the ground |
| A7 | Lying down |
| A8 | Lying |
| A9 | From lying to sitting on the ground |
| A10 | Standing up |
| A11 | Walking |
| A12 | Stair ascent |

- Raw data
- Feature set extracted/selected from raw data.
3.2. Classifiers
3.2.1. Supervised Machine Learning Techniques
- In this study, the LIBSVM toolbox [95] was used to implement a nonlinear SVM model with a radial basis function kernel. The hyper-parameters C and Ɣ are estimated using a grid search method. The optimal values are C = 2 and Ɣ = −5.
- In the case of the RFs algorithm, the only parameter to tune is the number of trees, which is adjusted by varying the number of trees from to 1 to 100 and determining the one providing the best accuracy rate. The best number of trees is 20.
- For the SLGMMs, a mixture of 12 diagonal Gaussians is used. The proportions, the mean vectors and the covariance matrix of the Gaussian components are estimated during the training phase using an appropriate EM algorithm.
- In the case of K-NN method, as the only parameter to tune is K, varying K from 1 to 20 leads to an optimal value of K=1 for the best accuracy.
3.2.2. Unsupervised Machine Learning Techniques
- In this study, HMM with GMM emission probabilities were developed using the HMM toolbox [81]. However, two hyper-parameters were tuned: the number of states and the number of mixtures. First, as the dataset consist of twelve activities, the number of states was set to 12 with ergodic topology. Then, number of mixtures was varying from 1 to 4. Based on the best accuracy rate, the states were modeled using a mixture of 2 diagonal Gaussians.
- In the case of the K-means algorithm, the only parameter to estimate is the number of clusters that corresponds to the number of activities (k=12).
- In the case of the GMM algorithm, as in the case of the K-means algorithm, the only parameter to estimate is the number of mixture, which corresponds to the number of activities. A mixture of 12 diagonal Gaussians was used.
3.3. Evaluation
4. Experimental Results
4.1. Case 1: Raw Data
| Accuracy ± std | F-measure | Recall | Precision | Specificity | |
|---|---|---|---|---|---|
| k-NN (%) | 96.53 ± 0.20 | 94.60 | 94.57 | 94.62 | 99.67 |
| RF (%) | 94.89 ± 0.57 | 82.87 | 82.28 | 83.46 | 99.43 |
| SVM (%) | 94.22 ± 0.28 | 90.66 | 90.98 | 90.33 | 99.56 |
| SLGMM (%) | 84.54 ± 0.30 | 69.94 | 69.99 | 69.88 | 98.39 |
| Accuracy ± std | F-measure | Recall | Precision | Specificity | |
|---|---|---|---|---|---|
| HMM (%) | 80.00 ± 2.10 | 67.67 | 65.02 | 66.15 | 97.68 |
| K-means (%) | 68.42 ± 5.05 | 49.89 | 48.67 | 48.55 | 93.21 |
| GMM (%) | 73.60 ± 2.32 | 57.68 | 57.54 | 58.82 | 96.45 |
| Obtained | Classes | ||||||||||||
|---|---|---|---|---|---|---|---|---|---|---|---|---|---|
| A1 | A2 | A3 | A4 | A5 | A6 | A7 | A8 | A9 | A10 | A11 | A12 | ||
| A1 | 88.98 | 0.41 | 0.04 | 0 | 0.04 | 0 | 0 | 0 | 0 | 0.78 | 4.34 | 5.41 | |
| A2 | 0.40 | 98.52 | 0.08 | 0 | 0 | 0 | 0 | 0 | 0 | 0.21 | 0.56 | 0.23 | |
| A3 | 0.21 | 0.64 | 95.73 | 0.53 | 0.64 | 0 | 0 | 0 | 0 | 0.96 | 0.85 | 0.43 | |
| A4 | 0 | 0 | 0.77 | 98.92 | 0.31 | 0 | 0 | 0 | 0 | 0 | 0 | 0 | |
| True | A5 | 0.08 | 0 | 0.55 | 0.16 | 97.98 | 0.47 | 0.08 | 0 | 0.16 | 0.55 | 0 | 0 |
| Classes | A6 | 0 | 0 | 0 | 0 | 0.22 | 99.41 | 0.03 | 0 | 0.25 | 0.08 | 0 | 0 |
| A7 | 0 | 0 | 0 | 0 | 0.22 | 0.15 | 95.71 | 1.53 | 2.33 | 0.07 | 0 | 0 | |
| A8 | 0 | 0 | 0 | 0 | 0 | 0 | 1.58 | 97.62 | 0.80 | 0 | 0 | 0 | |
| A9 | 0 | 0 | 0 | 0 | 0.25 | 0.34 | 3.96 | 0.67 | 94.44 | 0.34 | 0 | 0 | |
| A10 | 1.58 | 0.46 | 0.19 | 0 | 0.65 | 0.28 | 0 | 0 | 0.19 | 94.07 | 0.93 | 1.67 | |
| A11 | 4.07 | 0.41 | 0.03 | 0 | 0 | 0 | 0 | 0 | 0 | 0.55 | 92.57 | 2.37 | |
| A12 | 5.05 | 0.43 | 0 | 0 | 0 | 0 | 0 | 0 | 0 | 1.03 | 3.08 | 90.42 |
| Obtained | Classes | ||||||||||||
|---|---|---|---|---|---|---|---|---|---|---|---|---|---|
| A1 | A2 | A3 | A4 | A5 | A6 | A7 | A8 | A9 | A10 | A11 | A12 | ||
| A1 | 55.33 | 1.70 | 1.08 | 0 | 0.62 | 0 | 0 | 0 | 0 | 3.19 | 23.52 | 14.57 | |
| A2 | 2.83 | 86.22 | 0.47 | 0 | 0 | 0 | 0 | 0 | 0 | 1.50 | 6.97 | 2.01 | |
| A3 | 0.12 | 0 | 39.86 | 32.82 | 12.53 | 0 | 0 | 0 | 0 | 10.62 | 0.24 | 3.82 | |
| A4 | 0.10 | 0 | 9.58 | 87.21 | 3.11 | 0 | 0 | 0 | 0 | 0 | 0 | 0 | |
| True | A5 | 0.67 | 0 | 7.20 | 0.29 | 73.61 | 0.10 | 1.06 | 0 | 1.44 | 15.55 | 0 | 0.10 |
| Classes | A6 | 0 | 0 | 0 | 0 | 3.15 | 91.63 | 0.88 | 0 | 2.18 | 2.16 | 0 | 0 |
| A7 | 0 | 0 | 0 | 0 | 2.24 | 0.50 | 29.74 | 35.33 | 27.95 | 4.25 | 0 | 0 | |
| A8 | 0 | 0 | 0 | 0 | 0 | 0 | 13.14 | 81.38 | 5.48 | 0 | 0 | ||
| A9 | 0 | 0 | 0 | 0 | 2.13 | 0 | 37.03 | 16.70 | 33.75 | 10.39 | 0 | 0 | |
| A10 | 0 | 0 | 0 | 0 | 9.20 | 0 | 0 | 0 | 1.15 | 89.66 | 0 | 0 | |
| A11 | 19.59 | 1.38 | 2.53 | 0 | 0 | 0 | 0 | 0 | 0 | 2.38 | 56.95 | 17.17 | |
| A12 | 16.65 | 0 | 3.72 | 0 | 2.44 | 0 | 0 | 0 | 0 | 5.75 | 11.10 | 60.34 |
4.2. Case 2: Feature Set Extracted/Selected from Raw Data
- Eleven time-domain features are extracted, namely: mean, variance, median, interquartile rang, skewedness, kurtosis, root mean square, zero crossing, peak to peak, crest factor and rang.
- Six frequency-domain features are extracted, namely: DC component in FFT spectrum, energy spectrum, entropy spectrum, sum of the wavelet coefficients, squared sum of the wavelet coefficients and energy of the wavelet coefficients.

| Accuracy ± std | F-Measure | Recall | Precision | Specificity | |
|---|---|---|---|---|---|
| k-NN (%) | 99.25 ± 0.17 | 98.85 | 98.85 | 98.85 | 99.96 |
| RF (%) | 98.95 ± 0.09 | 98.27 | 98.24 | 98.25 | 99.90 |
| SVM (%) | 95.55 ± 0.30 | 93.02 | 93.15 | 92.90 | 99.92 |
| SLGMM (%) | 85.05 ± 0.57 | 73.44 | 74.44 | 73.61 | 99.88 |
| Accuracy ± std | F-Measure | Recall | Precision | Specificity | |
|---|---|---|---|---|---|
| HMM (%) | 83.89 ± 1.30 | 69.19 | 68.27 | 67.74 | 98.38 |
| K-means (%) | 72.95 ± 2.80 | 50.29 | 52.20 | 51.22 | 97.04 |
| GMM (%) | 75.60 ± 1.25 | 65.00 | 66.29 | 64.30 | 97.12 |
| Obtained | Classes | ||||||||||||
|---|---|---|---|---|---|---|---|---|---|---|---|---|---|
| A1 | A2 | A3 | A4 | A5 | A6 | A7 | A8 | A9 | A10 | A11 | A12 | ||
| A1 | 99.00 | 0.32 | 0 | 0 | 0 | 0 | 0 | 0 | 0 | 0.08 | 0.48 | 0.12 | |
| A2 | 0.06 | 99.75 | 0.04 | 0 | 0 | 0 | 0 | 0 | 0 | 0.03 | 0.07 | 0.04 | |
| A3 | 0 | 0.43 | 99.15 | 0.43 | 0 | 0 | 0 | 0 | 0 | 0 | 0 | 0 | |
| A4 | 0 | 0 | 0.11 | 99.79 | 0.11 | 0 | 0 | 0 | 0 | 0 | 0 | 0 | |
| True | A5 | 0 | 0 | 0 | 0.23 | 99.38 | 0.23 | 0 | 0 | 0.08 | 0.08 | 0 | 0 |
| Classes | A6 | 0 | 0 | 0 | 0 | 0.07 | 99.78 | 0.07 | 0.03 | 0.05 | 0 | 0 | |
| A7 | 0 | 0 | 0 | 0 | 0 | 0.21 | 99.65 | 0.14 | 0 | 0 | 0 | 0 | |
| A8 | 0 | 0 | 0 | 0 | 0 | 0.15 | 99.79 | 0.06 | 0 | 0 | |||
| A9 | 0 | 0 | 0 | 0 | 0.08 | 0.17 | 0.33 | 99.42 | 0 | 0 | 0 | ||
| A10 | 0.35 | 0.18 | 0 | 0 | 0.09 | 0.09 | 0 | 0 | 0 | 99.20 | 0.09 | ||
| A11 | 0.22 | 0.17 | 0 | 0 | 0 | 0 | 0 | 0 | 0 | 0 | 99.34 | 0.28 | |
| A12 | 0.08 | 0.17 | 0 | 0 | 0 | 0 | 0 | 0 | 0 | 0.04 | 0.25 | 99.45 |
| Obtained | Classes | ||||||||||||
|---|---|---|---|---|---|---|---|---|---|---|---|---|---|
| A1 | A2 | A3 | A4 | A5 | A6 | A7 | A8 | A9 | A10 | A11 | A12 | ||
| A1 | 57.74 | 0.06 | 0.43 | 0 | 0.31 | 0 | 0 | 0 | 0 | 4.07 | 20.17 | 17.21 | |
| A2 | 1.36 | 94.66 | 0.31 | 0 | 0 | 0 | 0 | 0 | 0 | 0.89 | 1.98 | 0.80 | |
| A3 | 3.82 | 0 | 55.30 | 5.69 | 15.42 | 0 | 0 | 0 | 0 | 1.64 | 4.91 | 13.24 | |
| A4 | 0 | 0 | 2.85 | 96.31 | 0.83 | 0 | 0 | 0 | 0 | 0 | 0 | 0 | |
| True | A5 | 2.05 | 0 | 1.80 | 0.66 | 71.62 | 4.35 | 2.21 | 0 | 5.50 | 11.48 | 0 | 0.33 |
| Classes | A6 | 0 | 0 | 0 | 0 | 1.39 | 97.09 | 0.30 | 0 | 0.94 | 0.28 | 0 | 0 |
| A7 | 0 | 0 | 0 | 0 | 1.54 | 0 | 59.91 | 4.25 | 32.30 | 1.99 | 0 | 0 | |
| A8 | 0 | 0 | 0 | 0 | 0 | 0 | 3.30 | 94.69 | 2.01 | 0 | 0 | ||
| A9 | 0 | 0 | 0 | 0 | 4.02 | 1.75 | 32.68 | 0.10 | 50.41 | 11.03 | 0 | 0 | |
| A10 | 13.56 | 0 | 1.51 | 0 | 6.44 | 0 | 1.92 | 0 | 2.19 | 60.68 | 7.12 | 6.58 | |
| A11 | 19.87 | 4.45 | 1.50 | 0 | 0 | 0 | 0 | 0 | 0 | 3.45 | 57.02 | 13.73 | |
| A12 | 16.37 | 0.17 | 0 | 0 | 0.34 | 0 | 0 | 0 | 0 | 1.90 | 17.26 | 63.97 |
5. Conclusions and Future Work
Conflicts of Interest
References
- Chan, M.; Estève, D.; Fourniols, J.-Y.; Escriba, C.; Campo, E. Smart wearable systems: Current status and future challenges. Artif. Intel. Med. 2012, 56, 137–156. [Google Scholar] [CrossRef] [PubMed]
- Teng, X.-F.; Zhang, Y.-T.; Poon, C.C.; Bonato, P. Wearable medical systems for p-health. IEEE Rev. Biomed. Eng. 2008, 1, 62–74. [Google Scholar] [CrossRef] [PubMed]
- Preece, S.J.; Goulermas, J.Y.; Kenney, L.P.; Howard, D.; Meijer, K.; Crompton, R. Activity identification using body-mounted sensors—A review of classification techniques. Physiol. Meas. 2009, 30. [Google Scholar] [CrossRef] [PubMed]
- Patel, S.; Park, H.; Bonato, P.; Chan, L.; Rodgers, M. A review of wearable sensors and systems with application in rehabilitation. J. Neuroeng. Rehabil. 2012, 9. [Google Scholar] [CrossRef] [PubMed]
- Altun, K.; Barshan, B.; Tunçel, O. Comparative study on classifying human activities with miniature inertial and magnetic sensors. Pattern Recognit. 2010, 43, 3605–3620. [Google Scholar] [CrossRef] [Green Version]
- Gill, T.; Keller, J.M.; Anderson, D.T.; Luke, R. A system for change detection and human recognition in voxel space using the Microsoft Kinect sensor. In Proceedings of the Applied Imagery Pattern Recognition Workshop (AIPR), Washington, DC, USA, 11–13 October 2011.
- Chamroukhi, F.; Mohammed, S.; Trabelsi, D.; Oukhellou, L.; Amirat, Y. Joint segmentation of multivariate time series with hidden process regression for human activity recognition. Neurocomputing 2013, 120, 633–644. [Google Scholar] [CrossRef]
- Gao, L.; Bourke, A.; Nelson, J. Evaluation of accelerometer based multi-sensor versus single-sensor activity recognition systems. Med. Eng. Phys. 2014, 36, 779–785. [Google Scholar] [CrossRef] [PubMed]
- Chernbumroong, S.; Cang, S.; Atkins, A.; Yu, H. Elderly activities recognition and classification for applications in assisted living. Exp. Syst. Appl. 2013, 40, 1662–1674. [Google Scholar] [CrossRef]
- Altun, K.; Barshan, B. Human Activity Recognition Using Inertial/Magnetic Sensor Units. In Human Behavior Understanding; Springer: Berlin, Germany, 2010; pp. 38–51. [Google Scholar]
- McAdams, E.T.; Gehin, C.; Noury, N.; Ramon, C.; Nocua, R.; Massot, B.; Oliveira, A.; Dittmar, A.; Nugent, C.D.; McLaughlin, J. Biomedical Sensors for Ambient Assisted Living. In Advances in Biomedical Sensing, Measurements, Instrumentation and Systems; Springer: Berlin, Germany, 2010; pp. 240–262. [Google Scholar]
- Cleland, I.; Kikhia, B.; Nugent, C.; Boytsov, A.; Hallberg, J.; Synnes, K.; McClean, S.; Finlay, D. Optimal Placement of Accelerometers for the Detection of Everyday Activities. Sensors 2013, 13, 9183–9200. [Google Scholar] [CrossRef] [PubMed]
- Najafi, B.; Aminian, K.; Paraschiv-Ionescu, A.; Loew, F.; Bula, C.J.; Robert, P. Ambulatory system for human motion analysis using a kinematic sensor: Monitoring of daily physical activity in the elderly. IEEE Trans. Biomed. Eng. 2003, 50, 711–723. [Google Scholar] [CrossRef] [PubMed]
- Bonomi, A.G.; Goris, A.; Yin, B.; Westerterp, K.R. Detection of type, duration, and intensity of physical activity using an accelerometer. Med. Sci. Sports Exerc. 2009, 41, 1770–1777. [Google Scholar] [CrossRef] [PubMed]
- Karantonis, D.M.; Narayanan, M.R.; Mathie, M.; Lovell, N.H.; Celler, B.G. Implementation of a real-time human movement classifier using a triaxial accelerometer for ambulatory monitoring. IEEE Trans. Inf. Technol. Biomed. 2006, 10, 156–167. [Google Scholar] [CrossRef] [PubMed]
- Yang, C.-C.; Hsu, Y.-L. A review of accelerometry-based wearable motion detectors for physical activity monitoring. Sensors 2010, 10, 7772–7788. [Google Scholar] [CrossRef] [PubMed]
- Parkka, J.; Ermes, M.; Korpipaa, P.; Mantyjarvi, J.; Peltola, J.; Korhonen, I. Activity classification using realistic data from wearable sensors. IEEE Trans. Inf. Technol. Biomed. 2006, 10, 119–128. [Google Scholar] [CrossRef] [PubMed]
- Mathie, M.; Celler, B.G.; Lovell, N.H.; Coster, A. Classification of basic daily movements using a triaxial accelerometer. Med. Biol. Eng. Comput. 2004, 42, 679–687. [Google Scholar] [CrossRef] [PubMed]
- Yeoh, W.-S.; Pek, I.; Yong, Y.-H.; Chen, X.; Waluyo, A.B. Ambulatory monitoring of human posture and walking speed using wearable accelerometer sensors. In Proceedings of the Engineering in Medicine and Biology Society, 2008 EMBS 30th Annual International Conference of the IEEE, Vancouver, BC, USA, 20–25 August 2008; pp. 5184–5187.
- Yang, J.-Y.; Wang, J.-S.; Chen, Y.-P. Using acceleration measurements for activity recognition: An effective learning algorithm for constructing neural classifiers. Pattern Recog. Lett. 2008, 29, 2213–2220. [Google Scholar] [CrossRef]
- Pirttikangas, S.; Fujinami, K.; Nakajima, T. Feature Selection and Activity Recognition from Wearable Sensors. In Ubiquitous Computing Systems; Springer: Berlin, Germany, 2006; pp. 516–527. [Google Scholar]
- Olguın, D.O.; Pentland, A.S. Human activity recognition: Accuracy across common locations for wearable sensors. In Proceedings of 2006 10th IEEE International Symposium on Wearable Computers, Montreux, Switzerland, 11–14 October 2006.
- Lyons, G.; Culhane, K.; Hilton, D.; Grace, P.; Lyons, D. A description of an accelerometer-based mobility monitoring technique. Med. Eng. Phys. 2005, 27, 497–504. [Google Scholar] [CrossRef] [PubMed]
- Salarian, A.; Russmann, H.; Vingerhoets, F.J.; Burkhard, P.R.; Aminian, K. Ambulatory monitoring of physical activities in patients with Parkinson's disease. IEEE Trans. Biomed. Eng. 2007, 54, 2296–2299. [Google Scholar] [CrossRef] [PubMed]
- Gjoreski, H.; Lustrek, M.; Gams, M. Accelerometer placement for posture recognition and fall detection. In Proceedings of the 2011 7th International Conference on Intelligent Environments (IE), Nottingham, UK, 25–28 July 2011; pp. 47–54.
- Bayat, A.; Pomplun, M.; Tran, D.A. A Study on Human Activity Recognition Using Accelerometer Data from Smartphones. Proced. Comput. Sci. 2014, 34, 450–457. [Google Scholar] [CrossRef]
- Moncada-Torres, A.; Leuenberger, K.; Gonzenbach, R.; Luft, A.; Gassert, R. Activity classification based on inertial and barometric pressure sensors at different anatomical locations. Physiol. Meas. 2014, 35. [Google Scholar] [CrossRef] [PubMed]
- Gupta, P.; Dallas, T. Feature Selection and Activity Recognition System using a Single Tri-axial Accelerometer. IEEE Trans. Biomed. Eng. 2014, 61, 1780–1786. [Google Scholar] [CrossRef] [PubMed]
- Garcia-Ceja, E.; Brena, R.F.; Carrasco-Jimenez, J.C.; Garrido, L. Long-Term Activity Recognition from Wristwatch Accelerometer Data. Sensors 2014, 14, 22500–22524. [Google Scholar] [CrossRef] [PubMed]
- Massé, F.; Gonzenbach, R.R.; Arami, A.; Paraschiv-Ionescu, A.; Luft, A.R.; Aminian, K. Improving activity recognition using a wearable barometric pressure sensor in mobility-impaired stroke patients. J. Neuroeng. Rehabil. 2015, 12. [Google Scholar] [CrossRef] [PubMed]
- Raj, A.; Subramanya, A.; Fox, D.; Bilmes, J. Rao-Blackwellized Particle Filters for Recognizing Activities and Spatial Context from Wearable Sensors. In Experimental Robotics; Springer: Berlin, Germany, 2008; pp. 211–221. [Google Scholar]
- Morillo, D.S.; Ojeda, J.L.R.; Foix, L.F.C.; Jiménez, A.L. An accelerometer-based device for sleep apnea screening. IEEE Trans. Inf. Technol. Biomed. 2010, 14, 491–499. [Google Scholar] [CrossRef] [PubMed]
- Kuo, Y.-L.; Culhane, K.M.; Thomason, P.; Tirosh, O.; Baker, R. Measuring distance walked and step count in children with cerebral palsy: An evaluation of two portable activity monitors. Gait posture 2009, 29, 304–310. [Google Scholar] [CrossRef] [PubMed]
- Menz, H.B.; Lord, S.R.; Fitzpatrick, R.C. Age-related differences in walking stability. Age Ageing 2003, 32, 137–142. [Google Scholar] [CrossRef] [PubMed]
- Park, J.-H.; Kim, H.J.; Kang, S.-J. Validation of the AMP331 monitor for assessing energy expenditure of free-living physical activity. Res. Quart. Exerc. Sport 2006, 77, A40. [Google Scholar]
- Ronao, C.A.; Cho, S.-B. Human activity recognition using smartphone sensors with two-stage continuous hidden Markov models. In Proceedings of the 2014 10th International Conference on Natural Computation (ICNC), Xiamen, China, 19–21 August 2014; pp. 681–686.
- Peetoom, K.K.; Lexis, M.A.; Joore, M.; Dirksen, C.D.; De Witte, L.P. Literature review on monitoring technologies and their outcomes in independently living elderly people. Disabil. Rehabil. Assist. Technol. 2014, 10, 271–294. [Google Scholar] [CrossRef] [PubMed]
- Farringdon, J.; Moore, A.J.; Tilbury, N.; Church, J.; Biemond, P.D. Wearable sensor badge and sensor jacket for context awareness. In Proceedings of the Third International Symposium on Wearable Computers, 1999 Digest of Papers, San Francisco, CA, USA, 18–19 October 1999; pp. 107–113.
- Bouten, C.V.; Koekkoek, K.T.; Verduin, M.; Kodde, R.; Janssen, J.D. A triaxial accelerometer and portable data processing unit for the assessment of daily physical activity. IEEE Trans. Biomed. Eng. 1997, 44, 136–147. [Google Scholar] [CrossRef] [PubMed]
- Figo, D.; Diniz, P.C.; Ferreira, D.R.; Cardoso, J.M. Preprocessing techniques for context recognition from accelerometer data. Pers. Ubiquitous Comput. 2010, 14, 645–662. [Google Scholar] [CrossRef]
- Oppenheim, A.V.; Schafer, R.W.; Buck, J.R. Discrete-Time Signal Processing; Prentice-hall: Upper Saddle River, NJ, USA, 1989. [Google Scholar]
- Nham, B.; Siangliulue, K.; Yeung, S. Predicting Mode of Transport from Iphone Accelerometer Data; Technical Report; Standford University: Stanford, CA, USA, 2008. [Google Scholar]
- Ho, J.J.C. Interruptions: Using Activity Transitions to Trigger Proactive Messages. Master’s Thesis, Massachusetts Institute of Technology, Cambridge, MA, USA, August 2004. [Google Scholar]
- Bao, L.; Intille, S.S. Activity Recognition from User-Annotated Acceleration Data. In Pervasive Computing; Springer: Berlin, Germany, 2004; pp. 1–17. [Google Scholar]
- Preece, S.J.; Goulermas, J.Y.; Kenney, L.P.; Howard, D. A comparison of feature extraction methods for the classification of dynamic activities from accelerometer data. IEEE Trans. Biomed. Eng. 2009, 56, 871–879. [Google Scholar] [CrossRef] [PubMed]
- Guyon, I.; Elisseeff, A. An introduction to variable and feature selection. J. Mach. Learn. Res. 2003, 3, 1157–1182. [Google Scholar]
- Liu, H.; Yu, L. Toward integrating feature selection algorithms for classification and clustering. IEEE Trans. Knowl. Data Eng. 2005, 17, 491–502. [Google Scholar]
- Kohavi, R.; John, G.H. Wrappers for feature subset selection. Artif. Intel. 1997, 97, 273–324. [Google Scholar] [CrossRef]
- Das, S. Filters, wrappers and a boosting-based hybrid for feature selection. In Proceedings of the Eighteenth International Conference on Machine Learning (ICML 2001), Williamstown, MA, USA, 28 June–1 July 2001; pp. 74–81.
- Zhang, M.; Sawchuk, A.A. A feature selection-based framework for human activity recognition using wearable multimodal sensors. In Proceedings of the 6th International Conference on Body Area Networks: ICST (Institute for Computer Sciences, Social-Informatics and Telecommunications Engineering), Beijing, China, 7–8 November 2011; pp. 92–98.
- Fish, B.; Khan, A.; Chehade, N.H.; Chien, C.; Pottie, G. Feature selection based on mutual information for human activity recognition. In Proceedings of the 2012 IEEE International Conference on Acoustics, Speech and Signal Processing (ICASSP), Kyoto, Japan, 25–30 March 2012; pp. 1729–1732.
- Chau, T. A review of analytical techniques for gait data. Part 1: Fuzzy, statistical and fractal methods. Gait Posture 2001, 13, 49–66. [Google Scholar] [CrossRef]
- Martínez, A.M.; Kak, A.C. Pca versus lda. IEEE Trans. Pattern Anal. Mach. Intel. 2001, 23, 228–233. [Google Scholar] [CrossRef]
- Duda, R.O.; Hart, P.E.; Stork, D.G. Pattern Classification; John Wiley & Sons: Malden, MA, USA, 1999. [Google Scholar]
- Krause, A.; Siewiorek, D.P.; Smailagic, A.; Farringdon, J. Unsupervised, dynamic identification of physiological and activity context in wearable computing. In Proceedings of the 2012 16th International Symposium on Wearable Computers: IEEE Computer Society, White Plains, NY, USA, 21–23 October 2003; p. 88.
- Huỳnh, T.; Schiele, B. Unsupervised Discovery of Structure in Activity Data Using Multiple Eigenspaces. In Location-and Context-Awareness; Springer: Berlin, Germany, 2006; pp. 151–167. [Google Scholar]
- Webb, A.R. Statistical Pattern Recognition; John Wiley & Sons: Malden, MA, USA, 2003. [Google Scholar]
- Theodoridis, S.; Pikrakis, A.; Koutroumbas, K.; Cavouras, D. Introduction to Pattern Recognition: A Matlab Approach; Academic Press: Waltham, NA, USA, 2010. [Google Scholar]
- Vapnik, V. The Nature of Statistical Learning Theory; Springer: Berlin, Germany, 2000. [Google Scholar]
- Rabiner, L. A tutorial on hidden Markov models and selected applications in speech recognition. Proc. IEEE 1989, 77, 257–286. [Google Scholar] [CrossRef]
- Trabelsi, D.; Mohammed, S.; Chamroukhi, F.; Oukhellou, L.; Amirat, Y. An unsupervised approach for automatic activity recognition based on hidden Markov model regression. IEEE Trans. Autom. Sci. Eng. 2013, 10, 829–835. [Google Scholar] [CrossRef]
- Foerster, F.; Smeja, M.; Fahrenberg, J. Detection of posture and motion by accelerometry: A validation study in ambulatory monitoring. Comput. Hum. Behav. 1999, 15, 571–583. [Google Scholar] [CrossRef]
- Foerster, F.; Fahrenberg, J. Motion pattern and posture: Correctly assessed by calibrated accelerometers. Behav. Res. Method. Instrum. Comput. 2000, 32, 450–457. [Google Scholar] [CrossRef]
- Zhang, T.; Wang, J.; Xu, L.; Liu, P. Using Wearable Sensor and NMF Algorithm to Realize Ambulatory Fall Detection. In Advances in Natural Computation; Springer: Berlin, Germany, 2006; pp. 488–491. [Google Scholar]
- Scholkopf, B.; Smola, A.J. Learning with Kernels: Support Vector Machines, Regularization, Optimization, and Beyond; MIT Press: Cambridge, MA, USA, 2001. [Google Scholar]
- Cover, T.M. Geometrical and statistical properties of systems of linear inequalities with applications in pattern recognition. IEEE Trans. Electron. Comput. 1965, EC-14, 326–334. [Google Scholar] [CrossRef]
- Huynh, T.; Schiele, B. Towards less supervision in activity recognition from wearable sensors. In Proceedings of the 2006 10th IEEE International Symposium on Wearable Computers, Montreux, Switzerland, 11–14 October 2006; pp. 3–10.
- Krause, A.; Ihmig, M.; Rankin, E.; Leong, D.; Gupta, S.; Siewiorek, D.; Smailagic, A.; Deisher, M.; Sengupta, U. Trading off prediction accuracy and power consumption for context-aware wearable computing. In Proceedings of the 2005 Ninth IEEE International Symposium on Wearable Computers, Osaka, Japan, 18–21 October 2005; pp. 20–26.
- Doukas, C.; Maglogiannis, I. Advanced patient or elder fall detection based on movement and sound data. In Proceedings of the 2008 Second International Conference on Pervasive Computing Technologies for Healthcare, PervasiveHealth, Tampere, Filand, 30 January–1 February 2008; pp. 103–107.
- Breiman, L.; Friedman, J.; Stone, C.J.; Olshen, R.A. Classification and Regression Trees; CRC press: Boca Raton, FL, USA, 1984. [Google Scholar]
- Bedogni, L.; Di Felice, M.; Bononi, L. By train or by car? Detecting the user's motion type through smartphone sensors data. In Proceedings of the 2012 IFIP Wireless Days (WD), Dublin, Ireland, 21–23 November 2012; pp. 1–6.
- Dempster, A.P.; Laird, N.M.; Rubin, D.B. Maximum likelihood from incomplete data via the EM algorithm. J. Royal Stat. Soc. Ser. B (Methodol.) 1977, 39, 1–38. [Google Scholar]
- Mannini, A.; Sabatini, A.M. Machine learning methods for classifying human physical activity from on-body accelerometers. Sensors 2010, 10, 1154–1175. [Google Scholar] [CrossRef] [PubMed]
- Ong, W.-H.; Koseki, T.; Palafox, L. An Unsupervised Approach for Human Activity Detection and Recognition. Int. J. Simul. Syst. Sci. Technol. 2013, 14. [Google Scholar] [CrossRef]
- Cottone, P.; Re, G.L.; Maida, G.; Morana, M. Motion sensors for activity recognition in an ambient-intelligence scenario. In Proceedings of the 2013 IEEE International Conference on Pervasive Computing and Communications Workshops (PERCOM Workshops), San Diego, CA, USA, 18–22 March 2013; pp. 646–651.
- Forney, G.D., Jr. The viterbi algorithm. IEEE Proc. 1973, 61, 268–278. [Google Scholar] [CrossRef]
- Lester, J.; Choudhury, T.; Kern, N.; Borriello, G.; Hannaford, B. A Hybrid Discriminative/ Generative Approach for Modeling Human Activities. In Proceedings of the IJCAI'05 19th international joint conference on Artificial intelligence, Edinburgh, UK, 30 July–5 August 2005; pp. 766–772.
- Laerhoven, K.V.; Gellersen, H.-W.; Malliaris, Y.G. Long term activity monitoring with a wearable sensor node. In Proceedings of the 2006 BSN 2006 International Workshop on Wearable and Implantable Body Sensor Networks, Cambridge, MA, USA, 3–5 April 2006.
- Lukowicz, P.; Ward, J.A.; Junker, H.; Stäger, M.; Tröster, G.; Atrash, A.; Starner, T. Recognizing Workshop Activity Using Body Worn Microphones and Accelerometers. In Pervasive Computing; Springer: Berlin, Germany, 2004; pp. 18–32. [Google Scholar]
- Ward, J.A.; Lukowicz, P.; Troster, G.; Starner, T.E. Activity recognition of assembly tasks using body-worn microphones and accelerometers. IEEE Trans. Pattern Anal. Mach. Intel. 2006, 28, 1553–1567. [Google Scholar] [CrossRef] [PubMed]
- Hidden markov model (hmm) toolbox for matlab. Available online: http://www ai mit edu/~murphyk/Software/HMM/hmm html (accessed on 9 December 2015).
- Boyle, J.; Karunanithi, M.; Wark, T.; Chan, W.; Colavitti, C. Quantifying functional mobility progress for chronic disease management. In Proceedings of the 2006 28th Annual International Conference of the Engineering in Medicine and Biology Society (EMBS'06), New York, NY, USA, 30 August–3 September 2006; pp. 5916–5919.
- Culhane, K.; Lyons, G.; Hilton, D.; Grace, P.; Lyons, D. Long-term mobility monitoring of older adults using accelerometers in a clinical environment. Clin. Rehabil. 2004, 18, 335–343. [Google Scholar] [CrossRef] [PubMed]
- Najafi, B.; Aminian, K.; Loew, F.; Blanc, Y.; Robert, P.A. Measurement of stand-sit and sit-stand transitions using a miniature gyroscope and its application in fall risk evaluation in the elderly. IEEE Trans. Biomed. Eng. 2002, 49, 843–851. [Google Scholar] [CrossRef] [PubMed]
- Bourke, A.; O’donovan, K.; Olaighin, G. The identification of vertical velocity profiles using an inertial sensor to investigate pre-impact detection of falls. Med. Eng. Phys. 2008, 30, 937–946. [Google Scholar] [CrossRef] [PubMed]
- Marin-Perianu, M.; Lombriser, C.; Amft, O.; Havinga, P.; Tröster, G. Distributed Activity Recognition with Fuzzy-Enabled Wireless Sensor Networks. In Distributed Computing in Sensor Systems; Springer: Berlin, Germany, 2008; pp. 296–313. [Google Scholar]
- McClelland, J.L.; Rumelhart, D.E.; Group, P.R. Parallel Distributed Processing: Explorations in the Microstructures of Cognition; MIT Press: Cambridge, MA, USA, 1986; Volume 2. [Google Scholar]
- Maurer, U.; Rowe, A.; Smailagic, A.; Siewiorek, D. Location and Activity Recognition Using eWatch: A Wearable Sensor Platform. In Ambient Intelligence in Everyday Life; Springer: Berlin, Germany, 2006; pp. 86–102. [Google Scholar]
- Ravi, N.; Dandekar, N.; Mysore, P.; Littman, M.L. Activity recognition from accelerometer data. In Proceedings of the IAAI'05 17th conference on Innovative applications of artificial intelligence, Pittsburgh, MA, USA, 9–13 July 2005; pp. 1541–1546.
- Fahrenberg, J.; Muller, W.; Foerster, F.; Smeja, M. A multi-channel investigation of physical activity. J. Psychophysiol. 1996, 10, 209–217. [Google Scholar]
- Lee, S.; Park, H.; Hong, S.; Lee, K.; Kim, Y. A study on the activity classification using a triaxial accelerometer. In Proceedings of the 25th Annual International Conference of the Engineering in Medicine and Biology Society, Cancun, Mexico, 17–21 September 2003; pp. 2941–2943.
- Ermes, M.; Parkka, J.; Mantyjarvi, J.; Korhonen, I. Detection of daily activities and sports with wearable sensors in controlled and uncontrolled conditions. IEEE Trans. Inf. Technol. Biomed. 2008, 12, 20–26. [Google Scholar] [CrossRef] [PubMed]
- Liu, K.; Liu, T.; Shibata, K.; Inoue, Y. Ambulatory measurement and analysis of the lower limb 3D posture using wearable sensor system. In Proceedings of the 2009 ICMA International Conference on Mechatronics and Automation, Changchun, China, 9–12 August 2009; pp. 3065–3069.
- Favre, J.; Luthi, F.; Jolles, B.; Siegrist, O.; Najafi, B.; Aminian, K. A new ambulatory system for comparative evaluation of the three-dimensional knee kinematics, applied to anterior cruciate ligament injuries. Knee Surg. Sports Traumatol. Arthrosc. 2006, 14, 592–604. [Google Scholar] [CrossRef] [PubMed]
- Chang, C.-C.; Lin, C.-J. LIBSVM: A library for support vector machines. ACM Trans. Intel. Syst. Technol. (TIST) 2011, 2. [Google Scholar] [CrossRef]
© 2015 by the authors; licensee MDPI, Basel, Switzerland. This article is an open access article distributed under the terms and conditions of the Creative Commons by Attribution (CC-BY) license (http://creativecommons.org/licenses/by/4.0/).
Share and Cite
Attal, F.; Mohammed, S.; Dedabrishvili, M.; Chamroukhi, F.; Oukhellou, L.; Amirat, Y. Physical Human Activity Recognition Using Wearable Sensors. Sensors 2015, 15, 31314-31338. https://doi.org/10.3390/s151229858
Attal F, Mohammed S, Dedabrishvili M, Chamroukhi F, Oukhellou L, Amirat Y. Physical Human Activity Recognition Using Wearable Sensors. Sensors. 2015; 15(12):31314-31338. https://doi.org/10.3390/s151229858
Chicago/Turabian StyleAttal, Ferhat, Samer Mohammed, Mariam Dedabrishvili, Faicel Chamroukhi, Latifa Oukhellou, and Yacine Amirat. 2015. "Physical Human Activity Recognition Using Wearable Sensors" Sensors 15, no. 12: 31314-31338. https://doi.org/10.3390/s151229858