
Tracking Systems for Virtual Rehabilitation: Objective Performance vs. Subjective Experience. A Practical Scenario

Abstract
:1. Introduction

| Characteristic | NaturalPoint® OptiTrackTM V100:R2 | Polhemus™ G4™ | Microsoft® Kinect™ |
|---|---|---|---|
| Measurements (cm) | Camera: 7.5 × 4.5 × 3.7 Marker: 4 (diameter) | Source: 10.2 × 10.2 × 10.2 Hub: 10.6 × 1.9 × 6.6 Sensor: 2.29 × 2.82 × 1.52 | Camera: 7.5 × 4.5 × 3.7 (5.8 × 28.2 × 6.8 with the support base) |
| Weight (g) | Camera: 119.1 Marker: 8 | Source: 725.7 Hub: 114.0 Sensor: 43.0 | Camera: 590 |
| Frequency (Hz) | 100 | 120 | 30 (with 1 skeleton) |
| Latency (ms) | 10 | 10 (in optimum conditions) | 150–500 [12] |
| Resolution * | RGB: 640 × 480 (at 100 Hz) with 8 bits | - | RGB: 640 × 480 (at 30 Hz) with 8 bits Depth: 640 × 480 (at 30 Hz) with 11 bits |
| Field of view (°) * | Horizontal: 46 Vertical: 35 (Default lens, 4.5mm F#1.6) | - | Horizontal: 57 Vertical: 43 |
| Wavelength (nm) * | 850 | - | 850 |
| Connections | Wireless | Sensor-Hub: Wired Hub-Source: Wireless (proprietary RF link at 2.4 GHz with frequency hopping architecture) | Wireless |
| Power supply | Camera: 5 V, 490 mA Marker: Passive | Source: 5 V, 1 A Hub: 5 V, 500 mA (rechargeable battery) Sensor: Passive | Camera: 12 V, 1.1 A |
| Cost ($) | 1198 (including 2 cameras) | 5250 (including 1 sensor) | 249 |
2. Experimental Section
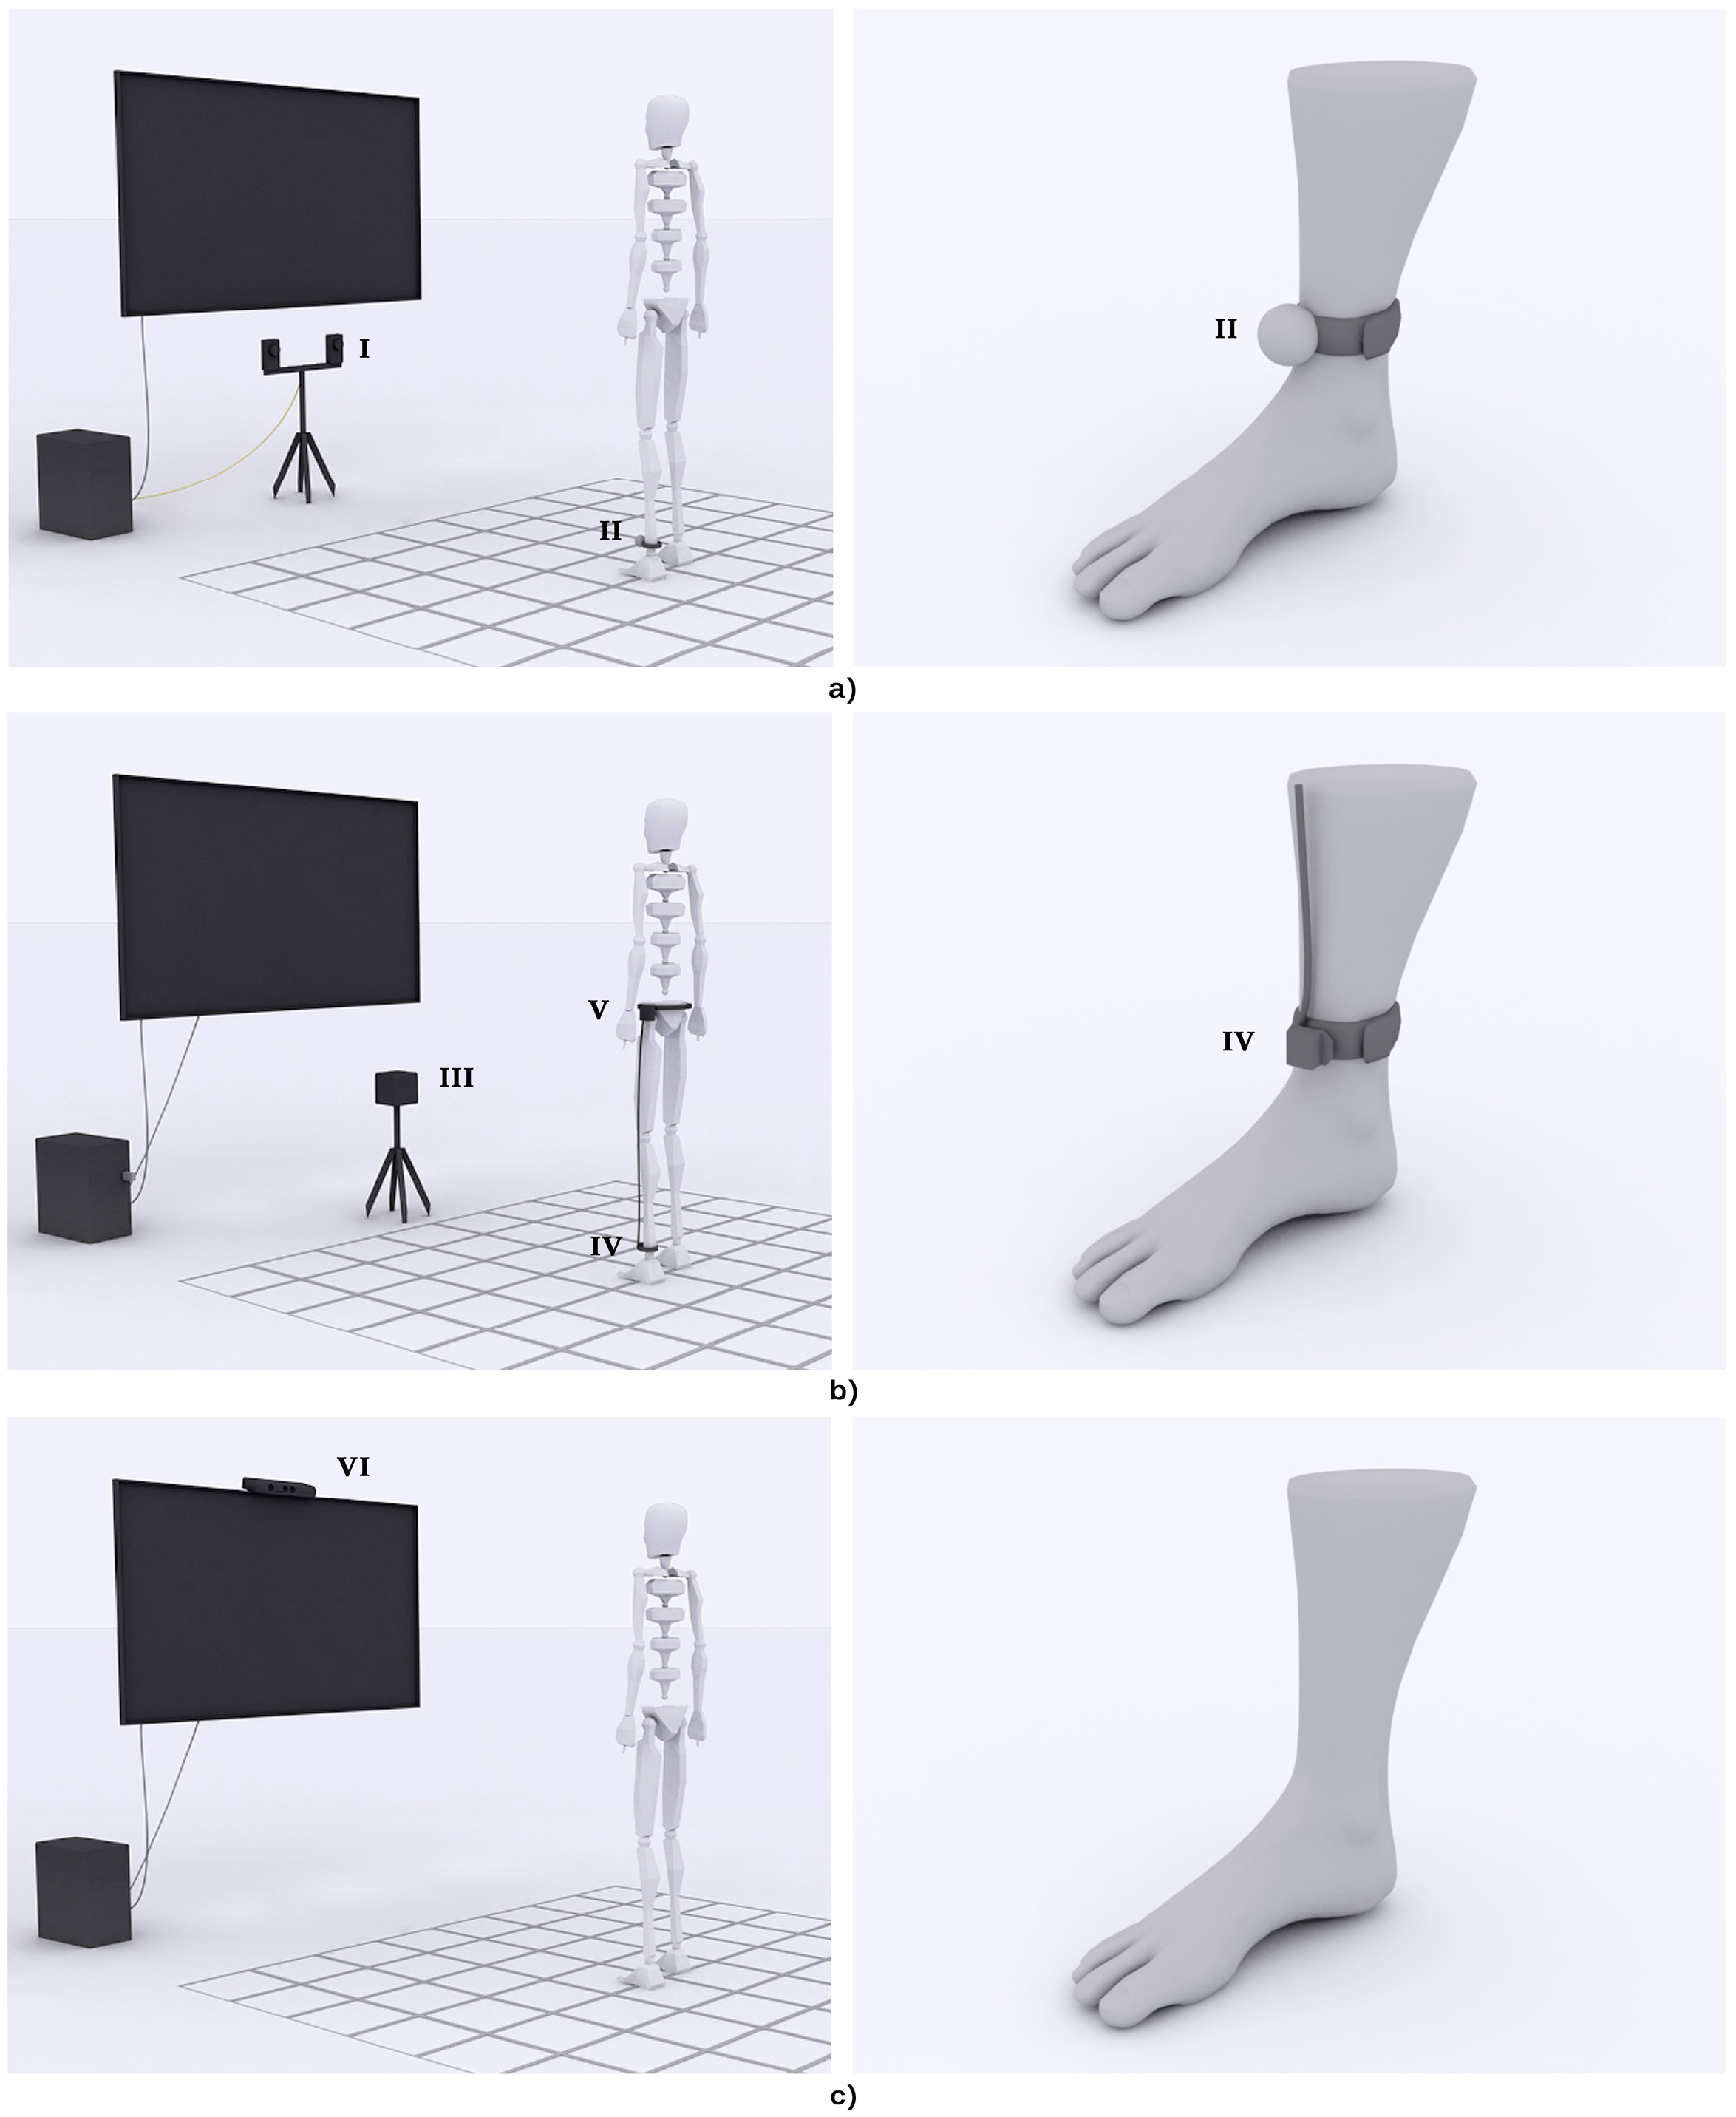
2.1. Tracking Systems under Study
2.1.1. Optical Tracking

2.1.2. Electromagnetic Tracking
2.1.3. Skeleton Tracking
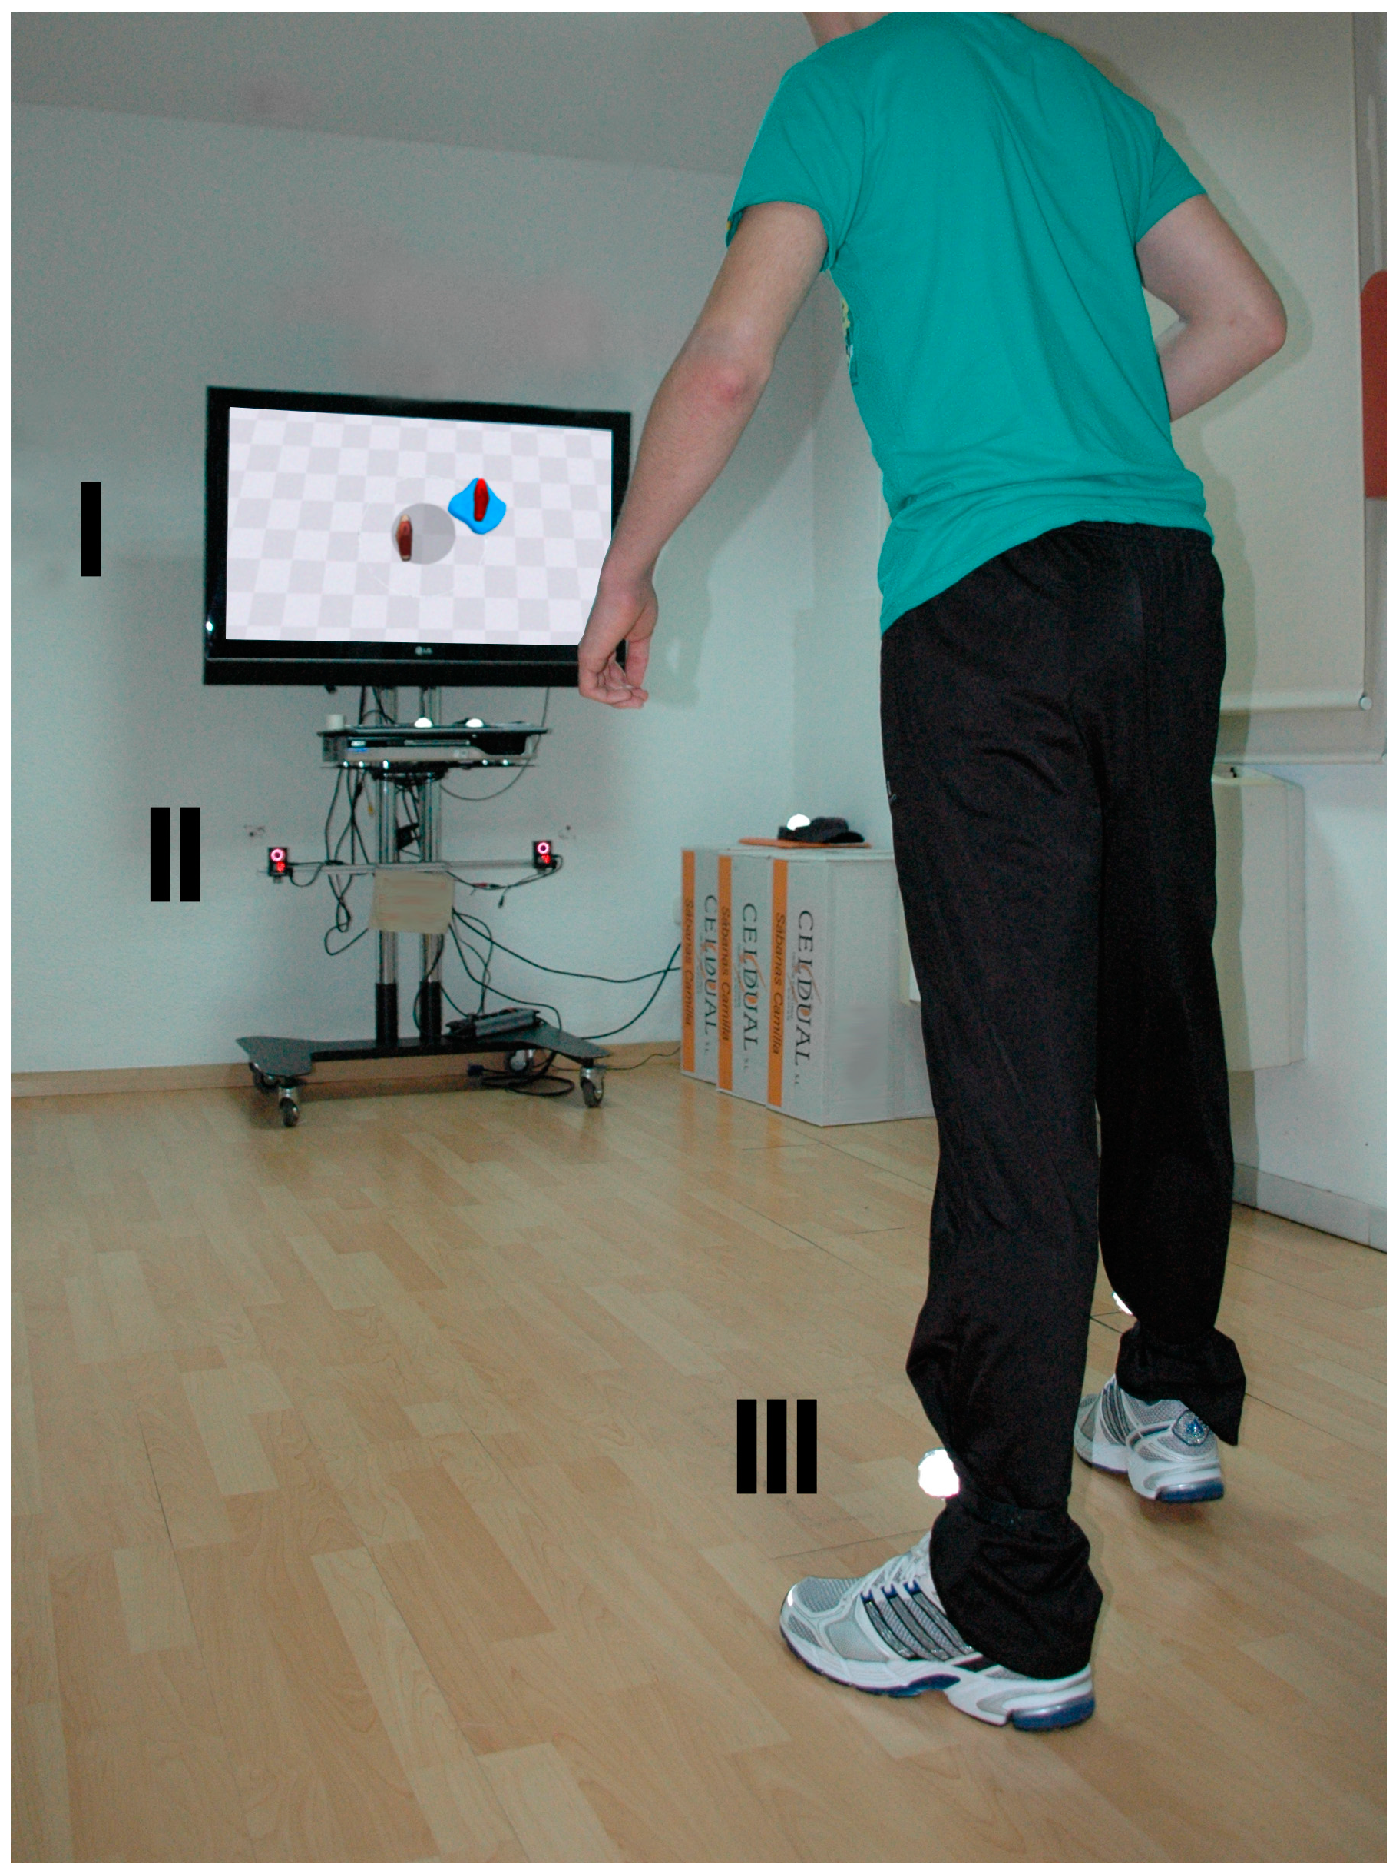
2.2. Virtual Rehabilitation System
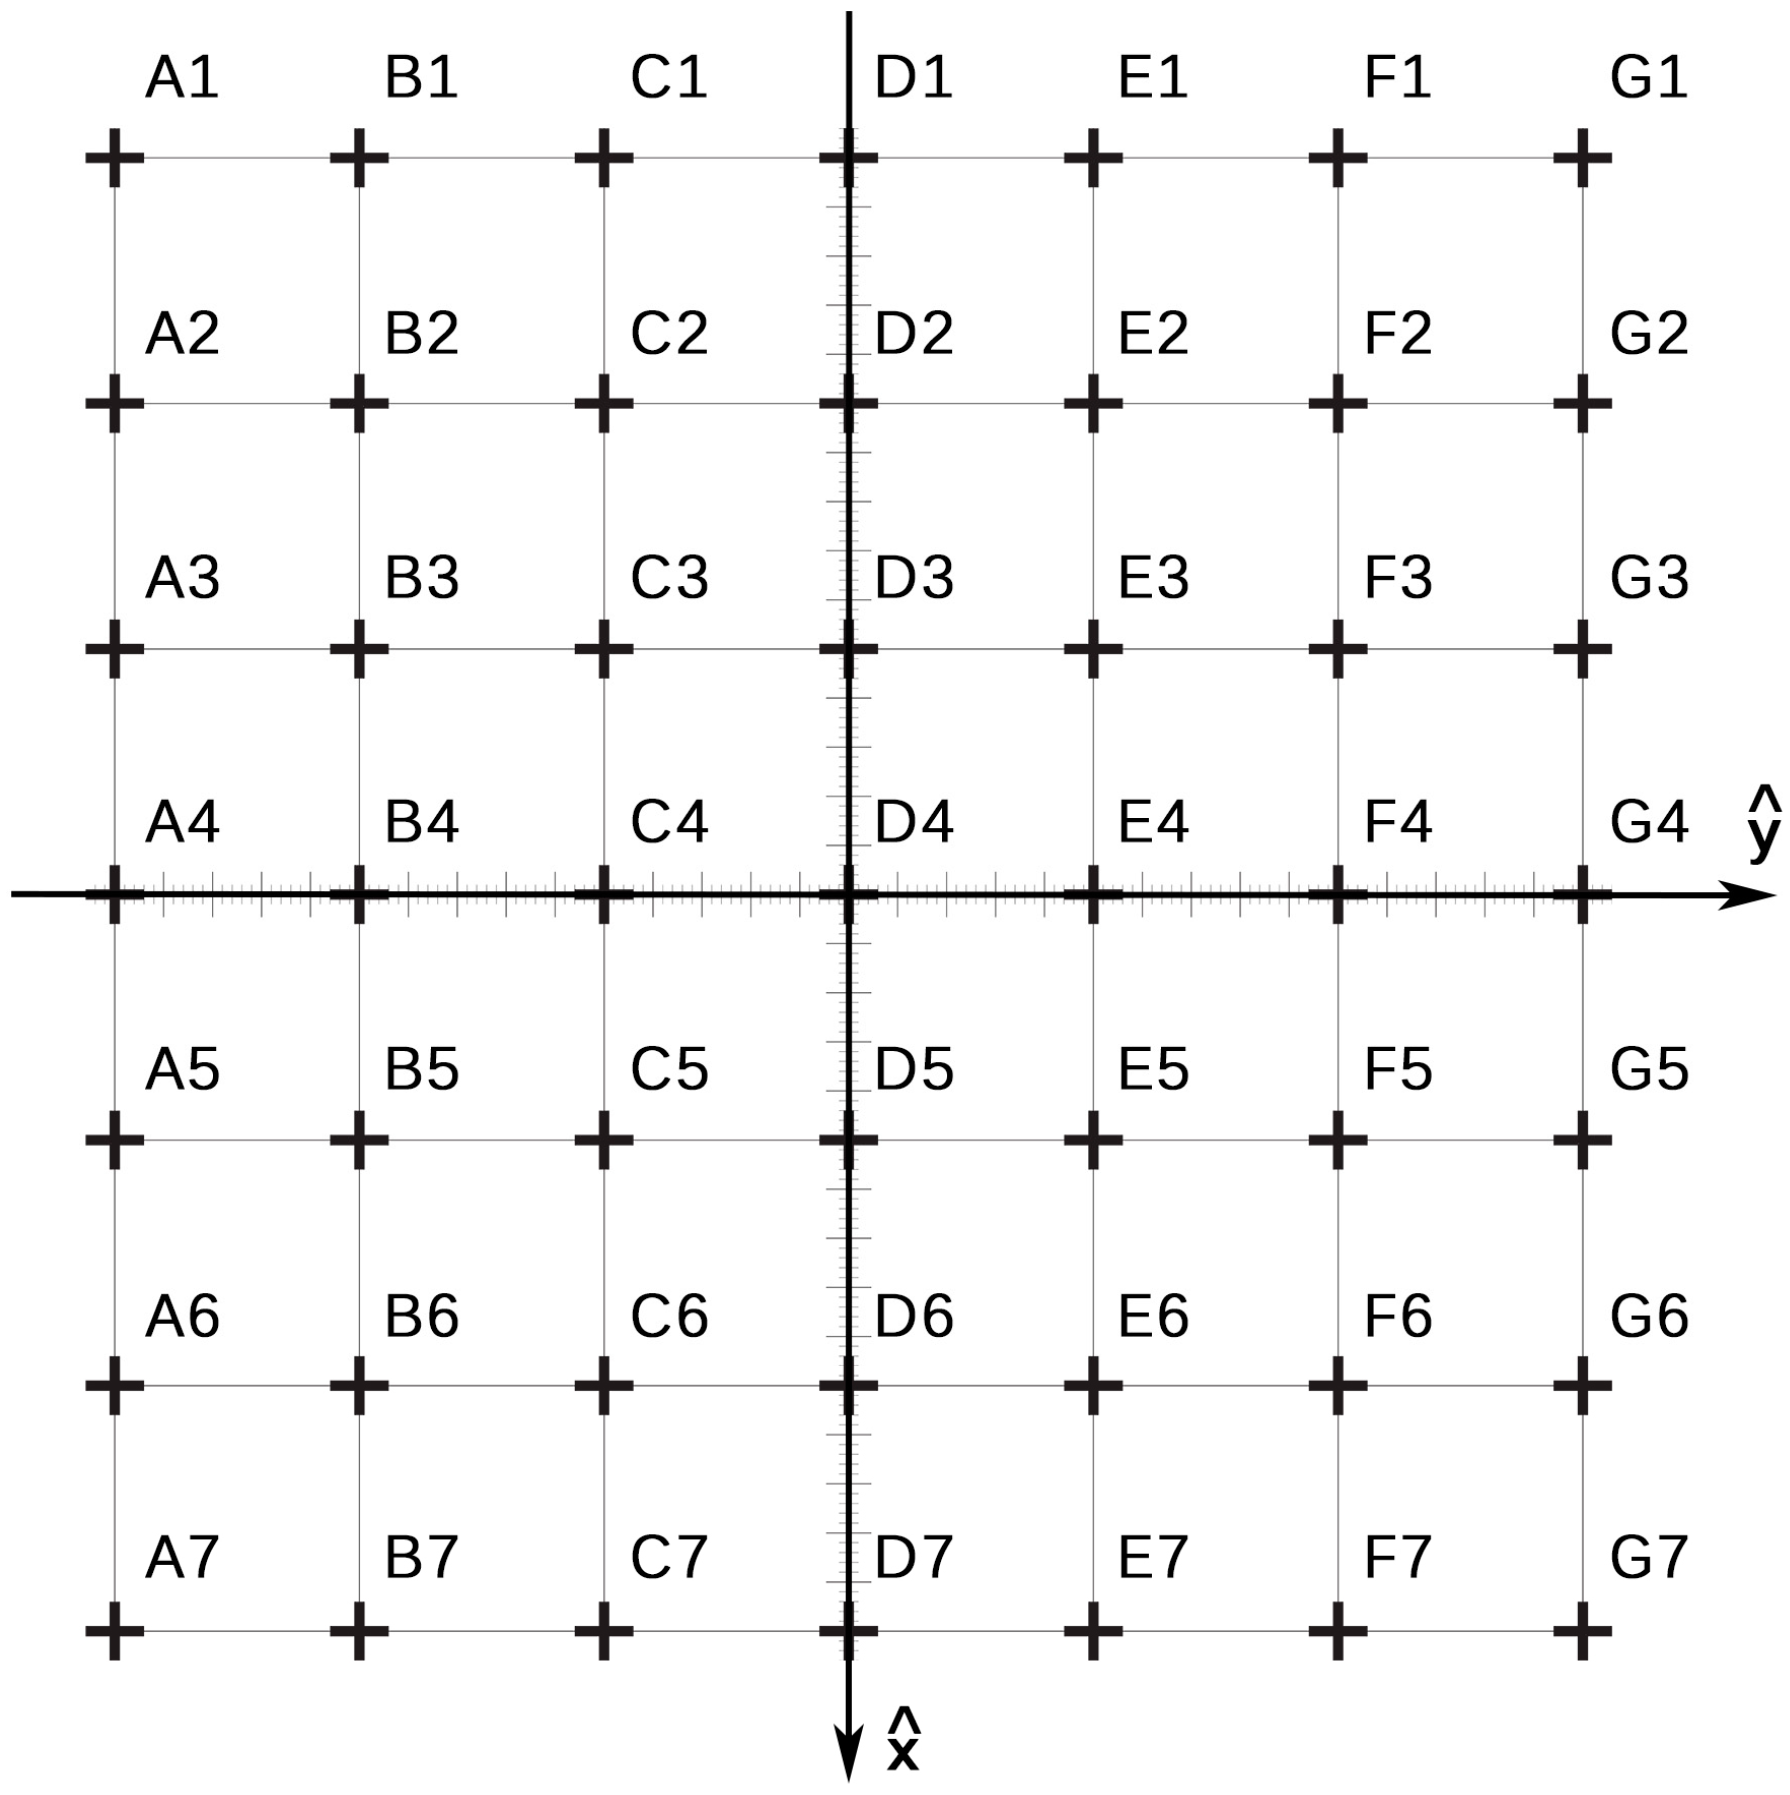
2.3. Study of the Performance


2.4. Study of Subjective Experiences
2.4.1. Healthy Individuals and Individuals with Stroke
2.4.2. Professionals
2.5. Statistical Analysis
3. Results and Discussion
3.1. Objective Performance
| Characteristic | NaturalPoint® OptiTrackTM V100:R2 | PolhemusTM G4TM | Microsoft® KinectTM |
|---|---|---|---|
| Working Range (m2) | 2.6 | 2.2 | 3.1 |
| Accuracy (cm) | |||
| X coordinate | 0.6 ± 0.4 | 5.9 ± 3.0 | 0.9 ± 0.6 |
| Y coordinate | 0.6 ± 0.4 | 2.3 ± 2.4 | 2.4 ± 1.4 |
| Z coordinate | 0.4 ± 0.2 | 8.3 ± 1.8 | 1.0 ± 1.0 |
| Total | 1.1 ± 0.4 | 11.0 ± 2.4 | 2.9 ± 1.4 |
| Jitter (cm) | |||
| X coordinate | 0.4 ± 0.3 | 0.2 ± 0.1 | 1.3 ± 0.7 |
| Y coordinate | 0.1 ± 0.1 | 0.1 ± 0.1 | 0.3 ± 0.3 |
| Z coordinate | 0.1 ± 0.0 | 0.2 ± 0.1 | 0.6 ± 0.5 |
| Total | 0.4 ± 0.3 | 0.3 ± 0.1 | 1.5 ± 0.9 |
3.2. Subjective Performance
| Issue | NaturalPoint® OptiTrackTM | Polhemus™ G4TM | Microsoft® KinectTM | Significance |
|---|---|---|---|---|
| Healthy, Stroke Individuals, and Professionals | ||||
| A1/B1. Fixation speed of sensors/markers | ||||
| Healthy group | 4.2 ± 1.0 | 4.0 ± 1.1 | 5.0 ± 0.0 | O = G , K ** > O, K ** > G |
| Stroke group | 4.3 ± 0.5 | 3.9 ± 0.6 | 4.4 ± 0.5 | O * > G, O = K , K * > G |
| Professional group | 3.6 ± 0.8 | 3.2 ± 0.7 | 5.0 ± 0.0 | O = G, K ** > O, K ** > G |
| A2/B2. Ease of calibration | ||||
| Healthy group | 4.5 ± 0.8 | 4.6 ± 0.7 | 4.8 ± 0.7 | NS |
| Stroke group | 4.3 ± 0.6 | 4.4 ± 0.5 | 3.0 ± 0.6 | O = G , O ** > K, G ** > K |
| Professional group | 4.1 ± 0.6 | 4.4 ± 0.5 | 3.1 ± 0.4 | O = G , O ** > K, G ** > K |
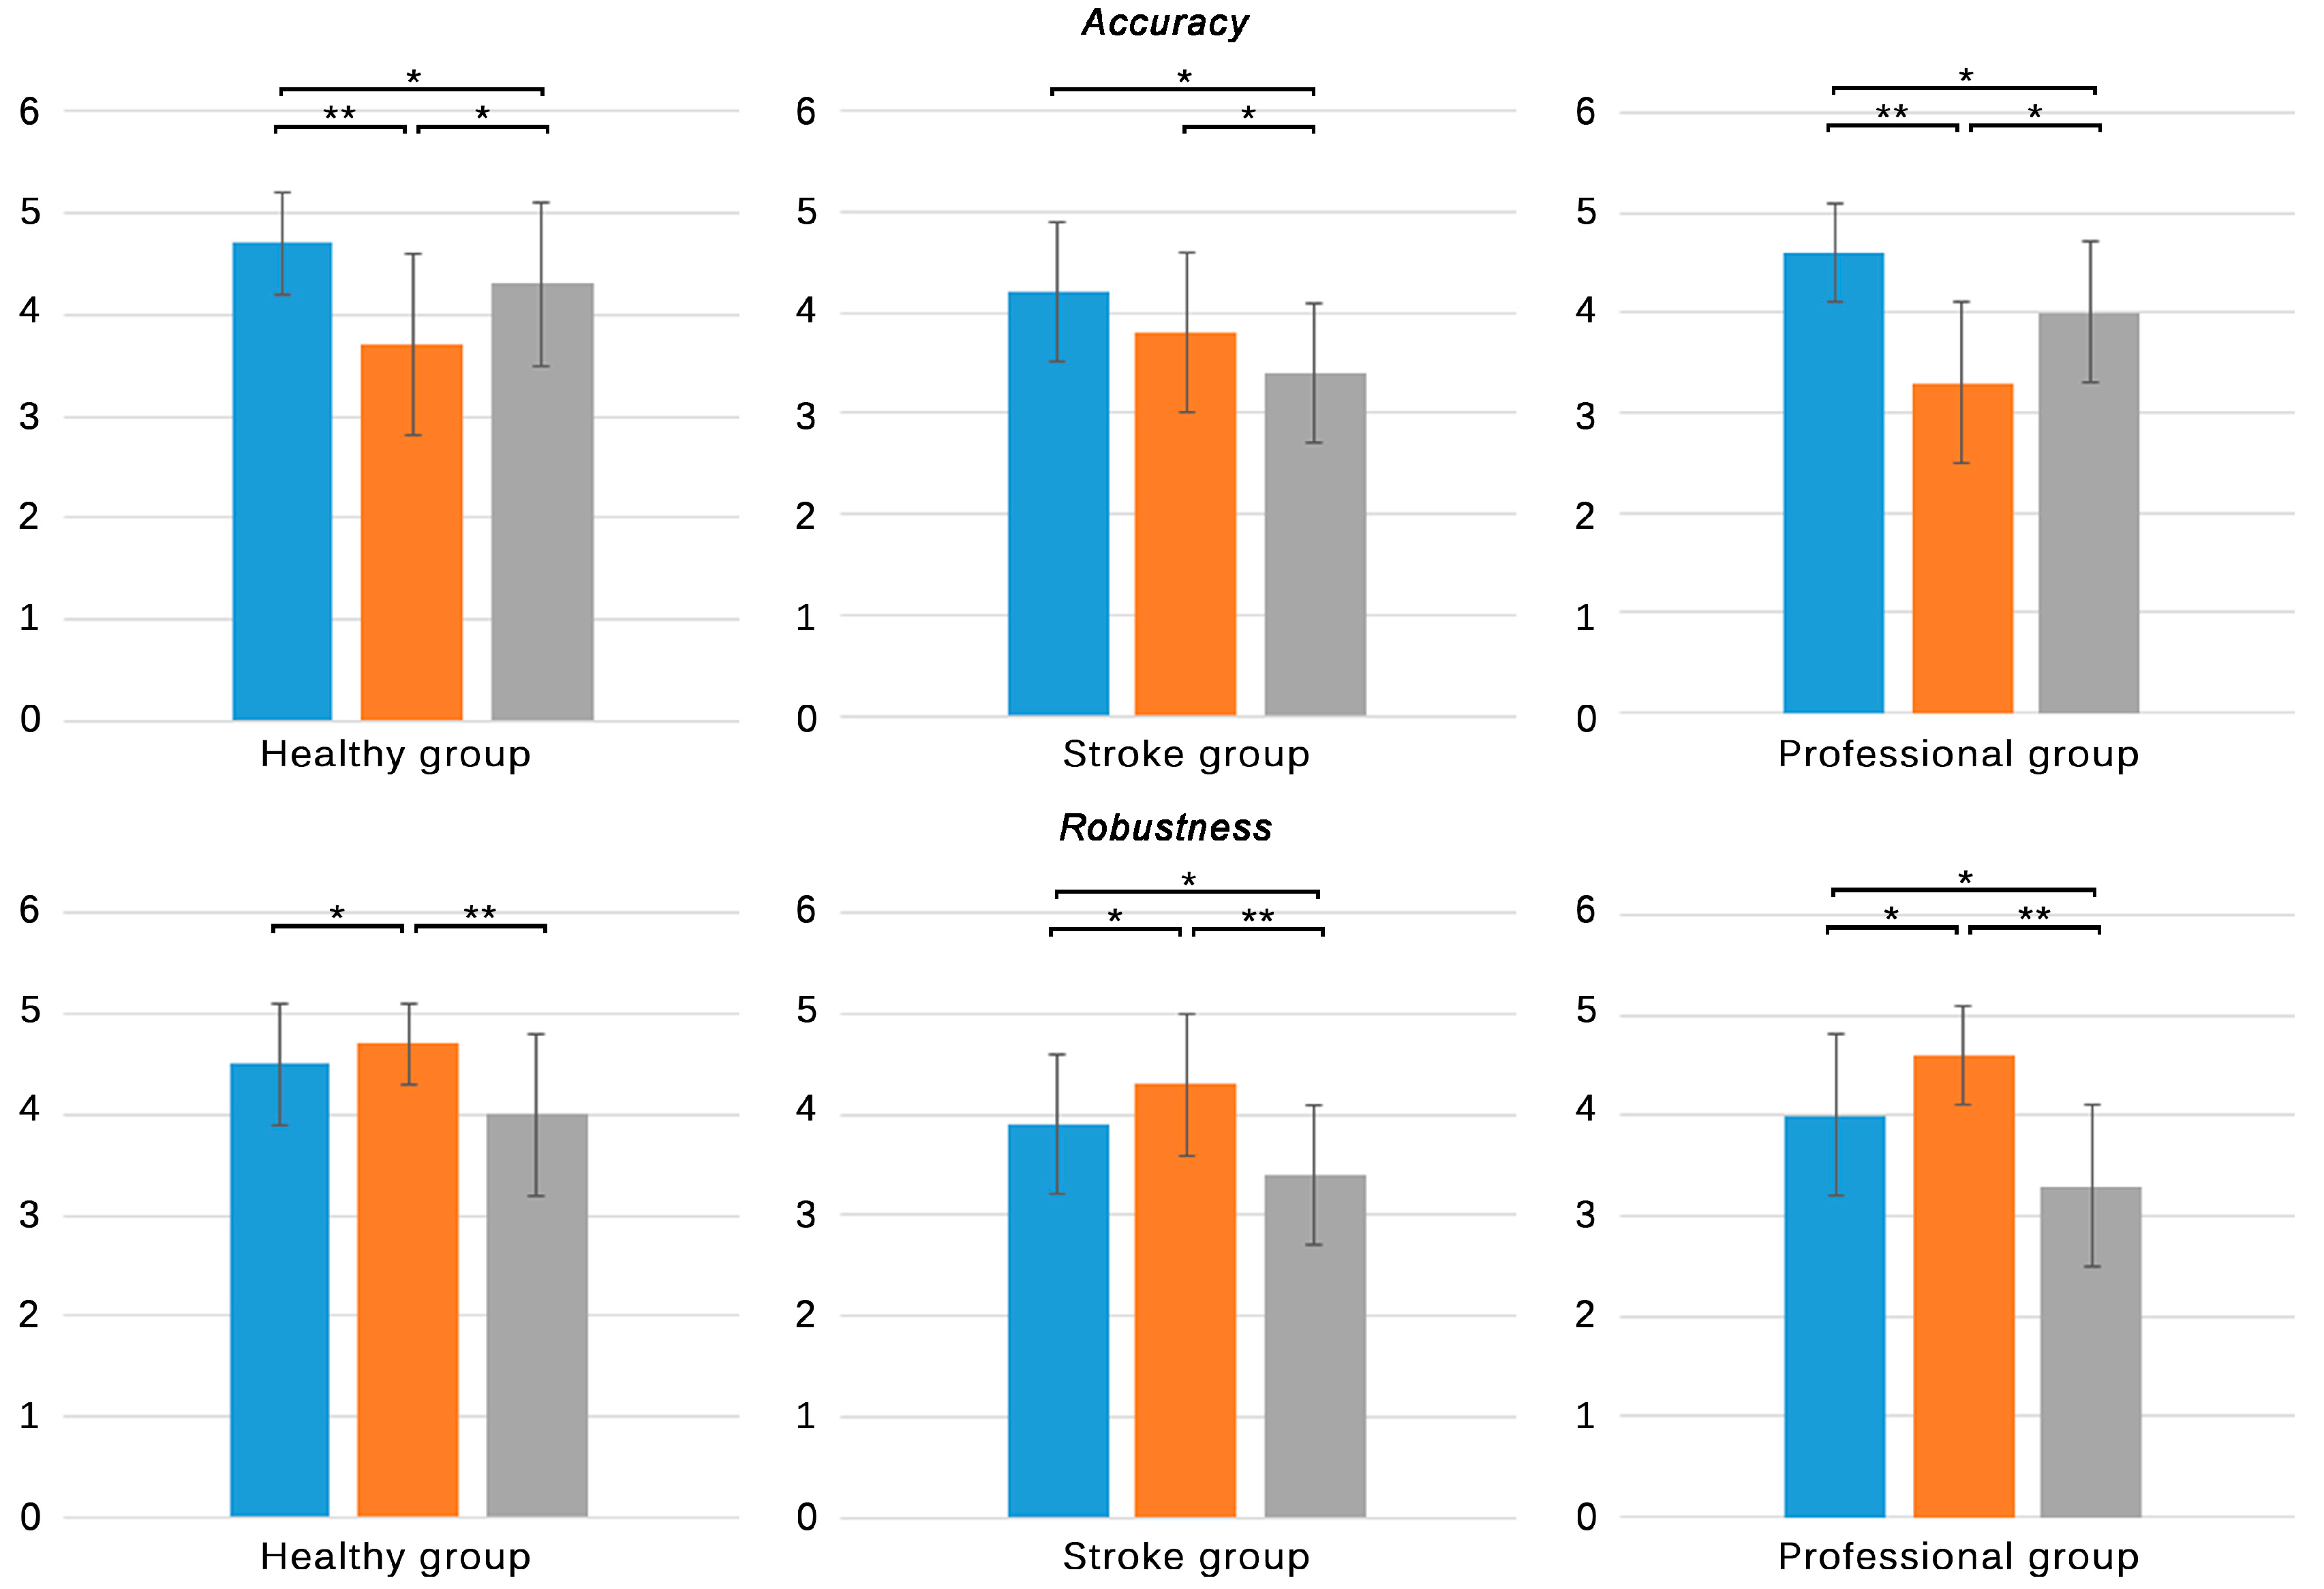
| A3/B3. Accuracy | ||||
| Healthy group | 4.7 ± 0.5 | 3.7 ± 0.9 | 4.3 ± 0.8 | O ** > G, O * > K *, K * > G |
| Stroke group | 4.2 ± 0.7 | 3.9 ± 0.8 | 3.4 ± 0.7 | O = G, O * > K, G * > K |
| Professional group | 4.6 ± 0.5 | 3.3 ± 0.8 | 4.0 ± 0.7 | O ** > G, O * > K, K * > G |
| A4/B4. Robustness | ||||
| Healthy group | 4.5 ± 0.6 | 4.7 ± 0.4 | 4.0 ± 0.8 | G * > O, O = K, G ** > K |
| Stroke group | 3.9 ± 0.7 | 4.3 ± 0.7 | 3.4 ± 0.7 | G * > O, O * > K, G ** > K |
| Professional group | 4.0 ± 0.8 | 4.6 ± 0.5 | 3.3 ± 0.8 | G * > O, O * > K, G ** > K |
| Healthy and Stroke Individuals | ||||
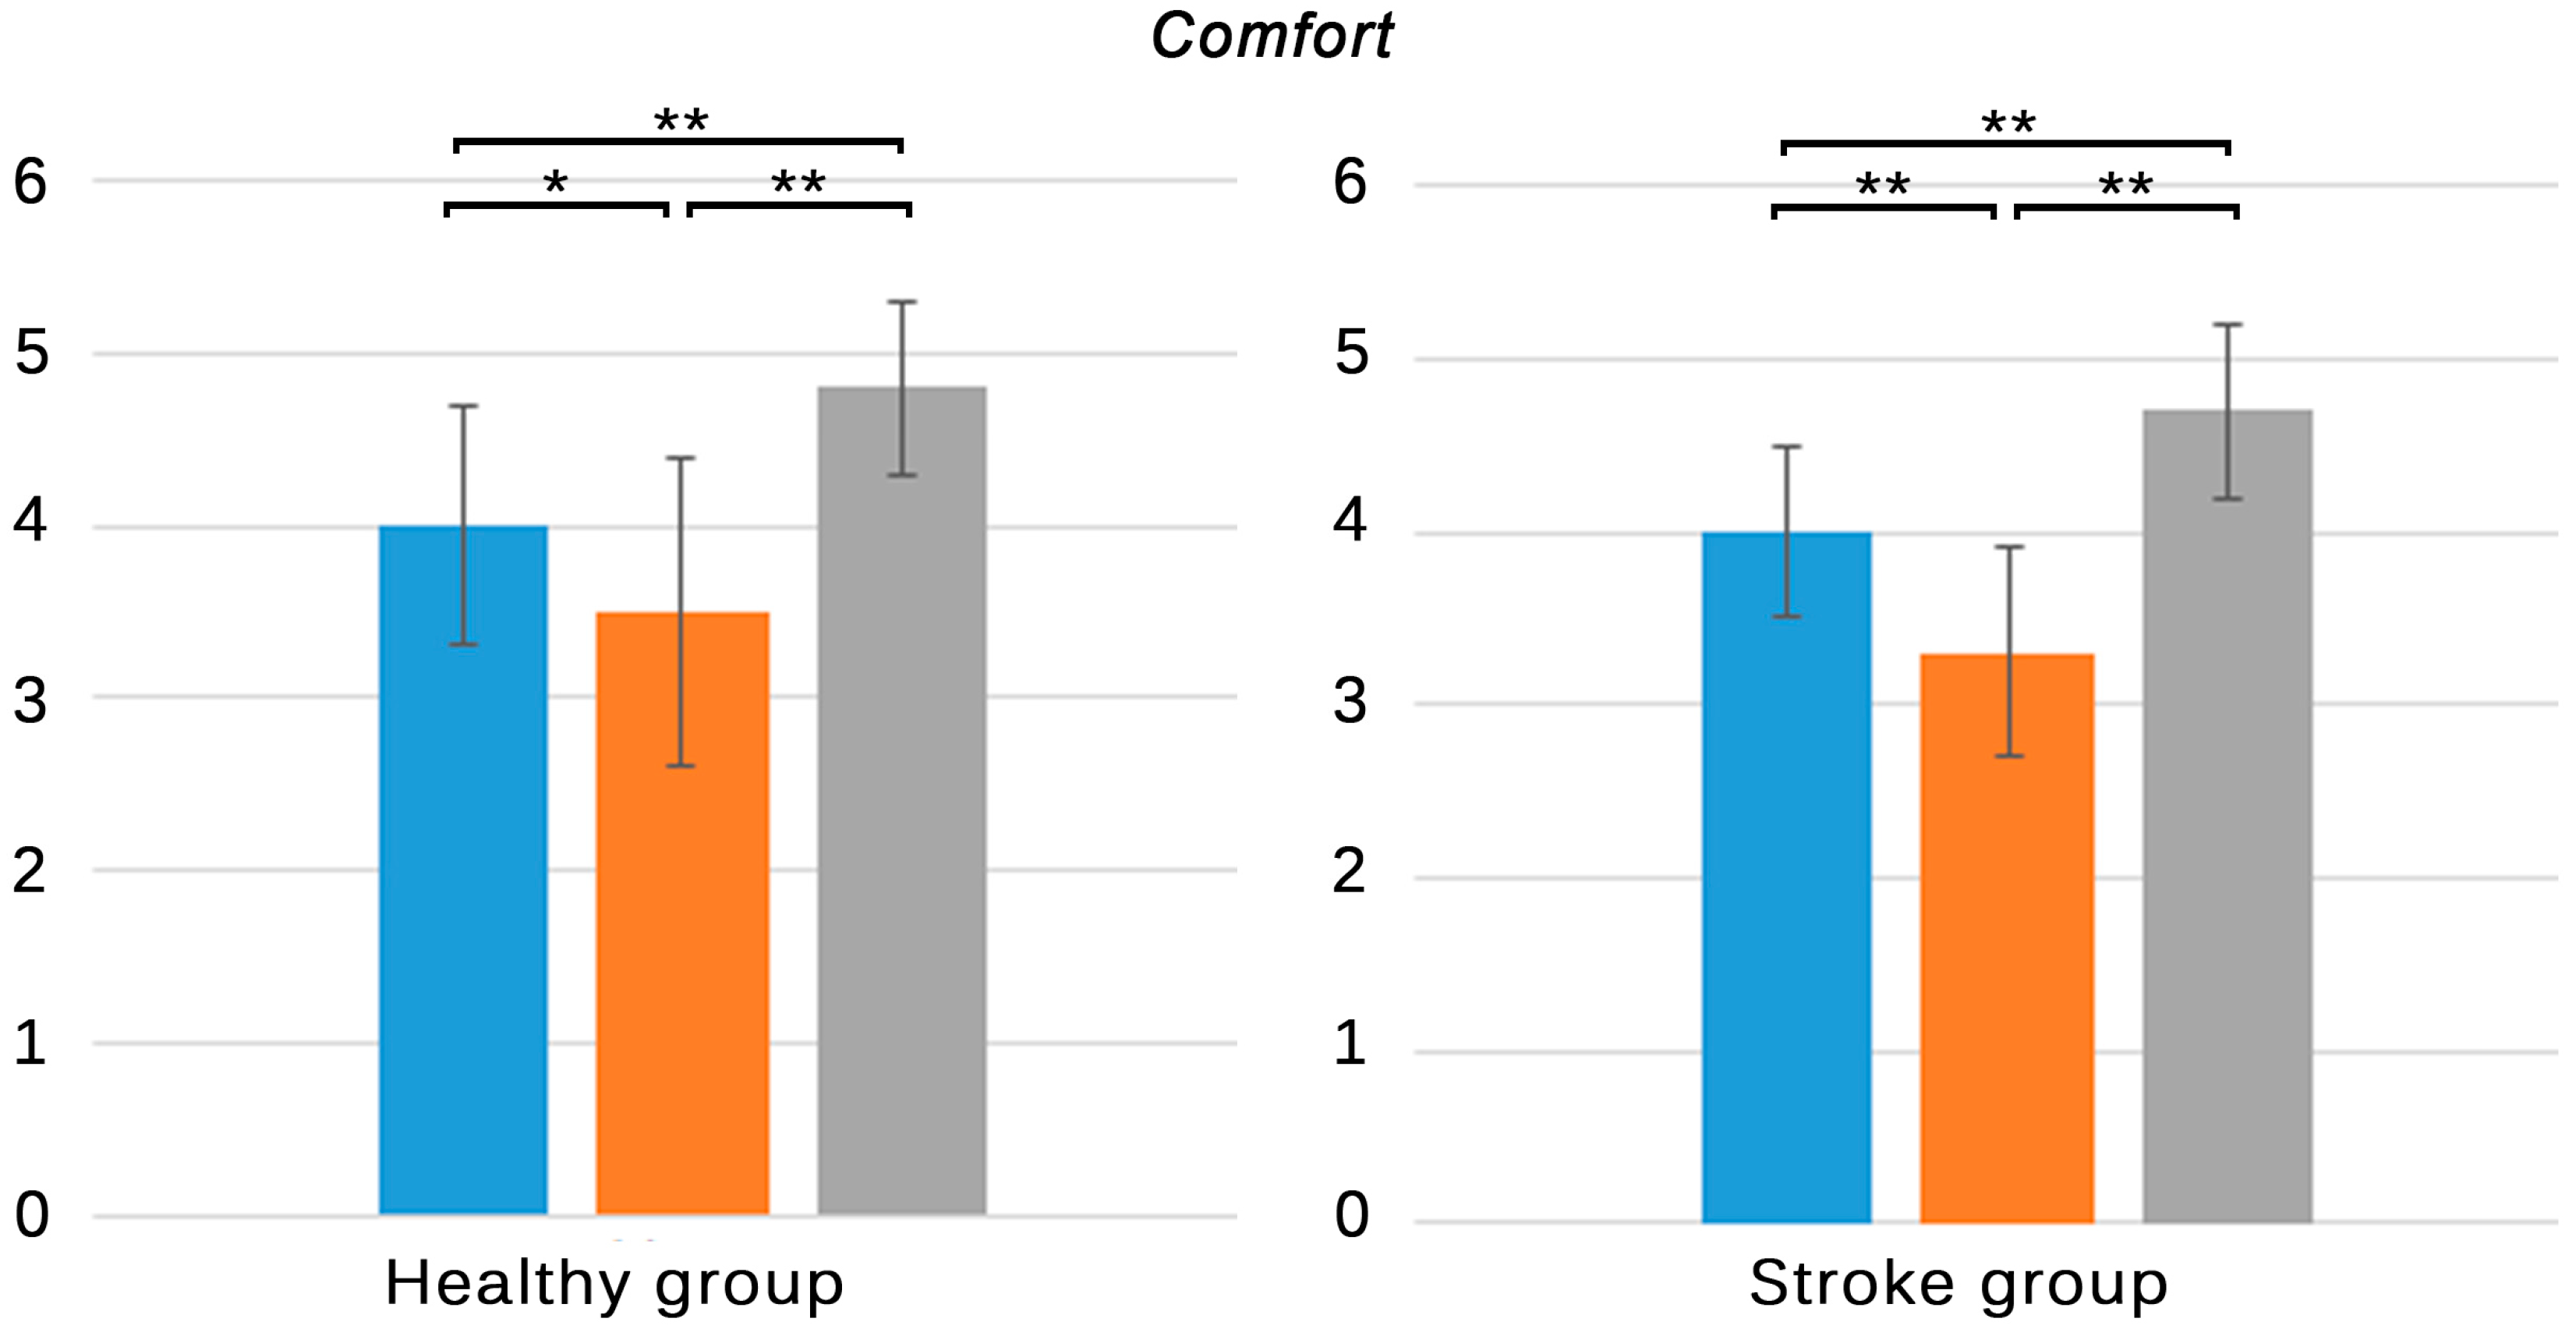
| A5. Comfort | ||||
| Healthy group | 4.0 ± 0.7 | 3.5 ± 0.9 | 4.8 ± 0.5 | O * > G, K ** > O, K ** > G |
| Stroke group | 4.0 ± 0.5 | 3.3 ± 0.6 | 4.7 ± 0.5 | O ** > G, K ** > O, K ** > G |
| Professional group | - | - | - | - |
| Professionals | ||||
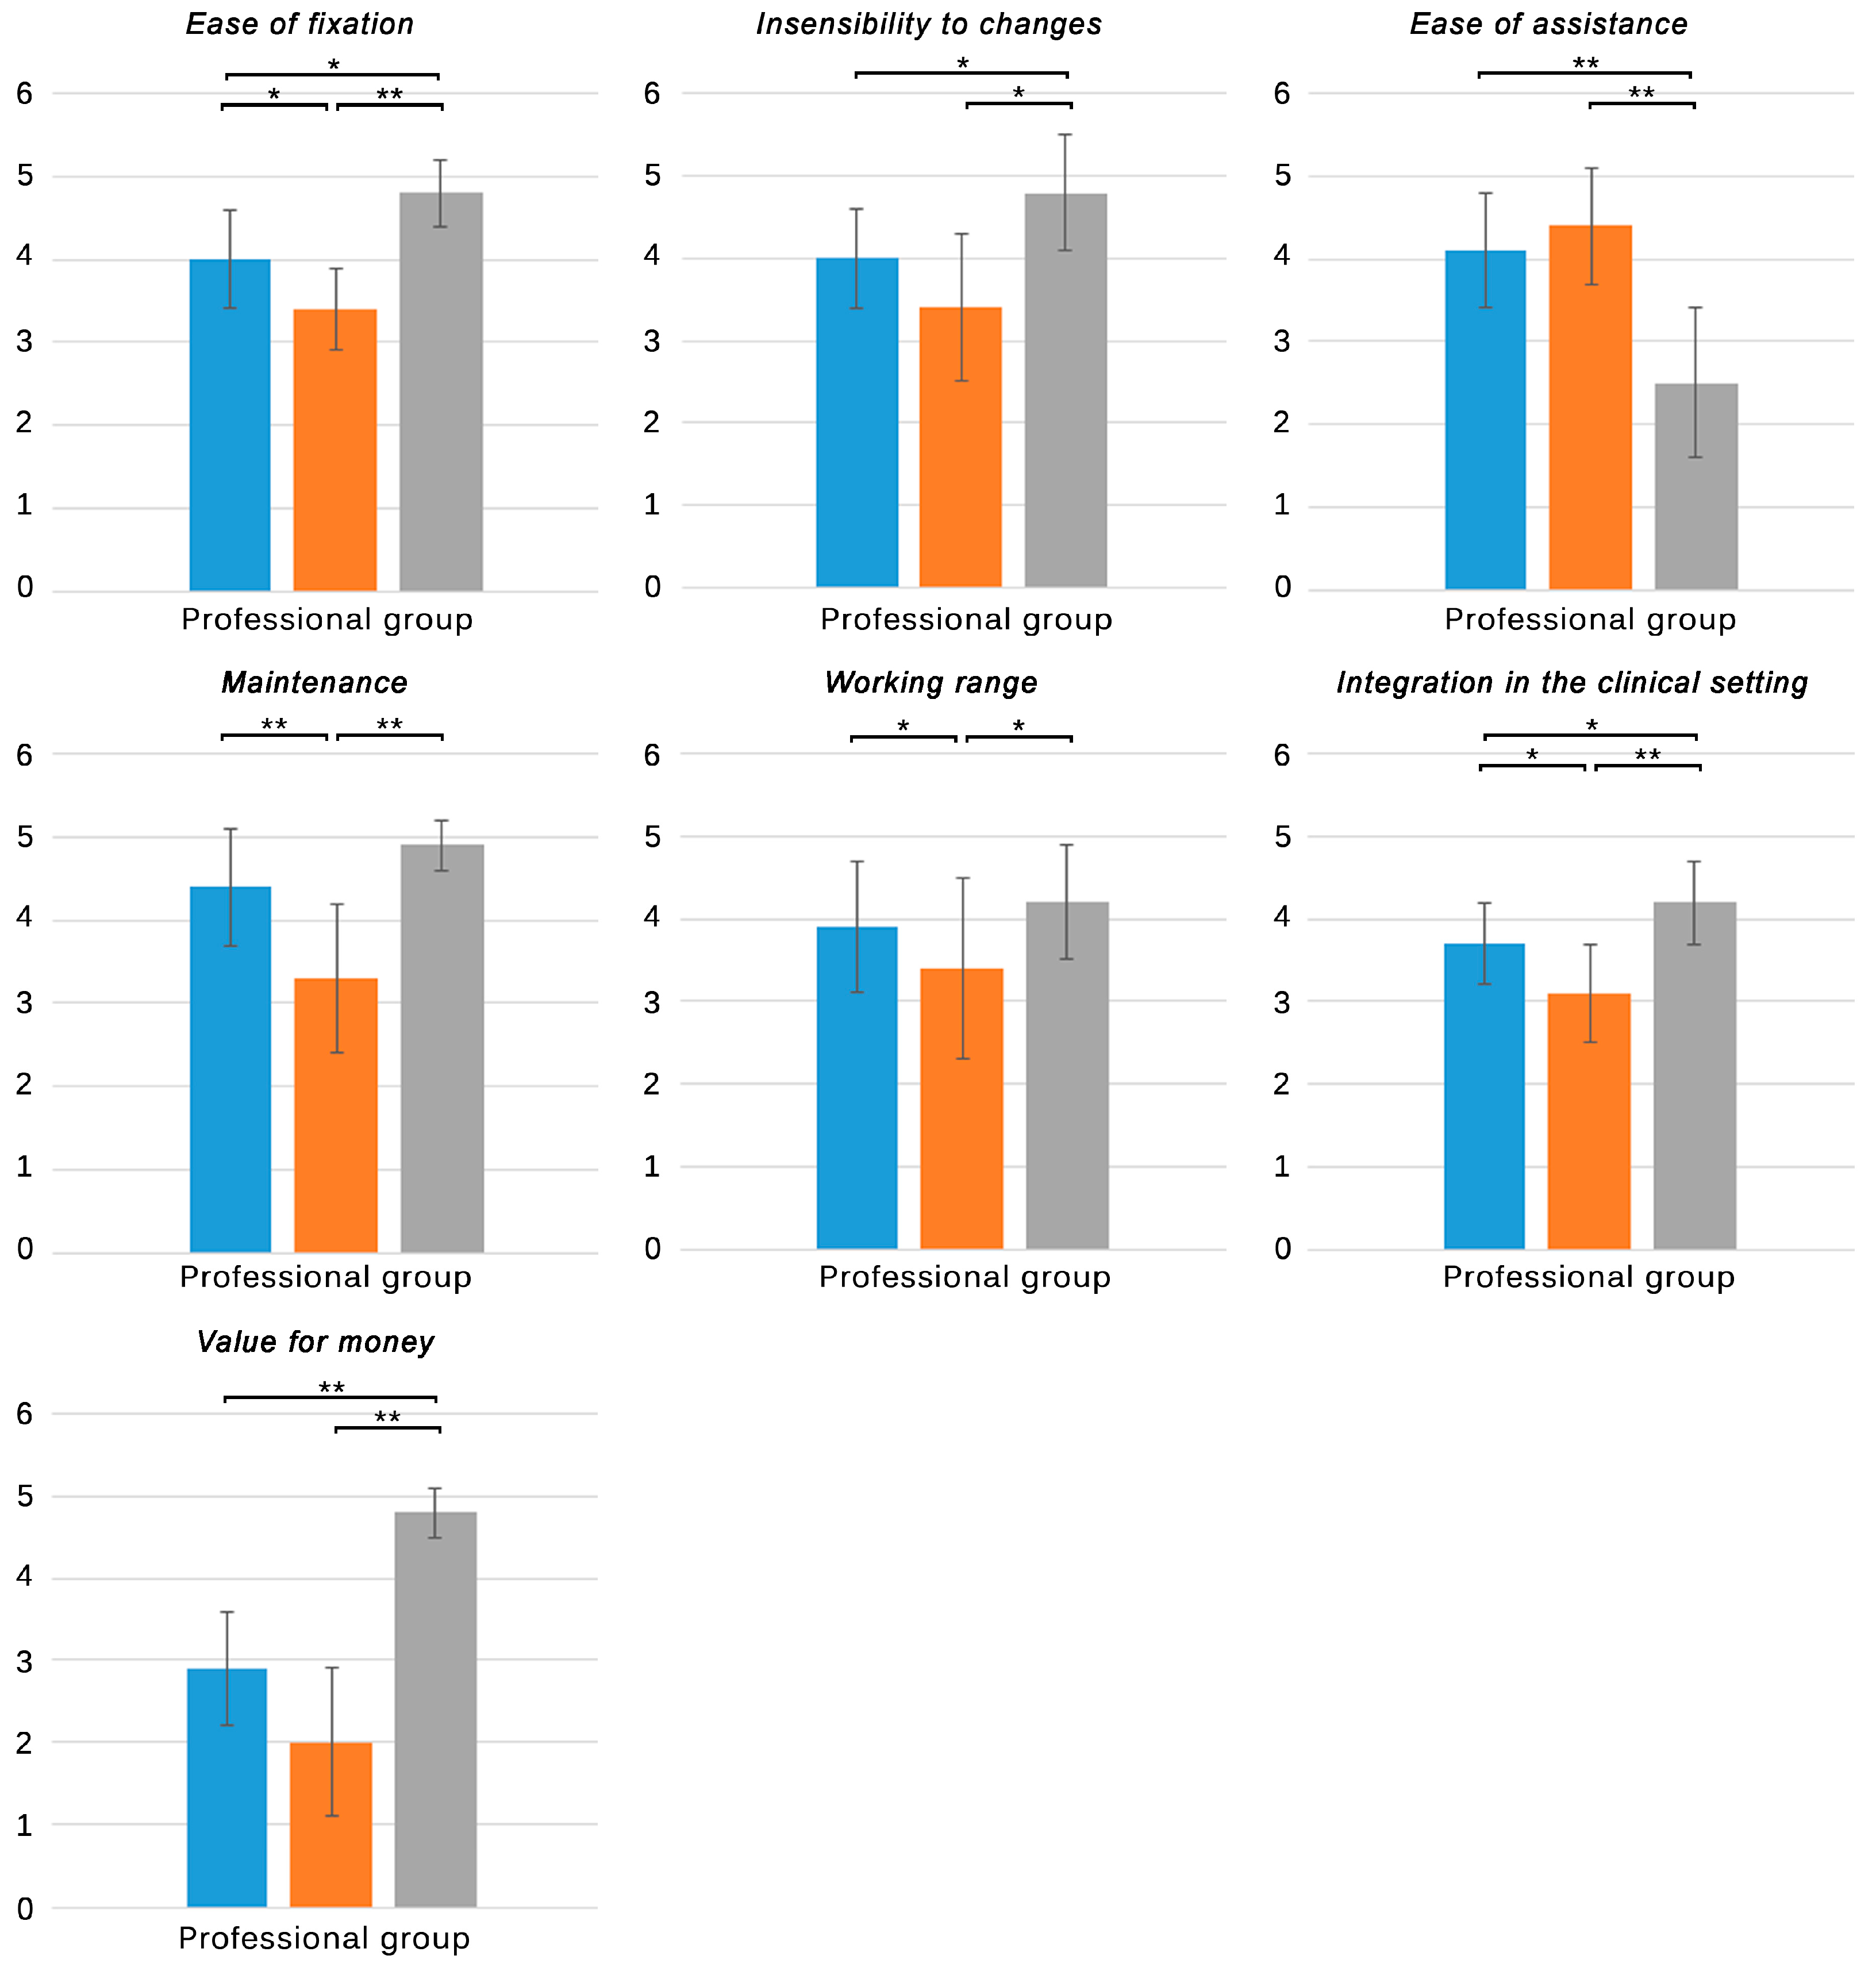
| B5. Ease of fixation | ||||
| Healthy group | - | - | - | - |
| Stroke group | - | - | - | - |
| Professional group | 4.0 ± 0.6 | 3.4 ± 0.5 | 4.8 ± 0.4 | O * > G, K * > O, K ** > G |
| B6. Insensibility to changes in the clinical setting | ||||
| Healthy group | - | - | - | - |
| Stroke group | - | - | - | - |
| Professional group | 3.1 ± 0.6 | 3 ± 0.8 | 3.7 ± 0.5 | O = G, K * > O, K * > G |
| B7. Ease of assistance | ||||
| Healthy group | - | - | - | - |
| Stroke group | - | - | - | - |
| Professional group | 4.1 ± 0.7 | 4.4 ± 0.7 | 2.5 ± 0.9 | O ** > K, G ** > K, O = G |
| B8. Maintenance | ||||
| Healthy group | - | - | - | - |
| Stroke group | - | - | - | - |
| Professional group | 4.4 ± 0.7 | 3.3 ± 0.9 | 4.9 ± 0.3 | O ** > G, O = K, K ** > G |
| B9. Working range | ||||
| Healthy group | - | - | - | - |
| Stroke group | - | - | - | - |
| Professional group | 3.9 ± 0.8 | 3.2 ± 1.1 | 4.2 ± 0.7 | O * > G, O = K, K * > G |
| B10. Integration in the clinical setting | ||||
| Healthy group | - | - | - | - |
| Healthy group | - | - | - | - |
| Professional group | 3.7 ± 0.5 | 3.1 ± 0.6 | 4.2 ± 0.5 | O * > G, K * > O, K ** > G |
| B11. Value for money | ||||
| Healthy group | - | - | - | - |
| Stroke group | - | - | - | - |
| Professional group | 2.5 ± 0.5 | 2.3 ± 0.7 | 4.8 ± 0.3 | K ** > O, K ** > G, G = O |
| Healthy, Stroke Individuals, and Professionals | ||||
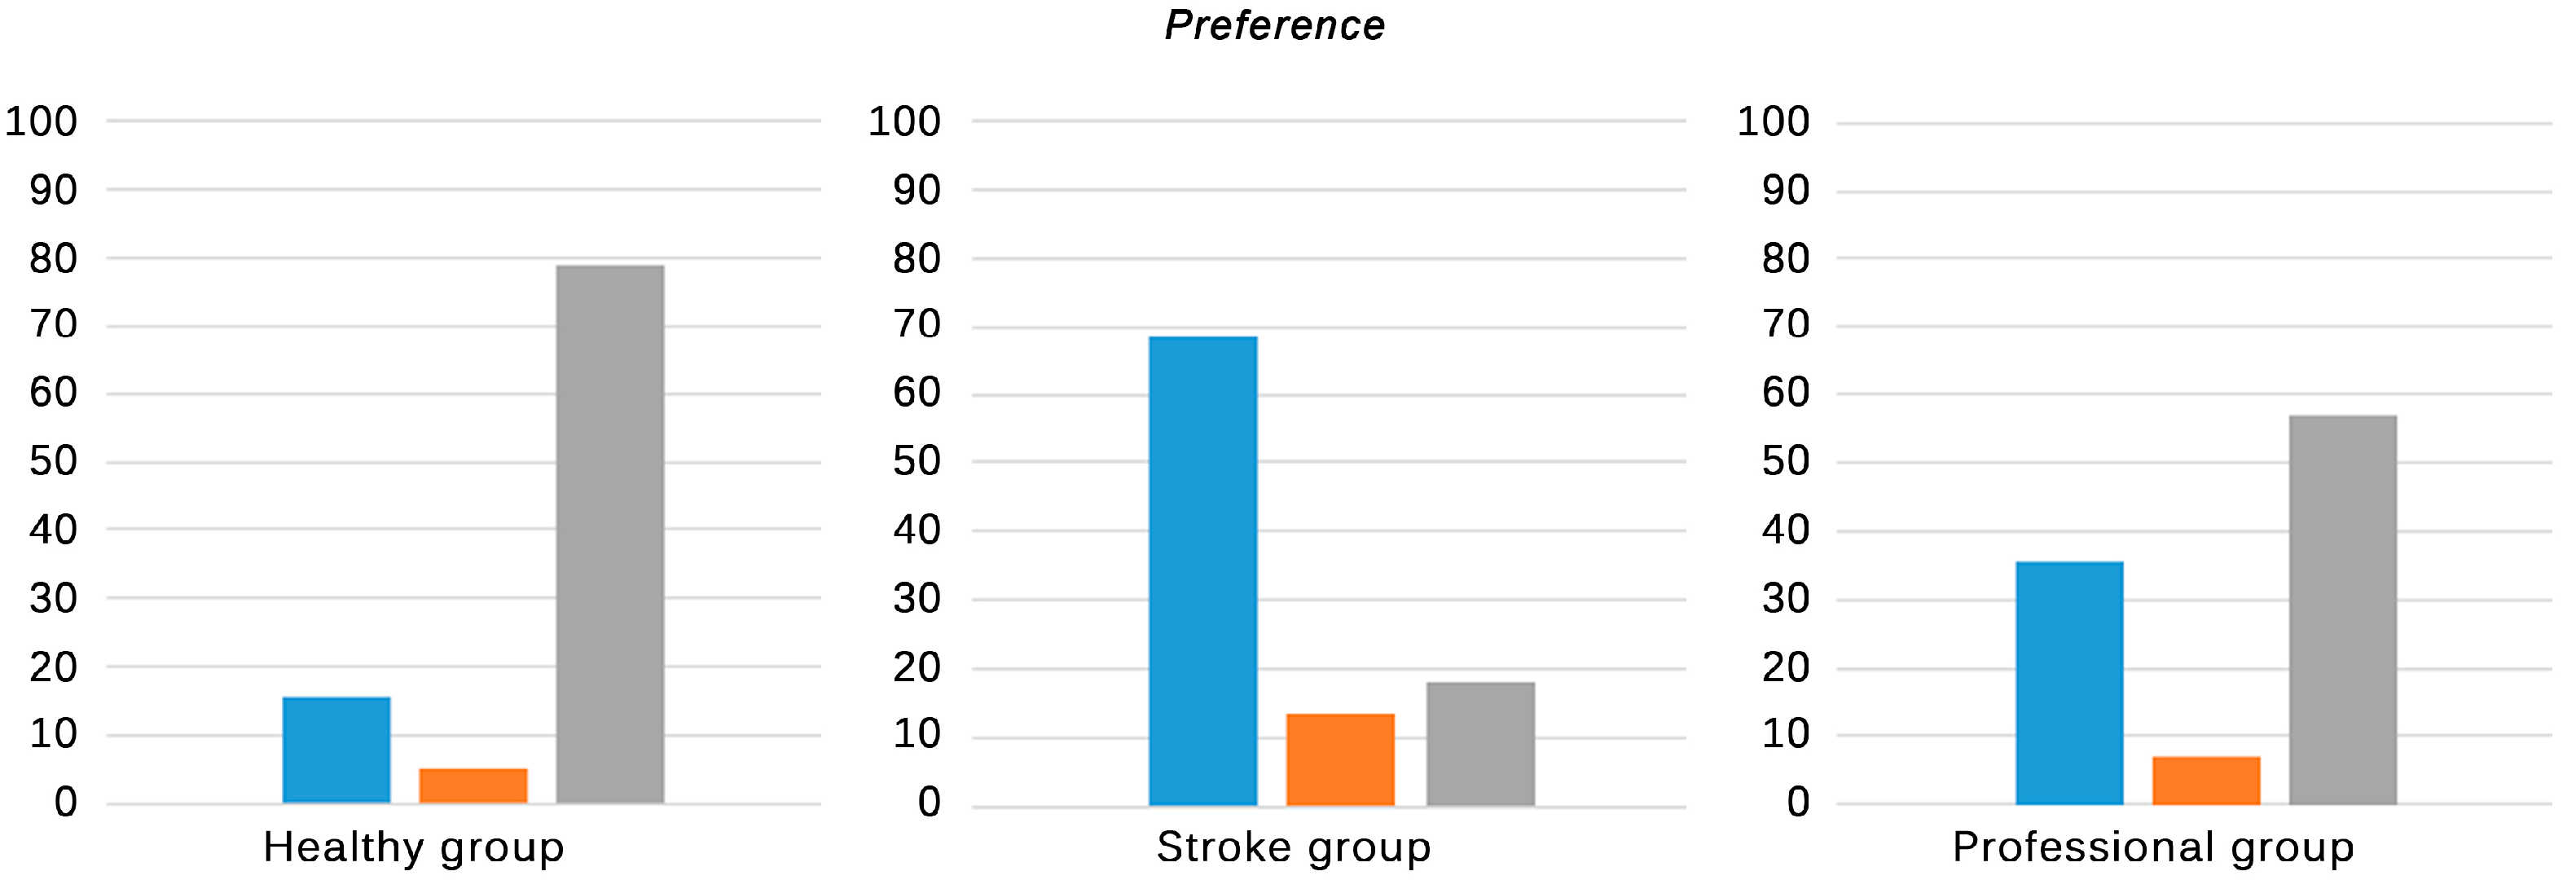
| A8/B12. Preference (n, %) | ||||
| Healthy group | 3 (15.8%) | 1 (5.2%) | 15 (79.0%) | - |
| Stroke group | 11 (50%) | 3 (13.6%) | 8 (36.4%) | - |
| Professional group | 4 (28.6%) | 3 (21.4%) | 7 (50%) | - |


3.3. Limitations
4. Conclusions/Outlook
Acknowledgments
Author Contributions
Conflicts of Interest
References
- Milgram, P.; Takemura, H.; Utsumi, A.; Kishino, F. Augmented reality: A Class of Displays on the Reality-Virtuality Continuum. In Proceedings of the SPIE Conference on Telemanipulator and Telepresence Technologies, Boston, MA, USA, 21 December 1995; pp. 282–292.
- Sveistrup, H. Motor rehabilitation using virtual reality. J. Neuroeng. Rehabil. 2004, 1, 10. [Google Scholar] [CrossRef] [PubMed] [Green Version]
- Laver, K.; George, S.; Thomas, S.; Deutsch, J.E.; Crotty, M. Cochrane review: Virtual reality for stroke rehabilitation. Eur. J. Phys. Rehabil. Med. 2012, 48, 523–530. [Google Scholar] [PubMed]
- Rose, F.D.; Brooks, B.M.; Rizzo, A.A. Virtual reality in brain damage rehabilitation: Review. Cyberpsychol. Behav. 2005, 8, 241–262. [Google Scholar] [CrossRef] [PubMed]
- Doug, A.B.; Kruijff, E.; LaViola, J.; Poupyrev, I. 3D User Interfaces: Theory and Practice; Addison-Wesley Professional: Boston, MA, USA, 2005. [Google Scholar]
- Zhou, H.; Hu, H. Human motion tracking for rehabilitation—A survey. Biomed. Signal Process. Control 2008, 3, 1–18. [Google Scholar] [CrossRef]
- Shotton, J.; Fitzgibbon, A.; Cook, M.; Sharp, T.; Finocchio, M.; Moore, R.; Kipman, A.; Blake, A. Real-time Human Pose Recognition in Parts from Single Depth Images. In Proceedings of the 2011 IEEE Conference on Computer Vision and Pattern Recognition, Colorado Springs, CO, USA, 20–25 June 2011; pp. 1297–1304.
- Burdea, G.C.; Coiffet, P. Virtual Reality Technology; John Wiley & Sons, Inc.: Hoboken, NJ, USA, 2003; p. 444. [Google Scholar]
- Weiss, P.L.; Kizony, R.; Feintuch, U.; Rand, D.; Katz, N. Medical Neurorehabilitation. In Textbook of Neural Repair and Rehabilitation; Cambridge University Press: Cambridge, UK, 2006; Volume 2, pp. 182–197. [Google Scholar]
- Obdrzalek, S.; Kurillo, G.; Ofli, F.; Bajcsy, R.; Seto, E.; Jimison, H.; Pavel, M. Accuracy and Robustness of Kinect Pose Estimation in the Context of Coaching of Elderly Population. In Proceedings of the Annual International Conference of the IEEE Engineering in Medicine and Biology Society, San Diego, CA, USA, 28 August–1 September 2012; pp. 1188–1193.
- Plantard, P.; Auvinet, E.; Pierres, A.S.; Multon, F. Pose estimation with a kinect for ergonomic studies: Evaluation of the accuracy using a virtual mannequin. Sensors 2015, 15, 1785–1803. [Google Scholar] [CrossRef] [PubMed]
- Gieselmann, H. Tanz der skelette. Bewegungserkennung mit kinect. C't Magazin: Hannover, Germany, 29 March 2011; pp. 100–107. [Google Scholar]
- De Joode, E.A.; van Boxtel, M.P.J.; Verhey, F.R.; van Heugten, C.M. Use of assistive technology in cognitive rehabilitation: Exploratory studies of the opinions and expectations of healthcare professionals and potential users. Brain Injury 2012, 26, 1257–1266. [Google Scholar]
- Hartley, R.; Zisserman, A. Multiple View Geometry in Computer Vision; Cambridge University Press: Cambridge, UK, 2003; p. 700. [Google Scholar]
- Raab, F.H.; Blood, E.B.; Steiner, T.O.; Jones, H.R. Magnetic position and orientation tracking system. IEEE Trans. Aerosp. Electron. Syst. 1979, AES-15, 709–718. [Google Scholar] [CrossRef]
- PrimeSense. Carmine 1.08. Available online: http://www.i3du.gr/pdf/primesense.pdf (accessed on 17 March 2015).
- García, J.; Zalevsky, Z. Range Mapping Usin Speckle Decorrelation. U.S. Patent US 7,433,024 B2, 7 October 2008. [Google Scholar]
- Khoshelham, K.; Elberink, S.O. Accuracy and resolution of kinect depth data for indoor mapping applications. Sensors 2012, 12, 1437–1454. [Google Scholar] [CrossRef] [PubMed]
- Lloréns, R.; Gil-Gómez, J.A.; Alcañiz, M.; Colomer, C.; Noé, E. Improvement in balance using a virtual reality-based stepping exercise: A randomized controlled trial involving individuals with chronic stroke. Clin. Rehabil. 2015, 29, 261–268. [Google Scholar] [CrossRef] [PubMed]
- Lloréns, R.; Noé, E.; Colomer, C.; Alcañiz, M. Effectiveness, usability, and cost-benefit of a virtual reality-based telerehabilitation program for balance recovery after stroke: A randomized controlled trial. Arch. Phys. Med. Rehabil. 2015, 96, 418–425. [Google Scholar] [CrossRef] [PubMed]
- Smith, P.R. Bilinear interpolation of digital images. Ultramicroscopy 1981, 6, 201–204. [Google Scholar] [CrossRef]
- Folstein, M.F.; Folstein, S.E.; McHugh, P.R. “Mini-mental state”. A practical method for grading the cognitive state of patients for the clinician. J. Psychiatr. Res. 1975, 12, 189–198. [Google Scholar] [CrossRef] [PubMed]
- Tyson, S.F.; DeSouza, L.H. Development of the brunel balance assessment: A new measure of balance disability post stroke. Clin. Rehabil. 2004, 18, 801–810. [Google Scholar] [CrossRef] [PubMed]
- Berg, K.; Wood-Dauphinee, S.; Williams, J.I. The balance scale: Reliability assessment with elderly residents and patients with an acute stroke. Scand. J. Rehabil. Med. 1995, 27, 27–36. [Google Scholar] [PubMed]
- Page, A.; de Rosario, H.; Mata, V.; Hoyos, J.V.; Porcar, R. Effect of marker cluster design on the accuracy of human movement analysis using stereophotogrammetry. Med. Biol. Eng. Comput. 2006, 44, 1113–1119. [Google Scholar] [CrossRef] [PubMed]
- Cappozzo, A.; Della Croce, U.; Leardini, A.; Chiari, L. Human movement analysis using stereophotogrammetry. Part 1: Theoretical background. Gait Posture 2005, 21, 186–196. [Google Scholar] [PubMed]
- Gabel, M.; Gilad-Bachrach, R.; Renshaw, E.; Schuster, A. Full Body Gait Analysis with Kinect. In Proceedings of the 2012 Annual International Conference of the IEEE Engineering in Medicine and Biology Society (EMBC), San Diego, CA, USA, 28 August–1 September 2012; pp. 1964–1967.
- Fiorillo, F. Characterization and Measurement of Magnetic Materials, 1st ed.; Elsevier: Amsterdam, The Netherlands, 2004. [Google Scholar]
- Han, C.; Wang, Q.; Meng, P.P.; Qi, M.Z. Effects of intensity of arm training on hemiplegic upper extremity motor recovery in stroke patients: A randomized controlled trial. Clin. Rehabil. 2013, 27, 75–81. [Google Scholar] [CrossRef] [PubMed]
- Kwakkel, G.; Wagenaar, R.C.; Koelman, T.W.; Lankhorst, G.J.; Koetsier, J.C. Effects of intensity of rehabilitation after stroke. A research synthesis. Stroke 1997, 28, 1550–1556. [Google Scholar] [CrossRef] [PubMed]
- Kwakkel, G. Impact of intensity of practice after stroke: Issues for consideration. Disabil. Rehabil. 2006, 28, 823–830. [Google Scholar] [CrossRef] [PubMed]
- Chemerinski, E.; Levine, S.R. Neuropsychiatric disorders following vascular brain injury. Mount Sinai J. Med. N. Y. 2006, 73, 1006–1014. [Google Scholar]
- Flaster, M.; Sharma, A.; Rao, M. Poststroke depression: A review emphasizing the role of prophylactic treatment and synergy with treatment for motor recovery. Top. Stroke Rehabil. 2013, 20, 139–150. [Google Scholar] [CrossRef] [PubMed]
- Winstein, C.J.; Merians, A.S.; Sullivan, K.J. Motor learning after unilateral brain damage. Neuropsychologia 1999, 37, 975–987. [Google Scholar] [CrossRef] [PubMed]
© 2015 by the authors; licensee MDPI, Basel, Switzerland. This article is an open access article distributed under the terms and conditions of the Creative Commons Attribution license (http://creativecommons.org/licenses/by/4.0/).
Share and Cite
Lloréns, R.; Noé, E.; Naranjo, V.; Borrego, A.; Latorre, J.; Alcañiz, M. Tracking Systems for Virtual Rehabilitation: Objective Performance vs. Subjective Experience. A Practical Scenario. Sensors 2015, 15, 6586-6606. https://doi.org/10.3390/s150306586
Lloréns R, Noé E, Naranjo V, Borrego A, Latorre J, Alcañiz M. Tracking Systems for Virtual Rehabilitation: Objective Performance vs. Subjective Experience. A Practical Scenario. Sensors. 2015; 15(3):6586-6606. https://doi.org/10.3390/s150306586
Chicago/Turabian StyleLloréns, Roberto, Enrique Noé, Valery Naranjo, Adrián Borrego, Jorge Latorre, and Mariano Alcañiz. 2015. "Tracking Systems for Virtual Rehabilitation: Objective Performance vs. Subjective Experience. A Practical Scenario" Sensors 15, no. 3: 6586-6606. https://doi.org/10.3390/s150306586