
Towards Contactless Silent Speech Recognition Based on Detection of Active and Visible Articulators Using IR-UWB Radar


Abstract
:1. Introduction
2. Method
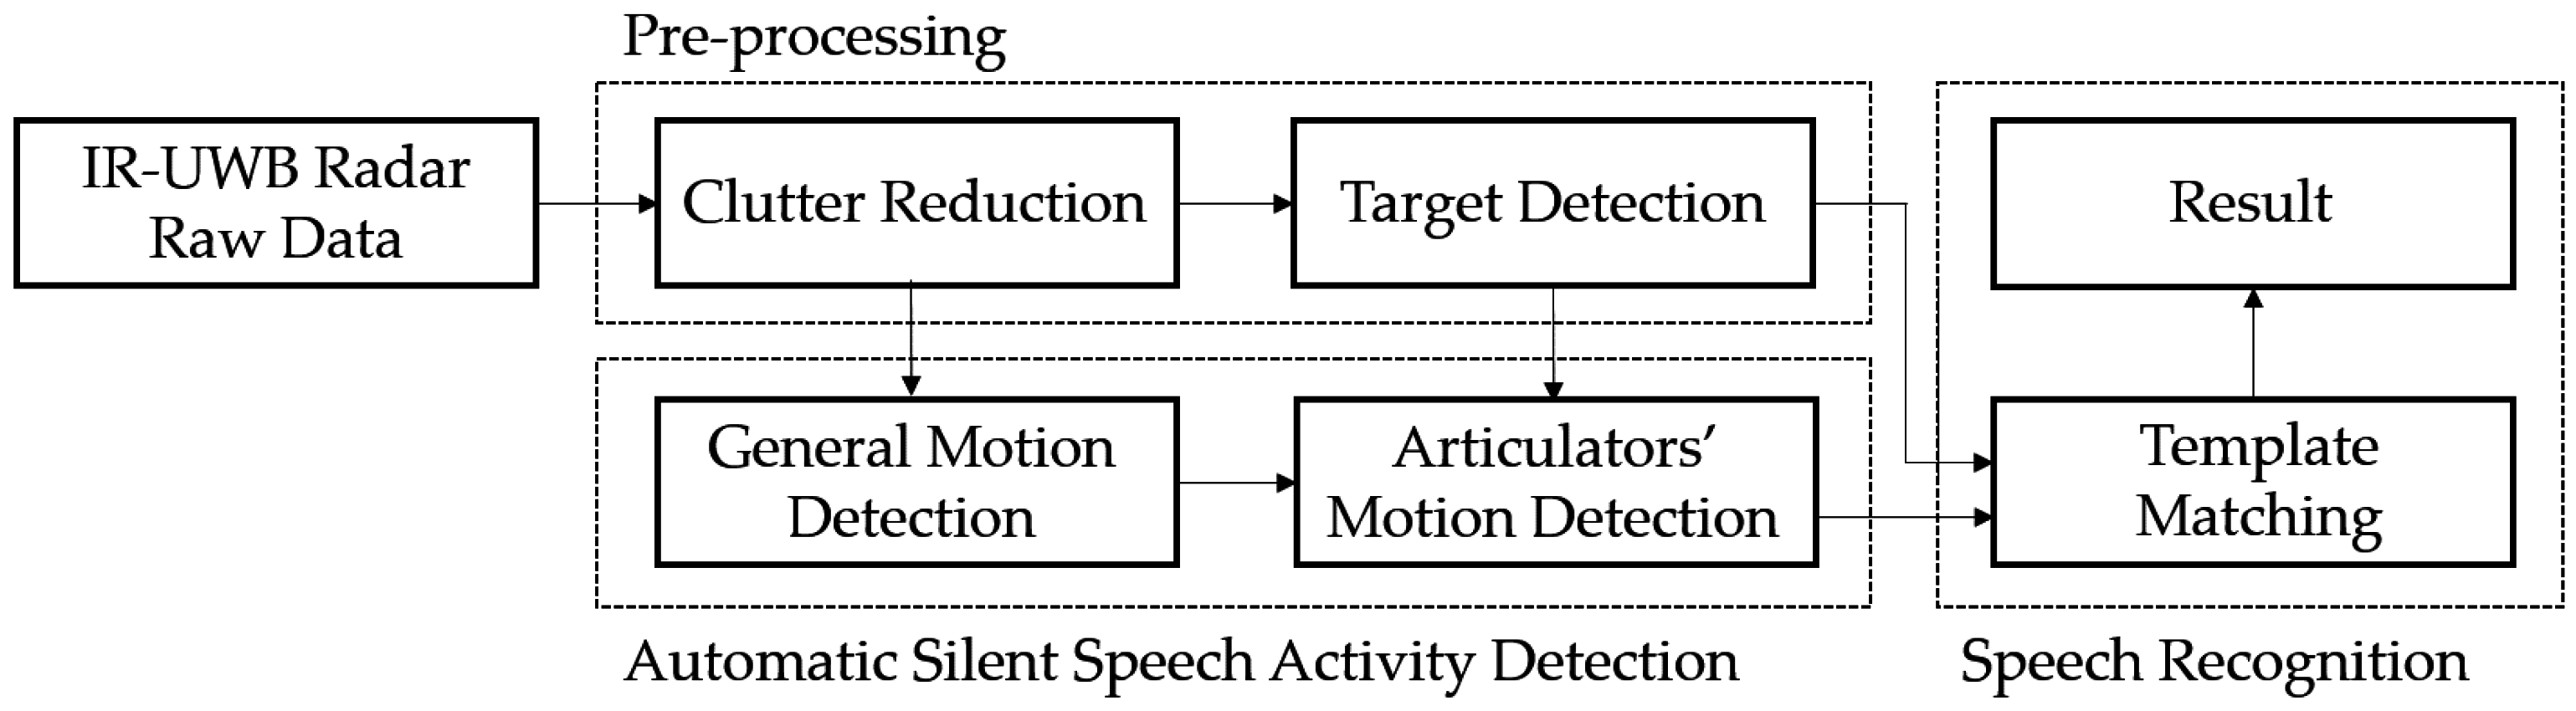
2.1. Overview
2.2. Pre-Processing Algorithm
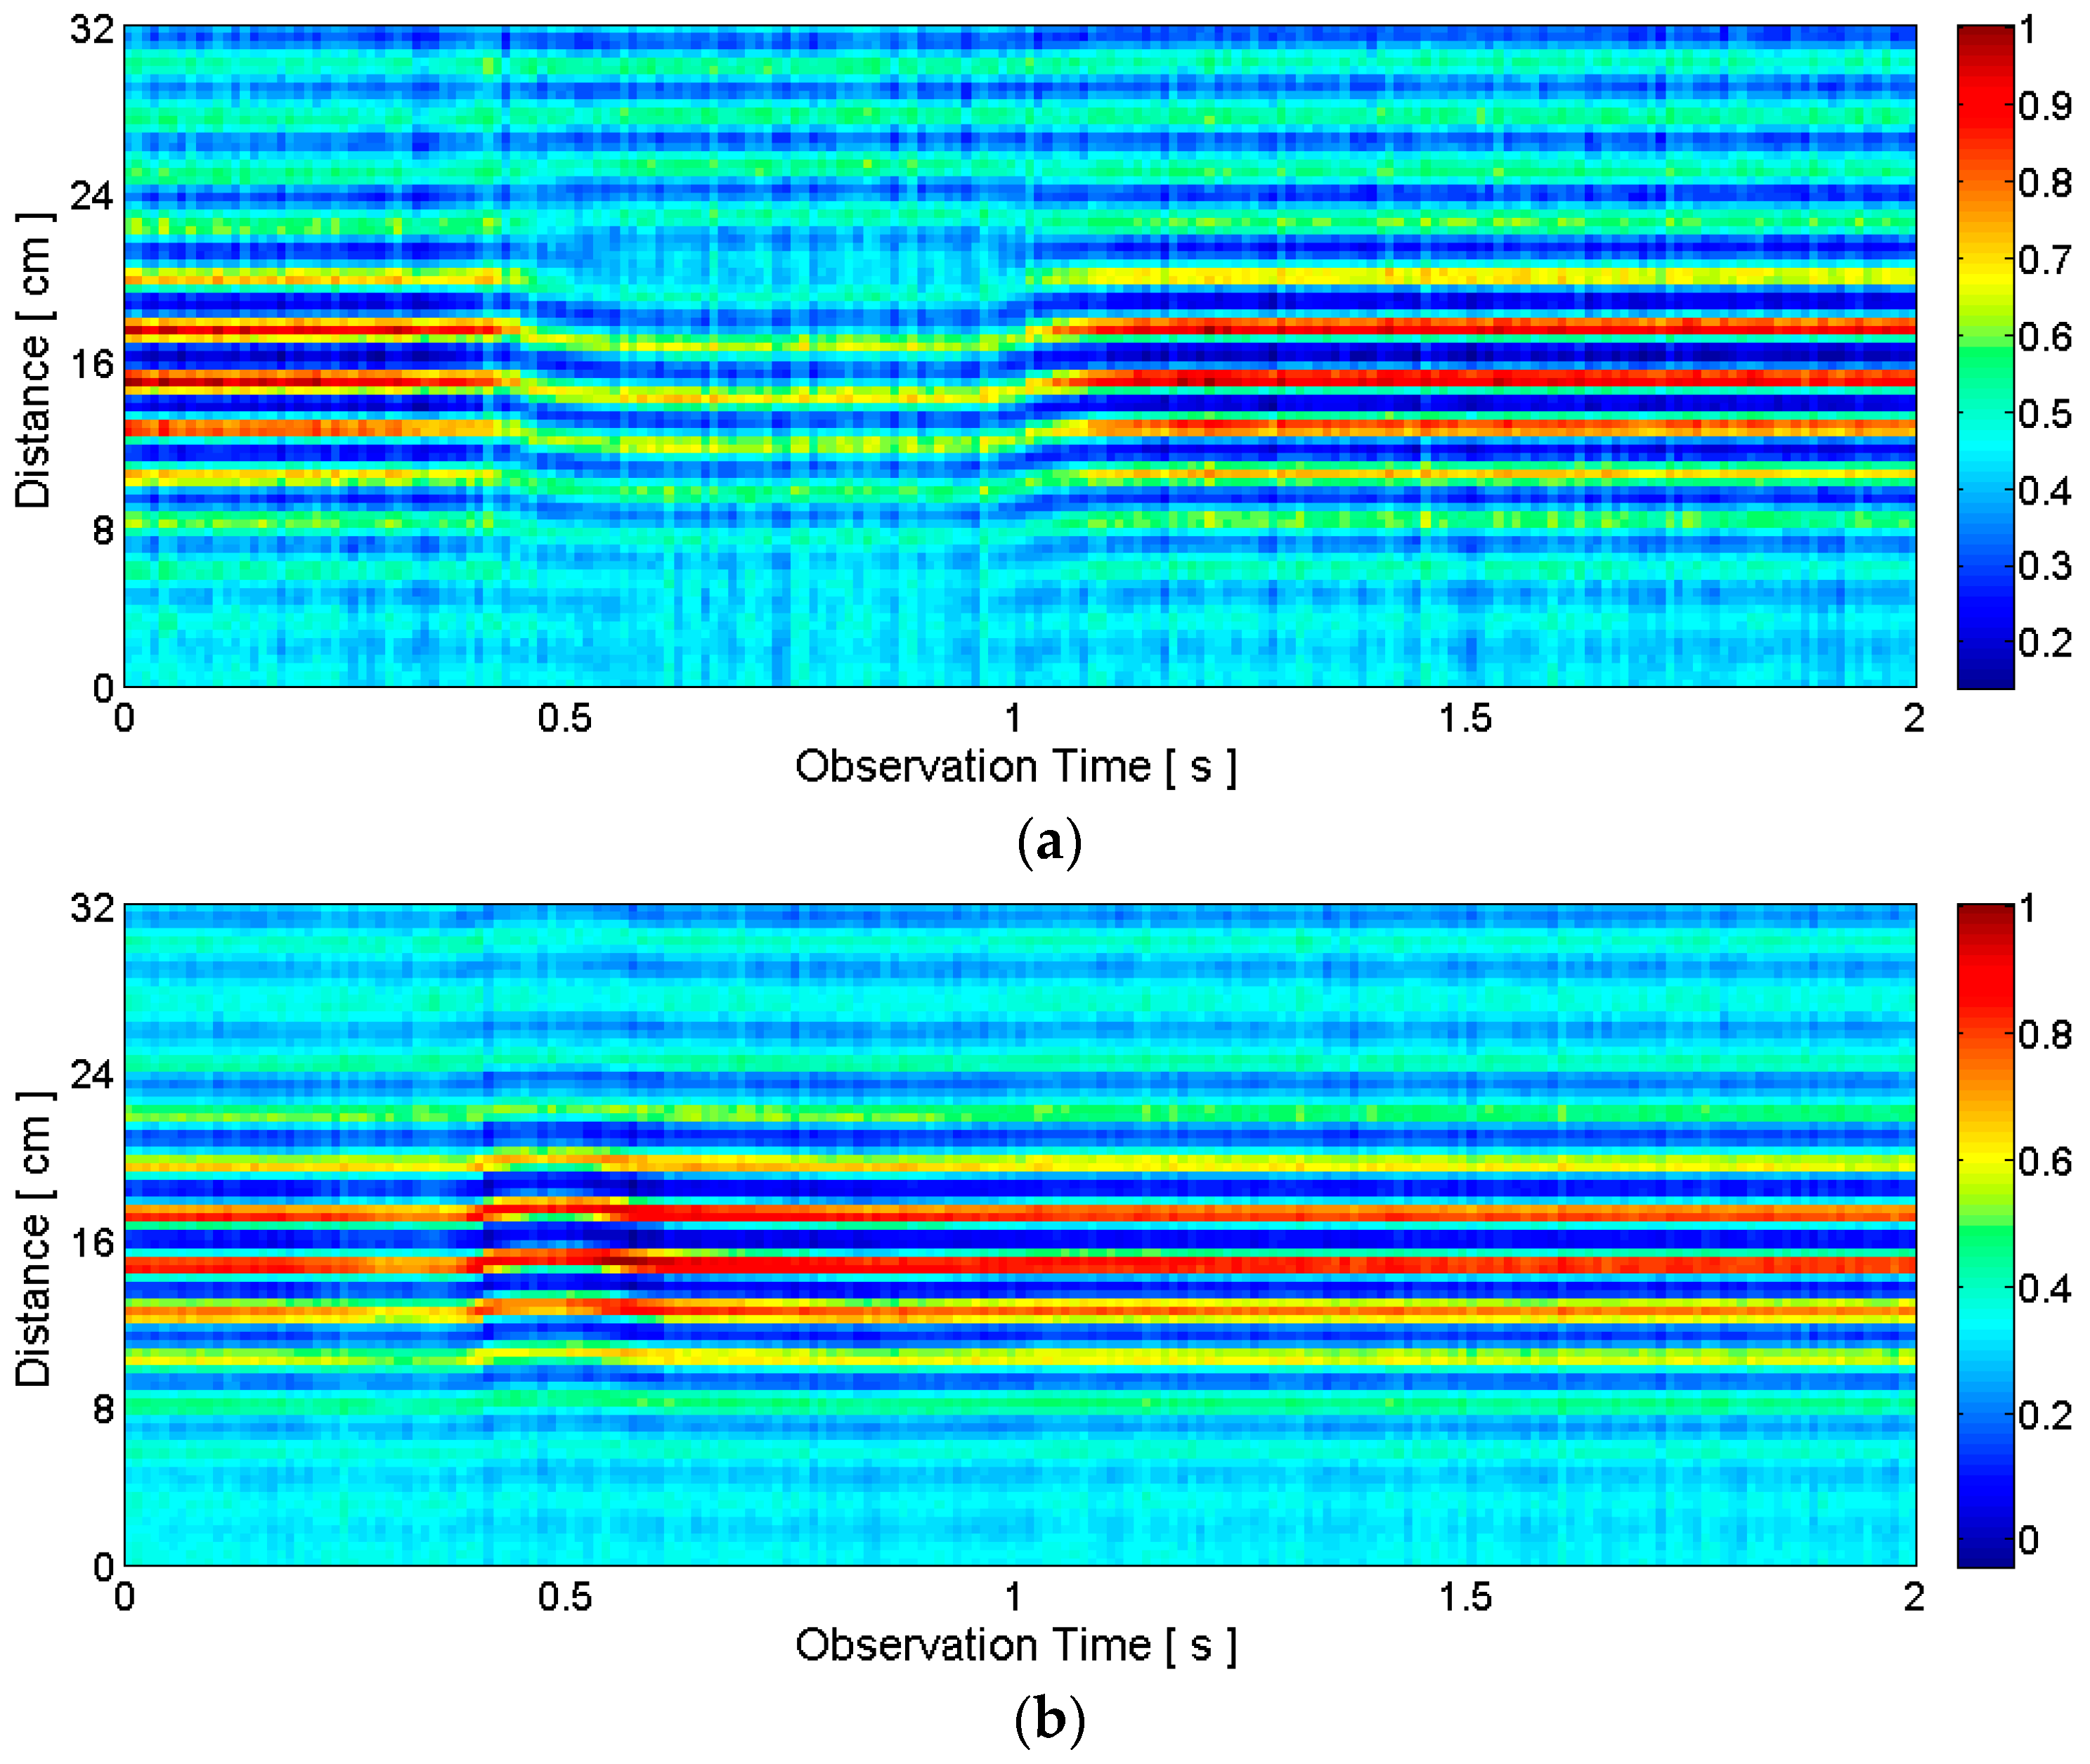
2.2.1. IR-UWB Radar Waveform Model
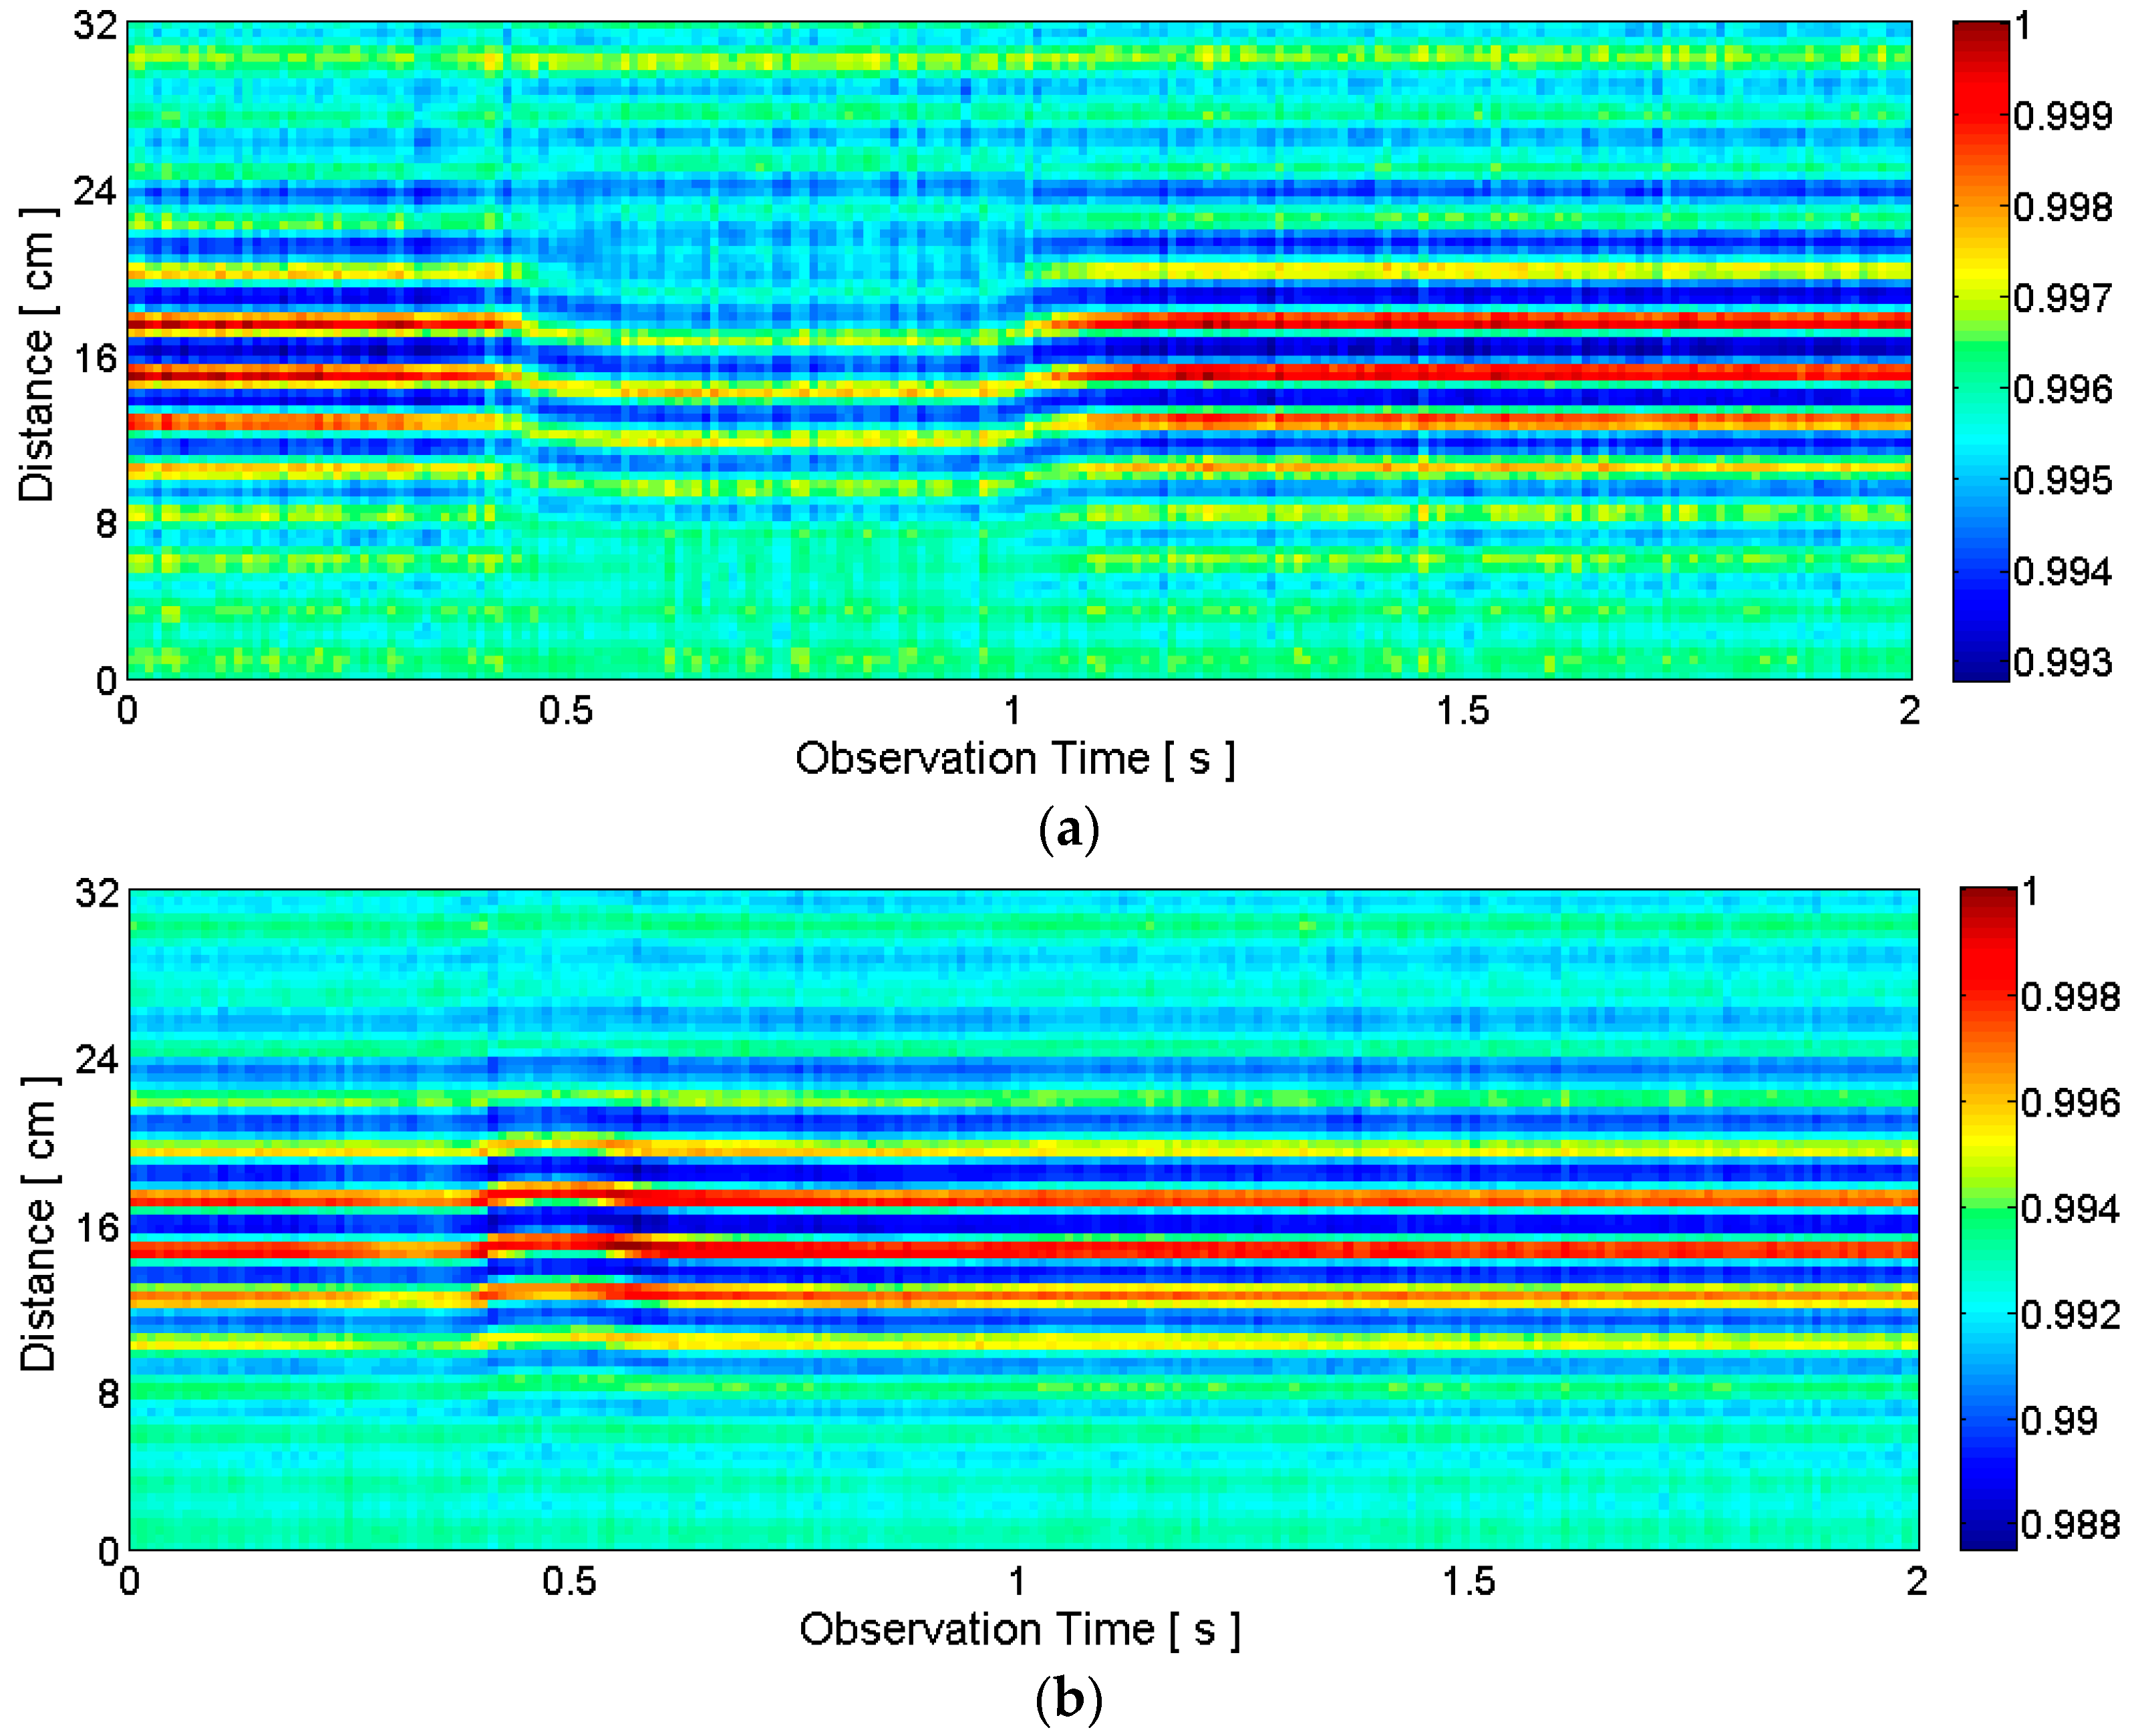
2.2.2. Clutter Reduction
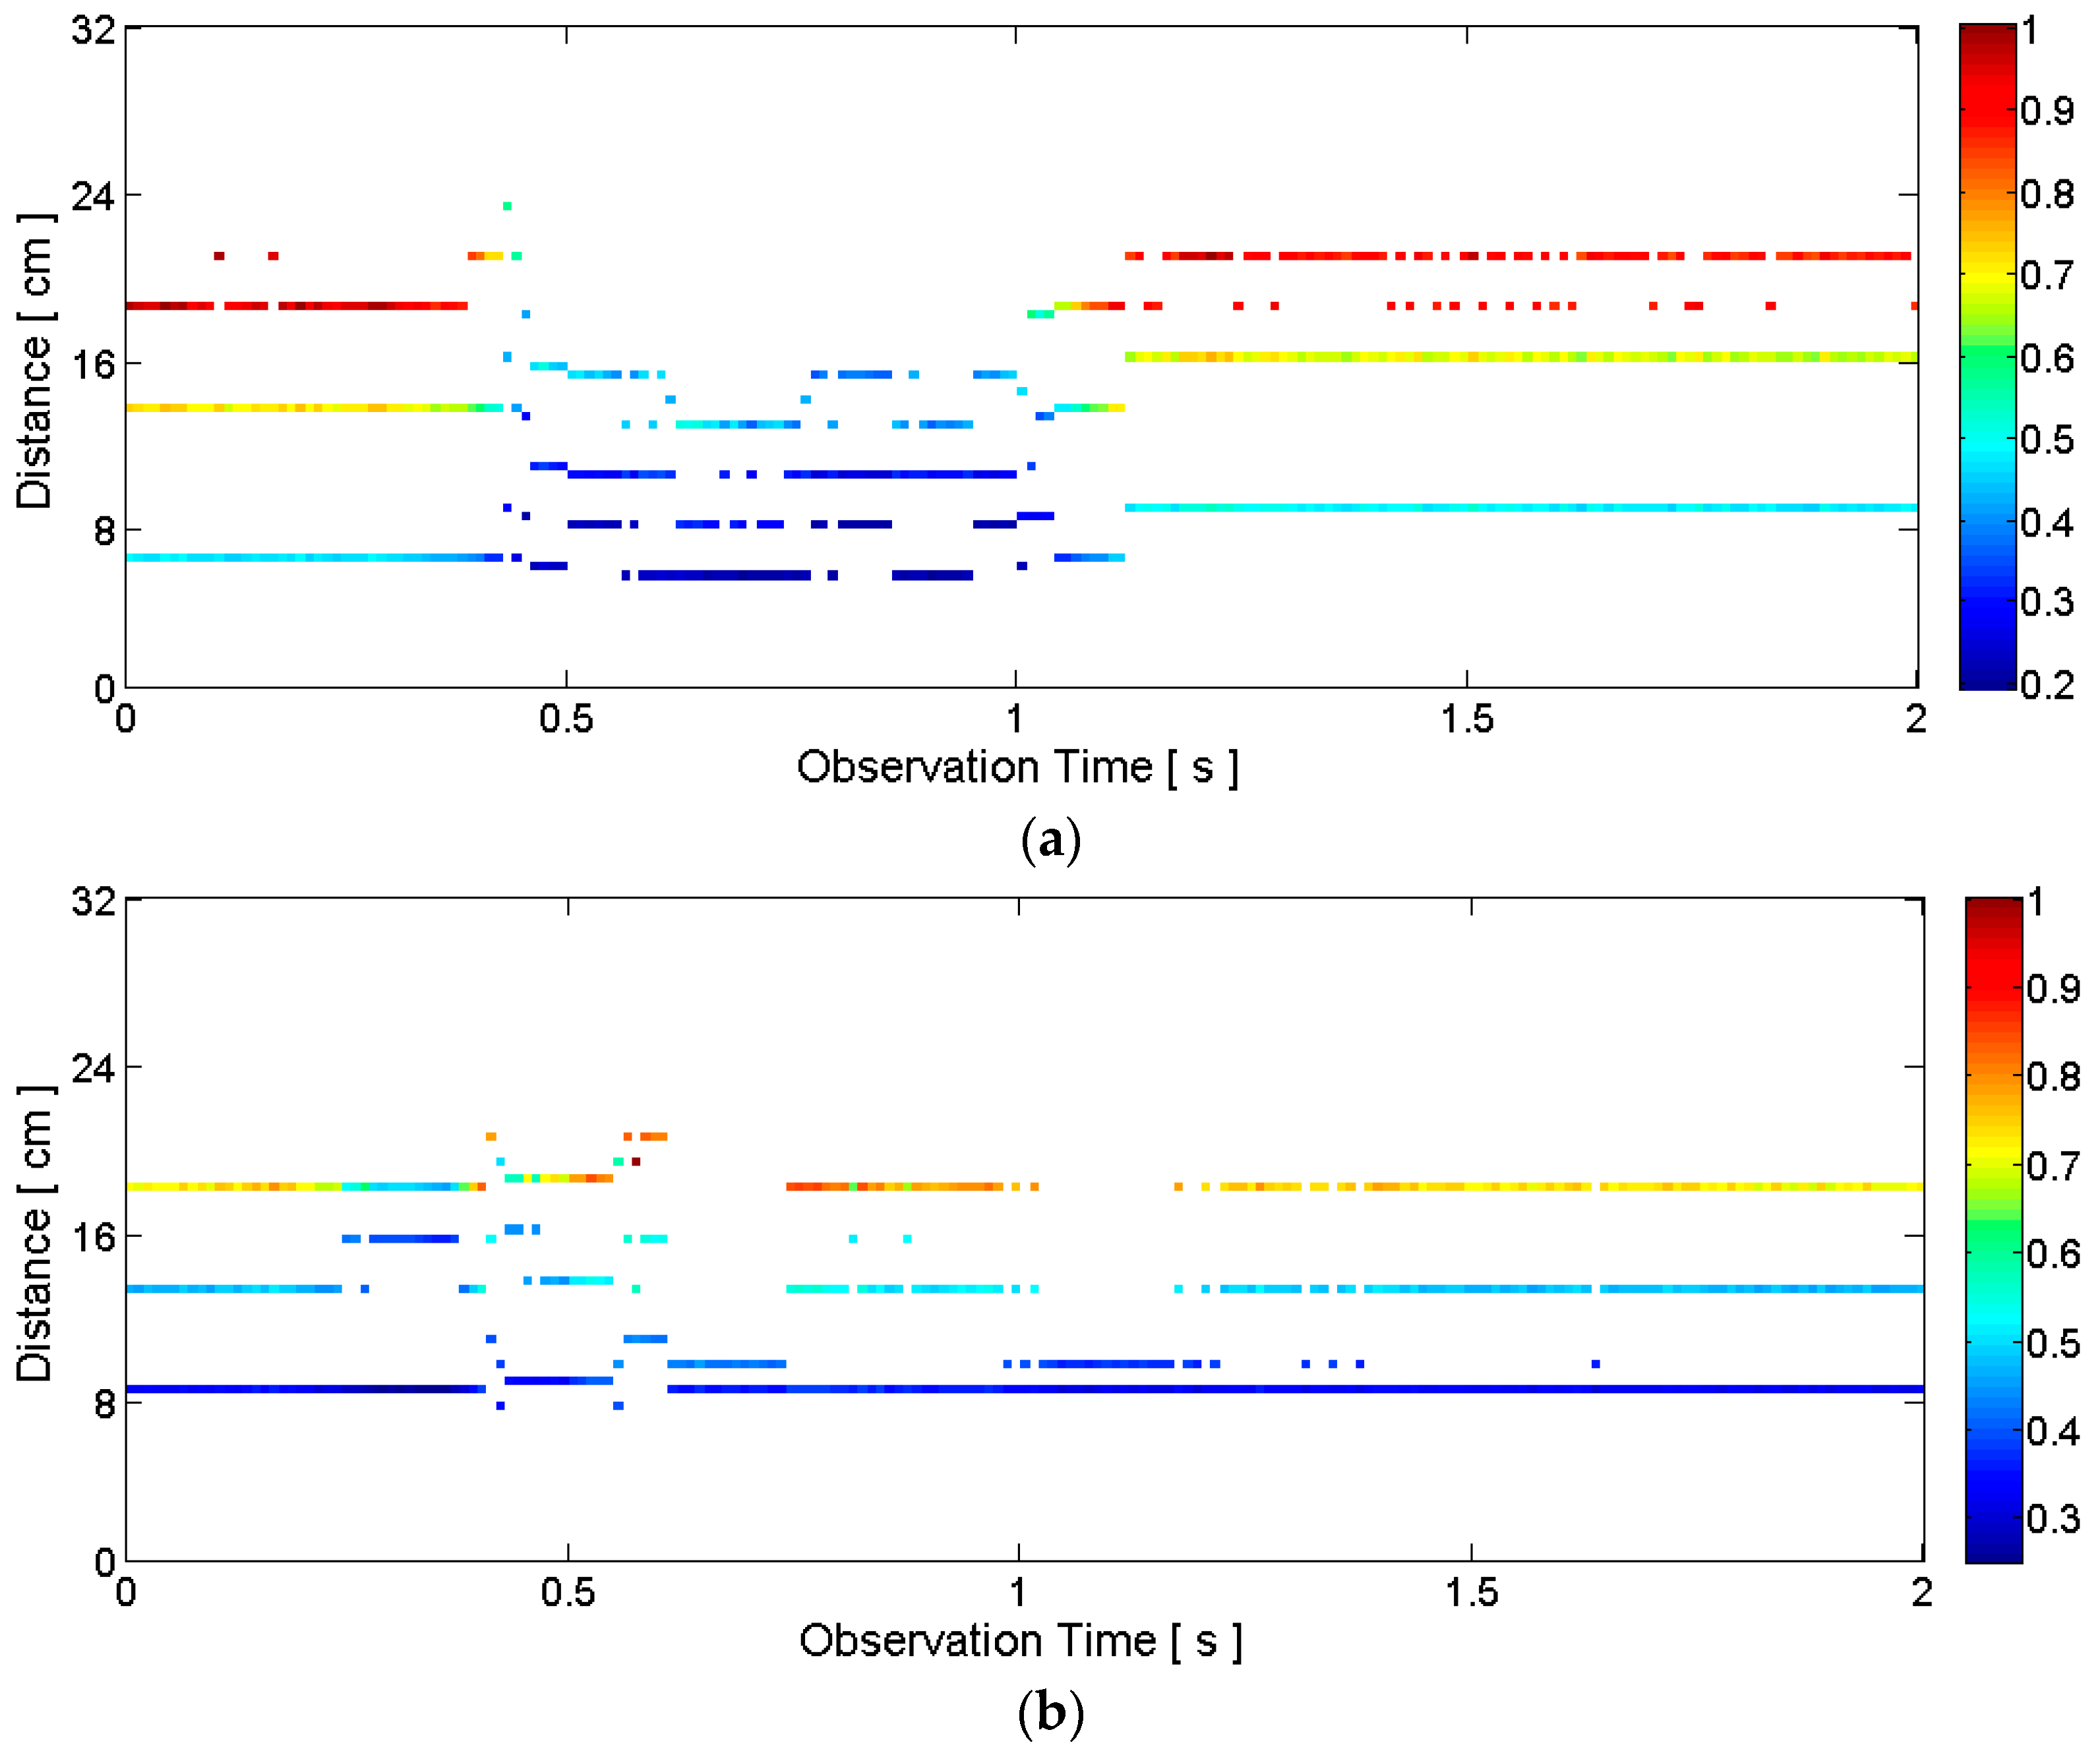
2.2.3. Target Detection
- (1)
- Obtain the sampled values of a transmitting pulse that is not reflected by any object as CLEAN template v[n]. This template can be obtained by directly connecting the transmitter and receiver part of the radar by a cable.
- (2)
- Initialize the dirty map, clean map, user-defined stop threshold, and iteration counter as d0[n] = y[n], c0[n] = 0, Tstop and i = 1, respectively.
- (3)
- Compute the normalized cross-correlation between the dirty map and CLEAN template:
- (4)
- Find the maximum correlation value and its argument:
- (5)
- If ai < Tstop, stop. Go to Step 9.
- (6)
- Clean the dirty map by subtracting the template modified by ai and ni from it: di[n] = di-1[n] − aiv[n − ni].
- (7)
- Update the clean map: ci[n] = ci-1[n] + aiδ[n − ni], where δ is the Dirac delta function.
- (8)
- Increase the iteration counter i = i + 1, and return to Step 3.
- (9)
- When the iteration stops, store clean map ci[n].
- (1)
- Obtain the conventional CLEAN template; then generate short template vs[n].
- (2)
- Compute the normalized cross-correlation between y[n] and the short template:
- (3)
- Find the maximum correlation value and its argument:
- (4)
- Store the clean map: c[n] = amax δ [n − nmax].
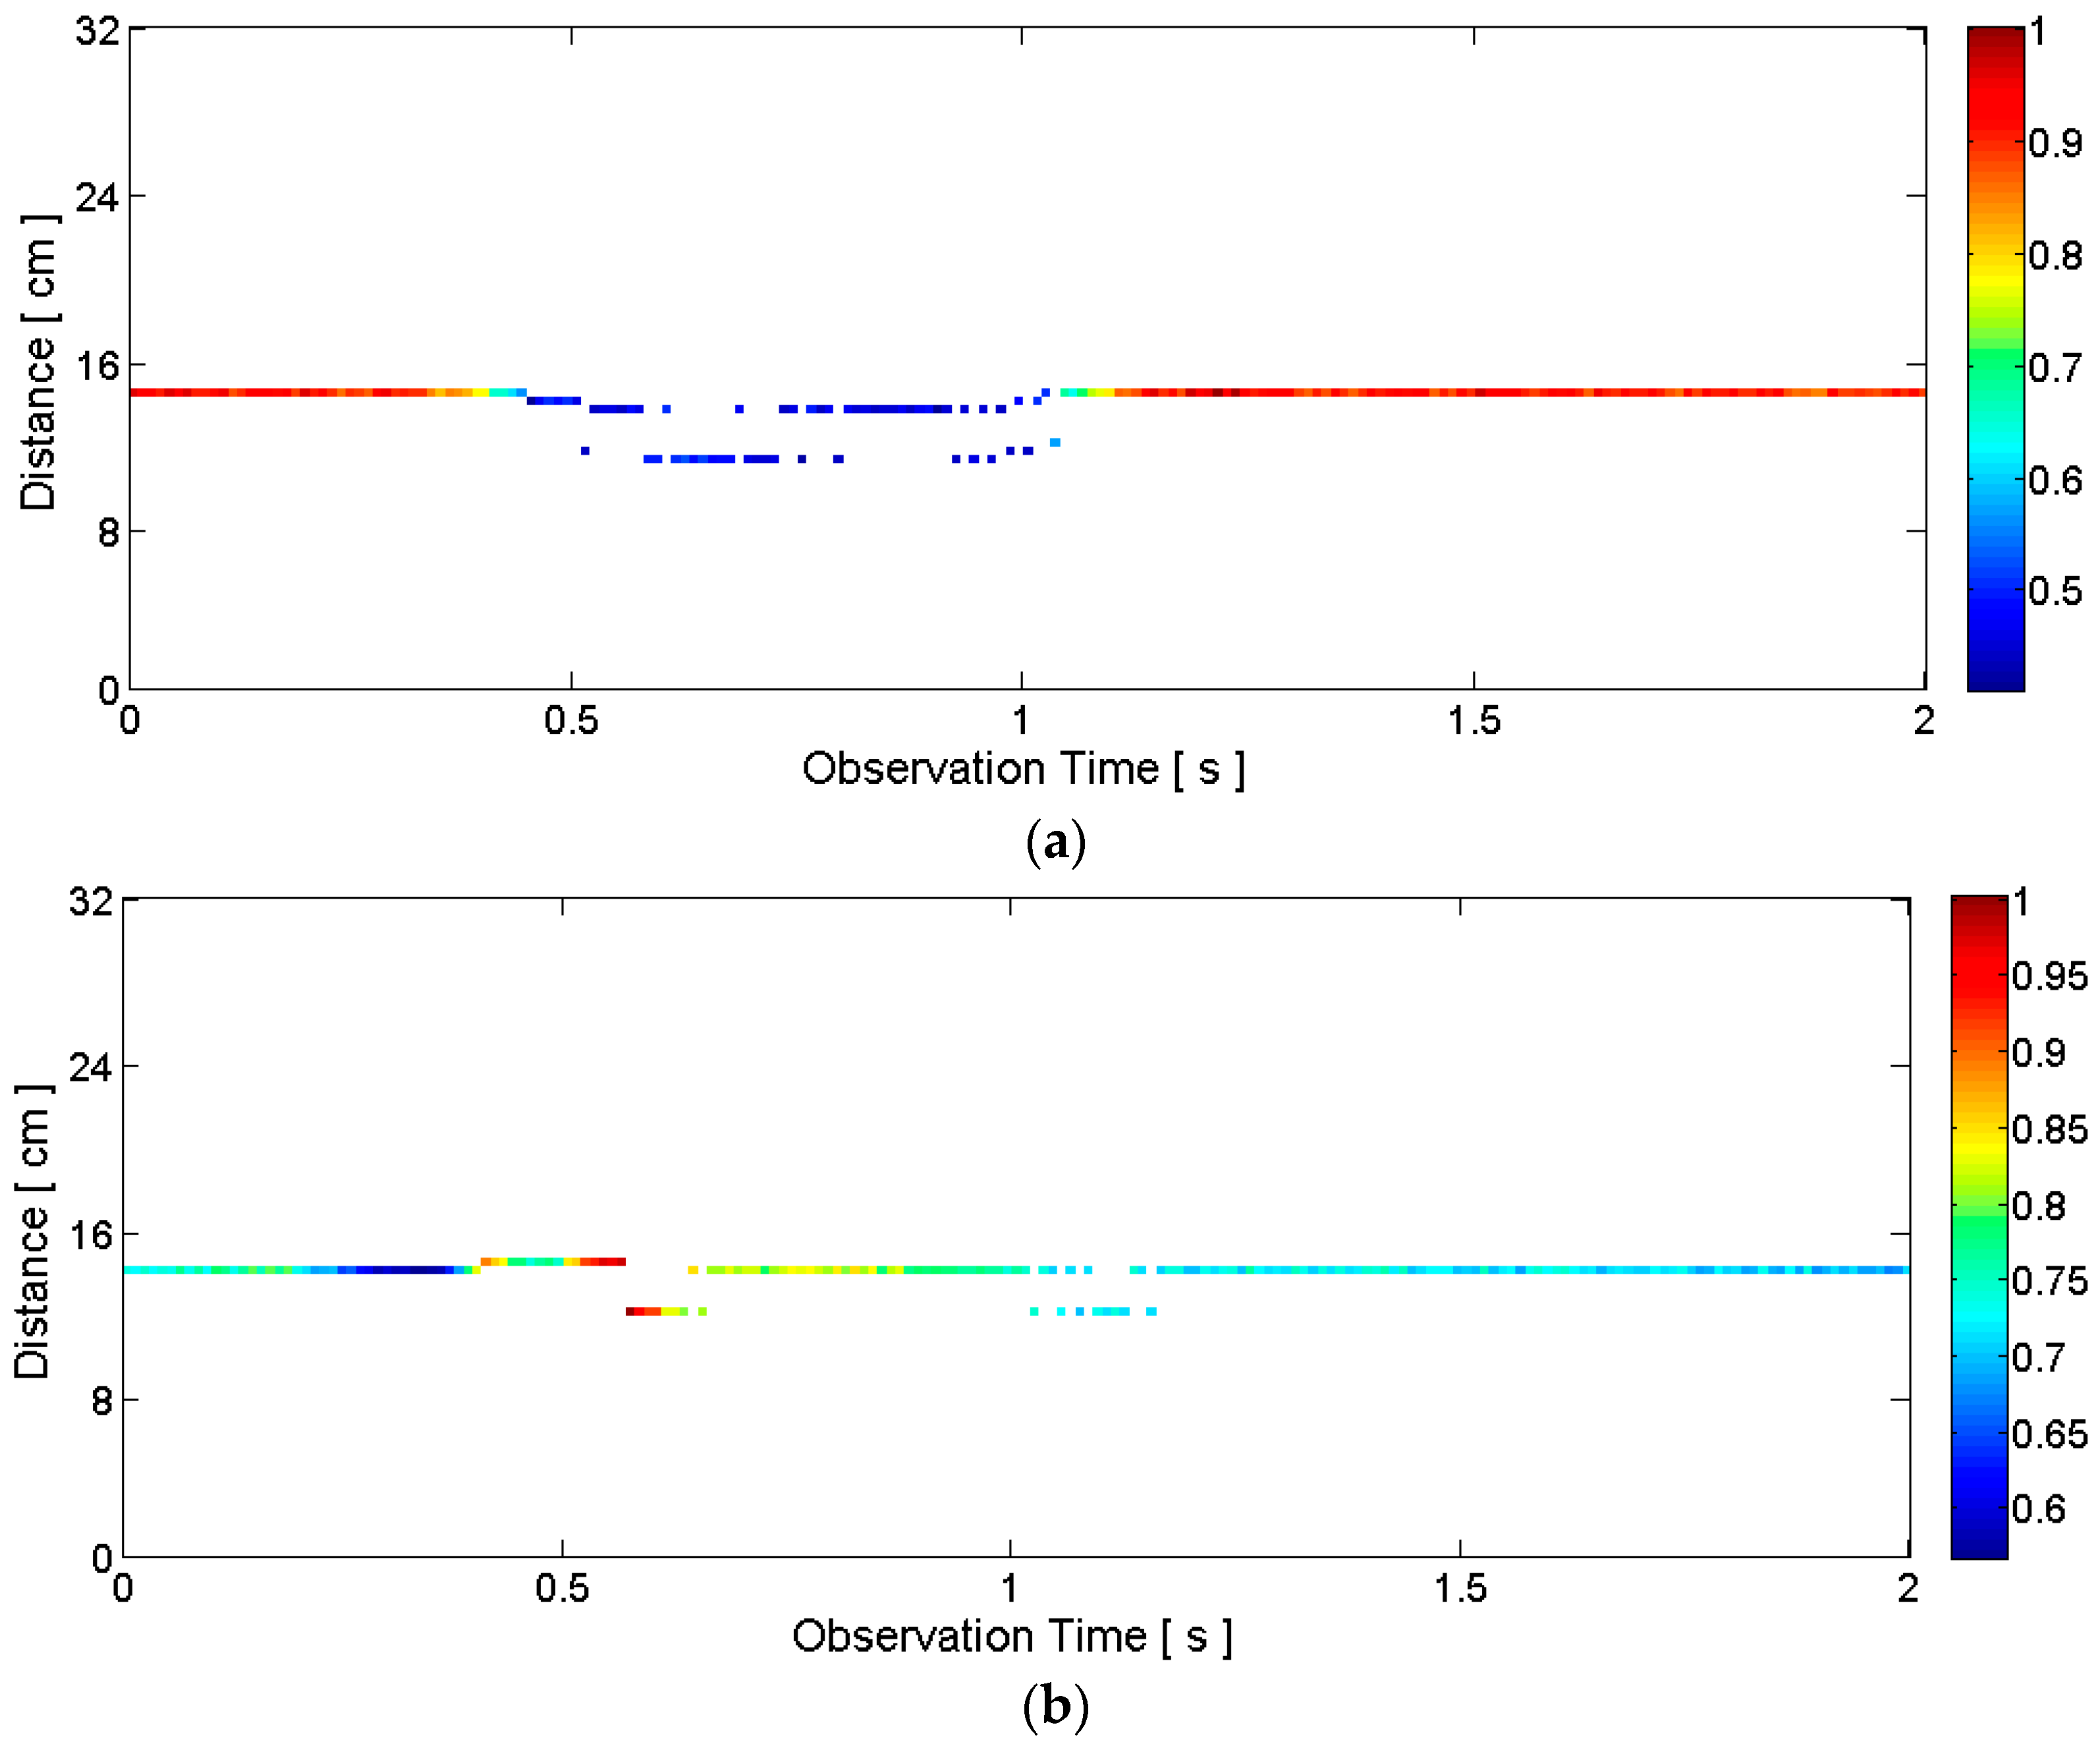
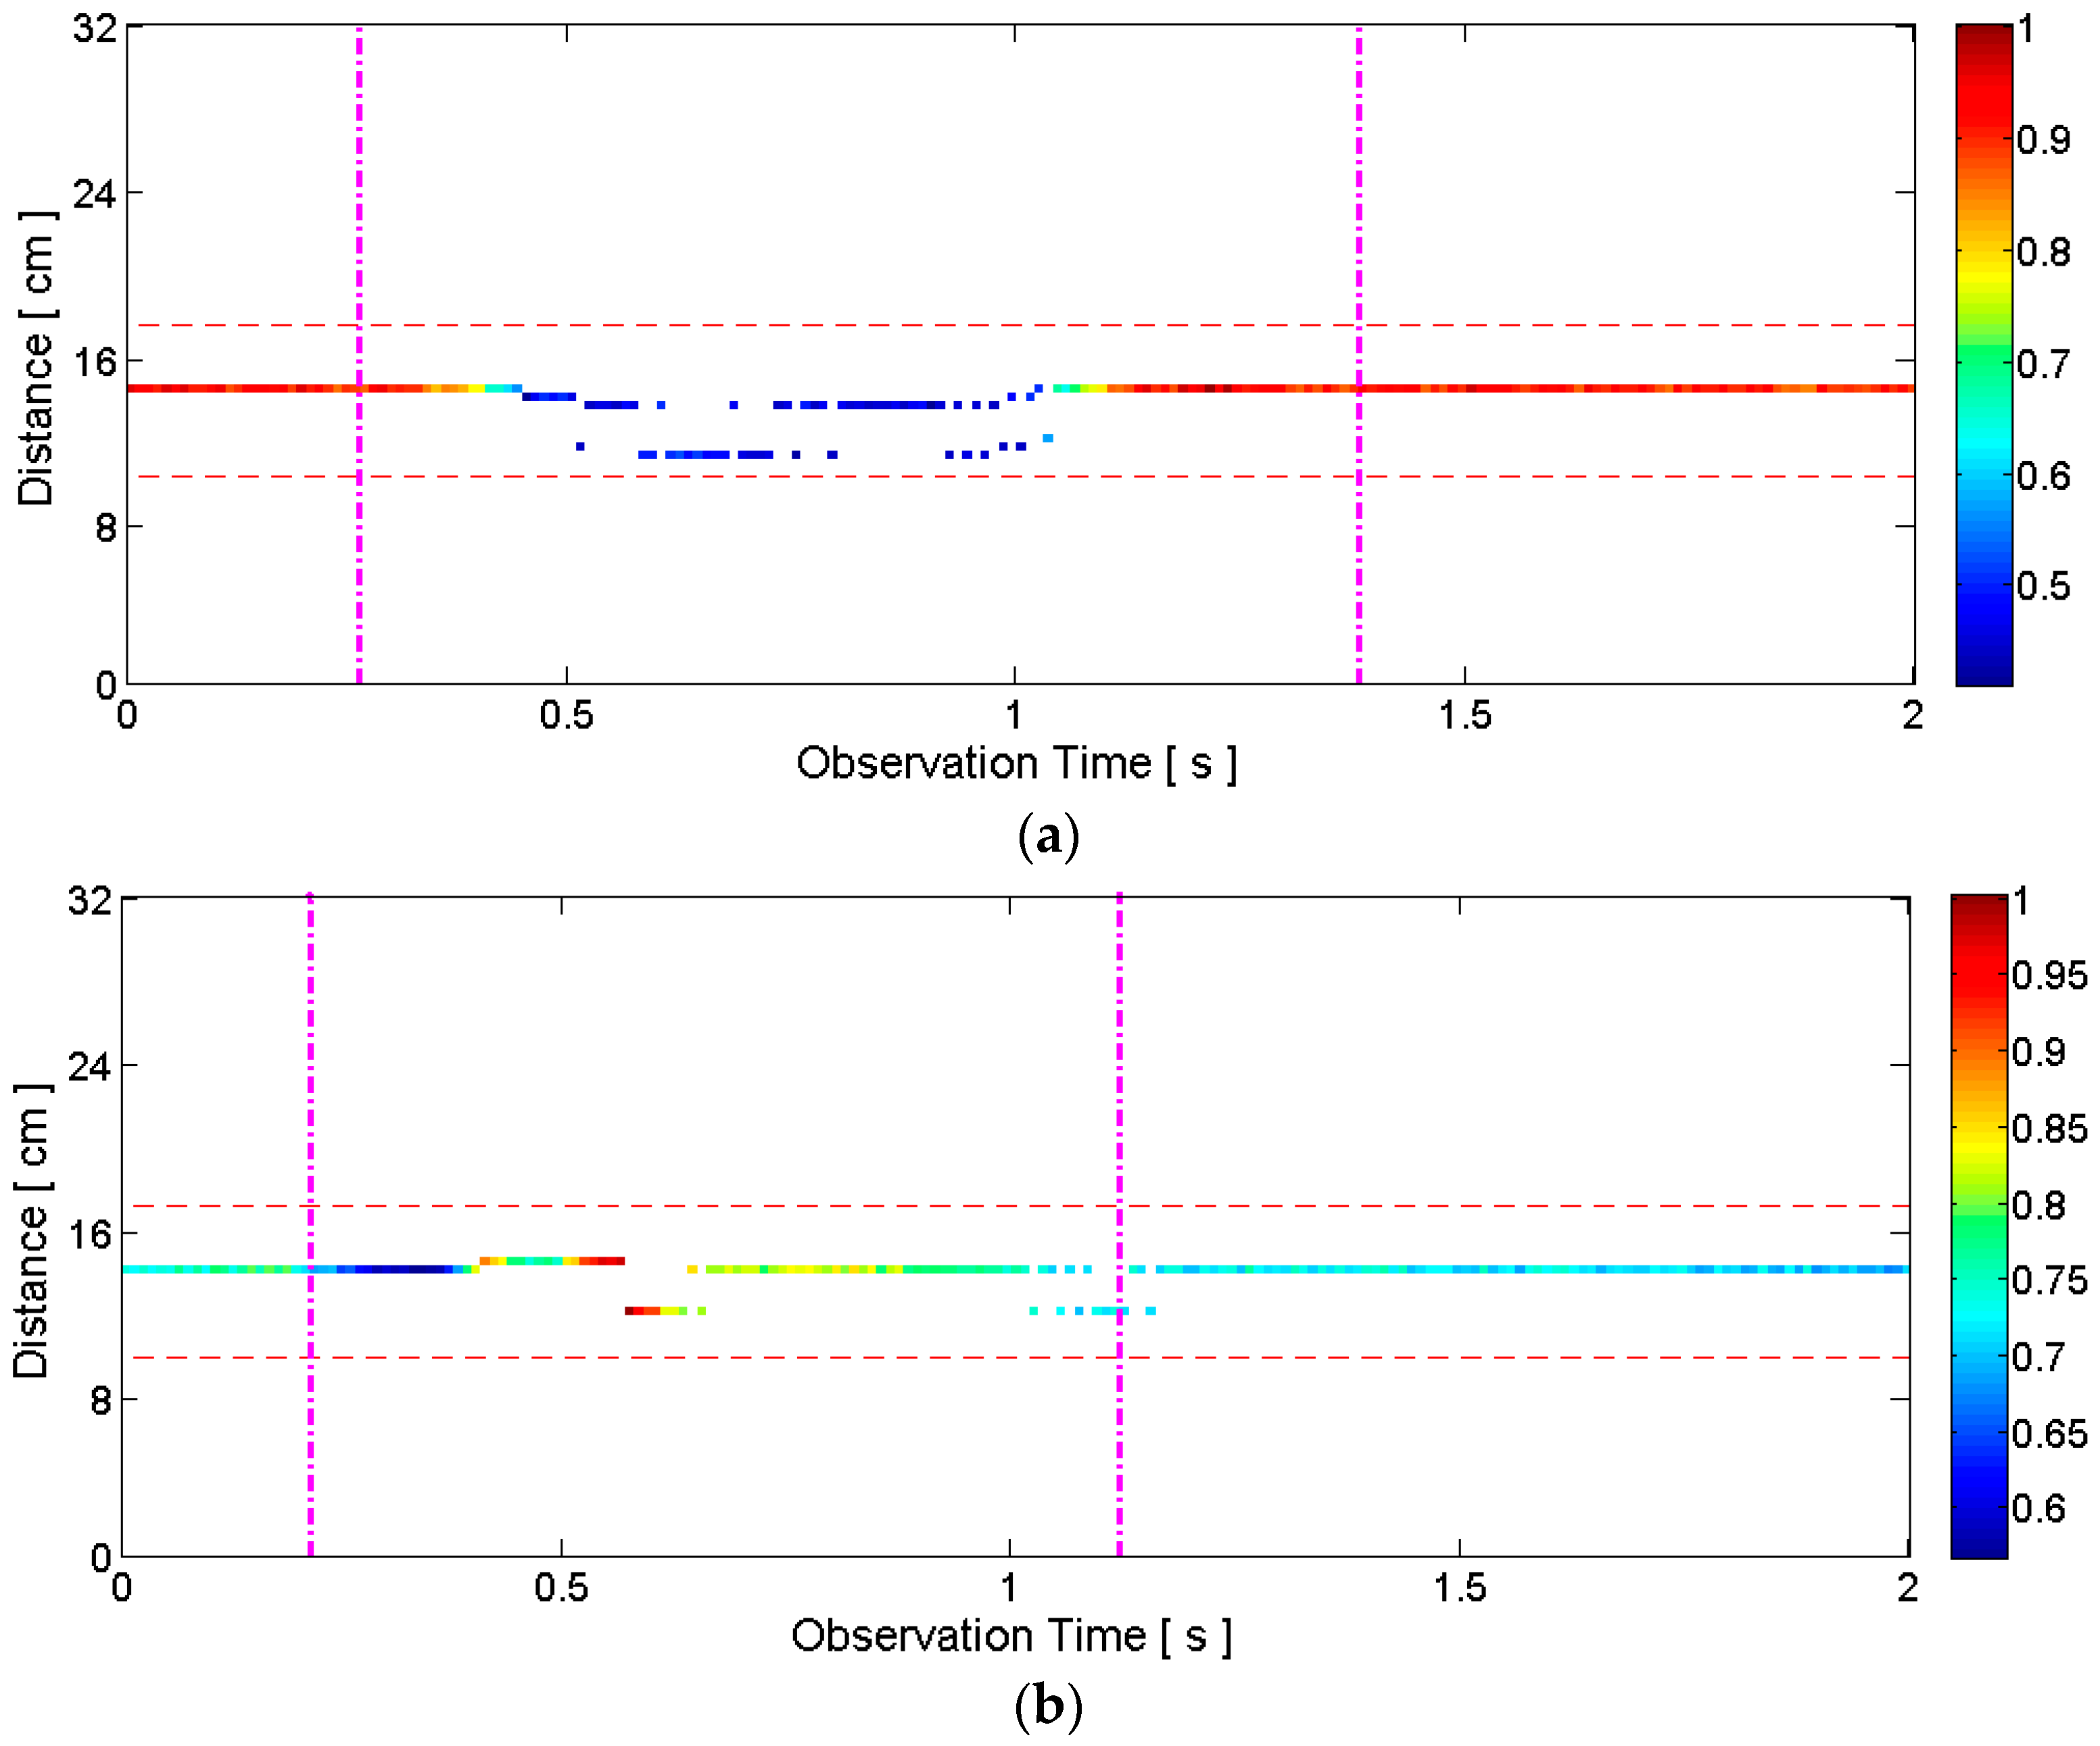
2.3. Automatic Silent Speech Activity Detection
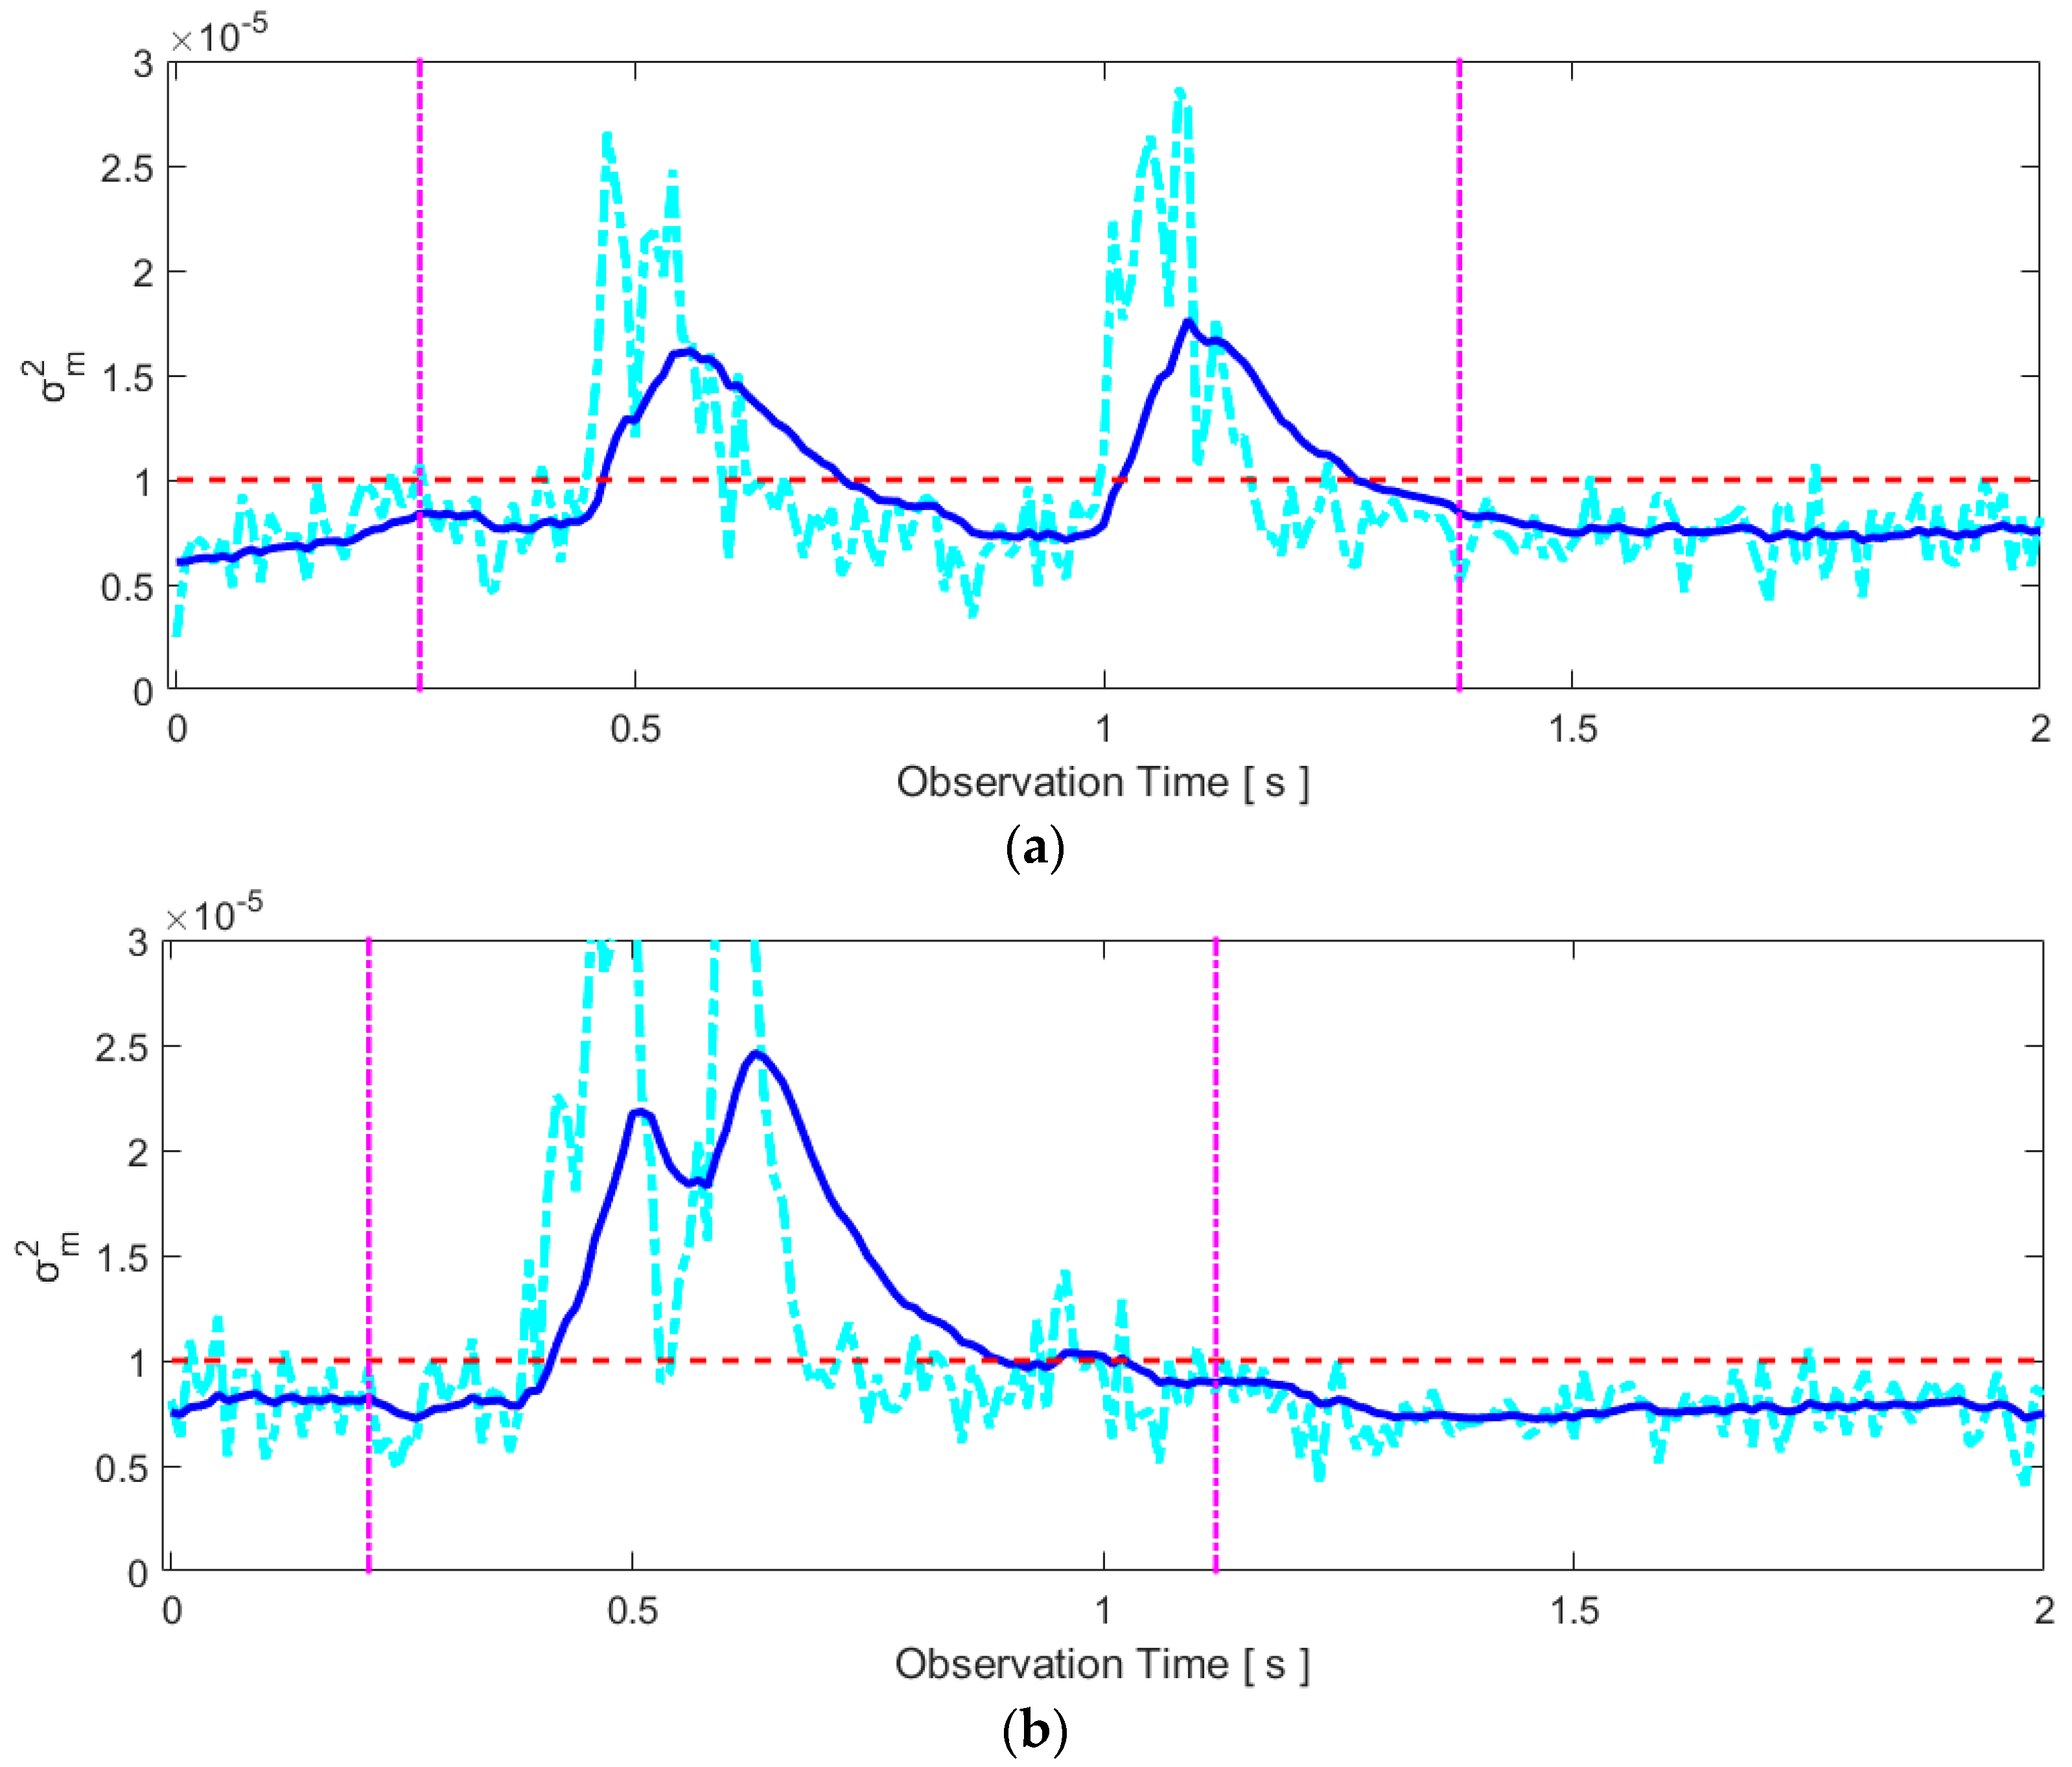
2.3.1. General Motion Detection
2.3.2. Articulators’ Motion Detection
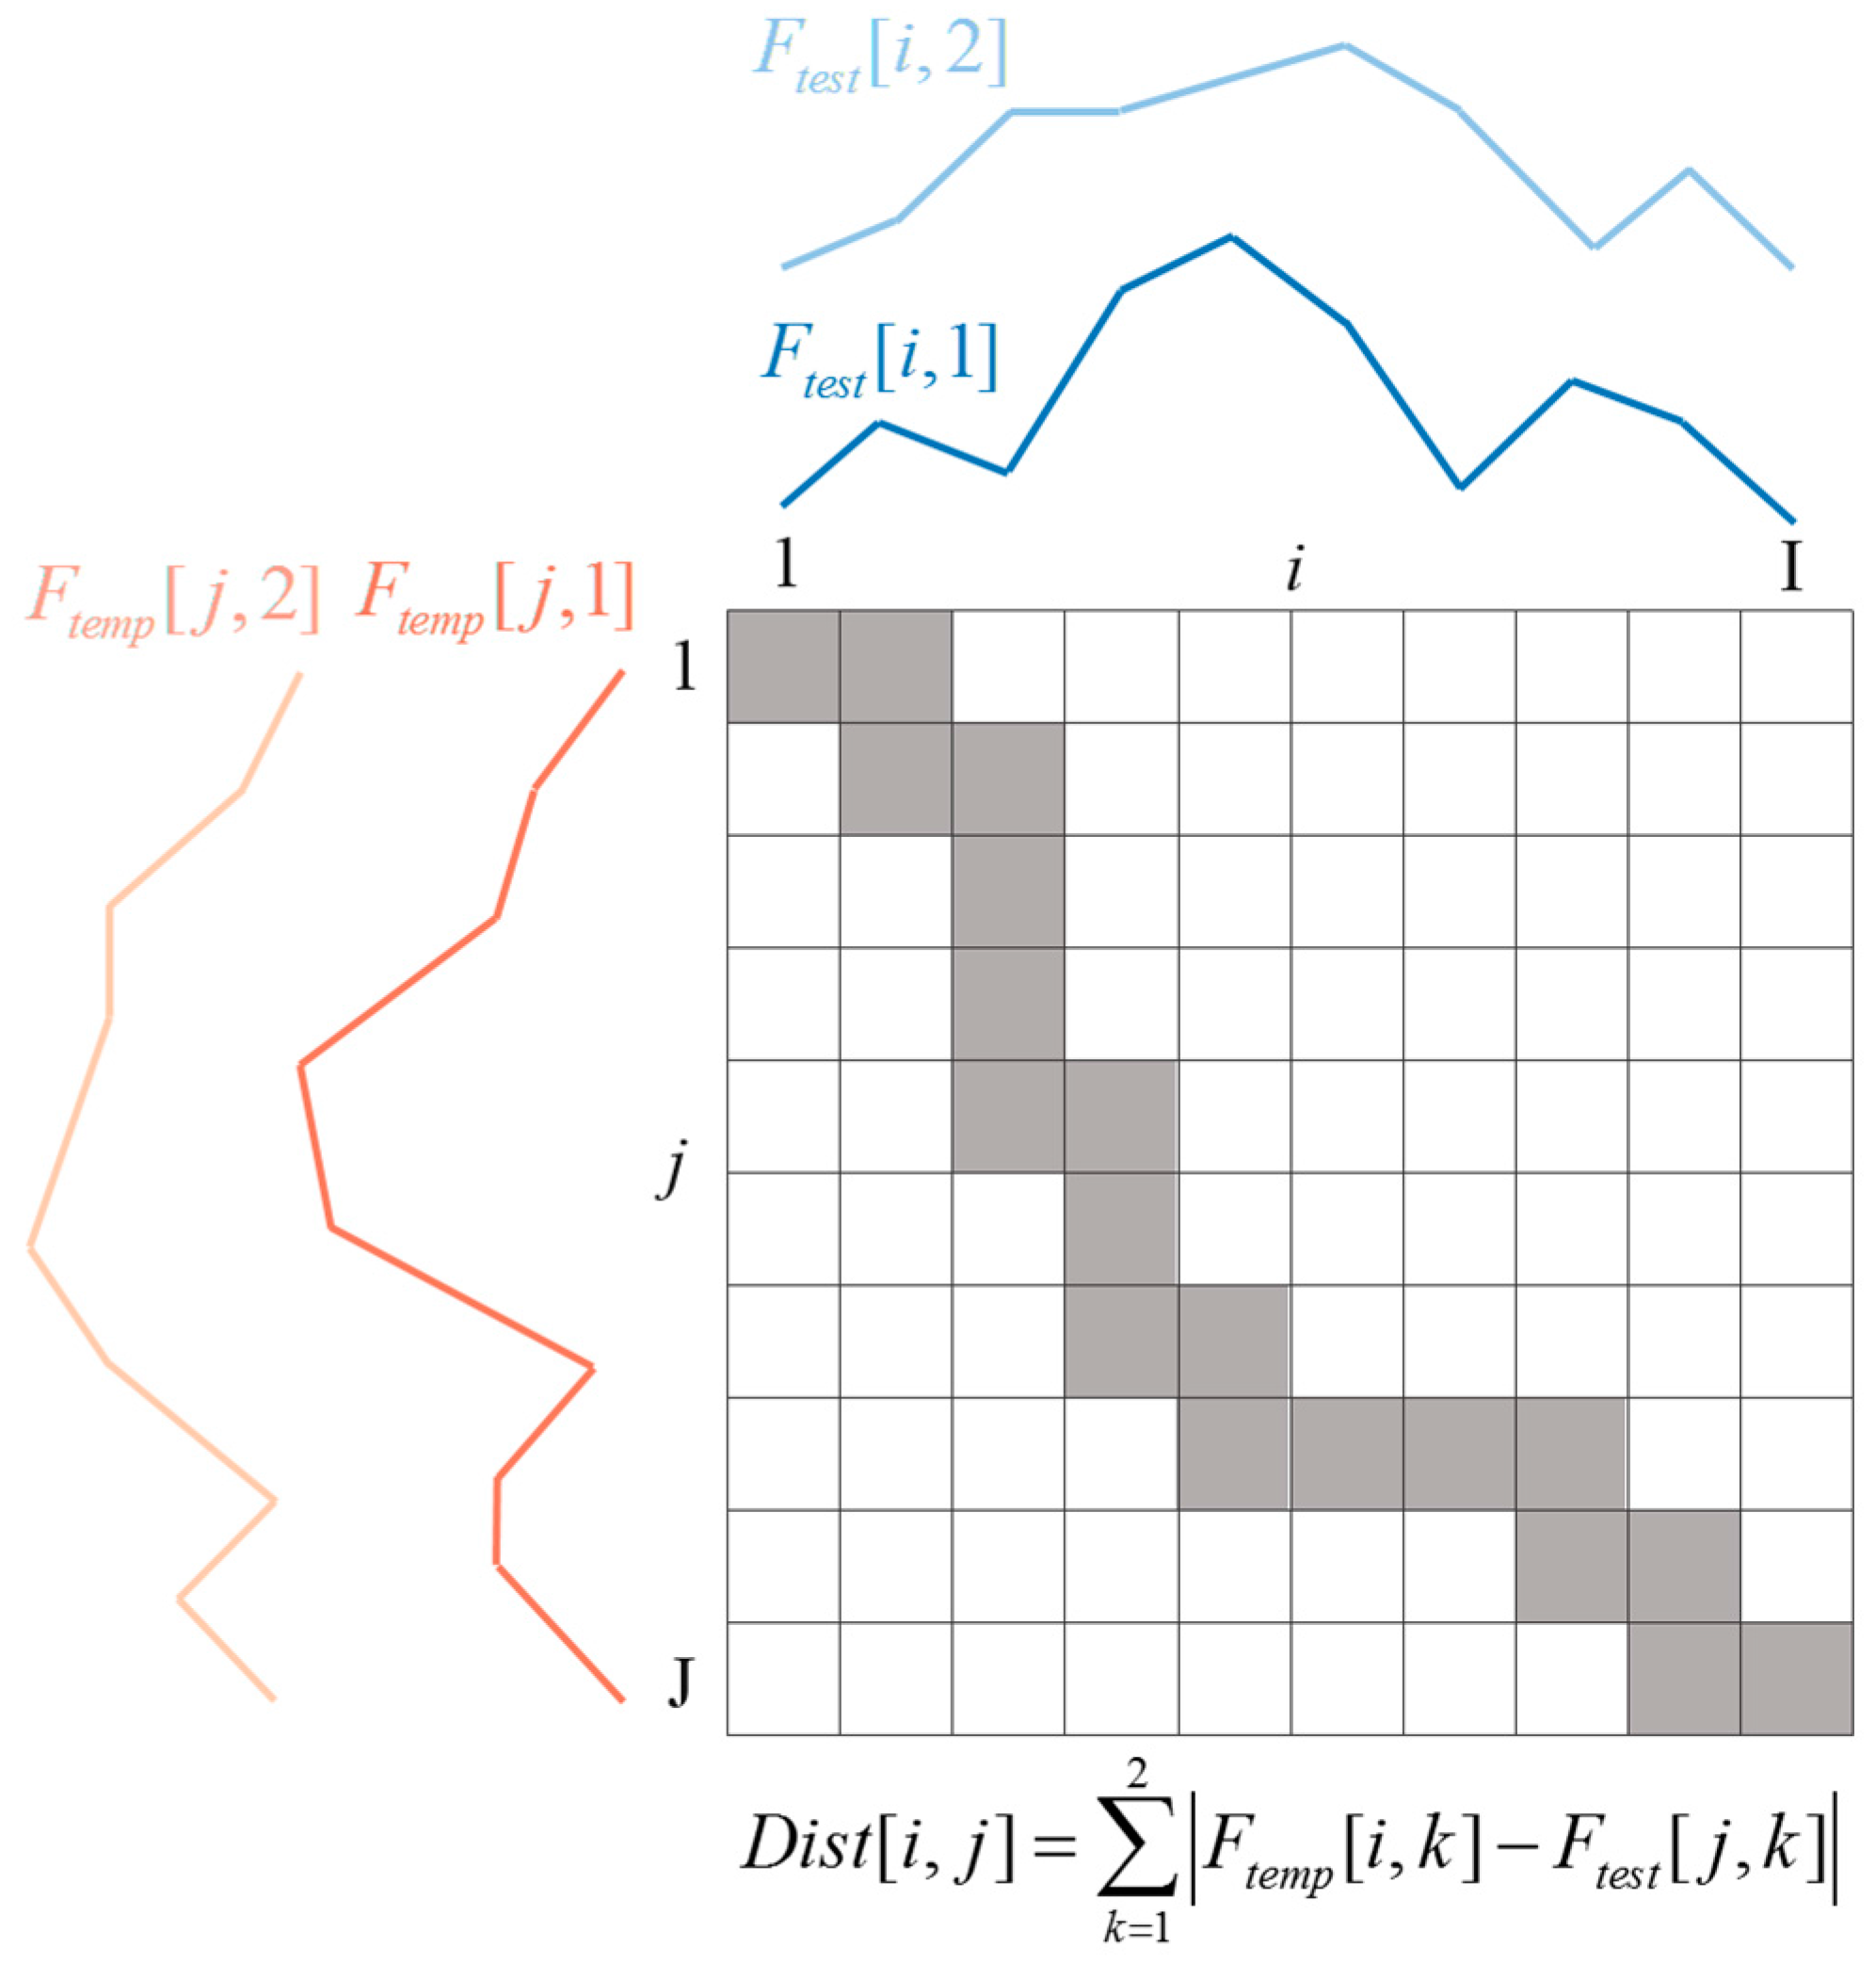
2.4. Template Matching for Speech Recognition
3. Evaluation
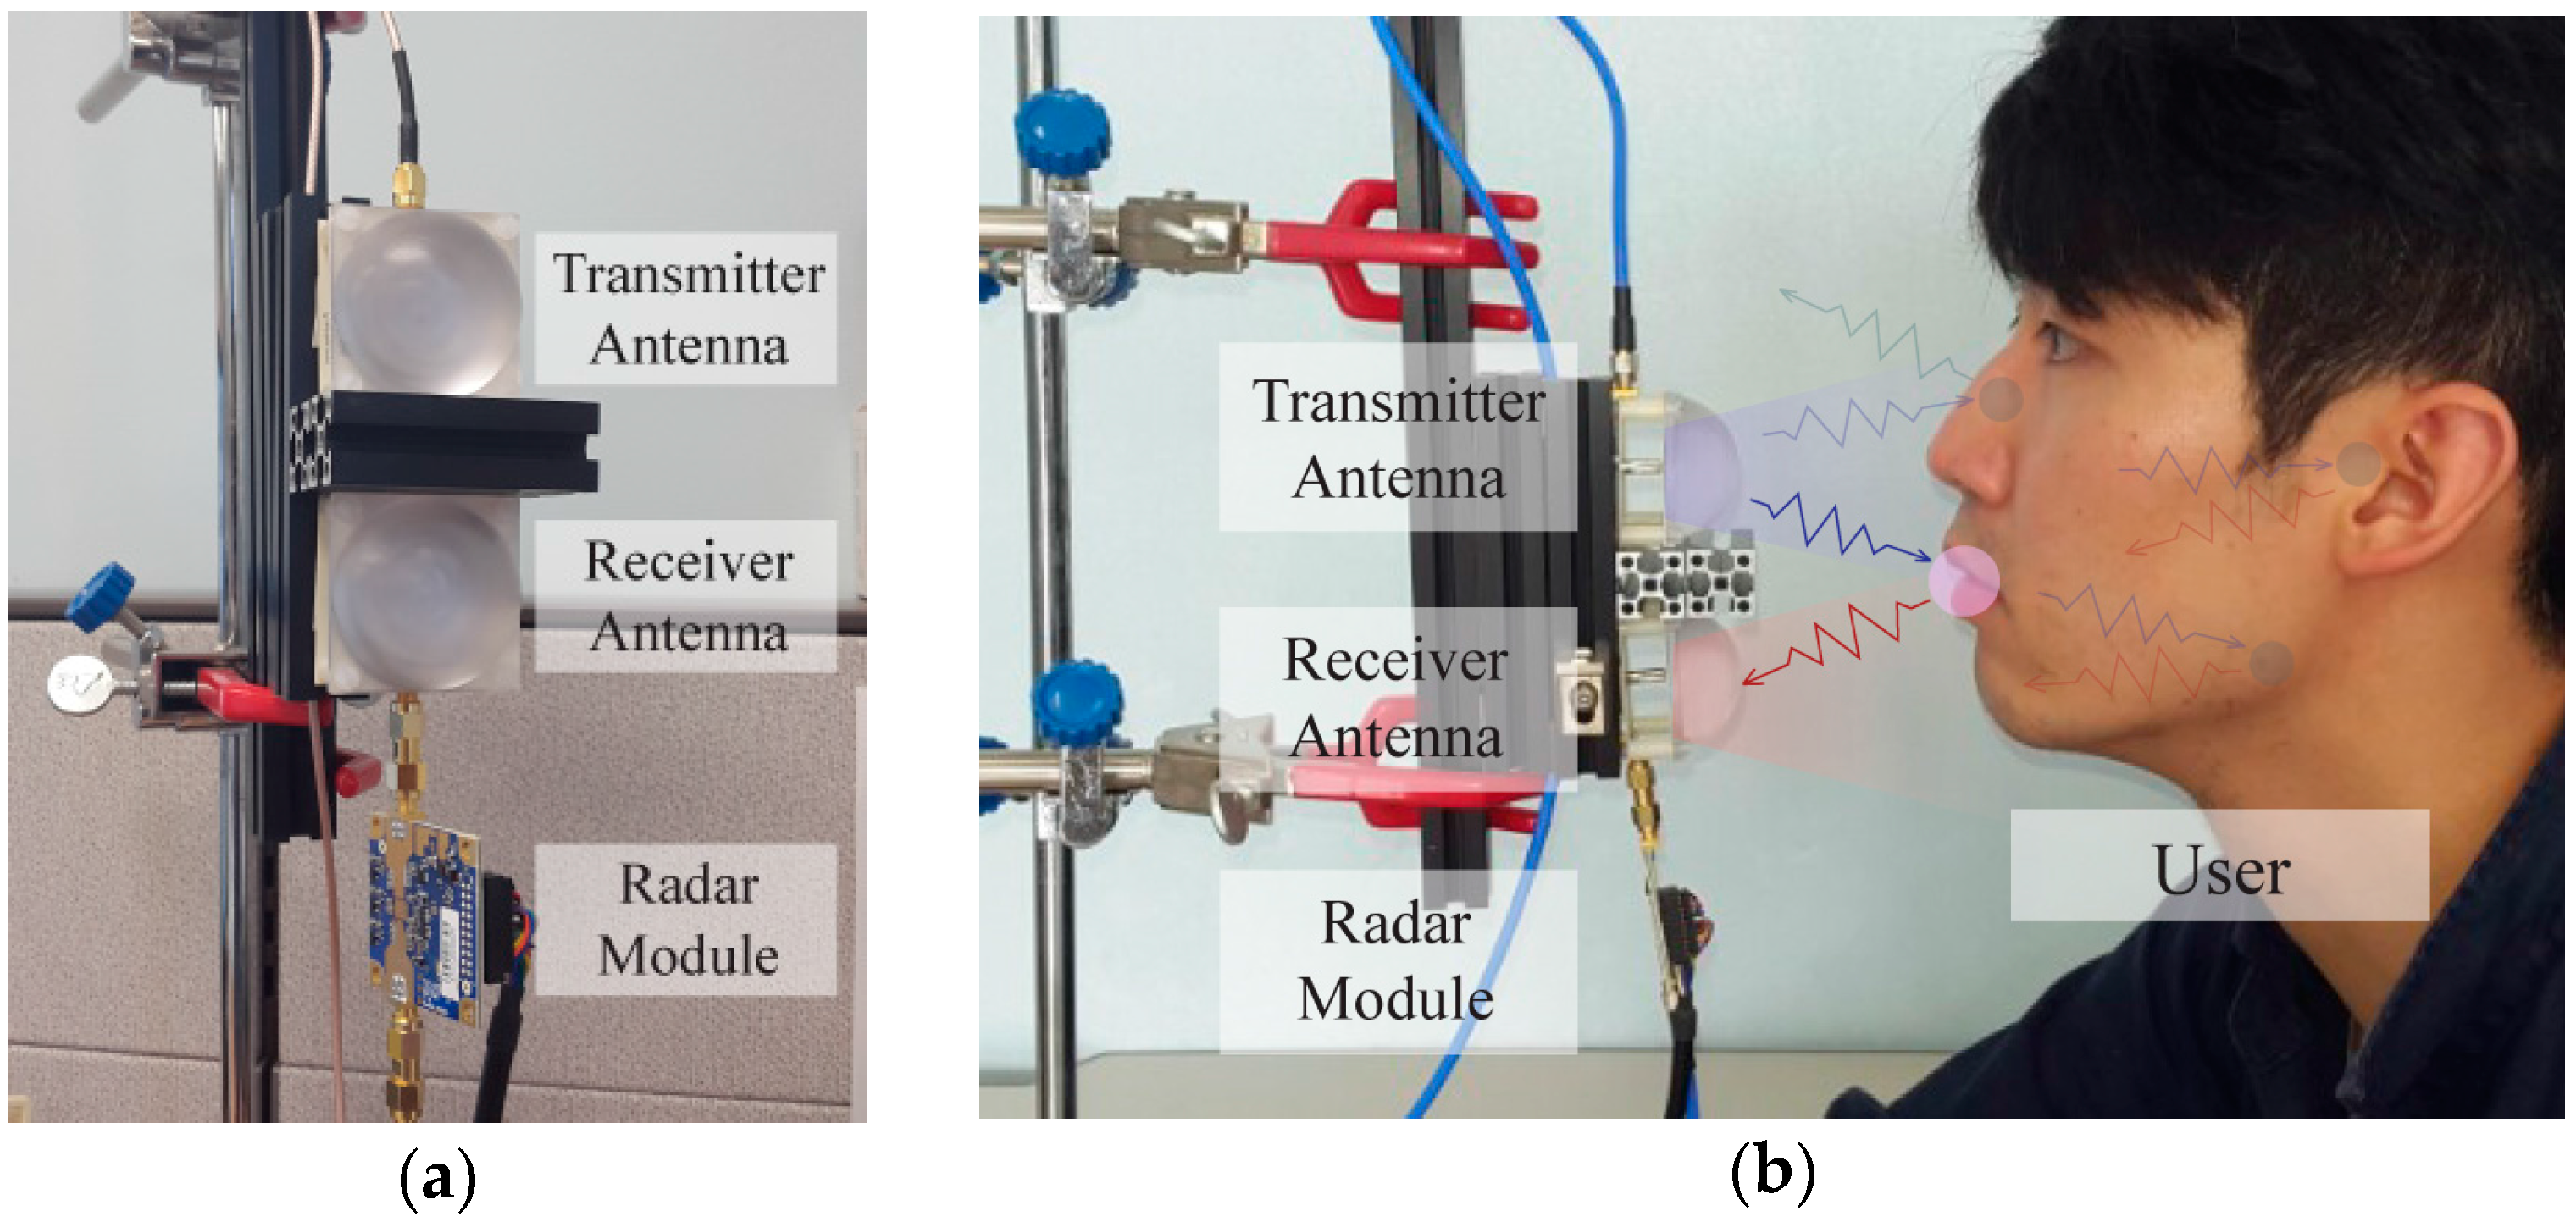
3.1. Experimental Setup
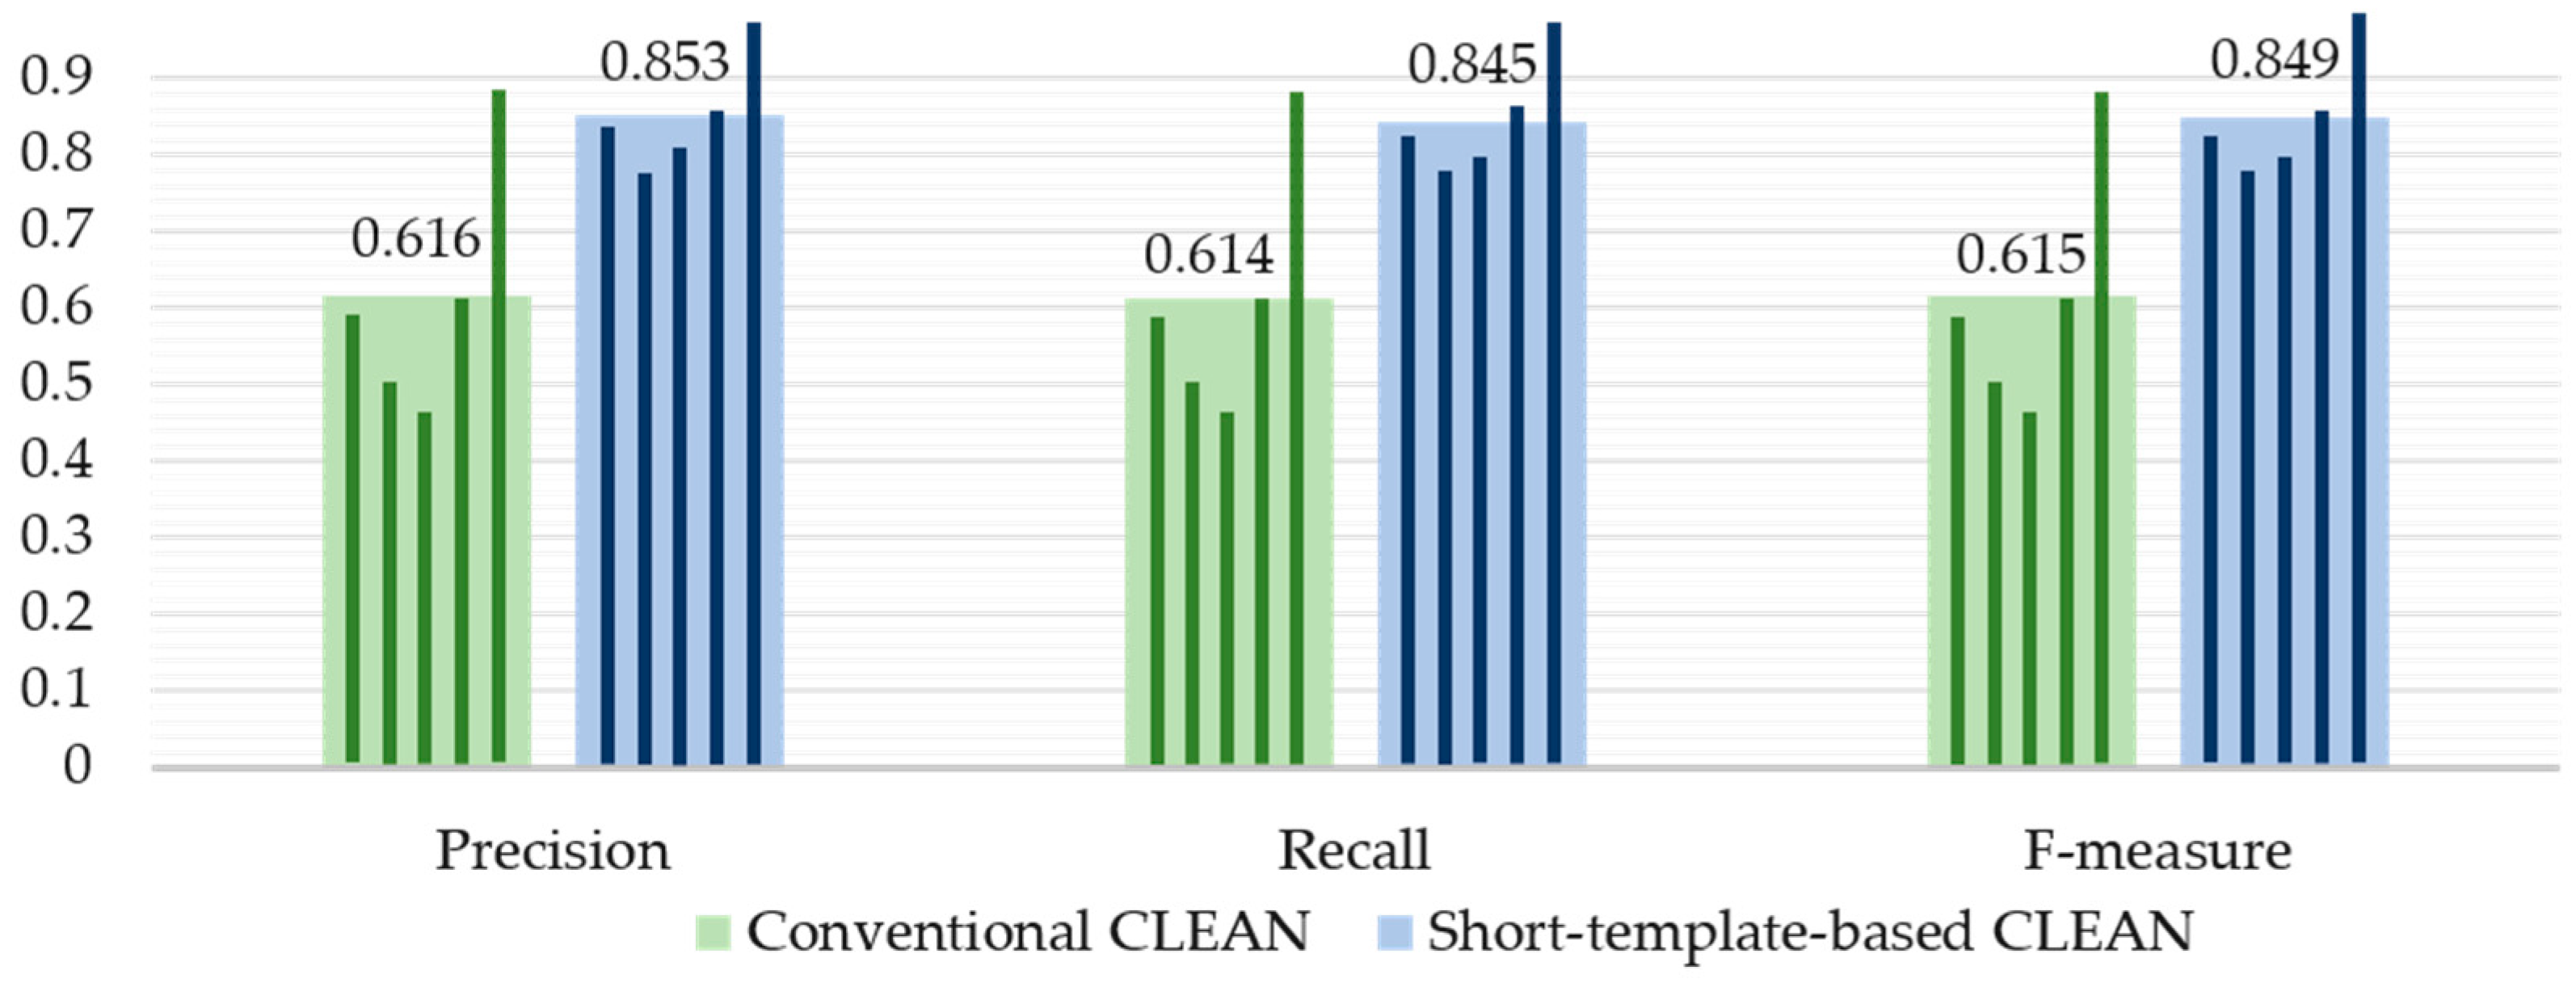
3.2. Performance of the Proposed Silent Speech Recognition System
4. Discussion
5. Conclusions
Acknowledgments
Author Contributions
Conflicts of Interest
References
- Juang, B.-H.; Rabiner, L.R. Speech Recognition, Automatic: History. In Encyclopedia of Language & Linguistics, 2nd ed.; Elsevier: Boston, MA, USA, 2006; pp. 806–819. [Google Scholar]
- Denby, B.; Schultz, T.; Honda, K.; Hueber, T.; Gilbert, J.M.; Brumberg, J.S. Silent speech interfaces. Speech Commun. 2009, 52, 270–287. [Google Scholar] [CrossRef]
- Schultz, T.; Wand, M. Modeling coarticulation in EMG-based continuous speech recognition. Speech Commun. 2010, 52, 341–353. [Google Scholar] [CrossRef]
- Wand, M.; Schulte, C.; Janke, M.; Schultz, T. Array-based Electromyographic Silent Speech Interface. In Proceedings of the 6th International Conference on Bio-Inspired Systems and Signal Processing (BIOSIGNALS), Barcelona, Spain, 11–14 February 2013; pp. 89–96.
- Wand, M.; Himmelsbach, A.; Heistermann, T.; Janke, M.; Schultz, T. Artifact Removal Algorithm for an EMG-Based Silent Speech Interface. In Proceedings of the 35th Annual Conference of the IEEE Engineering in Medicine and Biology Society, Osaka, Japan, 3–7 July 2013; pp. 5750–5753.
- Wang, J.; Samal, A.; Green, J.R.; Rudzicz, F. Sentence Recognition from Articulatory Movements for Silent Speech Interfaces. In Proceedings of the IEEE International Conference on Acoustics, Speech and Signal Processing (ICASSP), Kyoto, Japan, 25–30 March 2012; pp. 4985–4988.
- Wang, J.; Samal, A.; Green, J.R.; Rudzicz, F. Whole-Word Recognition from Articulatory Movements for Silent Speech Interfaces. In Proceedings of the Interspeech, Portland, OR, USA, 9–13 September 2012.
- Wang, J.; Hahm, S. Speaker-Independent Silent Speech Recognition with Across-Speaker Articulatory Normalization and Speaker Adaptive Training. In Proceedings of the Interspeech, Dresden, Germany, 6–10 September 2015.
- Wang, J.; Samal, A.; Rong, P.; Green, J.R. An optimal set of flesh points on tongue and lips for speech-movement classification. J. Speech Lang. Hearing. Res. 2016, 59, 15–26. [Google Scholar] [CrossRef] [PubMed]
- Toda, T.; Nakagiri, M.; Shikano, K. Statistical voice conversion techniques for body-conducted unvoiced speech enhancement. IEEE Trans. Audio Speech Lang. Process. 2012, 20, 2505–2517. [Google Scholar] [CrossRef]
- Toda, T.; Nakamura, K.; Saruwatari, H.; Shikano, K. Alaryngeal speech enhancement based on one-to-many eigenvoice conversion. IEEE/ACM Trans. Audio Speech Lang. Process. 2014, 22, 172–183. [Google Scholar]
- Janani, P.; Devi, N. Comparison and statistical analysis of NAM and normal speech processing using wavelet transform. Int. J. Res. Comput. Commun. Technol. 2013, 2, 165–169. [Google Scholar]
- Hueber, T.; Benaroya, E.L.; Chollet, G.; Denby, B.; Dreyfus, G.; Stone, M. Development of a silent speech interface driven by ultrasound and optical images of the tongue and lips. Speech Commun. 2010, 52, 288–300. [Google Scholar] [CrossRef]
- Hueber, T.; Bailly, G.; Denby, B. Continuous Articulatory-to-Acoustic Mapping using Phone-Based Trajectory HMM for a Silent Speech Interface. In Proceedings of the Interspeech, Portland, OR, USA, 9–13 September 2012.
- Fabre, D.; Hueber, T.; Badin, P. Tongue Tracking in Ultrasound Images using EigenTongue Decomposition and Artificial Neural Networks. In Proceedings of the Interspeech, Dresden, Germany, 6–10 September 2015.
- Hueber, T.; Bailly, G. Statistical conversion of silent articulation into audible speech using full-covariance HMM. Comput. Speech Lang. 2016, 36, 274–293. [Google Scholar] [CrossRef]
- Srinivasan, S.; Raj, B.; Ezzat, T. Ultrasonic sensing for robust speech recognition. In Proceedings of the IEEE International Conference on Acoustics Speech and Signal Processing, Dallas, TX, USA, 14–19 March 2010; pp. 5102–5105.
- Cvijanovic, N.; Kechichian, P.; Janse, K.; Kohlrausch, A. Robustness Improvement of Ultrasound-Based Sensor Systems for Speech Communication. In Proceedings of the 23rd European Signal Processing Conference, Nice, France, 31 August–4 September 2015; pp. 884–888.
- Nguyen, L.H.; Wong, D.C.; Stanton, B.; Smith, G. Forward Imaging for Obstacle Avoidance Using Ultrawideband Synthetic Aperture Radar. In Proceedings of the SPIE's AeroSense 2003, Orlando, FL, USA, 21–25 April 2003; pp. 519–528.
- Soldovieri, F.; Solimene, R. Through-wall imaging via a linear inverse scattering algorithm. IEEE Geosci. Remote Sens. Lett. 2007, 4, 513–517. [Google Scholar] [CrossRef]
- Li, J.; Zeng, Z.; Sun, J.; Liu, F. Through-wall detection of human being's movement by UWB radar. IEEE Geosci. Remote Sens. Lett. 2012, 9, 1079–1083. [Google Scholar] [CrossRef]
- Kocur, D.; Švecová, M.; Rovňáková, J. Through-the-wall localization of a moving target by two independent ultra wideband (UWB) radar systems. Sensors 2013, 13, 11969–11997. [Google Scholar] [CrossRef] [PubMed]
- Ossberger, G.; Buchegger, T.; Schimbäck, E.; Stelzer, A.; Weigel, R. Non-invasive Respiratory Movement Detection and Monitoring of Hidden Humans using Ultra Wideband Pulse Radar. In Proceedings of the 2004 International Workshop on Ultrawideband Systems and Technologies, Tokyo, Japan, 18–21 May 2004; pp. 395–399.
- Lazaro, A.; Girbau, D.; Villarino, R. Analysis of vital signs monitoring using an IR-UWB radar. Prog. Electromagn. Res. 2010, 100, 265–284. [Google Scholar] [CrossRef]
- Lazaro, A.; Girbau, D.; Villarino, R. Techniques for clutter suppression in the presence of body movements during the detection of respiratory activity through UWB radars. Sensors 2014, 14, 2595–2618. [Google Scholar] [CrossRef] [PubMed]
- Yarovoy, A. Ultra-Wideband Radars for High-Resolution Imaging and Target Classification. In Proceedings of the European Radar Conference, Munich, Germany, 10–12 October 2007; pp. 1–4.
- Chen, C.C.; Higgins, M.B.; O’Neill, K.; Detsch, R. Ultrawide-bandwidth fully-polarimetric ground penetrating radar classification of subsurface unexploded ordnance. IEEE Trans. Geosci. Remote Sens. 2001, 39, 1221–1230. [Google Scholar] [CrossRef]
- Eid, A.M.; Wallace, J.W. Ultrawideband speech sensing. IEEE Antennas Wirel. Propag. Lett. 2009, 8, 1414–1417. [Google Scholar] [CrossRef]
- Lin, C.-S.; Chang, S.-F.; Chang, C.-C.; Lin, C.-C. Microwave human vocal vibration signal detection based on Doppler radar technology. IEEE Trans. Microw. Theory Tech. 2001, 58, 2299–2306. [Google Scholar] [CrossRef]
- Chen, F.; Li, S.; Li, C.; Liu, M.; Li, Z.; Xue, H.; Jing, X.; Wang, J. A novel method for speech acquisition and enhancement by 94 GHz millimeter-wave sensor. Sensors 2016, 16, 50. [Google Scholar] [CrossRef] [PubMed]
- Melvin, W.L. Space-Time Adaptive Processing for Radar. In Academic Press Library in Signal Processing: Volume 2 Communications and Radar Signal Processing; Elsevier: Amsterdam, The Netherlands, 2014; pp. 595–665. [Google Scholar]
- Bjorklund, S.; Nelander, A.; Pettersson, M.I. Fast-Time and Slow-Time Space-Time Adaptive Processing for Bistatic Radar Interference Suppression. In Proceedings of the IEEE Radar Conference, Arlington, VA, USA, 10–15 May 2015; pp. 674–678.
- Abujarad, F.; Jostingmeier, A.; Omar, A.S. Clutter Removal for Landmine Using Different Signal Processing Techniques. In Proceedings of the 10th International Conference on Ground Penetrating Radar, Delft, The Netherlands, 21–24 June 2004; pp. 697–700.
- Ghahramani, M.; Mohseni, R.; Sheikhi, A. A Double Stage IPCP Detector for UWB Radars. In Proceedings of the IEEE International Conference on Ultra-Wideband, Singapore, 24–26 September 2007; pp. 345–348.
- Jia, Y.; Zhong, X.; Liu, J.; Guo, Y. Single-side two-location spotlight imaging for building based on MIMO through-wall-radar. Sensors 2016, 16, 1441. [Google Scholar] [CrossRef] [PubMed]
- Liang, Q.; Zhang, B.; Wu, X. UWB Radar for Target Detection: DCT versus Matched Filter Approaches. In Proceedings of the 2012 IEEE Globecom Workshops, Anaheim, CA, USA, 3–7 December 2012; pp. 1435–1439.
- Hogbom, J.A. Aperture synthesis with a non-regular distribution of interferometer baselines. Astron. Astrophys. Suppl. Ser. 1974, 15, 417–426. [Google Scholar]
- Liu, T.C.-K.; Kim, D.I.; Vaughan, R.G. A high-resolution, multi-template deconvolution algorithm for time-domain UWB channel characterization. Can. J. Electr. Comput. Eng. 2007, 32, 207–213. [Google Scholar] [CrossRef]
- Muqaibel, A.; Safaai-Jazi, A.; Woerner, B.; Riad, S. UWB Channel Impulse Response Characterization Using Deconvolution Techniques. In Proceedings of the 45th Midwest Symposium on Circuits and Systems, Tulsa, OK, USA, 4–7 August 2002.
- Li, Q.; Zheng, J.; Tsai, A.; Zhou, Q. Robust endpoint detection and energy normalization for real-time speech and speaker recognition. IEEE Trans. Speech Audio Process. 2002, 10, 146–157. [Google Scholar] [CrossRef]
- White, G.M.; Neely, R.B. Speech recognition experiments with linear predication, bandpass filtering, and dynamic programming. IEEE Trans. Speech Audio Process. 1976, 24, 183–188. [Google Scholar] [CrossRef]
- Ten Holt, G.A.; Reinders, M.J.T.; Hendriks, E.A. Multi-dimensional Dynamic Time Warping for Gesture Recognition. In Proceedings of the Thirteenth Annual Conference of the Advanced School for Computing and Imaging, Heijen, The Netherlands, 13–15 June 2007.
- Taylor, J.D.; Wisland, D.T. Novelda nanoscale impulse radar. In Ultra-wideband Radar: Applications and Design, 1st ed.; Taylor, J.D., Ed.; CRC Press: New York, NY, USA, 2012; pp. 373–388. [Google Scholar]
- Gilbert, J.M.; Rybchenkoa, S.I.; Hofe, R.; Ell, S.R.; Fagan, M.J.; Moore, R.K.; Green, P. Isolated word recognition of silent speech using magnetic implants and sensors. Med. Eng. Phys. 2010, 32, 1189–1197. [Google Scholar] [CrossRef] [PubMed]
- Wang, J.; Balasubramanian, A.; de la Vega, L.M.; Green, J.R.; Samal, A.; Prabhakaran, B. Word Recognition from Continuous Articulatory Movement Time-Series Data using Symbolic Representations. In Proceedings of the 4th Workshop on Speech and Language Processing for Assistive Technologies, Grenoble, France, 21–22 August 2013; pp. 119–127.
- Heracleous, P.; Nakajima, Y.; Lee, A.; Saruwatari, H.; Shikano, K. Non-Audible Murmur (NAM) Speech Recognition using a Stethoscopic NAM Microphone. In Proceedings of the 8th International Conference on Spoken Language Processing, Jeju Island, Korea, 4–8 October 2004; pp. 213–214.
- Hueber, T.; Benaroya, E.-L.; Chollet, G.; Denby, B.; Dreyfus, G.; Stone, M. Visuo-Phonetic Decoding using Multi-Stream and Context-Dependent Models for an Ultrasound-based Silent Speech Interface. In Proceedings of the Interspeech, Brighton, UK, 6–10 September 2009.


| a | æ | i | ɔ | u | Average | |
|---|---|---|---|---|---|---|
| Precision | 0.833 | 1.000 | 0.950 | 0.944 | 1.000 | 0.946 |
| Recall | 1.000 | 0.950 | 0.950 | 0.850 | 0.950 | 0.940 |
| Spoken Vowel | Recognized Vowel (%) | ||||
|---|---|---|---|---|---|
| a | æ | i | ɔ | u | |
| a | 100 | 0 | 0 | 0 | 0 |
| æ | 0 | 95 | 5 | 0 | 0 |
| i | 5 | 0 | 95 | 0 | 0 |
| ɔ | 15 | 0 | 0 | 85 | 0 |
| u | 0 | 0 | 0 | 5 | 95 |
| Spoken Word | Recognized Word (%) | |||||||||
|---|---|---|---|---|---|---|---|---|---|---|
| One | Two | Three | Four | Five | Six | Seven | Eight | Nine | Zero | |
| One | 76 | 7 | 2 | 0 | 4 | 2 | 4 | 4 | 0 | 1 |
| Two | 5 | 74 | 8 | 3 | 0 | 1 | 2 | 2 | 2 | 3 |
| Three | 4 | 6 | 56 | 6 | 5 | 5 | 7 | 1 | 8 | 2 |
| Four | 4 | 2 | 7 | 63 | 3 | 4 | 5 | 3 | 7 | 2 |
| Five | 2 | 2 | 3 | 5 | 56 | 3 | 12 | 13 | 2 | 2 |
| Six | 2 | 0 | 7 | 3 | 6 | 52 | 6 | 11 | 10 | 3 |
| Seven | 9 | 2 | 7 | 3 | 9 | 4 | 51 | 7 | 4 | 4 |
| Eight | 5 | 3 | 2 | 4 | 8 | 5 | 5 | 51 | 5 | 12 |
| Nine | 3 | 1 | 5 | 3 | 1 | 2 | 4 | 8 | 73 | 0 |
| Zero | 1 | 0 | 6 | 4 | 4 | 4 | 2 | 13 | 4 | 62 |
| Spoken Word | Recognized Word (%) | |||||||||
|---|---|---|---|---|---|---|---|---|---|---|
| One | Two | Three | Four | Five | Six | Seven | Eight | Nine | Zero | |
| One | 84 | 10 | 0 | 1 | 0 | 2 | 0 | 2 | 0 | 1 |
| Two | 6 | 90 | 0 | 0 | 1 | 1 | 0 | 0 | 2 | 0 |
| Three | 1 | 0 | 84 | 0 | 4 | 2 | 0 | 4 | 5 | 0 |
| Four | 1 | 0 | 2 | 87 | 2 | 1 | 2 | 3 | 2 | 0 |
| Five | 3 | 0 | 2 | 1 | 82 | 3 | 6 | 1 | 2 | 0 |
| Six | 1 | 1 | 3 | 0 | 5 | 82 | 2 | 3 | 2 | 1 |
| Seven | 5 | 1 | 3 | 1 | 4 | 2 | 78 | 2 | 2 | 2 |
| Eight | 0 | 0 | 9 | 2 | 0 | 0 | 2 | 83 | 0 | 4 |
| Nine | 1 | 0 | 0 | 2 | 1 | 2 | 3 | 2 | 89 | 0 |
| Zero | 3 | 0 | 1 | 0 | 3 | 1 | 2 | 4 | 0 | 86 |
© 2016 by the authors; licensee MDPI, Basel, Switzerland. This article is an open access article distributed under the terms and conditions of the Creative Commons Attribution (CC-BY) license (http://creativecommons.org/licenses/by/4.0/).
Share and Cite
Shin, Y.H.; Seo, J. Towards Contactless Silent Speech Recognition Based on Detection of Active and Visible Articulators Using IR-UWB Radar. Sensors 2016, 16, 1812. https://doi.org/10.3390/s16111812
Shin YH, Seo J. Towards Contactless Silent Speech Recognition Based on Detection of Active and Visible Articulators Using IR-UWB Radar. Sensors. 2016; 16(11):1812. https://doi.org/10.3390/s16111812
Chicago/Turabian StyleShin, Young Hoon, and Jiwon Seo. 2016. "Towards Contactless Silent Speech Recognition Based on Detection of Active and Visible Articulators Using IR-UWB Radar" Sensors 16, no. 11: 1812. https://doi.org/10.3390/s16111812