
Determination Method of Bridge Rotation Angle Response Using MEMS IMU

Abstract
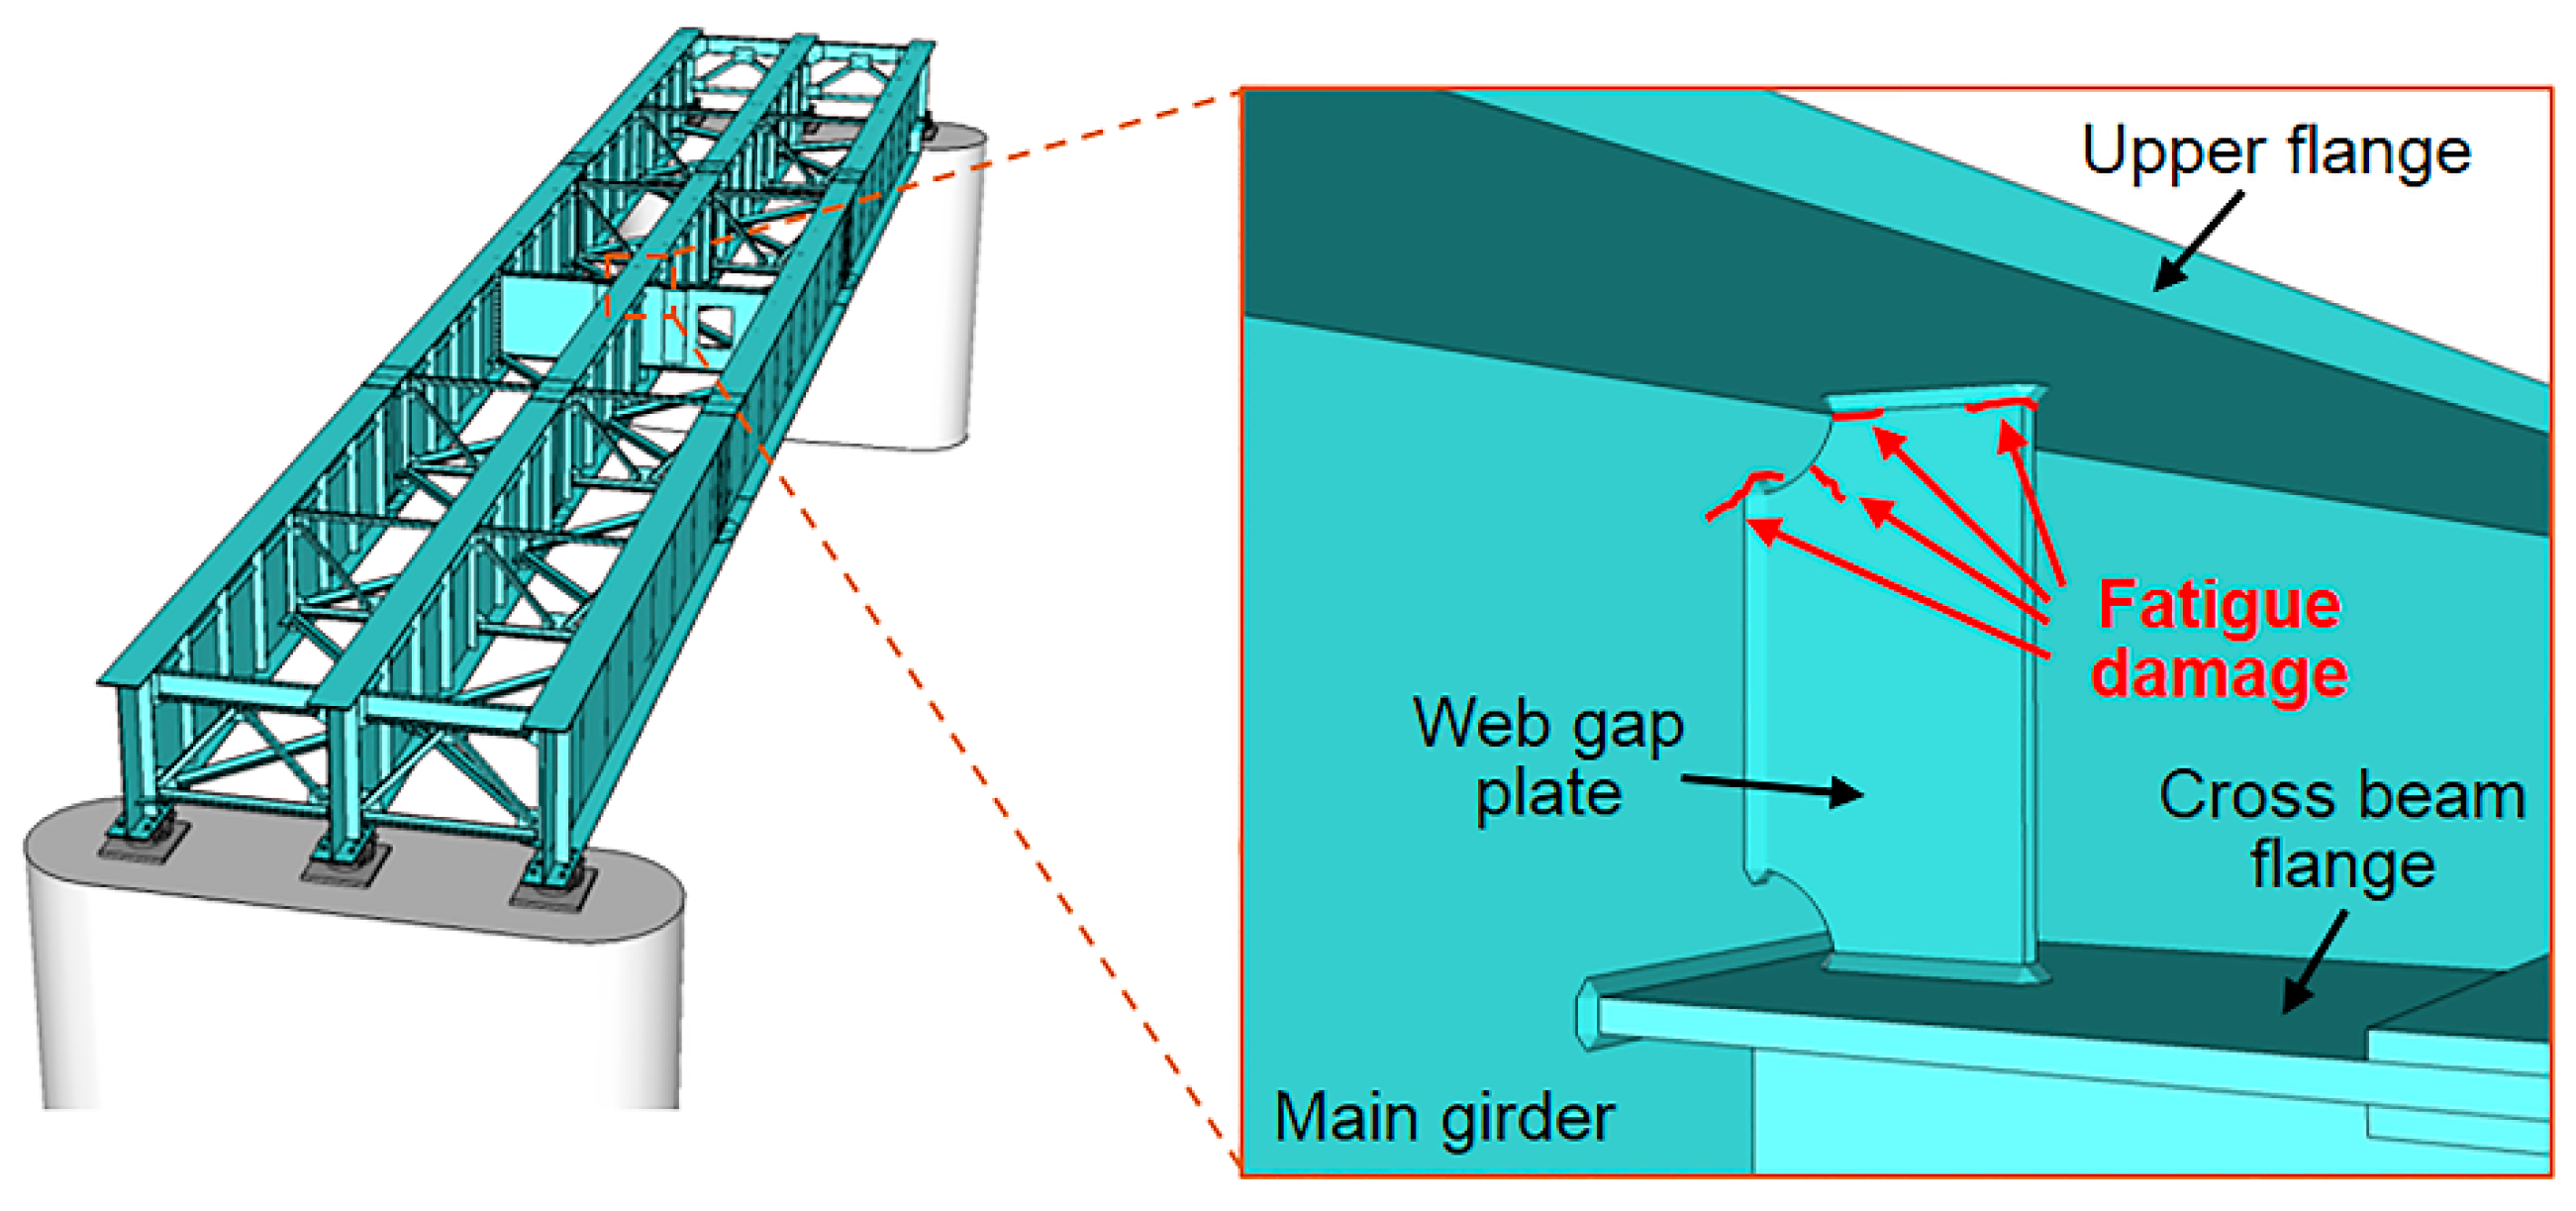
:1. Introduction
2. Experimental Section
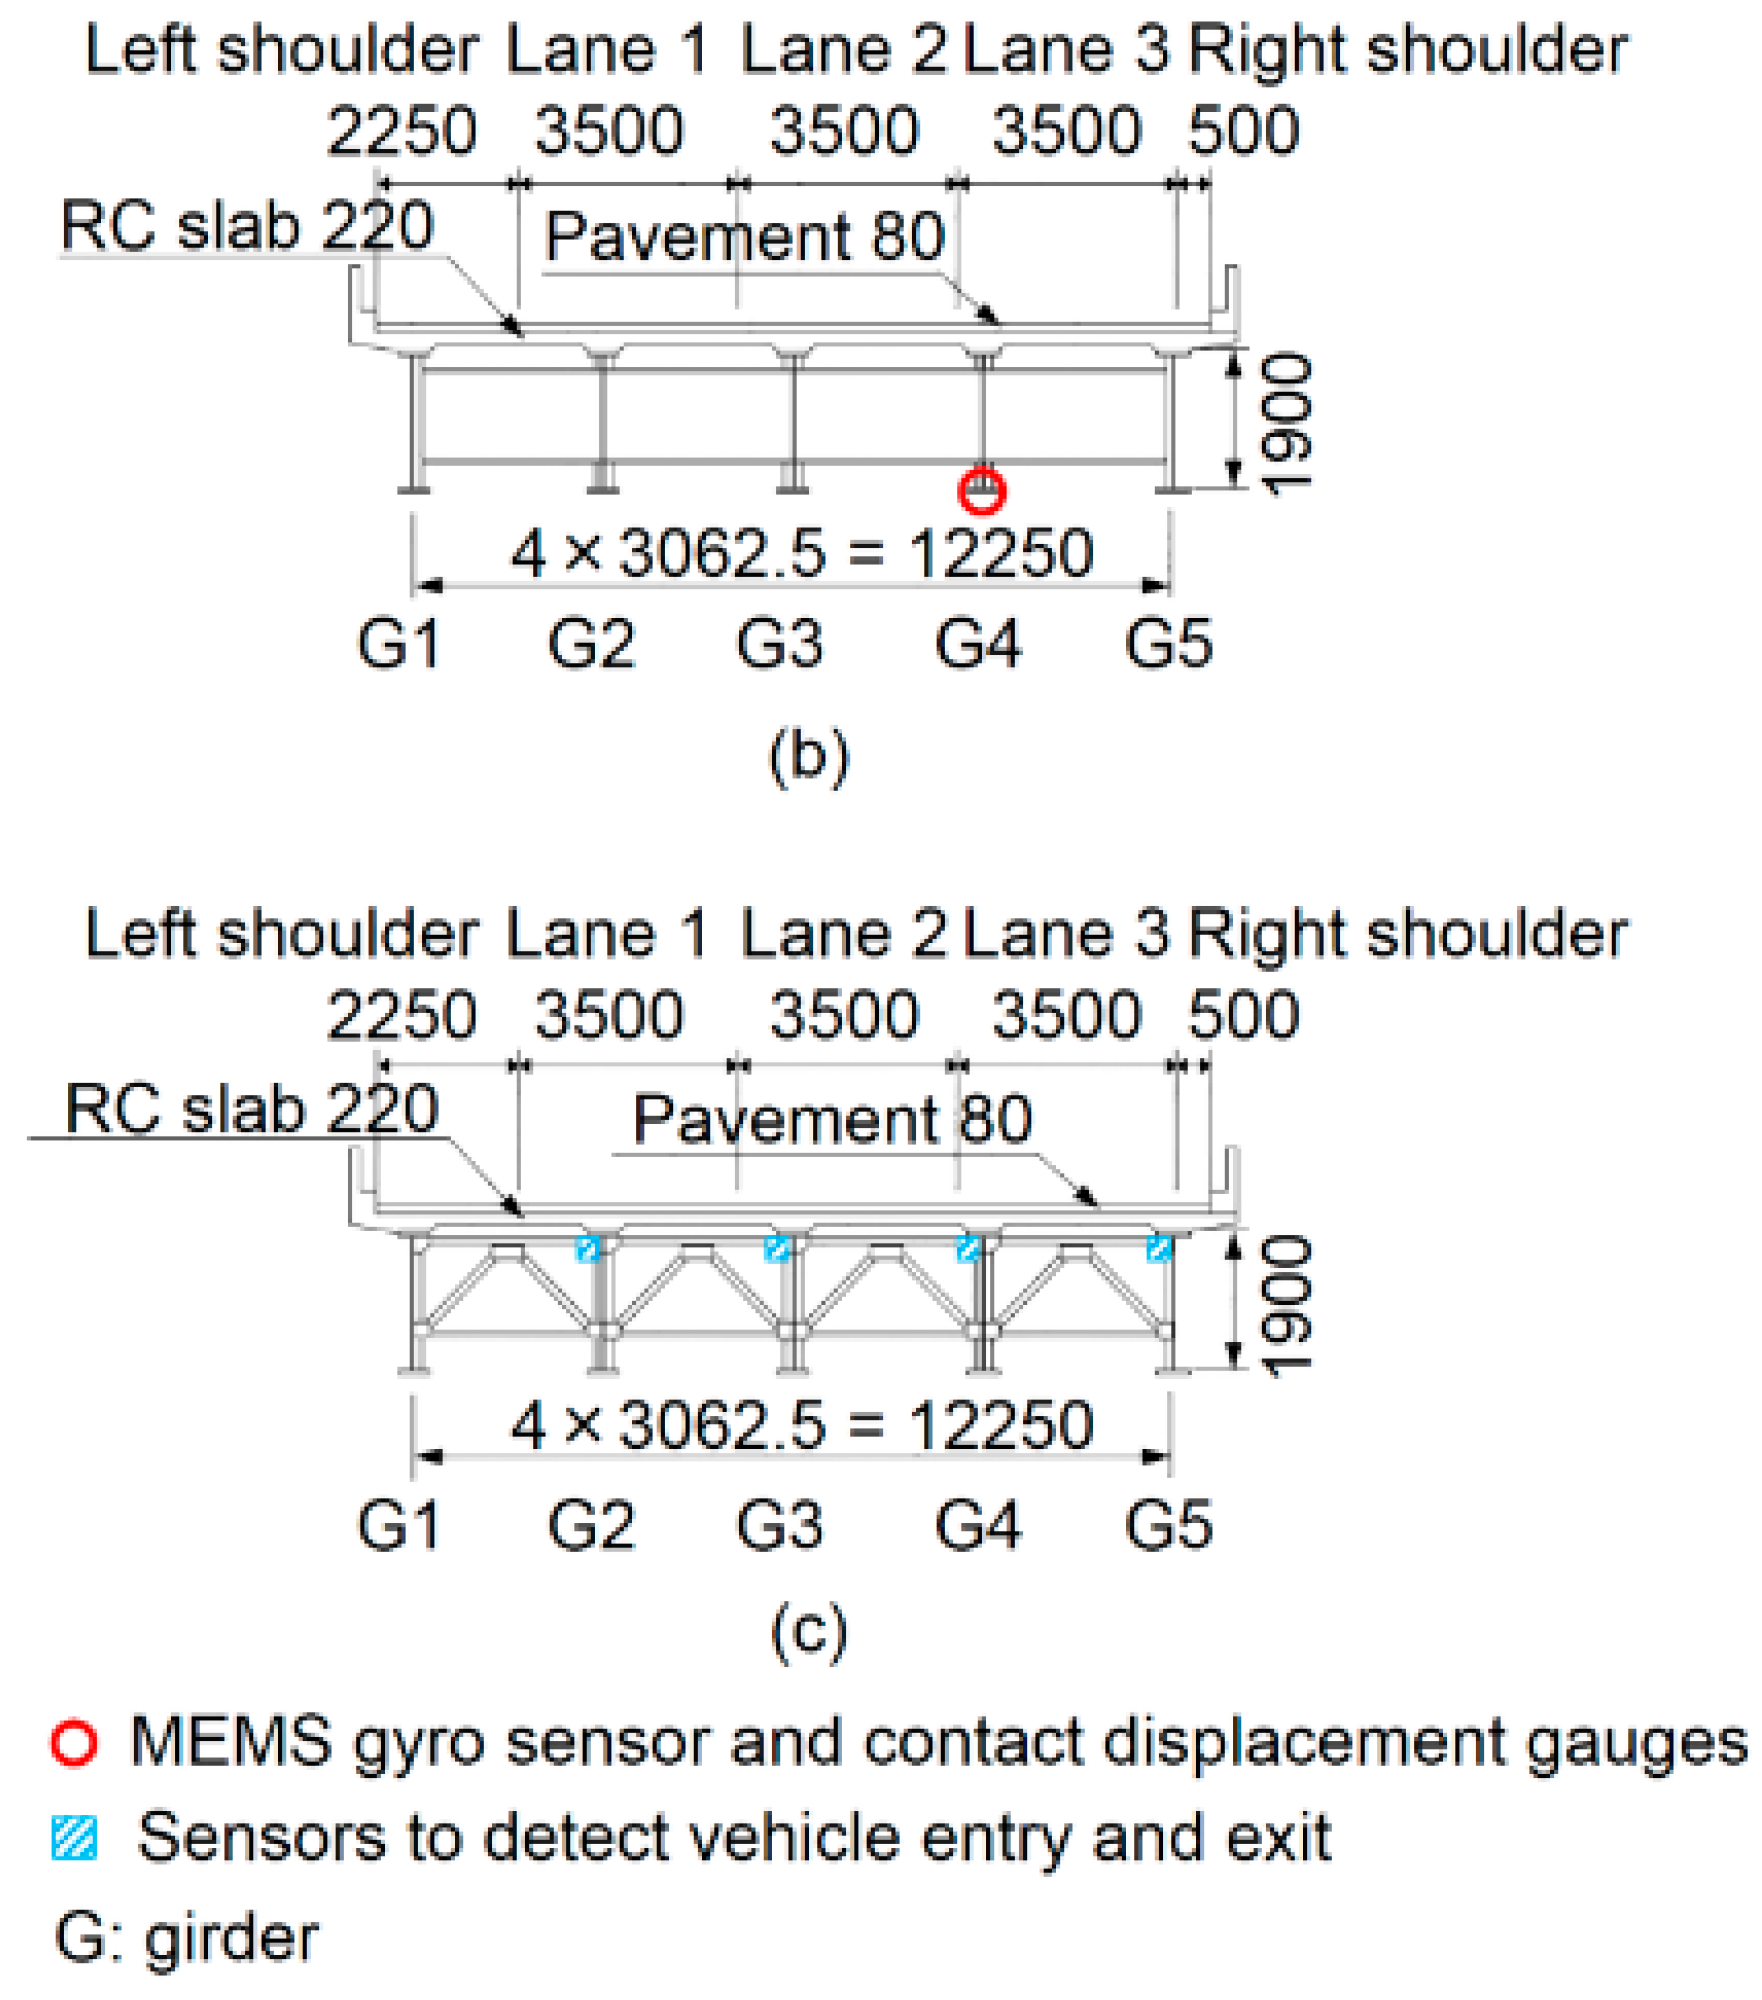
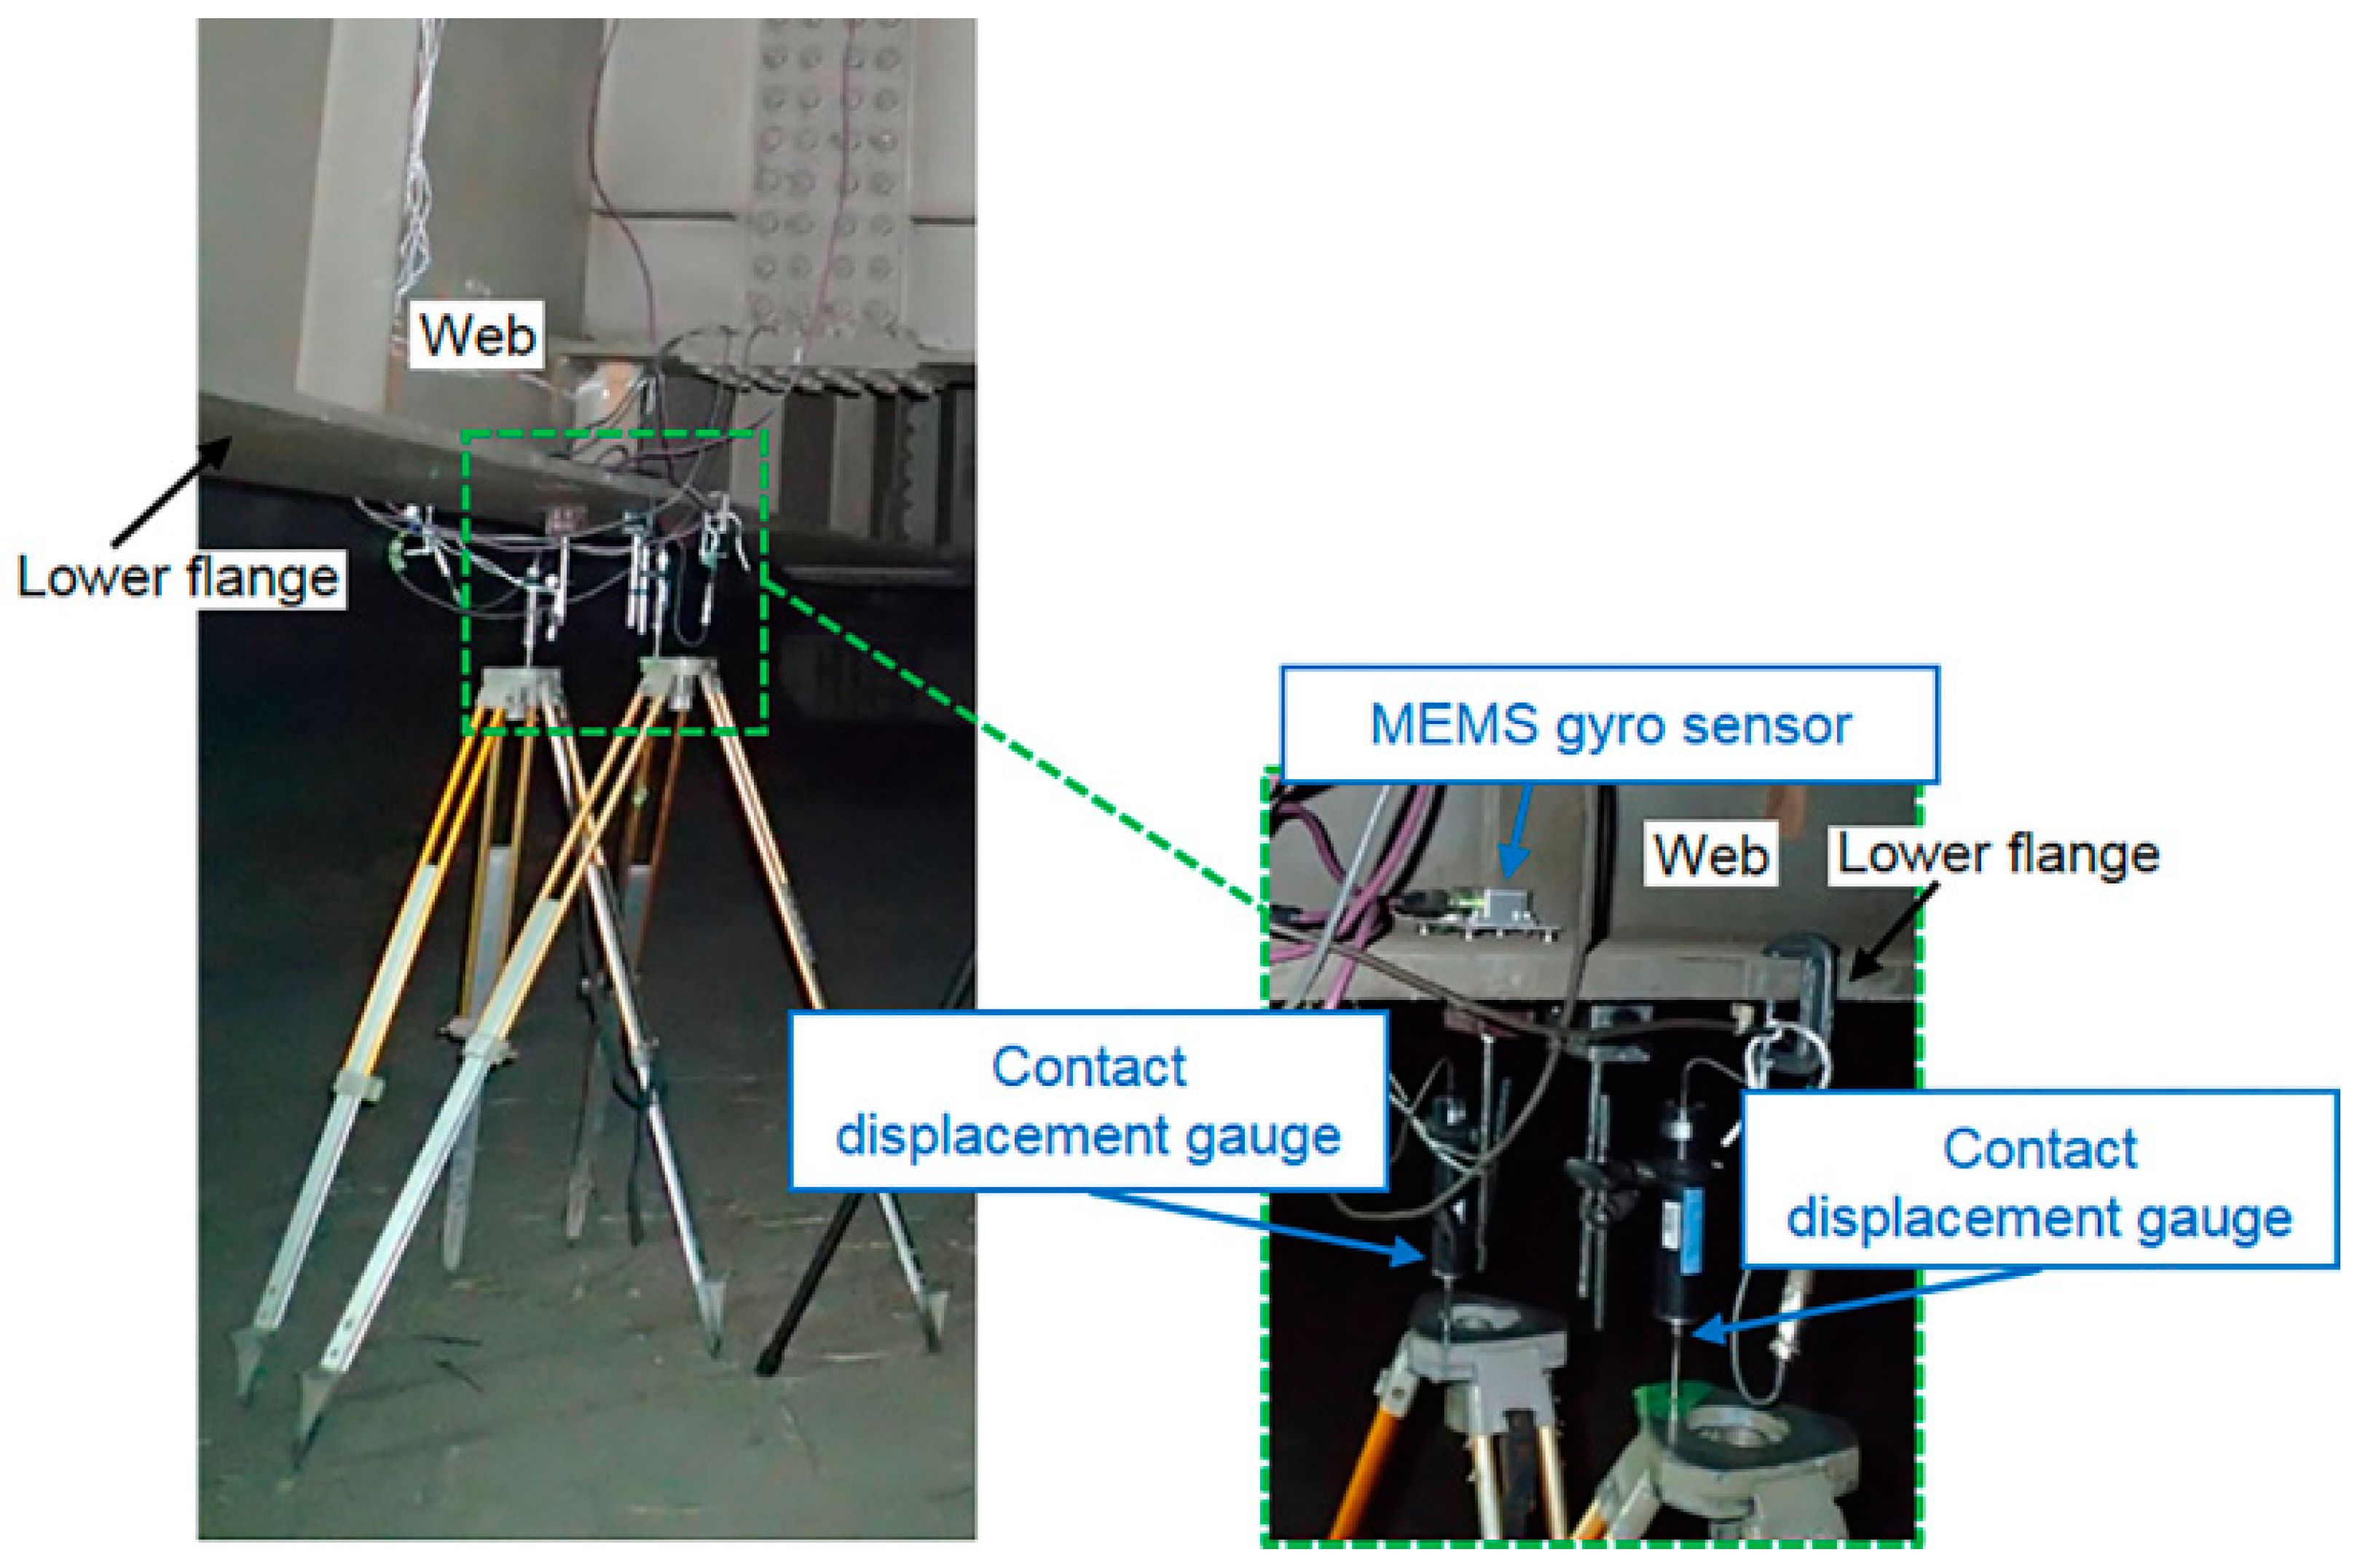
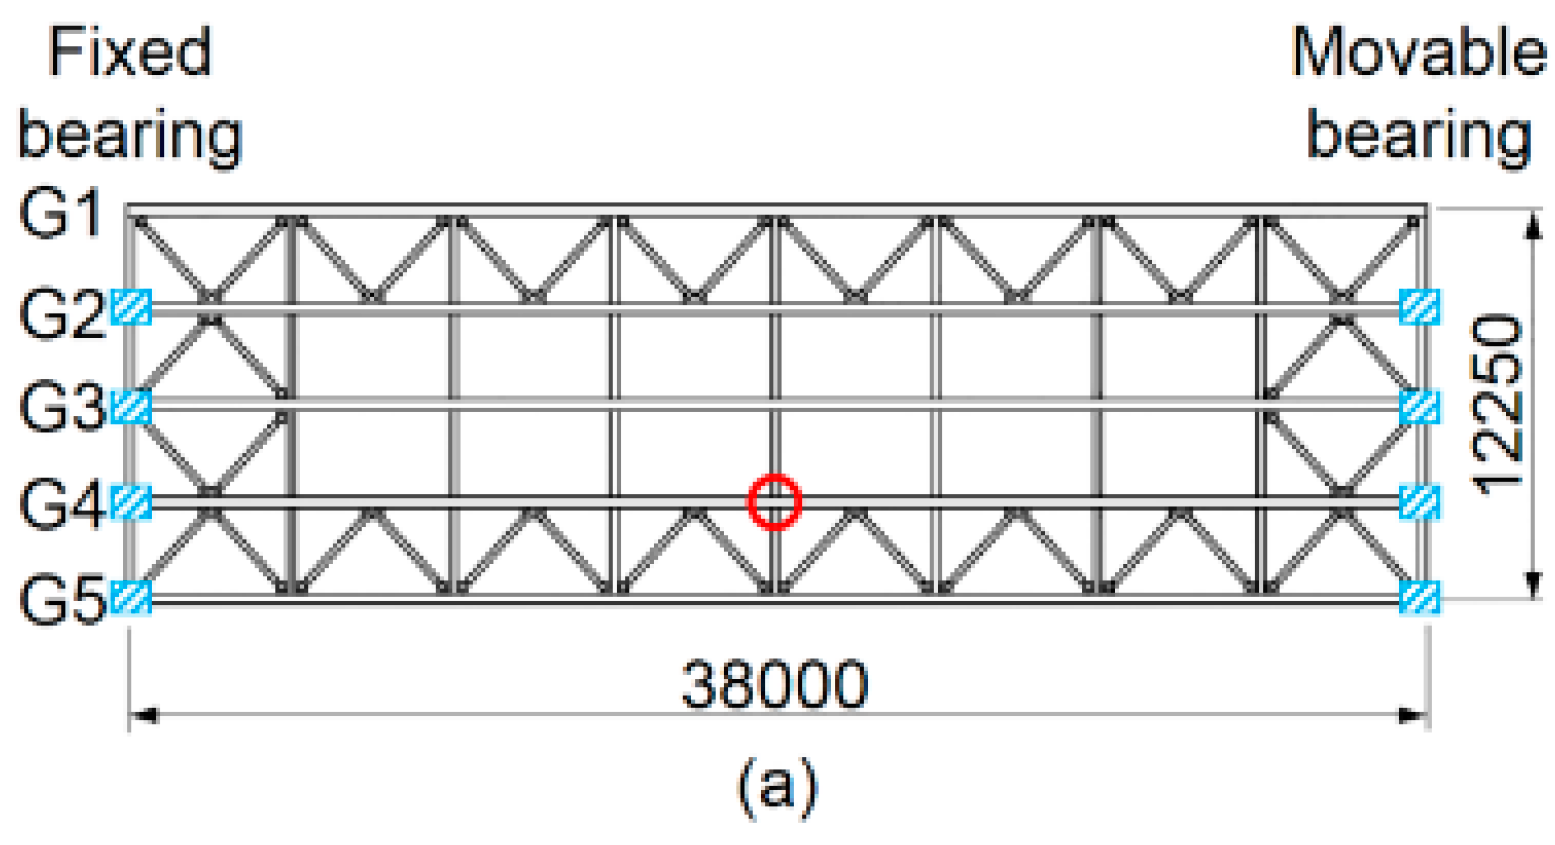
2.1. Description of Test Bridge and Measuring Instrument Used in This Study
2.2. Analysis of Bridge Rotation Angle Response under Traffic Loads
3. Calculation Method for Determining Bridge Rotation Angle from Measured Angular Velocity
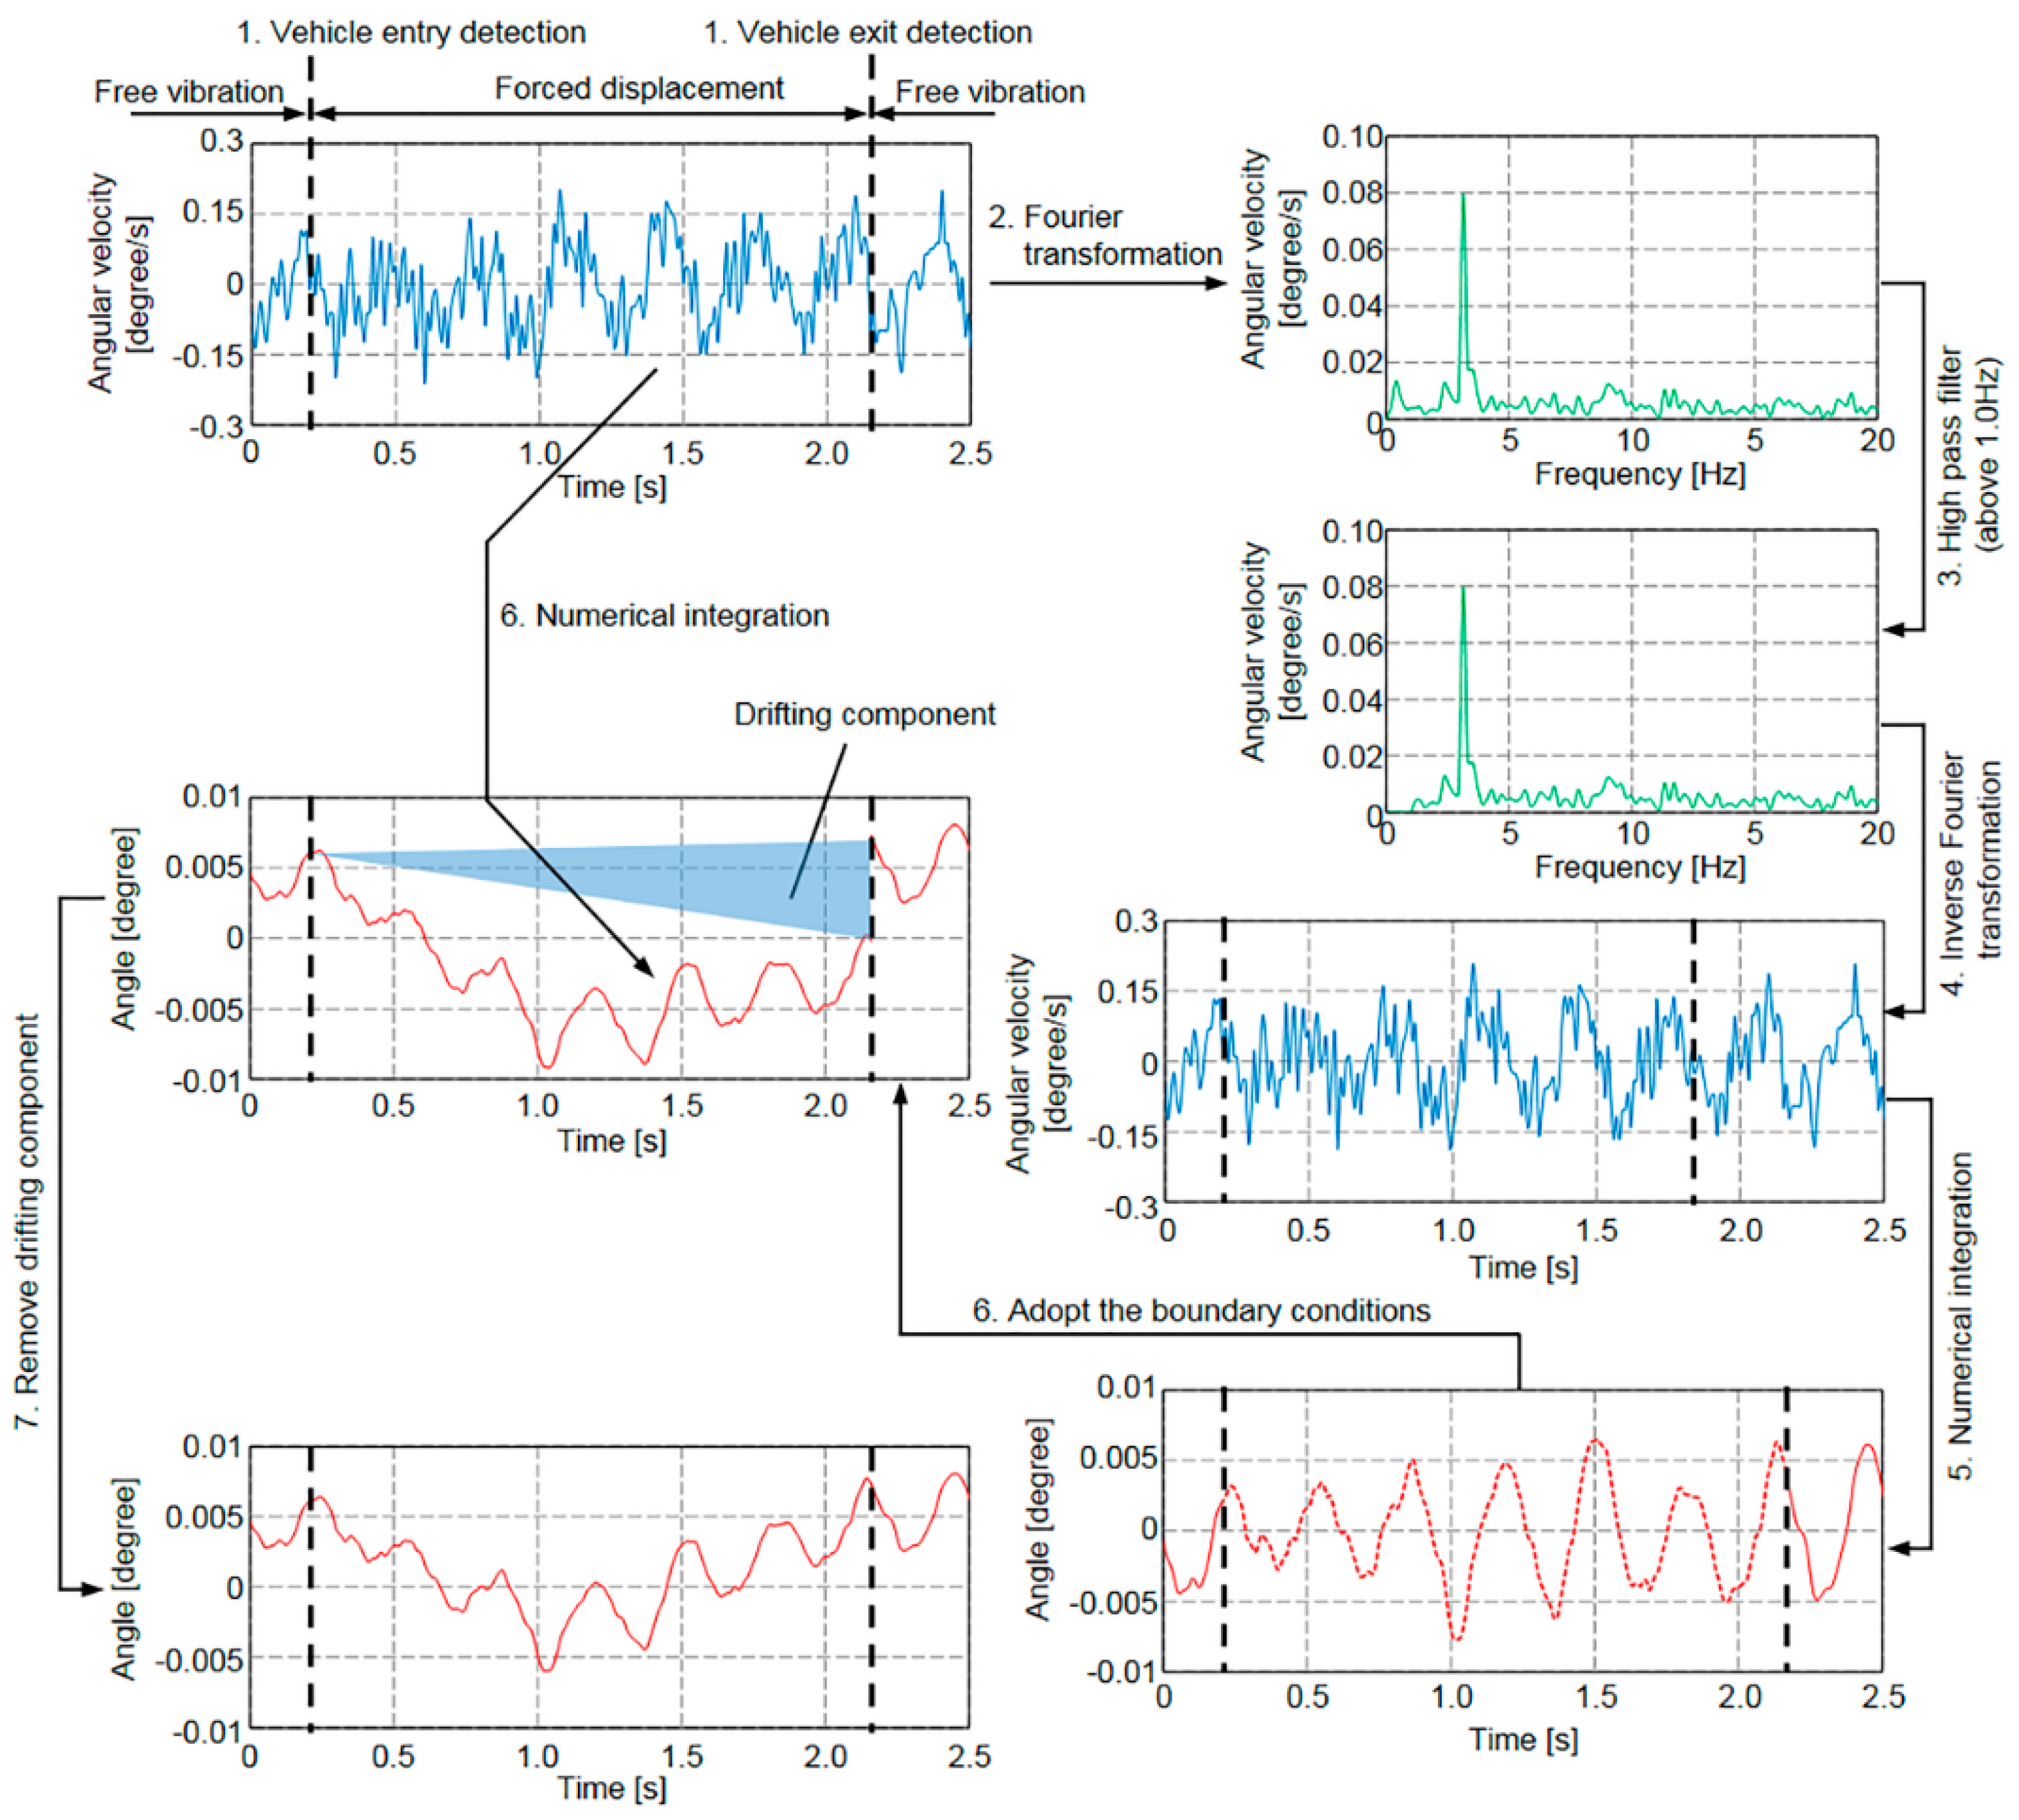
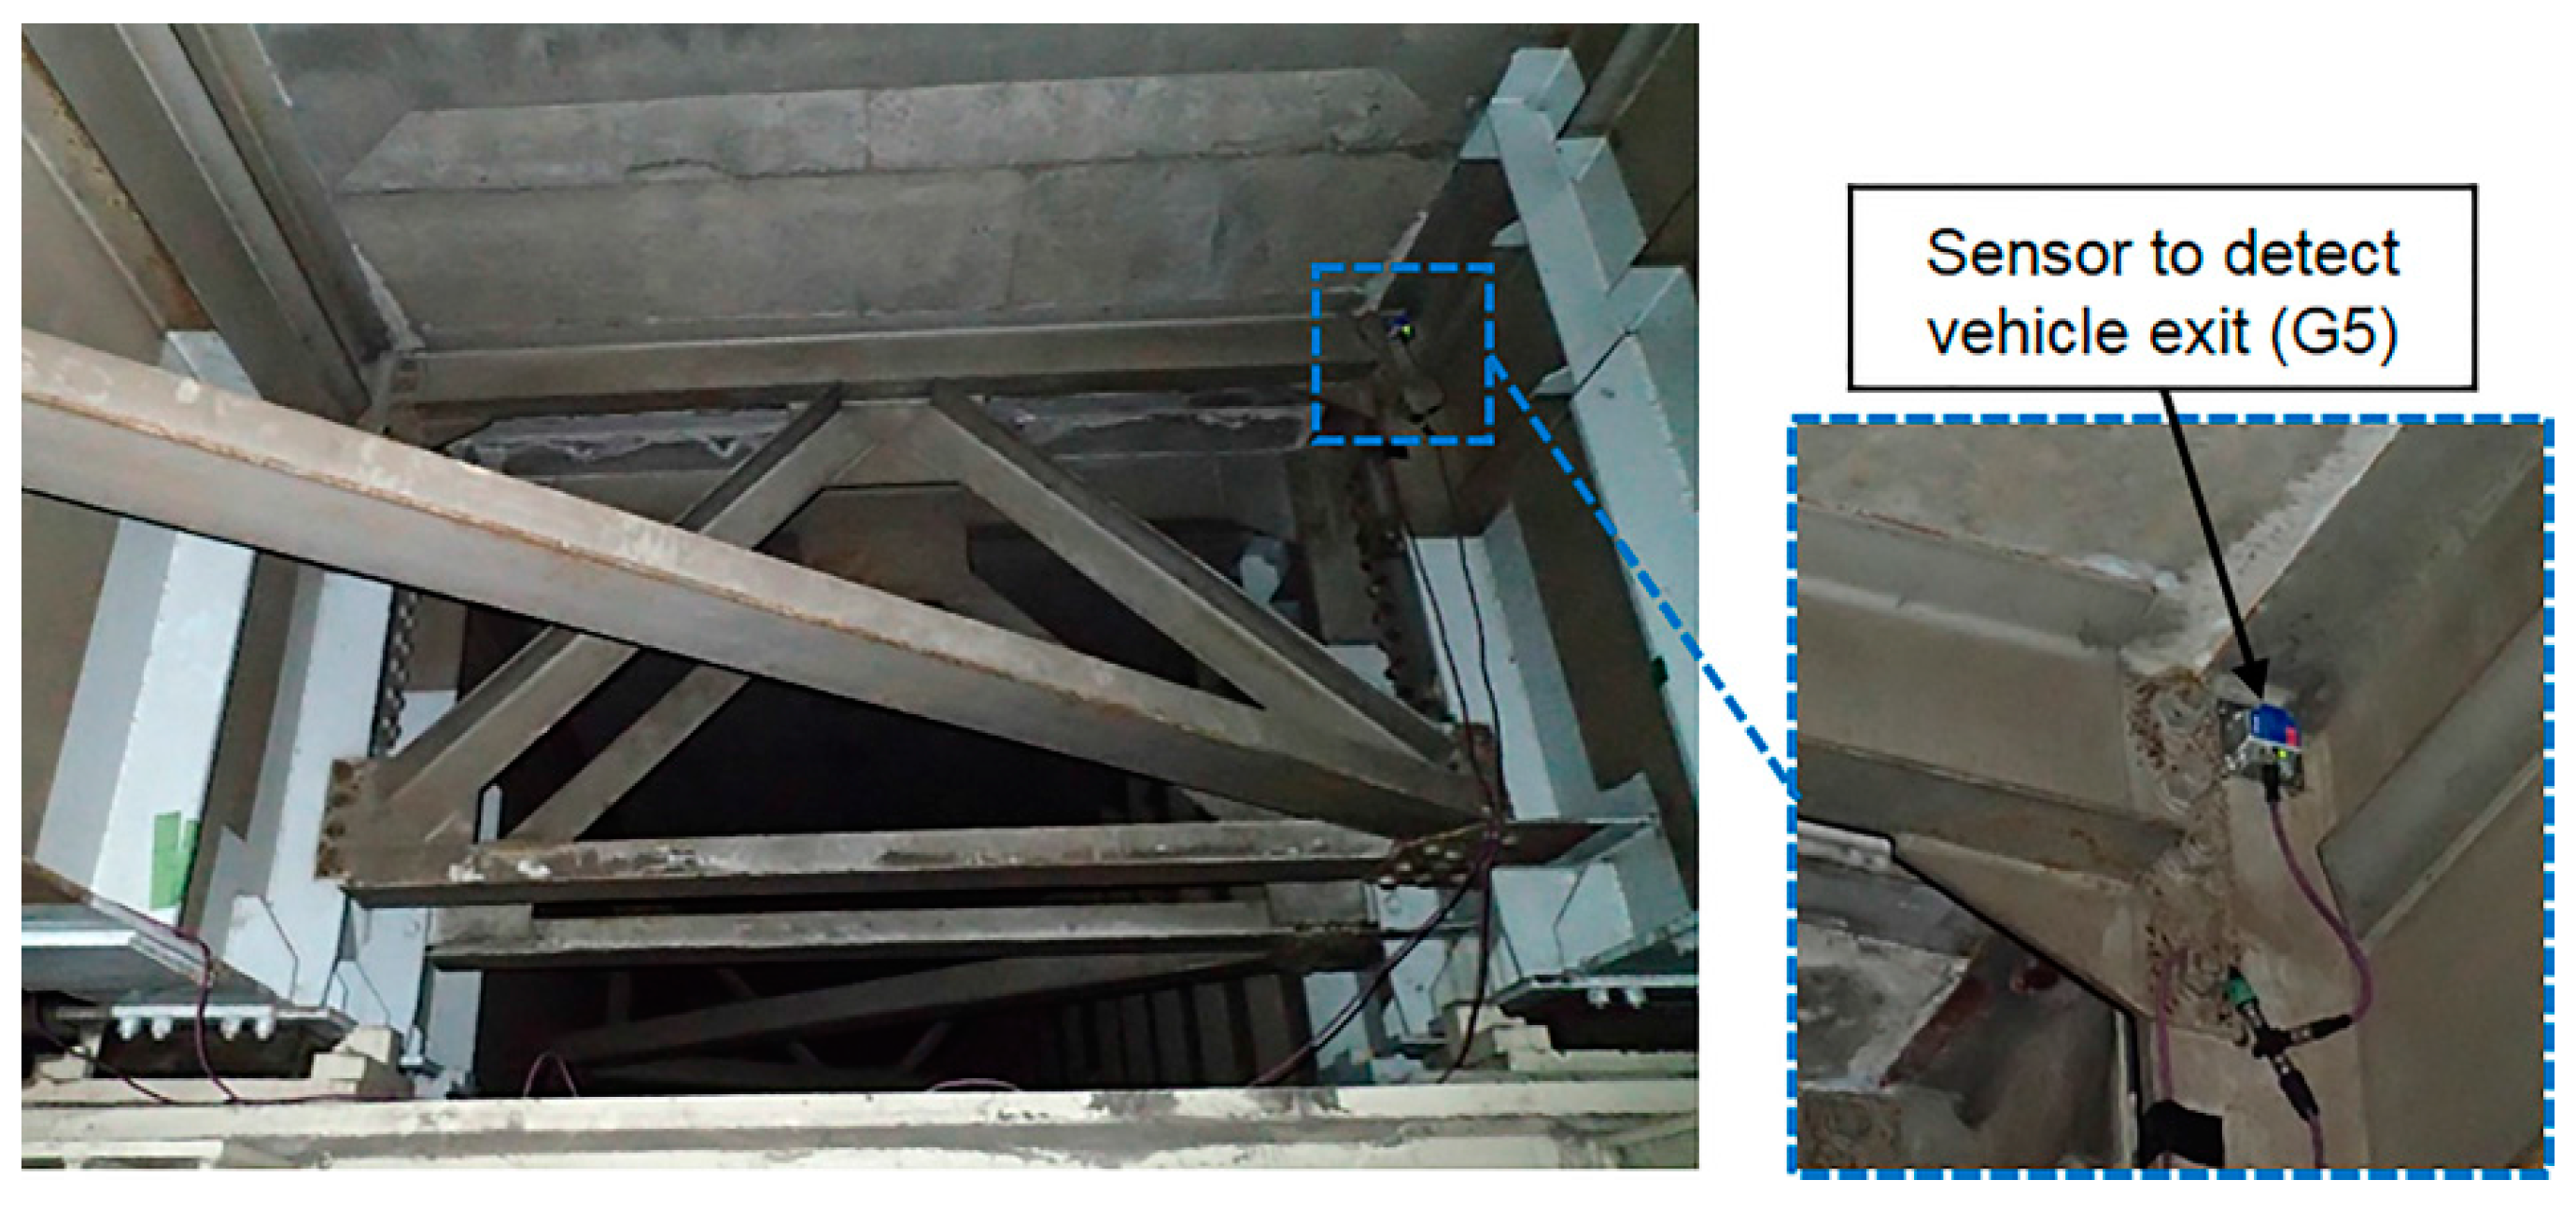
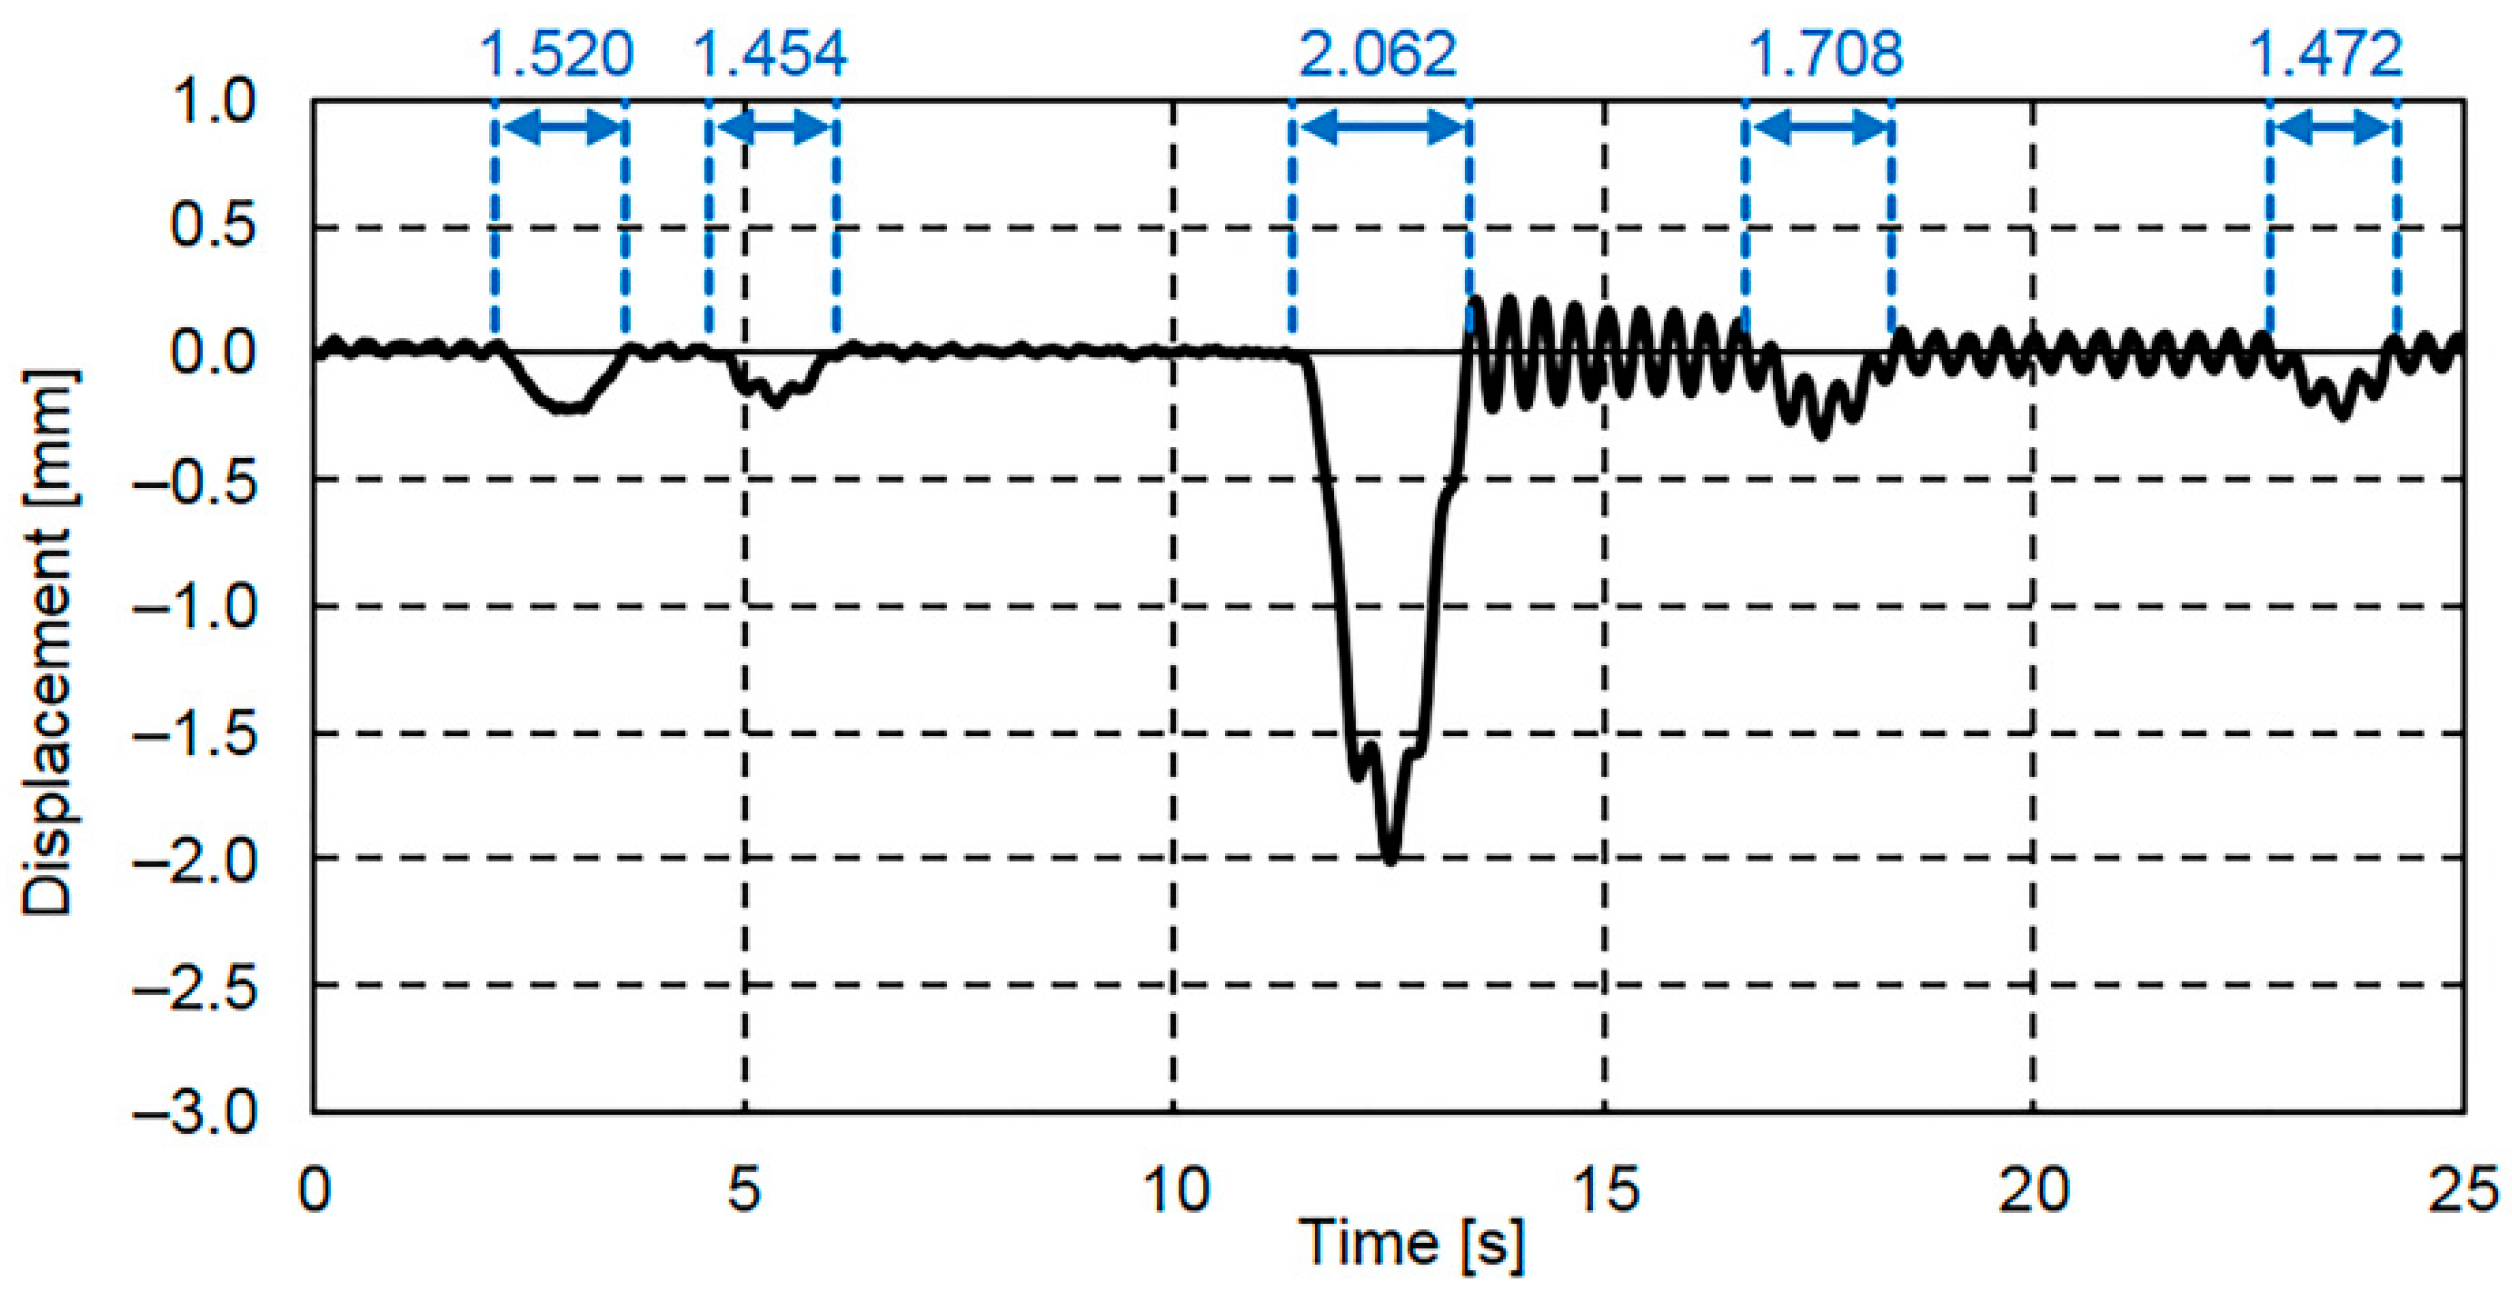
- Free and forced vibration regions are separated by precisely detecting vehicle entry and exit times. When multiple vehicles are running on the bridge, the time the first vehicle enters the bridge is the vehicle entry time and the time the last vehicle exits the bridge is the vehicle exit time.
- The angular velocity is transformed from the time domain to the frequency domain through a Fourier transform.
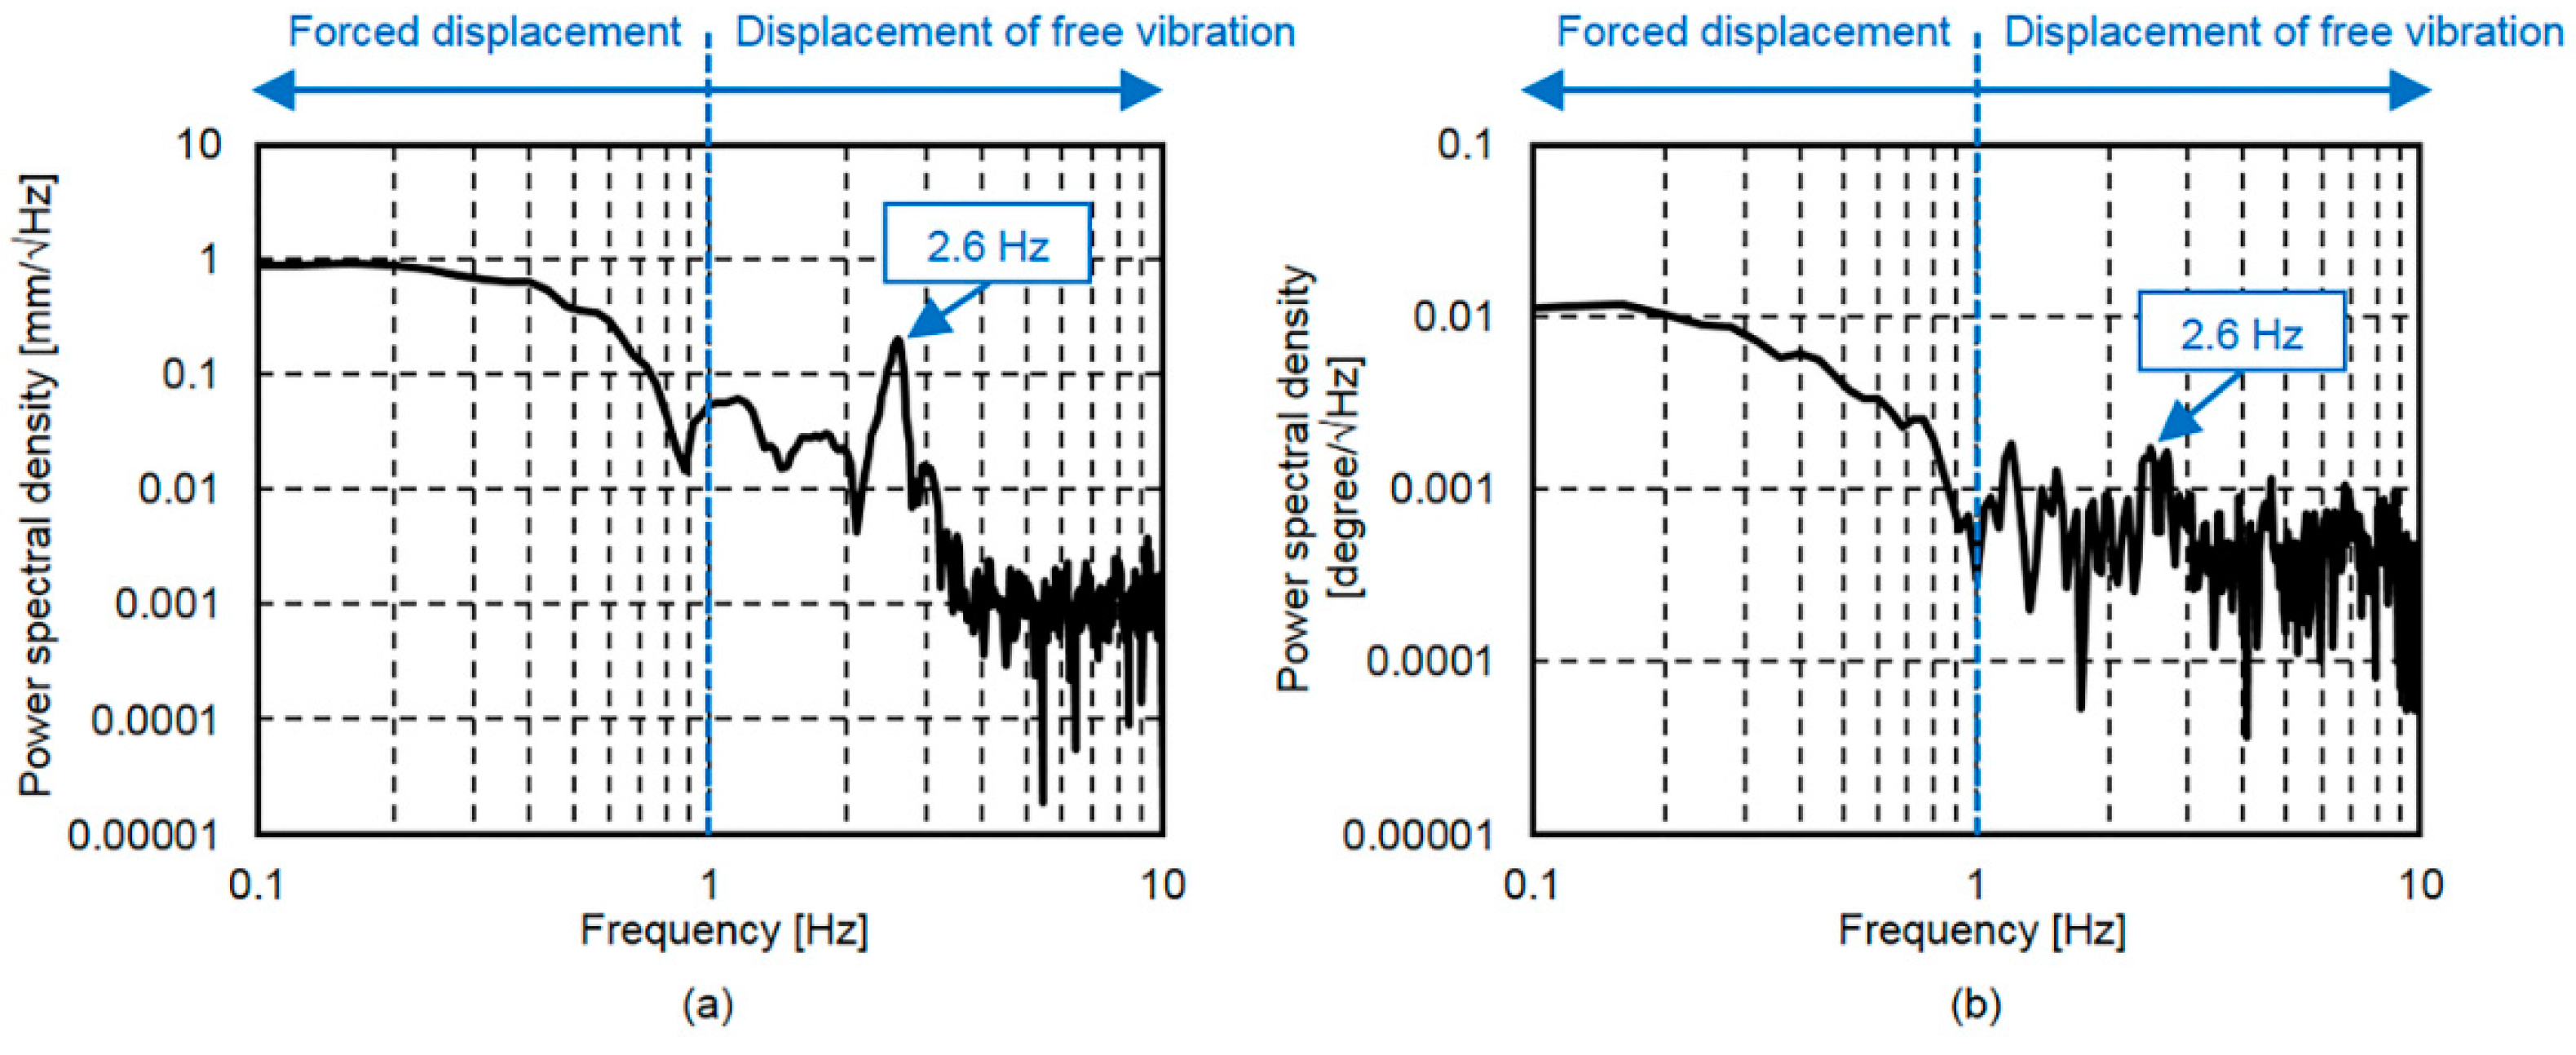
- Frequencies below 1.0 Hz are removed in order to eliminate the effect of forced displacement during vehicular passage. Although the proper high-pass filter cut-off frequency depends on the bridge length and vehicle travelling speed, since the span lengths of most girder bridges in Japan are more than 30 m and the maximum allowed speed on expressways in Japan is 100 km/h, the travelling time should be above 1.2 s, and the frequency should be below 0.9 Hz [21]. In addition, since the natural frequency of this test bridge in Figure 9 is 2.6 Hz, the cut-off frequency of the high-pass filter used in this study is 1.0 Hz.
- The angular velocity in the frequency domain, which does not have the effect of forced displacement during vehicular passage, is transformed to the time domain through an inverse Fourier transform.
- The angular velocity under free vibration conditions obtained in Step 4, which excludes the effects of vehicular forced displacement, is numerically integrated to obtain the rotation angle, thereby producing an estimate of the initial and terminal rotation angle conditions under free vibration conditions.
- The total angular velocity, which includes the angular velocity under both free and forced vibration conditions, is numerically integrated to obtain the total rotation angle. The lower and upper limits of the integration are the times when the same vehicle enters and exits the bridge, respectively. The initial rotation angle is defined as the rotation angle under free vibration conditions estimated in Step 5.
- Because of measurement errors in the measured angular velocity, which are caused by sensor noise and the limitations of A/D conversion, the integrated rotation angle does not satisfy the terminal conditions at this point. To satisfy those conditions, the drift component is subtracted from the integrated rotation angle.
4. Results and Discussion
4.1. Test Procedure
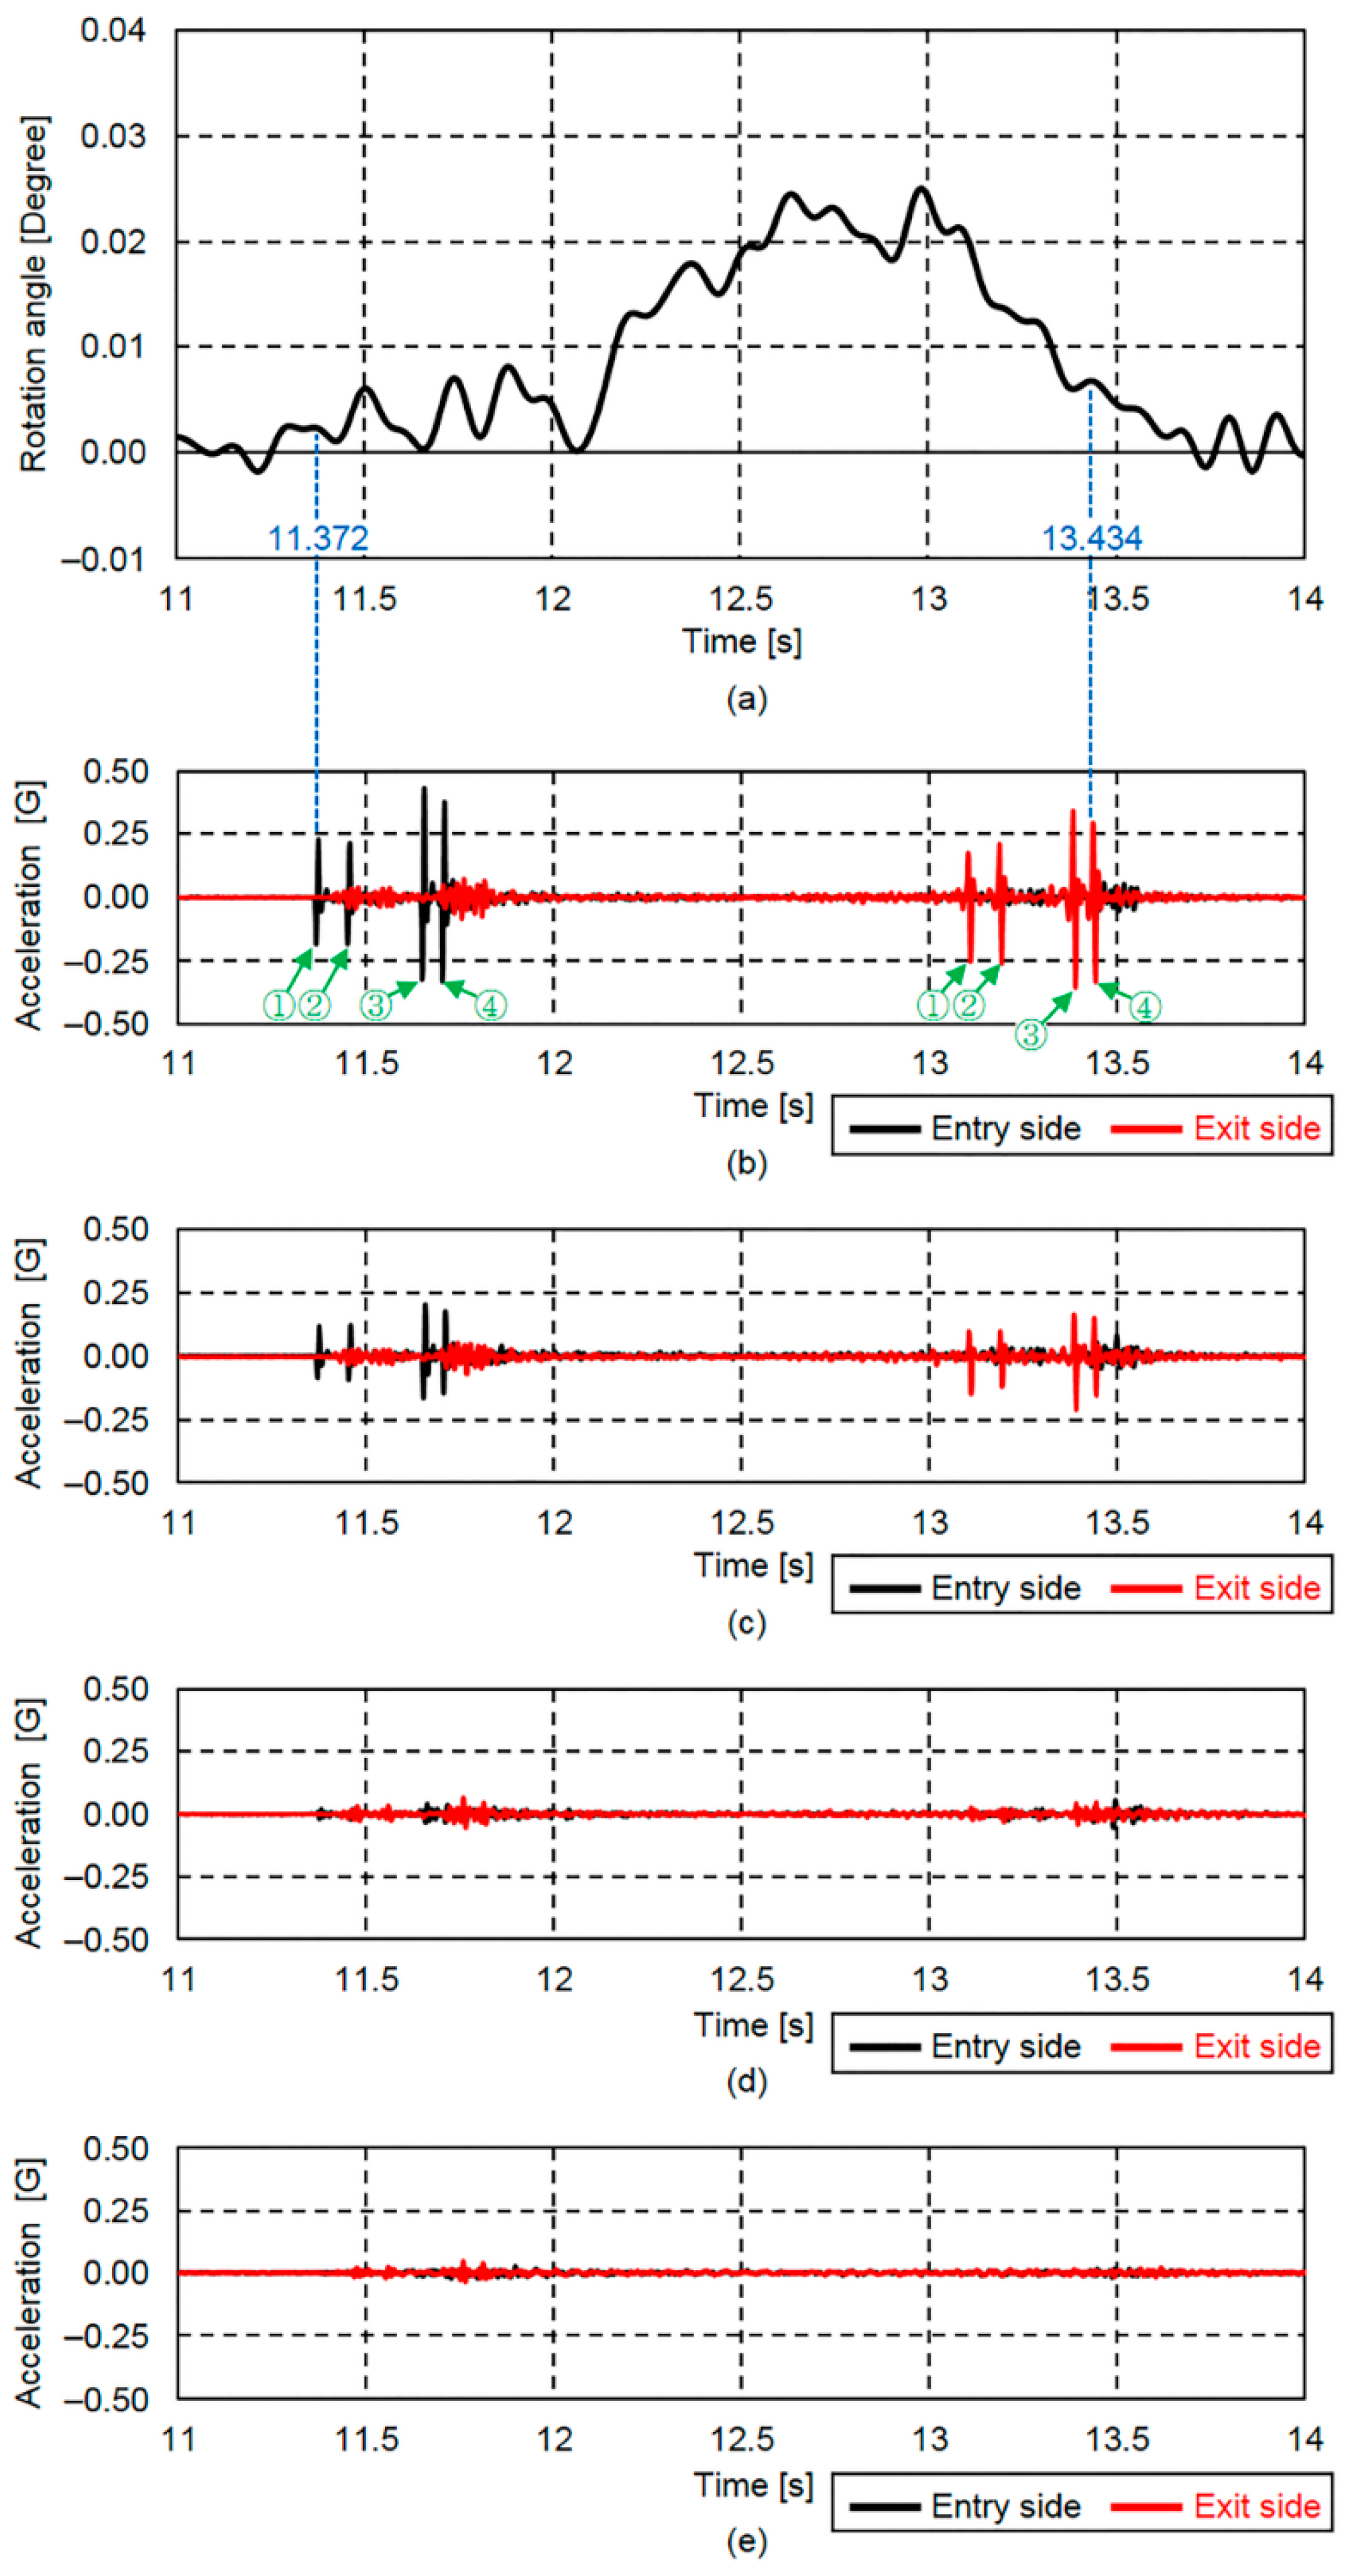
- Vehicle entry and exit times are detected by eight MEMS IMUs at the vertical stiffeners on both longitudinal edges of the main girders.
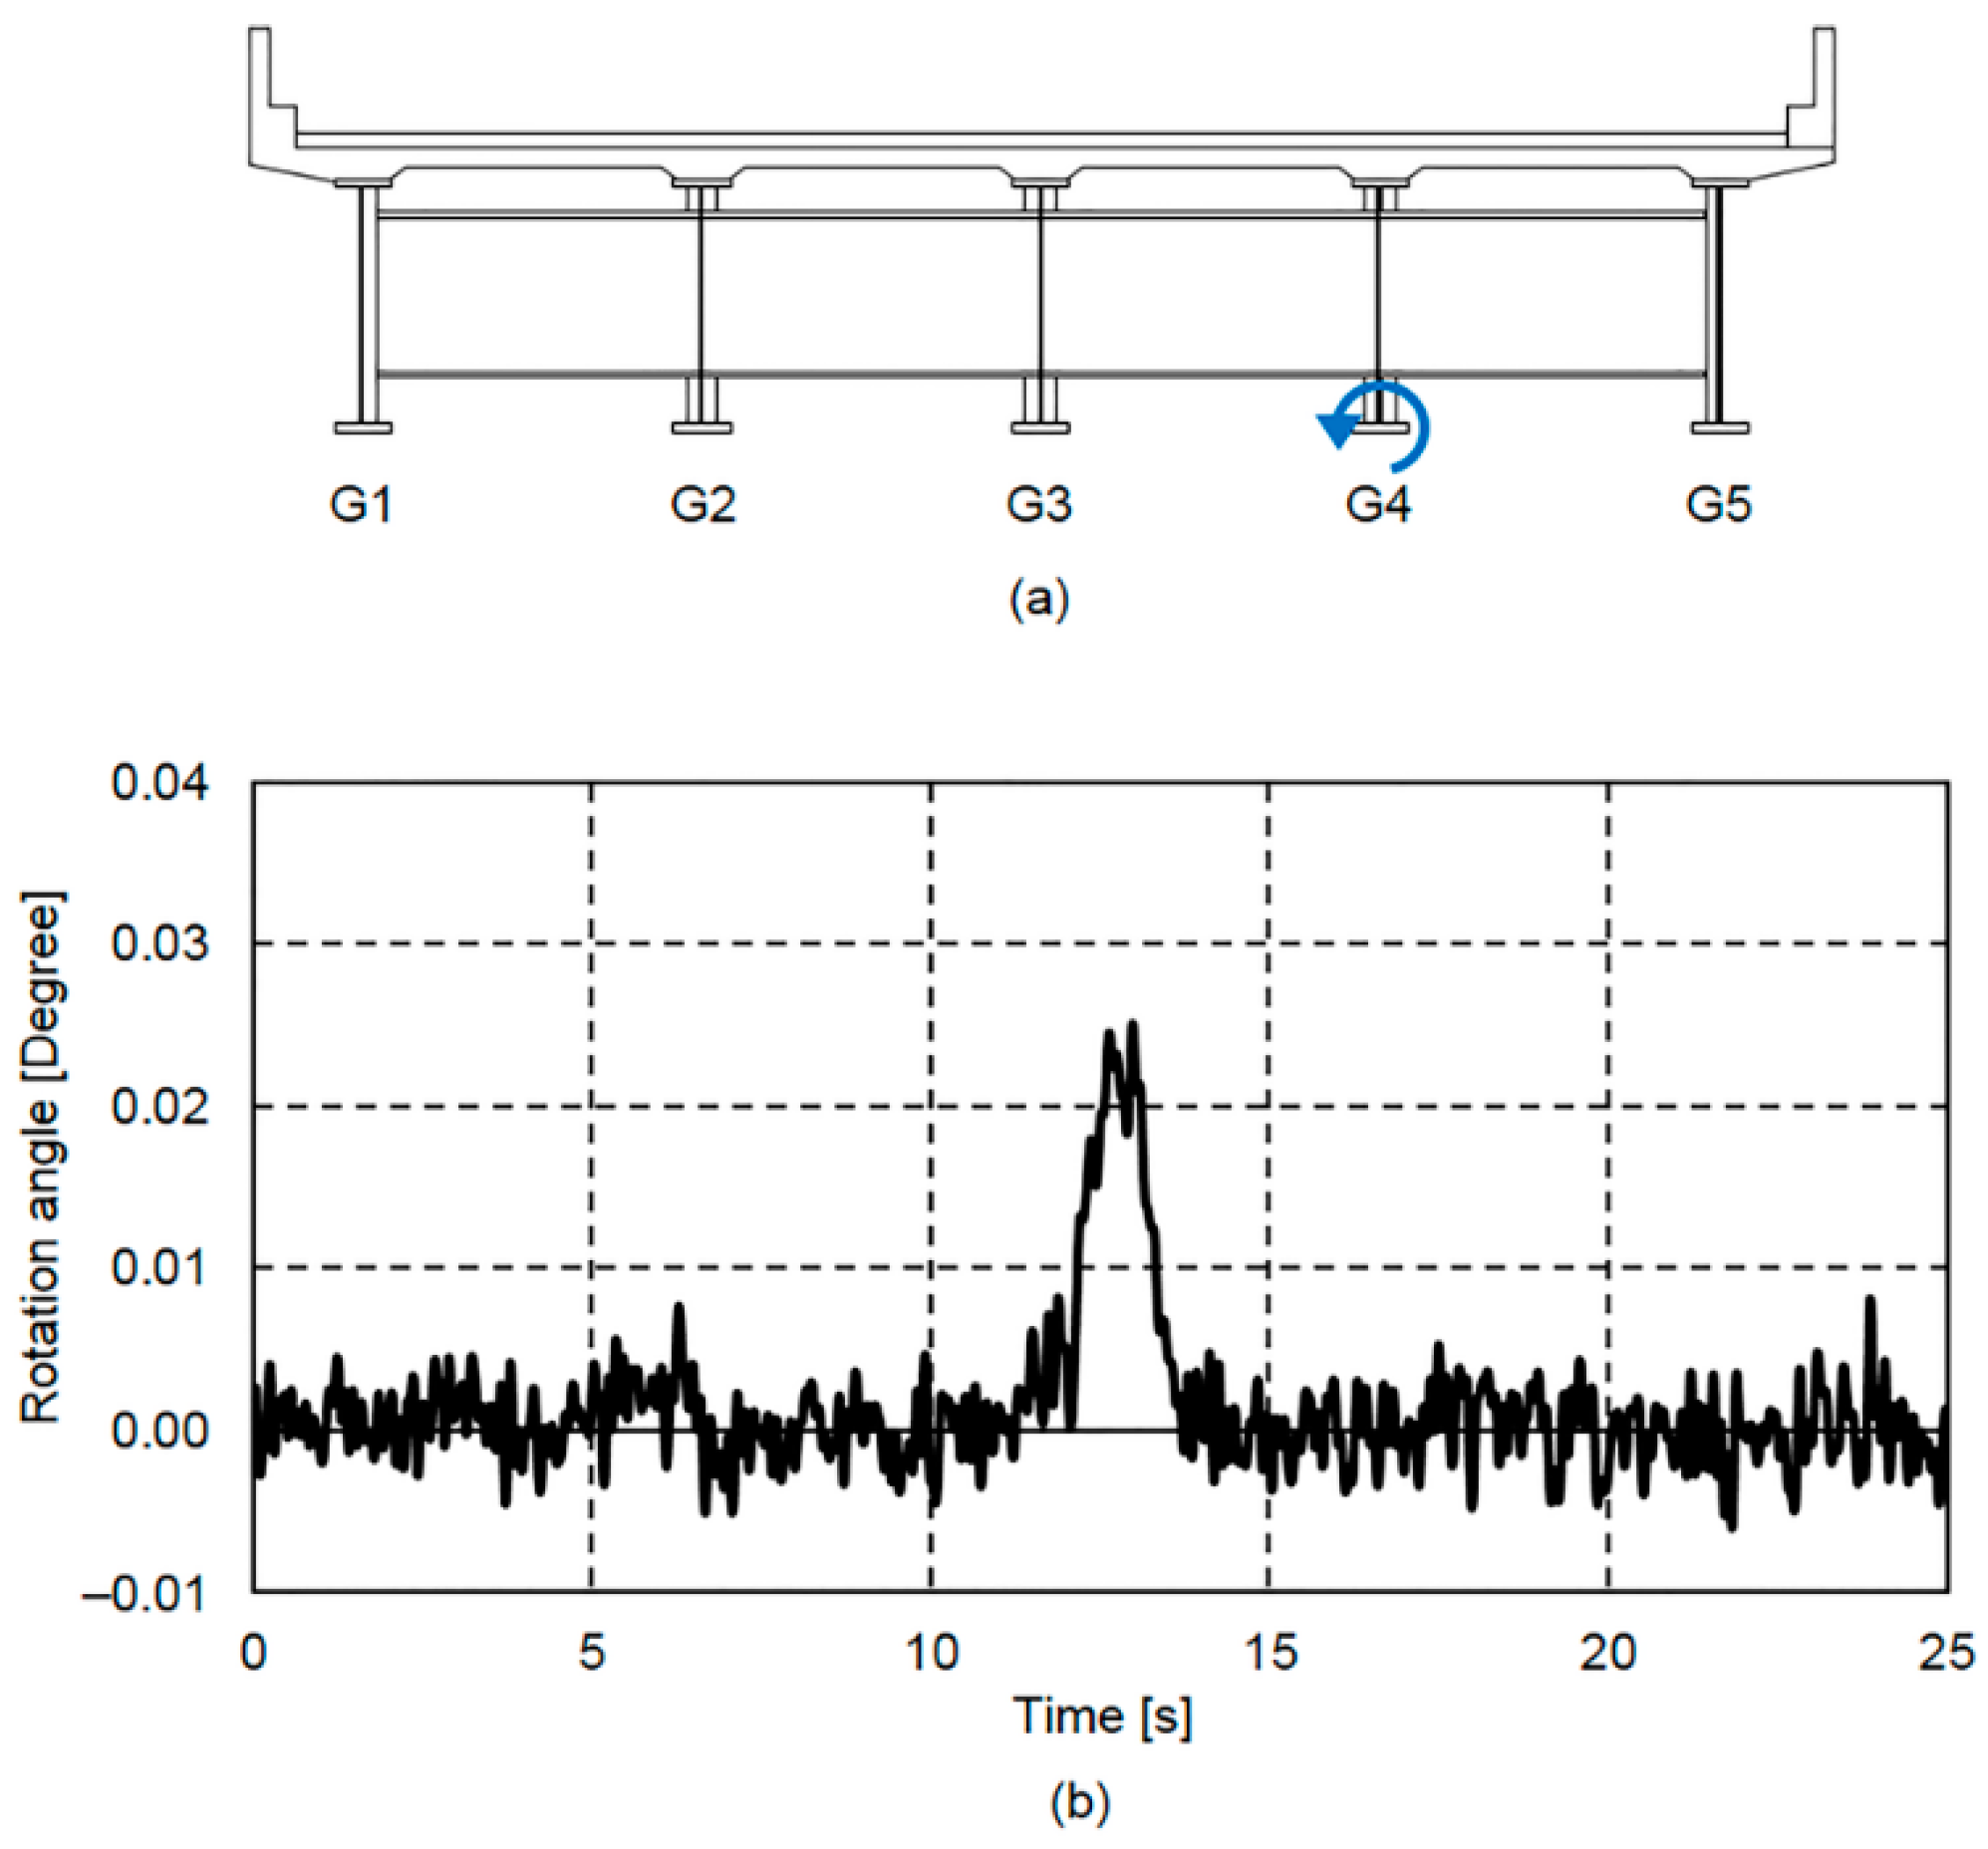
- The angle rotation response at the longitudinal center of the lower flange of G4 is determined from the measured angular velocity at the longitudinal center of that lower flange by using the detected vehicle entry and exit times and the proposed method.
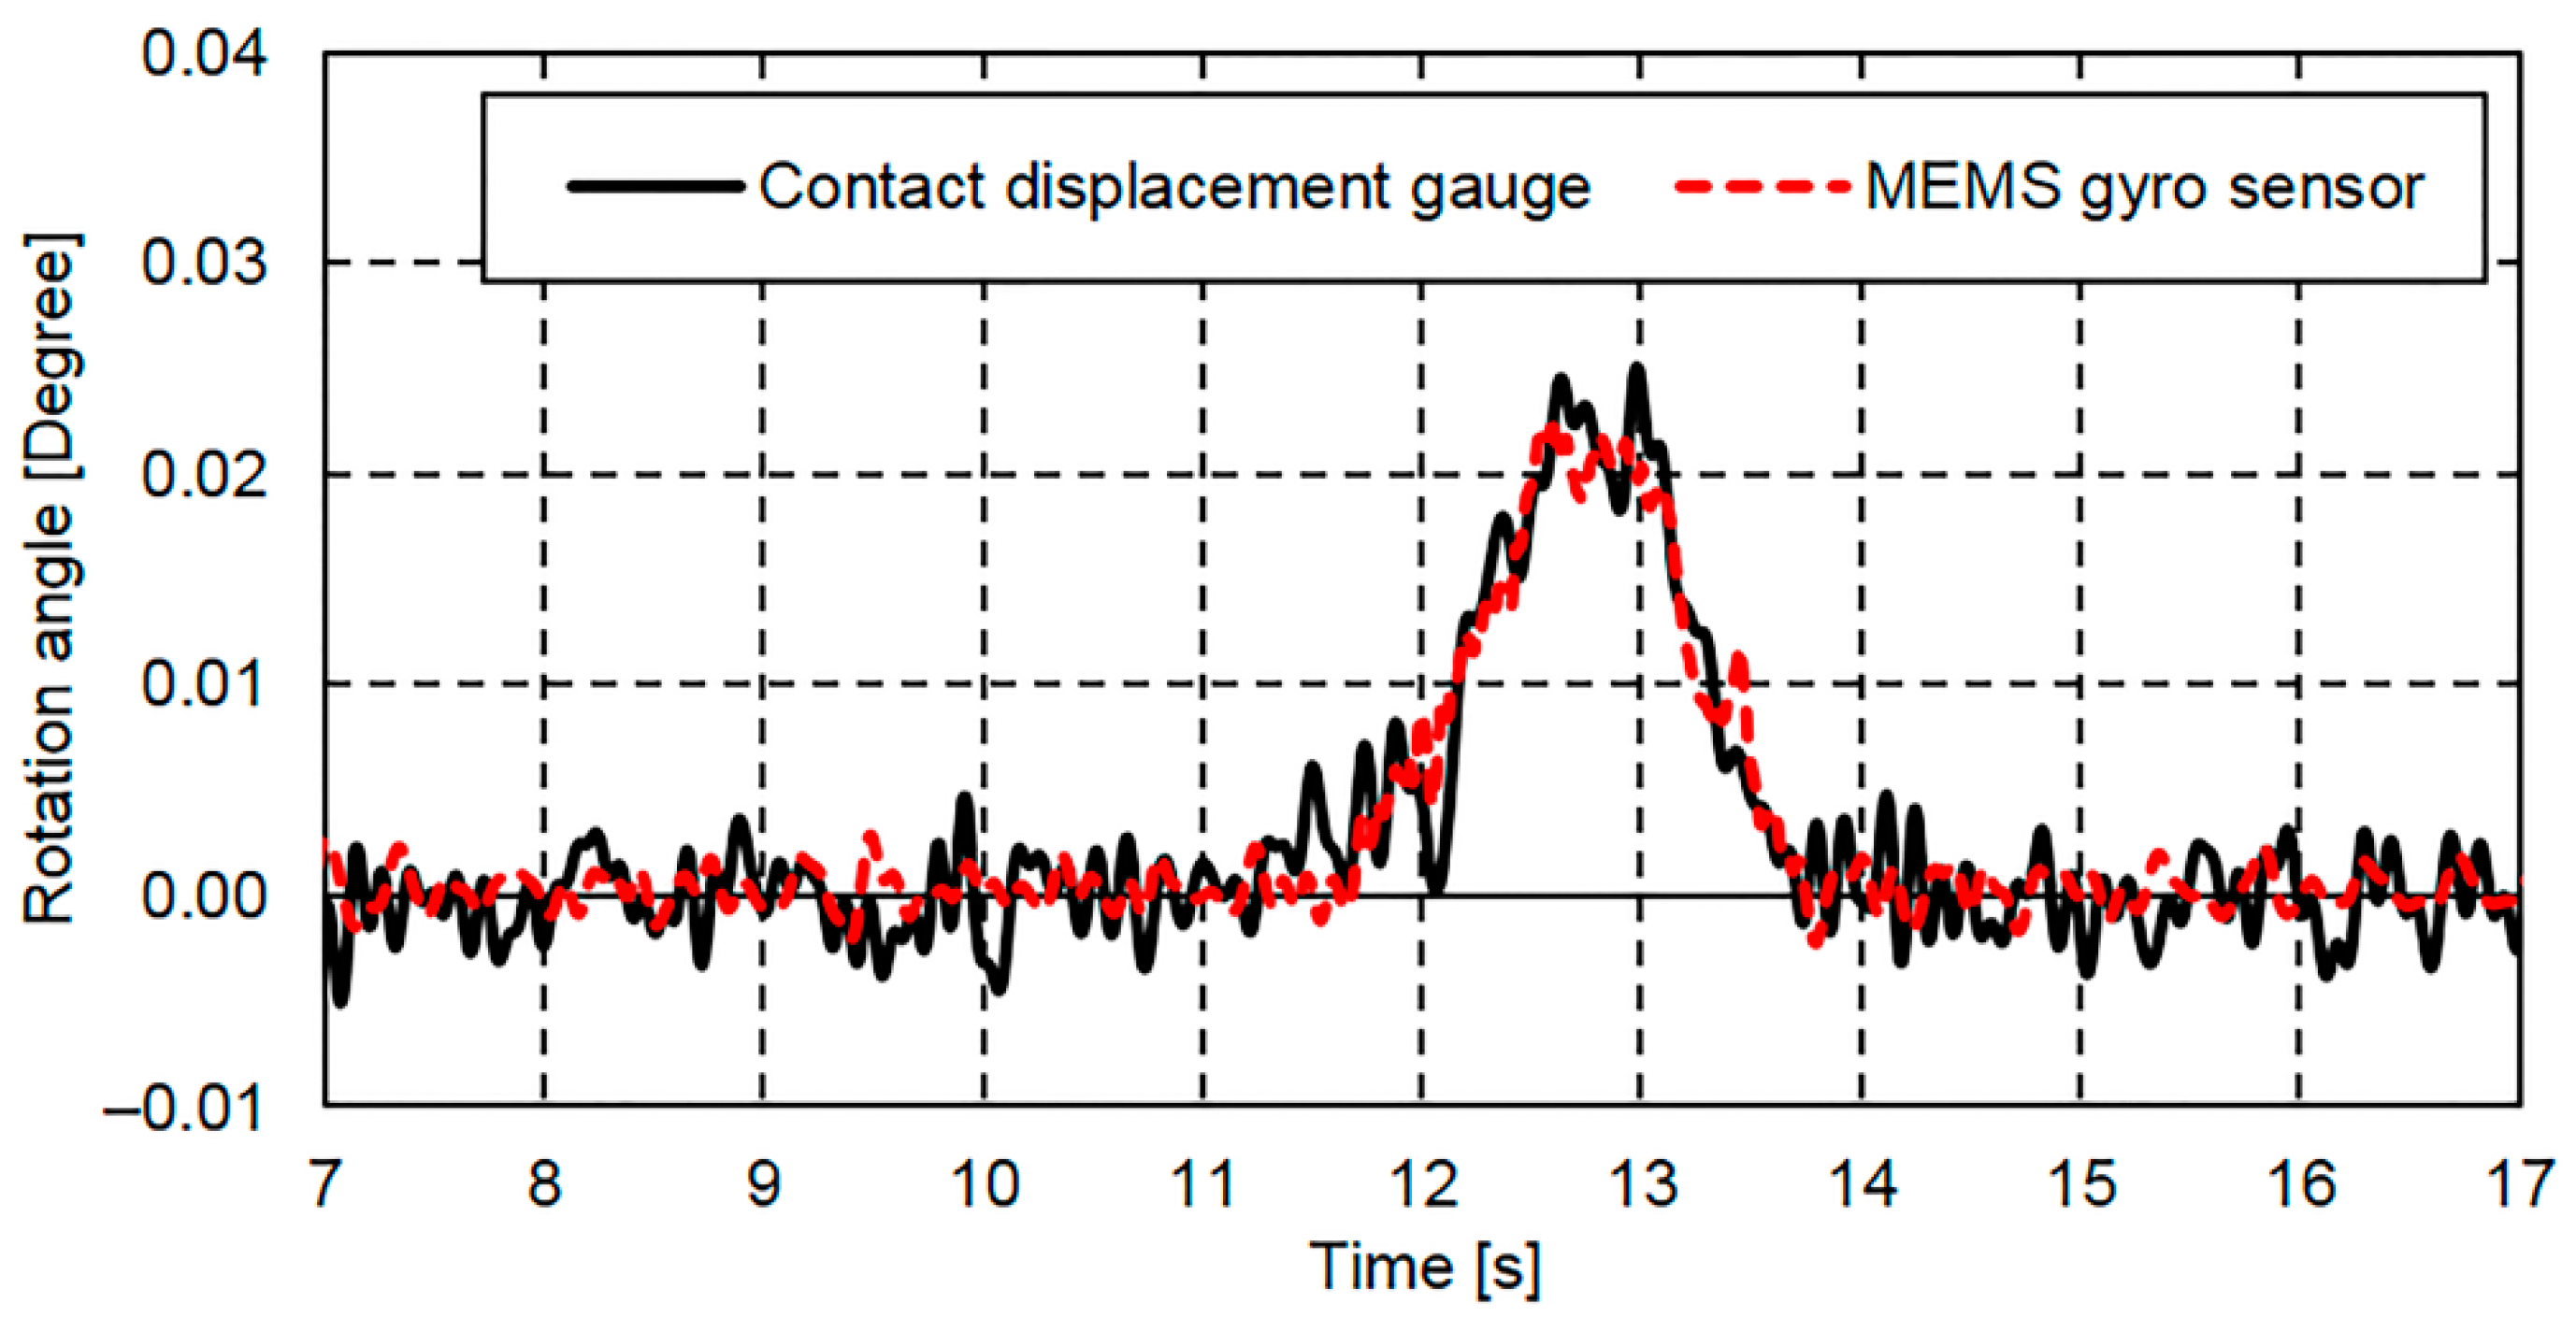
- Accuracy verification is conducted by comparing the rotation angle response determined from the measured angular velocity and those determined by the two contact displacement gauges.
4.2. Vehicle Detection Results Using Eight MEMS IMUs
4.3. Verification of the Rotation Angle Response Determined from Measured Angular Velocity
5. Conclusions
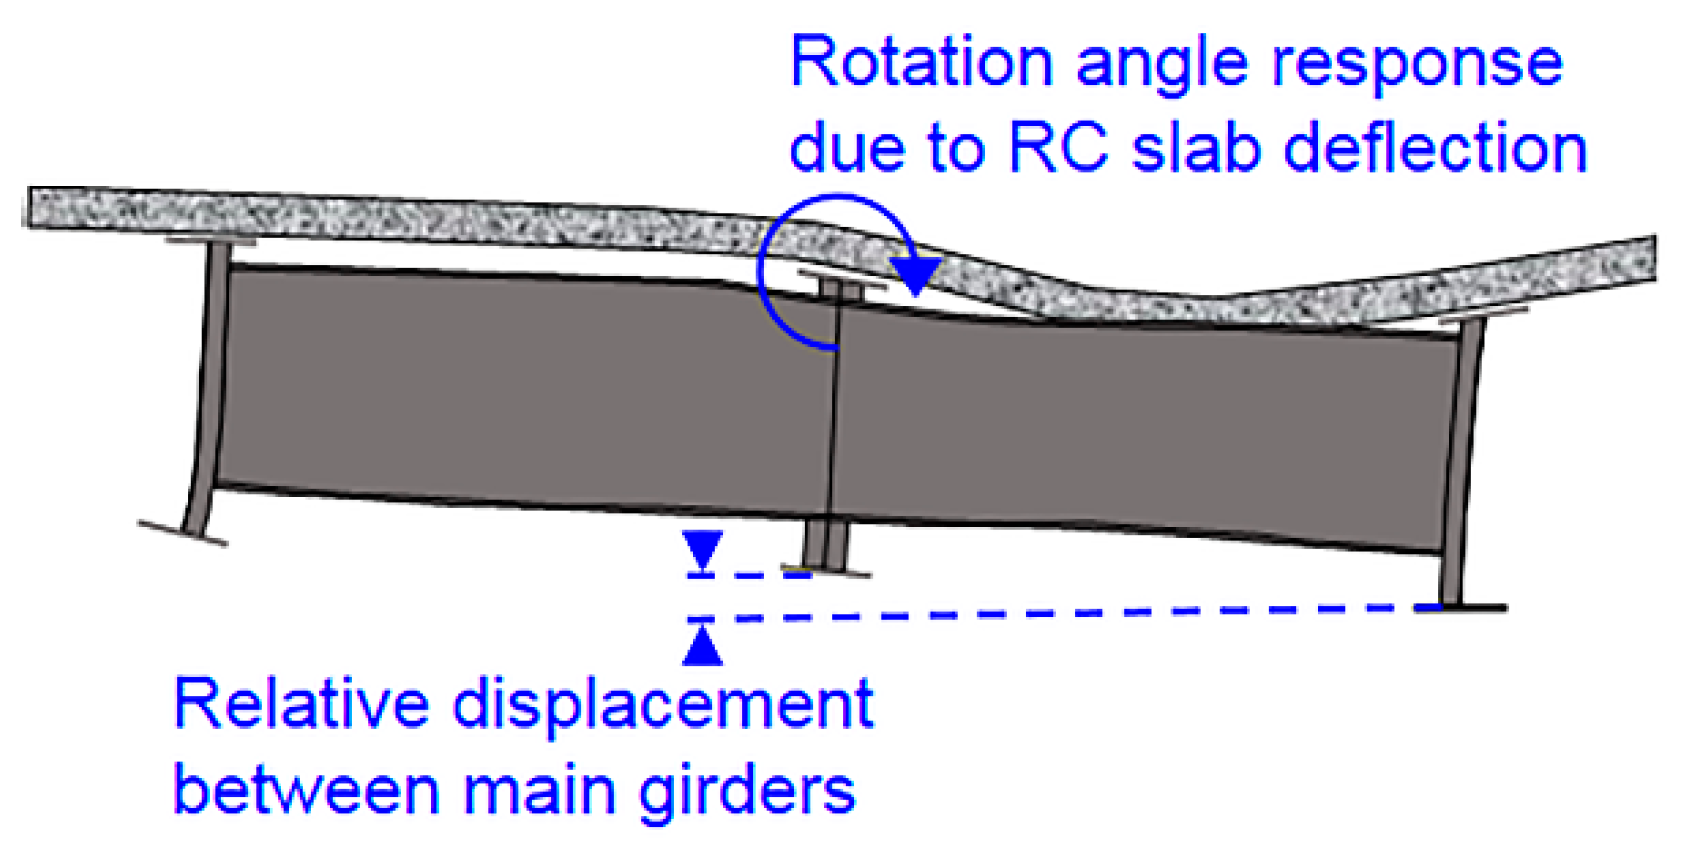
- It was found that, as with the displacement response, the rotation angle response is largely classified into the response due to forced displacement, which consists of frequencies below 1.0 Hz, and the free vibration response. This result was achieved as a result of comparisons between the bridge displacement response spectrum and the bridge rotation angle response spectrum.
- Based on the bridge rotation angle response characteristics, which are largely classified into the rotation angle responses due to forced displacement and free vibration displacement responses, a method for determining the bridge rotation angle response from the measured angular velocity was proposed.
- Vehicle entry and exit times and the vehicle travelling lane could be estimated using acceleration responses measured by eight MEMS IMUs. This system worked by comparing the maximum acceleration response values measured at the longitudinal edges of each main girder.
- The determined rotation angle responses using IMU and the proposed method were found to be in good agreement with the reference rotation angle responses calculated by the two contact displacement gauges. This outcome was obtained by examining the results of field measurements taken from an in-service bridge using nine IMUs and two contact displacement gauges.
Acknowledgments
Author Contributions
Conflicts of Interest
Abbreviations
| IMU | inertial measurement unit |
| MEMS | micro-electro-mechanical systems |
| LDVT | linear variable differential transformer |
| LDV | laser Doppler vibrometer |
| RC | reinforced concrete |
References
- Fisher, J.W. Fatigue and Fracture in Steel Bridges, 1st ed.; John Wiley & Sons, Inc.: Hoboken, NJ, USA, 1984. [Google Scholar]
- Fisher, J.W.; Fisher, T.A.; Kostem, C.N. Displacement induced fatigue cracks. Eng. Struct. 1979, 1, 252–257. [Google Scholar] [CrossRef]
- Gan, W.; Hu, W.; Liu, F.; Tang, J.; Li, S.; Yang, Y. Bridge Continuous Deformation Measurement Technology Based on Fiber Optic Gyro. Photonic Sens. 2016, 6, 71–77. [Google Scholar] [CrossRef]
- Pakzad, S.N.; Fenves, G.L. Statistical analysis of vibration modes of a suspension bridge using spatially dense wireless sensor network. J. Struct. Eng. 2009, 135, 863–872. [Google Scholar] [CrossRef]
- Rice, J.A.; Mechitov, K.A.; Sim, S.H.; Spencer, B.F.; Agha, G.A. Enabling framework for structural health monitoring using smart sensors. Struct. Health Monit. 2011, 18, 574–587. [Google Scholar] [CrossRef]
- Lynch, J.P.; Wang, Y.; Loh, K.J.; Yi, J.-H.; Yun, C.-B. Performance monitoring of the Geumdang Bridge using a dense network of high-resolution wireless sensors. Smart Mater. Struct. 2006, 15, 1561–1575. [Google Scholar] [CrossRef]
- Shinozuka, M.; Papakonstantinou, K.G.; Torbol, M.; Kim, S. Real-time remote monitoring: The DuraMote platform and experiments towards future, advanced, large-scale SCADA systems. Struct. Infrastruct. Eng. 2015, 11, 588–603. [Google Scholar] [CrossRef]
- Ha, D.W.; Park, H.S.; Choi, S.W.; Kim, Y. A Wireless MEMS-based inclinometer sensor node for structural health monitoring. Sensors 2013, 13, 16090–16104. [Google Scholar] [CrossRef] [PubMed]
- Nagayama, T.; Moinzadeh, P.; Mechitov, K.; Ushita, M.; Makihata, N.; Ieri, M.; Agha, G.; Spencer, B.F.; Fujino, Y.; Seo, J.W. Reliable multi-hop communication for structural health monitoring. Smart Struct. Syst. 2010, 6, 481–504. [Google Scholar] [CrossRef]
- Gindy, M.; Vaccaro, R.; Nassif, N. A state-space approach for deriving bridge displacement from acceleration. Comput. Aided Civ. Inf. 2008, 23, 281–290. [Google Scholar] [CrossRef]
- Nassif, H.H.; Gindy, M.; Davis, J. Comparison of laser Doppler vibrometer with contact sensors for monitoring bridge deflection and vibration. NDT E Int. 2005, 38, 213–218. [Google Scholar] [CrossRef]
- Miyashita, T.; Fujino, Y. Development of three-dimensional measurement system using laser Doppler vibrometers. J. Jpn. Soc. Civ. Eng. A 2007, 63, 561–575. (In Japanese) [Google Scholar] [CrossRef]
- Yoneyama, S.; Kitagawa, A.; Iwata, S.; Tani, K.; Kikuta, H. Bridge deflection measurement using digital image correlation. Exp. Tech. 2007, 31, 34–40. [Google Scholar] [CrossRef]
- Lee, J.J.; Shinozuka, M. A vision-based system for remote sensing of bridge displacement. NDT E Int. 2006, 39, 425–431. [Google Scholar] [CrossRef]
- Yoneyama, S.; Ueda, H. Bridge deflection measurement using digital image correlation with camera movement correction. Mater. Trans. 2012, 53, 285–290. [Google Scholar] [CrossRef]
- Cho, S.; Sim, S.-H.; Park, J.-W.; Lee, J. Extension of indirect displacement estimation method using acceleration and strain to various types of beam structures. Smart Struct. Syst. 2014, 14, 699–718. [Google Scholar] [CrossRef]
- Park, K.-T.; Kim, S.-H.; Park, H.-S.; Lee, K.-W. The determination of bridge displacement using measured acceleration. Eng. Struct. 2005, 27, 371–378. [Google Scholar] [CrossRef]
- Gindy, M.; Nassif, H.H.; Velde, J. Bridge displacement estimates from measured acceleration records. J. Transp. Res. Board 2007, 2028, 136–145. [Google Scholar] [CrossRef]
- Park, J.-W.; Sim, S.-H.; Jung, H.-J. Wireless displacement sensing system for bridges using multi-sensor fusion. Smart Mater. Struct. 2014, 23, 1–12. [Google Scholar] [CrossRef]
- Park, J.-W.; Sim, S.-H.; Jung, H.-J.; Spencer, B.F. Development of a wireless displacement measurement system using acceleration responses. Sensors 2013, 13, 8377–8392. [Google Scholar] [CrossRef] [PubMed] [Green Version]
- Sekiya, H.; Kimura, K.; Miki, C. Technique for determining bridge displacement response using MEMS accelerometers. Sensors 2016, 16, 257. [Google Scholar] [CrossRef] [PubMed]
- Hou, X.; Yang, X.; Huang, Q. Using inclinometers to measure bridge deflection. J. Bridge Eng. 2005, 10, 564–569. [Google Scholar] [CrossRef]
- Sugisaki, K.; Abe, M.; Koshimizu, S. Inclination and vibration measurement by inertial sensing for structural health monitoring. J. Jpn. Soc. Civ. Eng. A1 2012, 68, 216–225. (In Japanese) [Google Scholar] [CrossRef]


| IMU | Measurement Range | Frequency Bandwidth | Sampling Frequency | Resolution | Noise Density |
|---|---|---|---|---|---|
| M-G550-PC (SEIKO EPSON Co., Ltd. (Suwa, Japan)) | ±300 [°/s] | 133 (−3 dB) [Hz] | 100 [Hz] | 0.0125 [(°/s)/LSB] | 0.004 [(°/s)/√Hz] |
| M-G550-PC (SEIKO EPSON Co., Ltd. (Suwa, Japan)) | ±29.4 [m/s2] | 148 (−3dB) [Hz] | 500 [Hz] | 1226 [μm/s2] | 981 [μm/(s2√Hz)] |
| Contact Displacement Gauge | Capacity [mm] | Sensitivity [×10–6 Strain/mm] | Nonlinearity [mm] | Sampling Frequency [Hz] |
|---|---|---|---|---|
| CDP-50 (Tokyo Sokki Kenkyujo Co., Ltd. (Tokyo, Japan)) | 0–50 | 200 | 0.1% RO | 100 |
© 2016 by the authors; licensee MDPI, Basel, Switzerland. This article is an open access article distributed under the terms and conditions of the Creative Commons Attribution (CC-BY) license (http://creativecommons.org/licenses/by/4.0/).
Share and Cite
Sekiya, H.; Kinomoto, T.; Miki, C. Determination Method of Bridge Rotation Angle Response Using MEMS IMU. Sensors 2016, 16, 1882. https://doi.org/10.3390/s16111882
Sekiya H, Kinomoto T, Miki C. Determination Method of Bridge Rotation Angle Response Using MEMS IMU. Sensors. 2016; 16(11):1882. https://doi.org/10.3390/s16111882
Chicago/Turabian StyleSekiya, Hidehiko, Takeshi Kinomoto, and Chitoshi Miki. 2016. "Determination Method of Bridge Rotation Angle Response Using MEMS IMU" Sensors 16, no. 11: 1882. https://doi.org/10.3390/s16111882