
Evaluating Quantum Dot Performance in Homogeneous FRET Immunoassays for Prostate Specific Antigen


Abstract
:1. Introduction
2. Materials and Methods
2.1. Materials
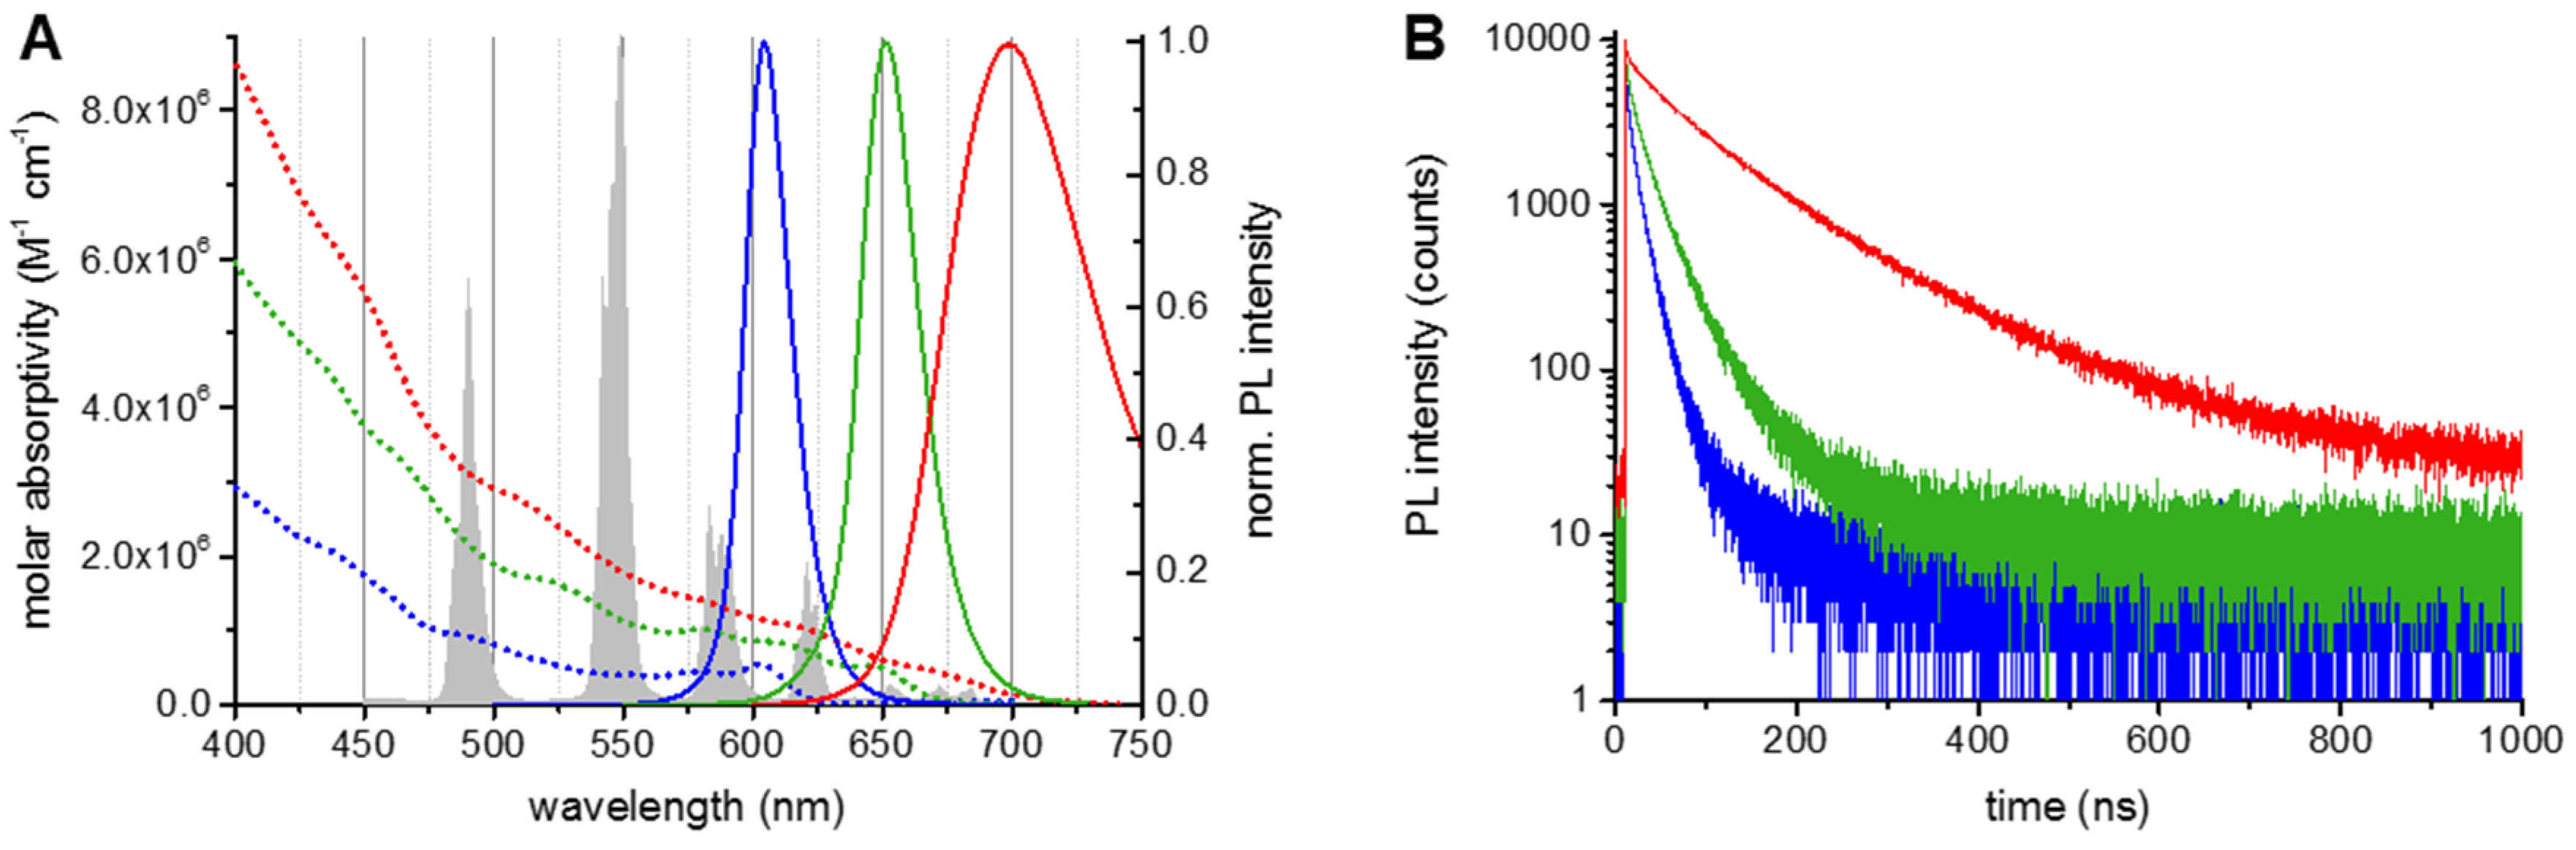
2.1.1. Quantum Dots
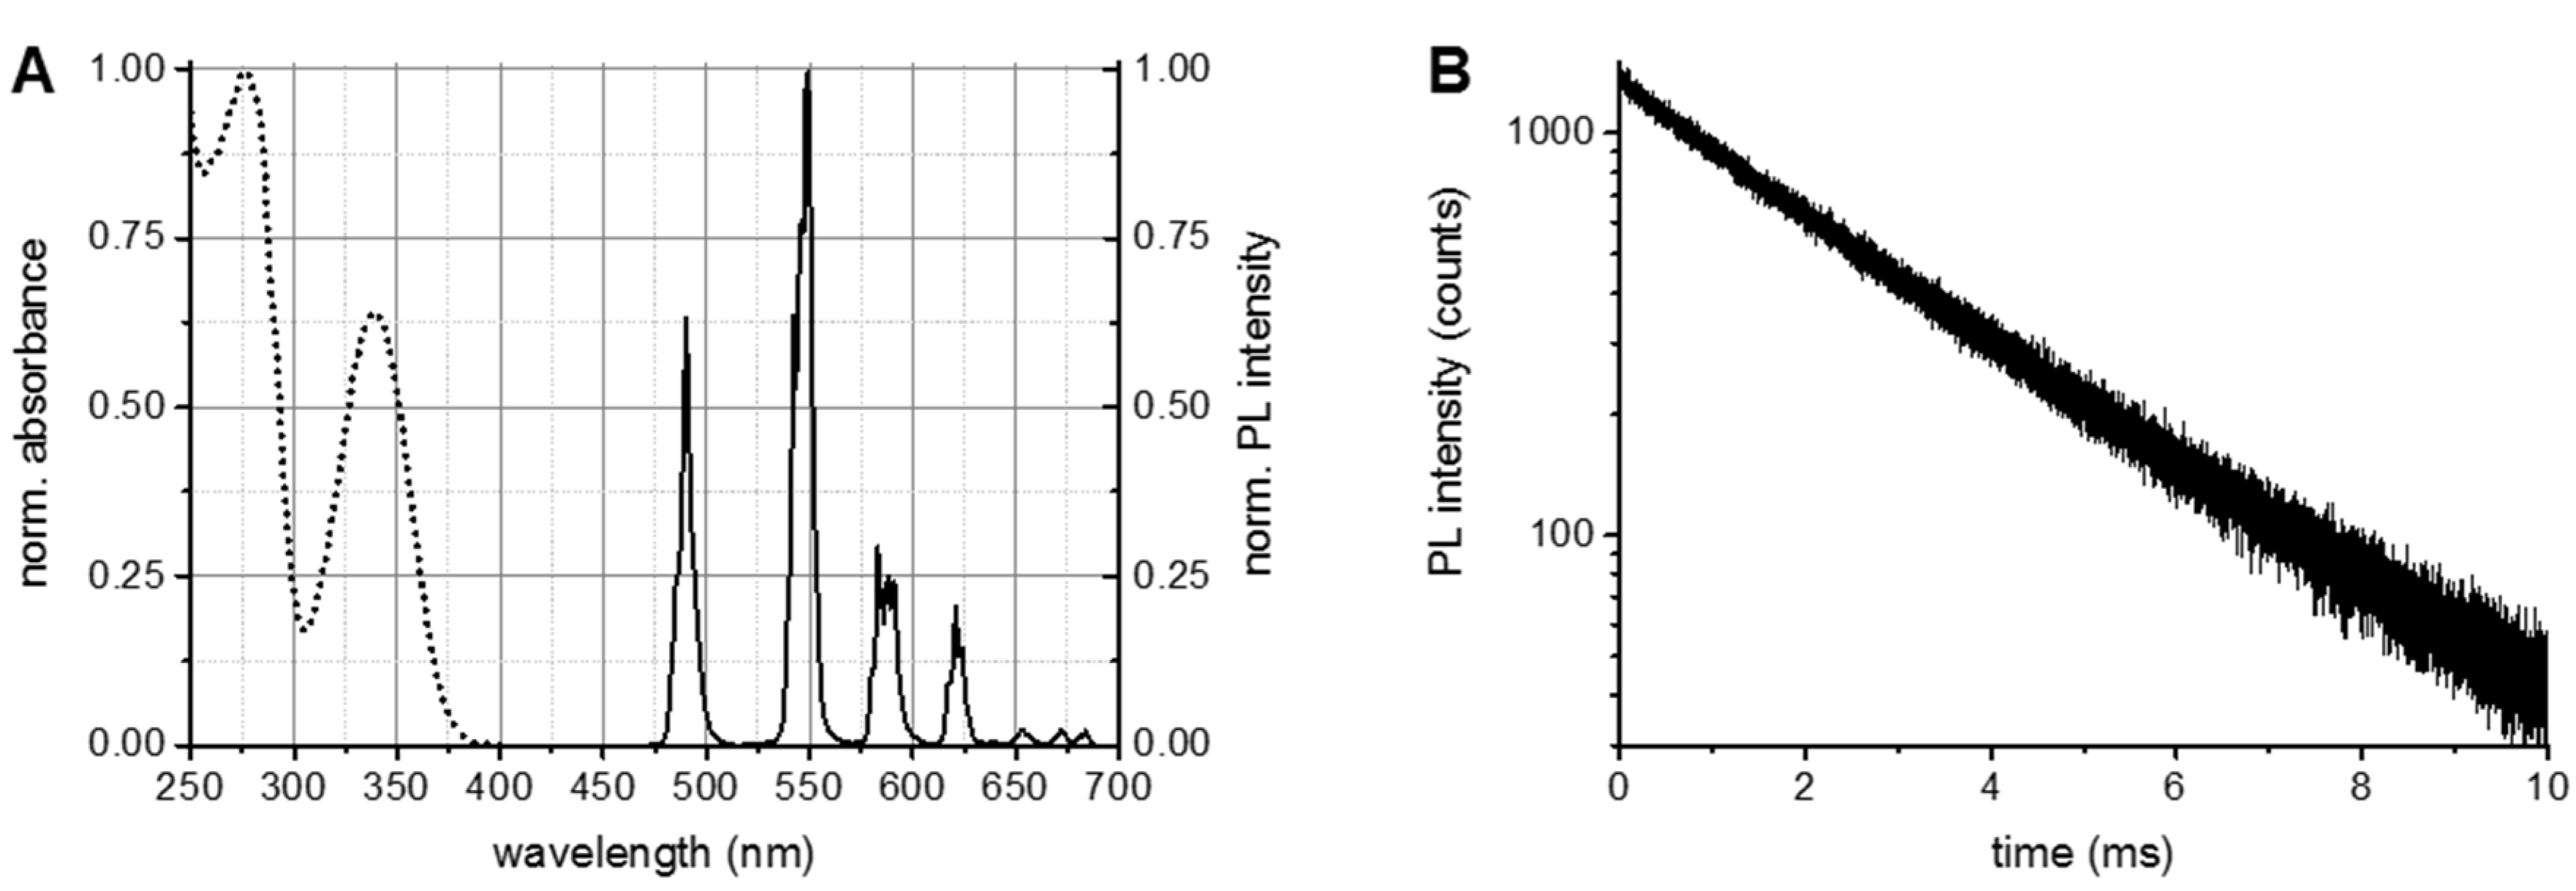
2.1.2. Tb Complex
2.1.3. Antigens and Antibodies
2.1.4. Chemicals and Biochemicals
2.2. Methods
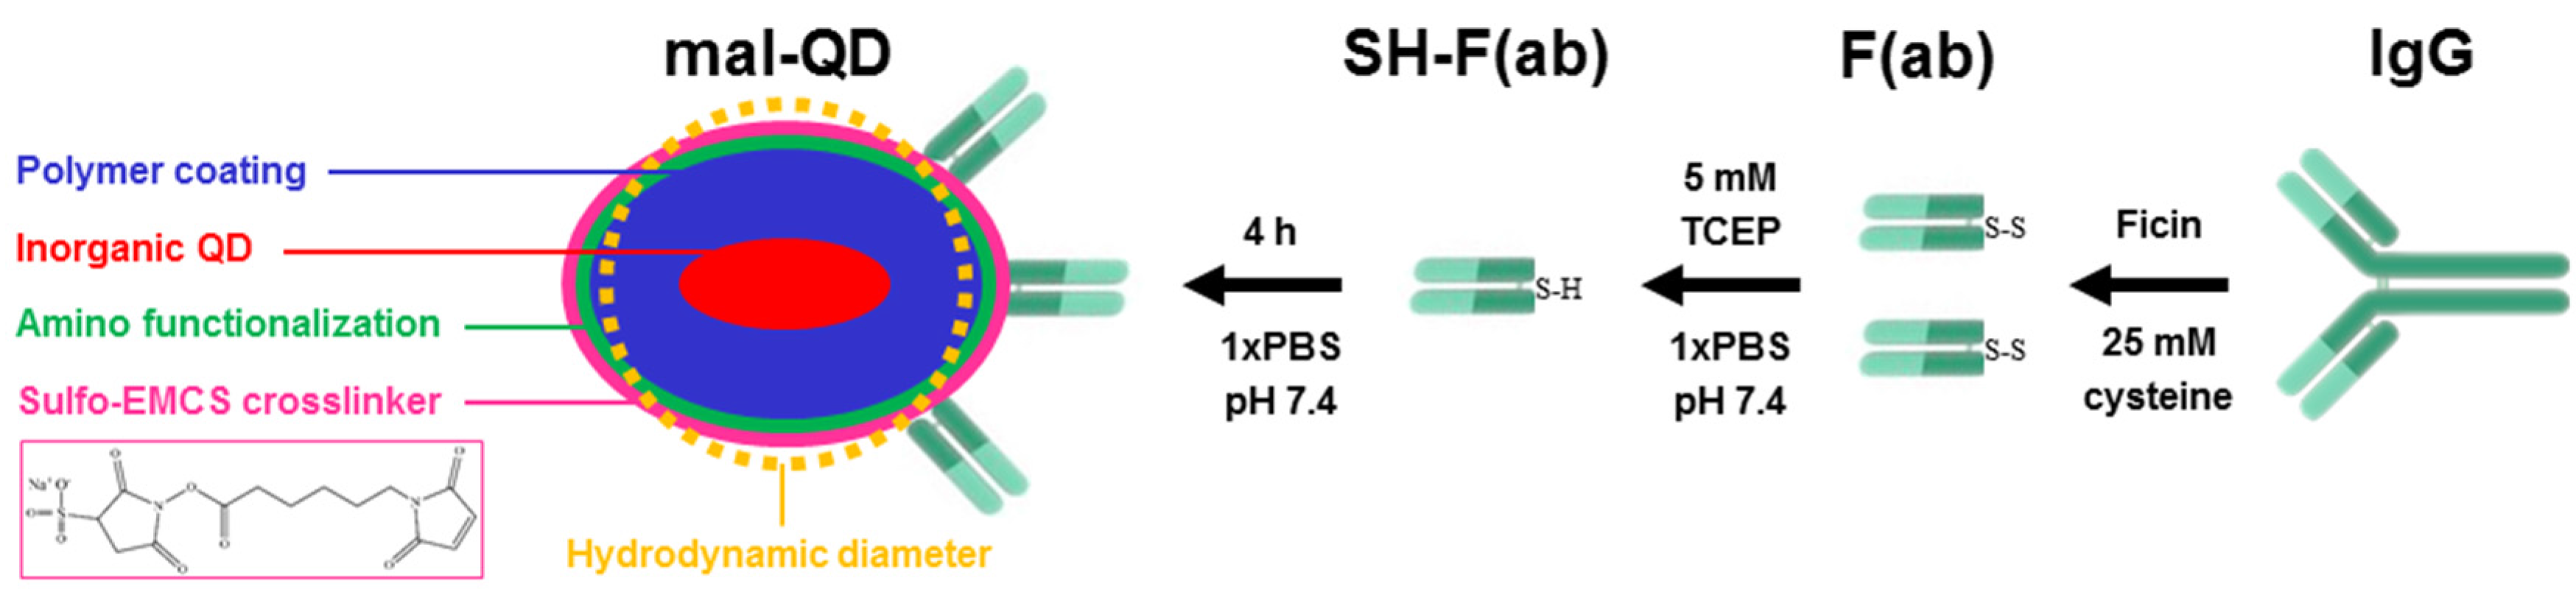
2.2.1. Tb-Antibody (Tb-AB) Conjugation
2.2.2. QD-Antibody (QD-AB) Conjugation

2.2.3. Photophysical Characterization
2.2.4. FRET Characterization
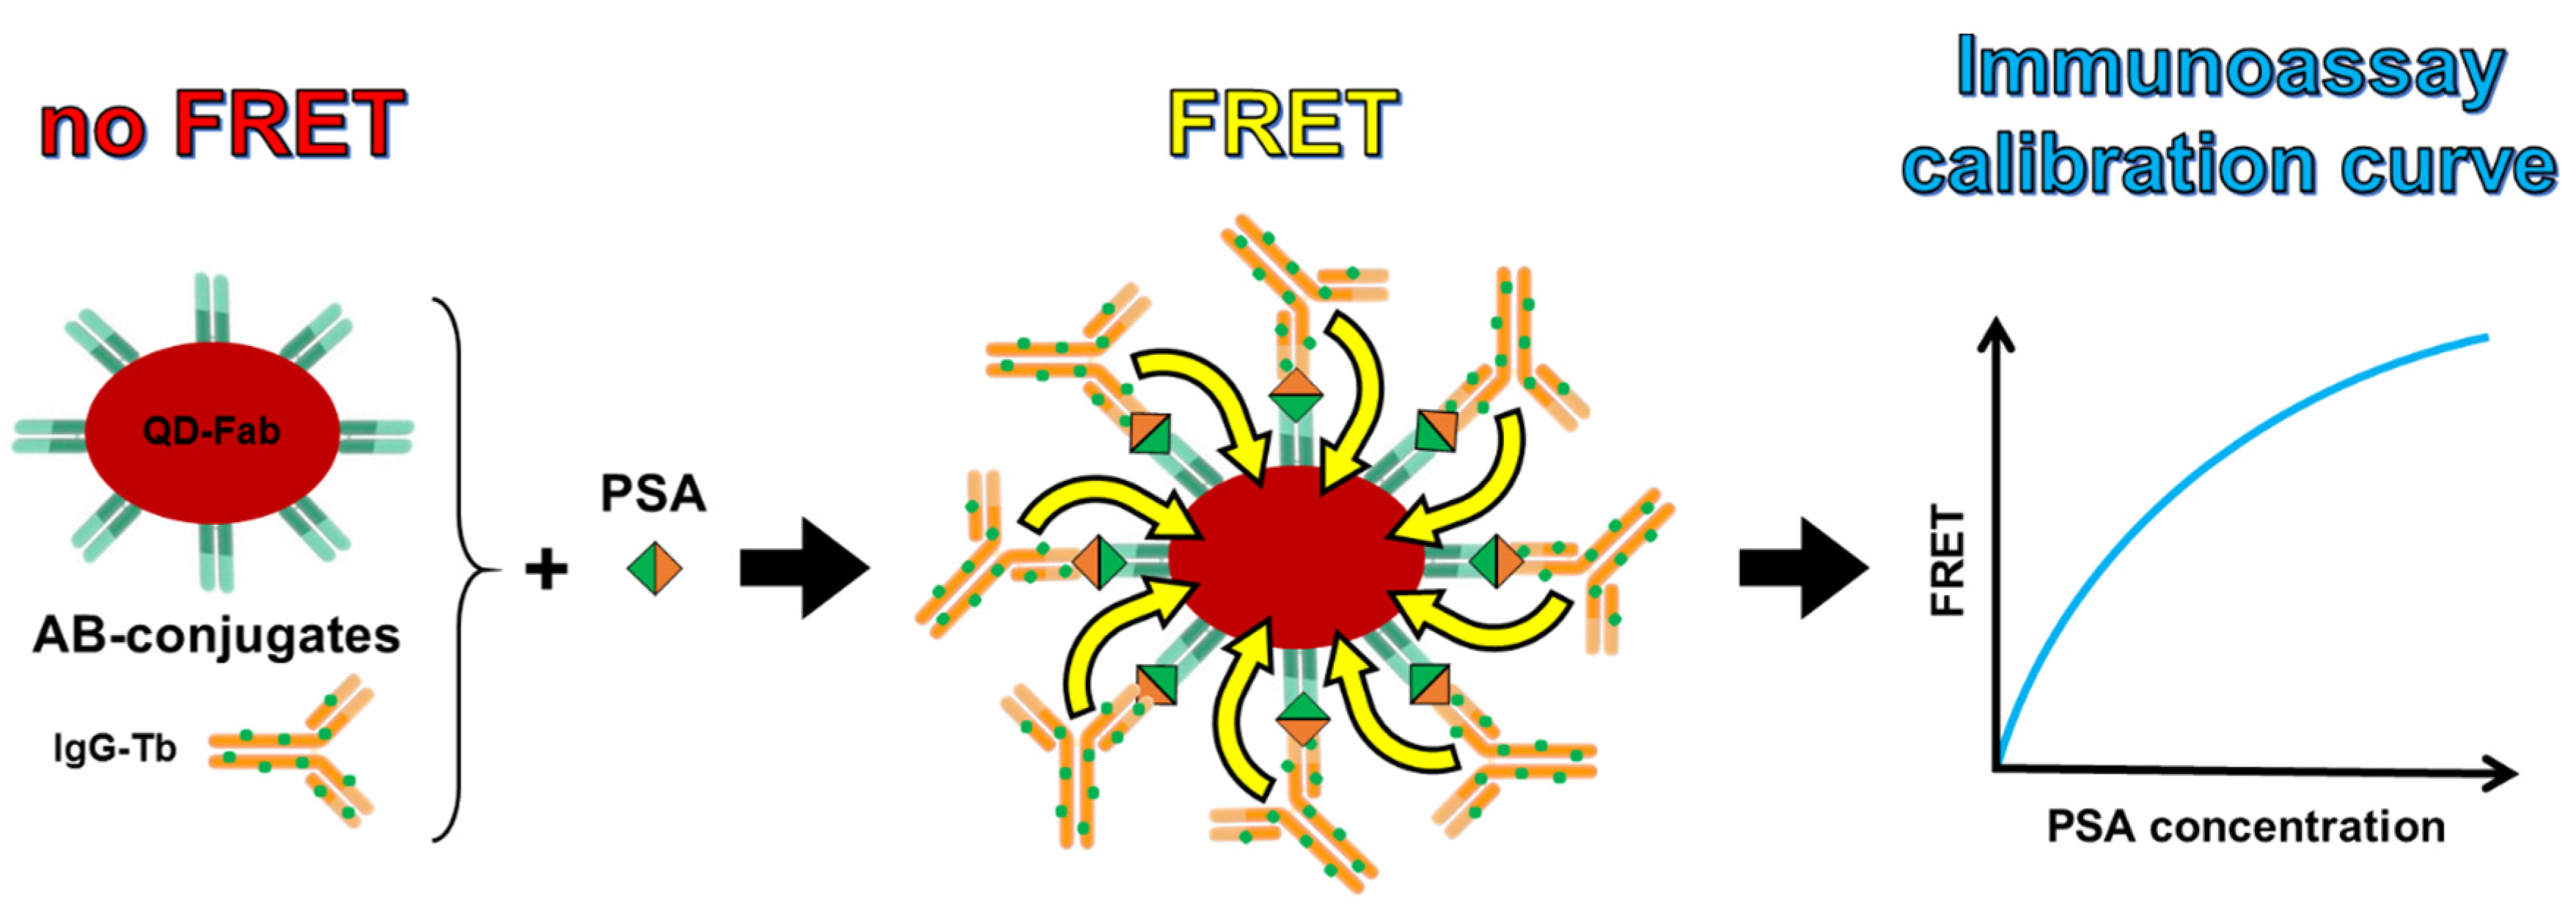
2.2.5. FRET Immunoassays

3. Results and Discussion
3.1. Tb and QD AB Conjugates and Tb-QD FRET-Pairs


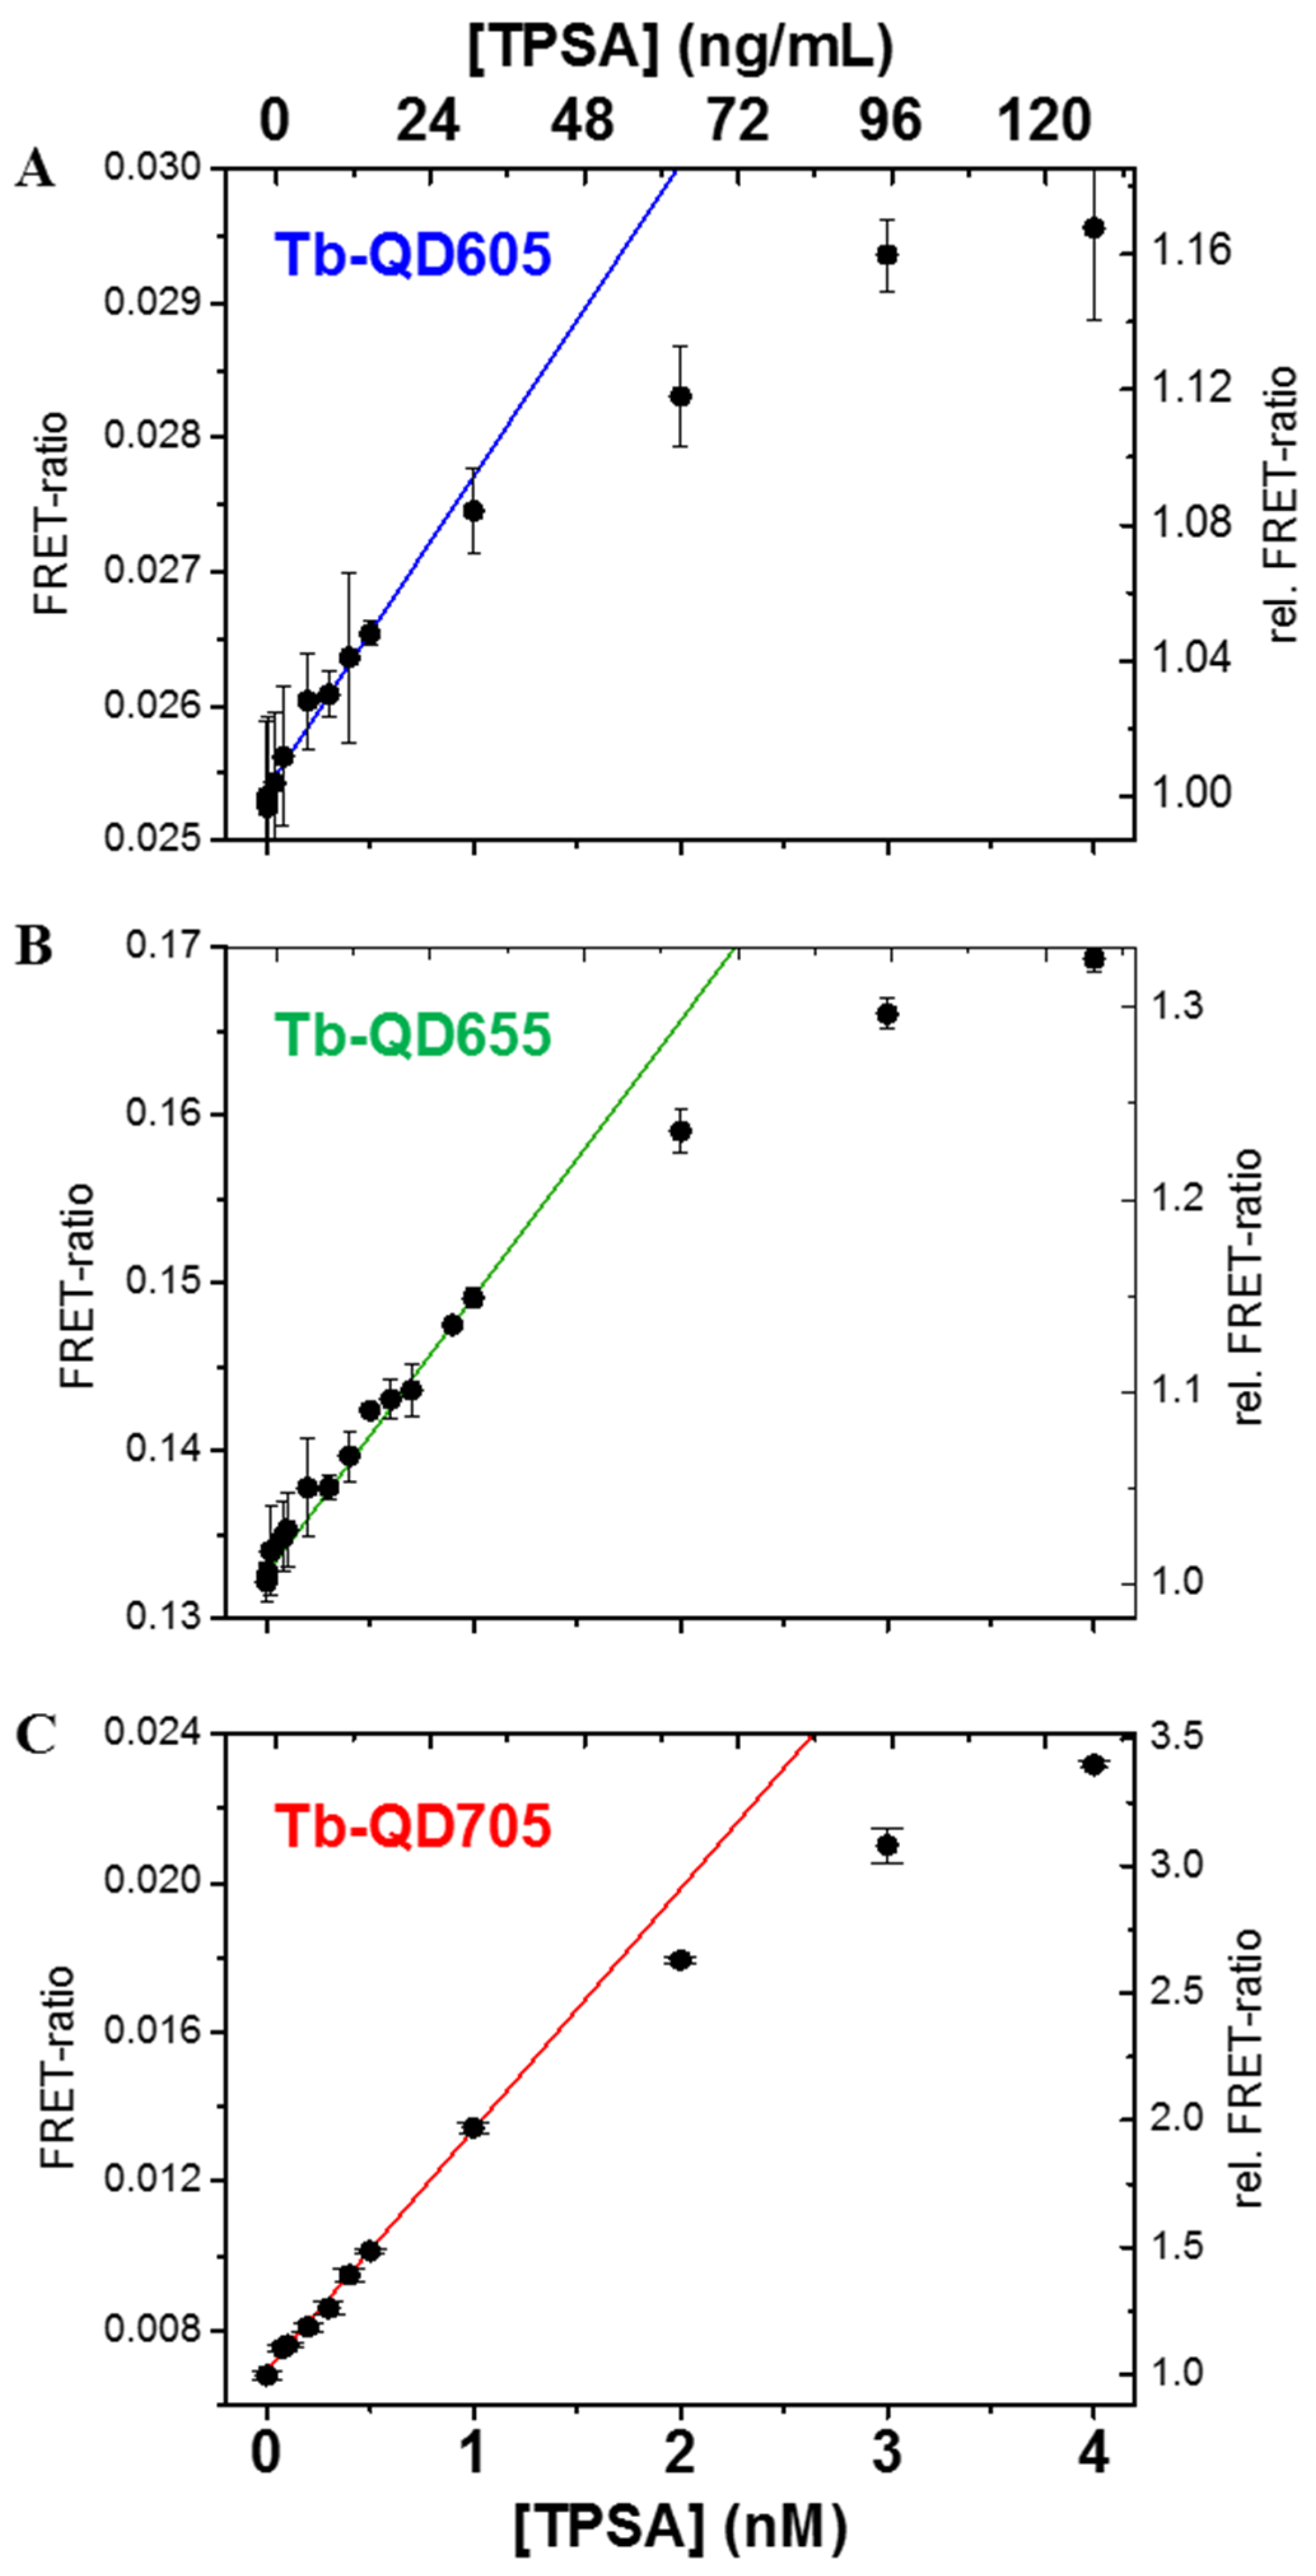
3.2. Homogeneous Time-Resolved FRET Immunoassay

| Donor-AB | Tb/AB | Acceptor-AB | AB/QD | R0 (nm) | LOD (nM) | LOD (ng/mL) |
|---|---|---|---|---|---|---|
| Tb-IgG | 6 ± 1 | QD605-F(ab) | 5 ± 2 | 8.8 ± 0.4 | 0.71 ± 0.07 | 23 ± 2 |
| QD655-F(ab) | 8 ± 3 | 10.5 ± 0.5 | 0.12 ± 0.01 | 3.7 ± 0.4 | ||
| QD705-F(ab) | 6 ± 2 | 11.2 ± 0.6 | 0.06 ± 0.01 | 2.0 ± 0.3 |

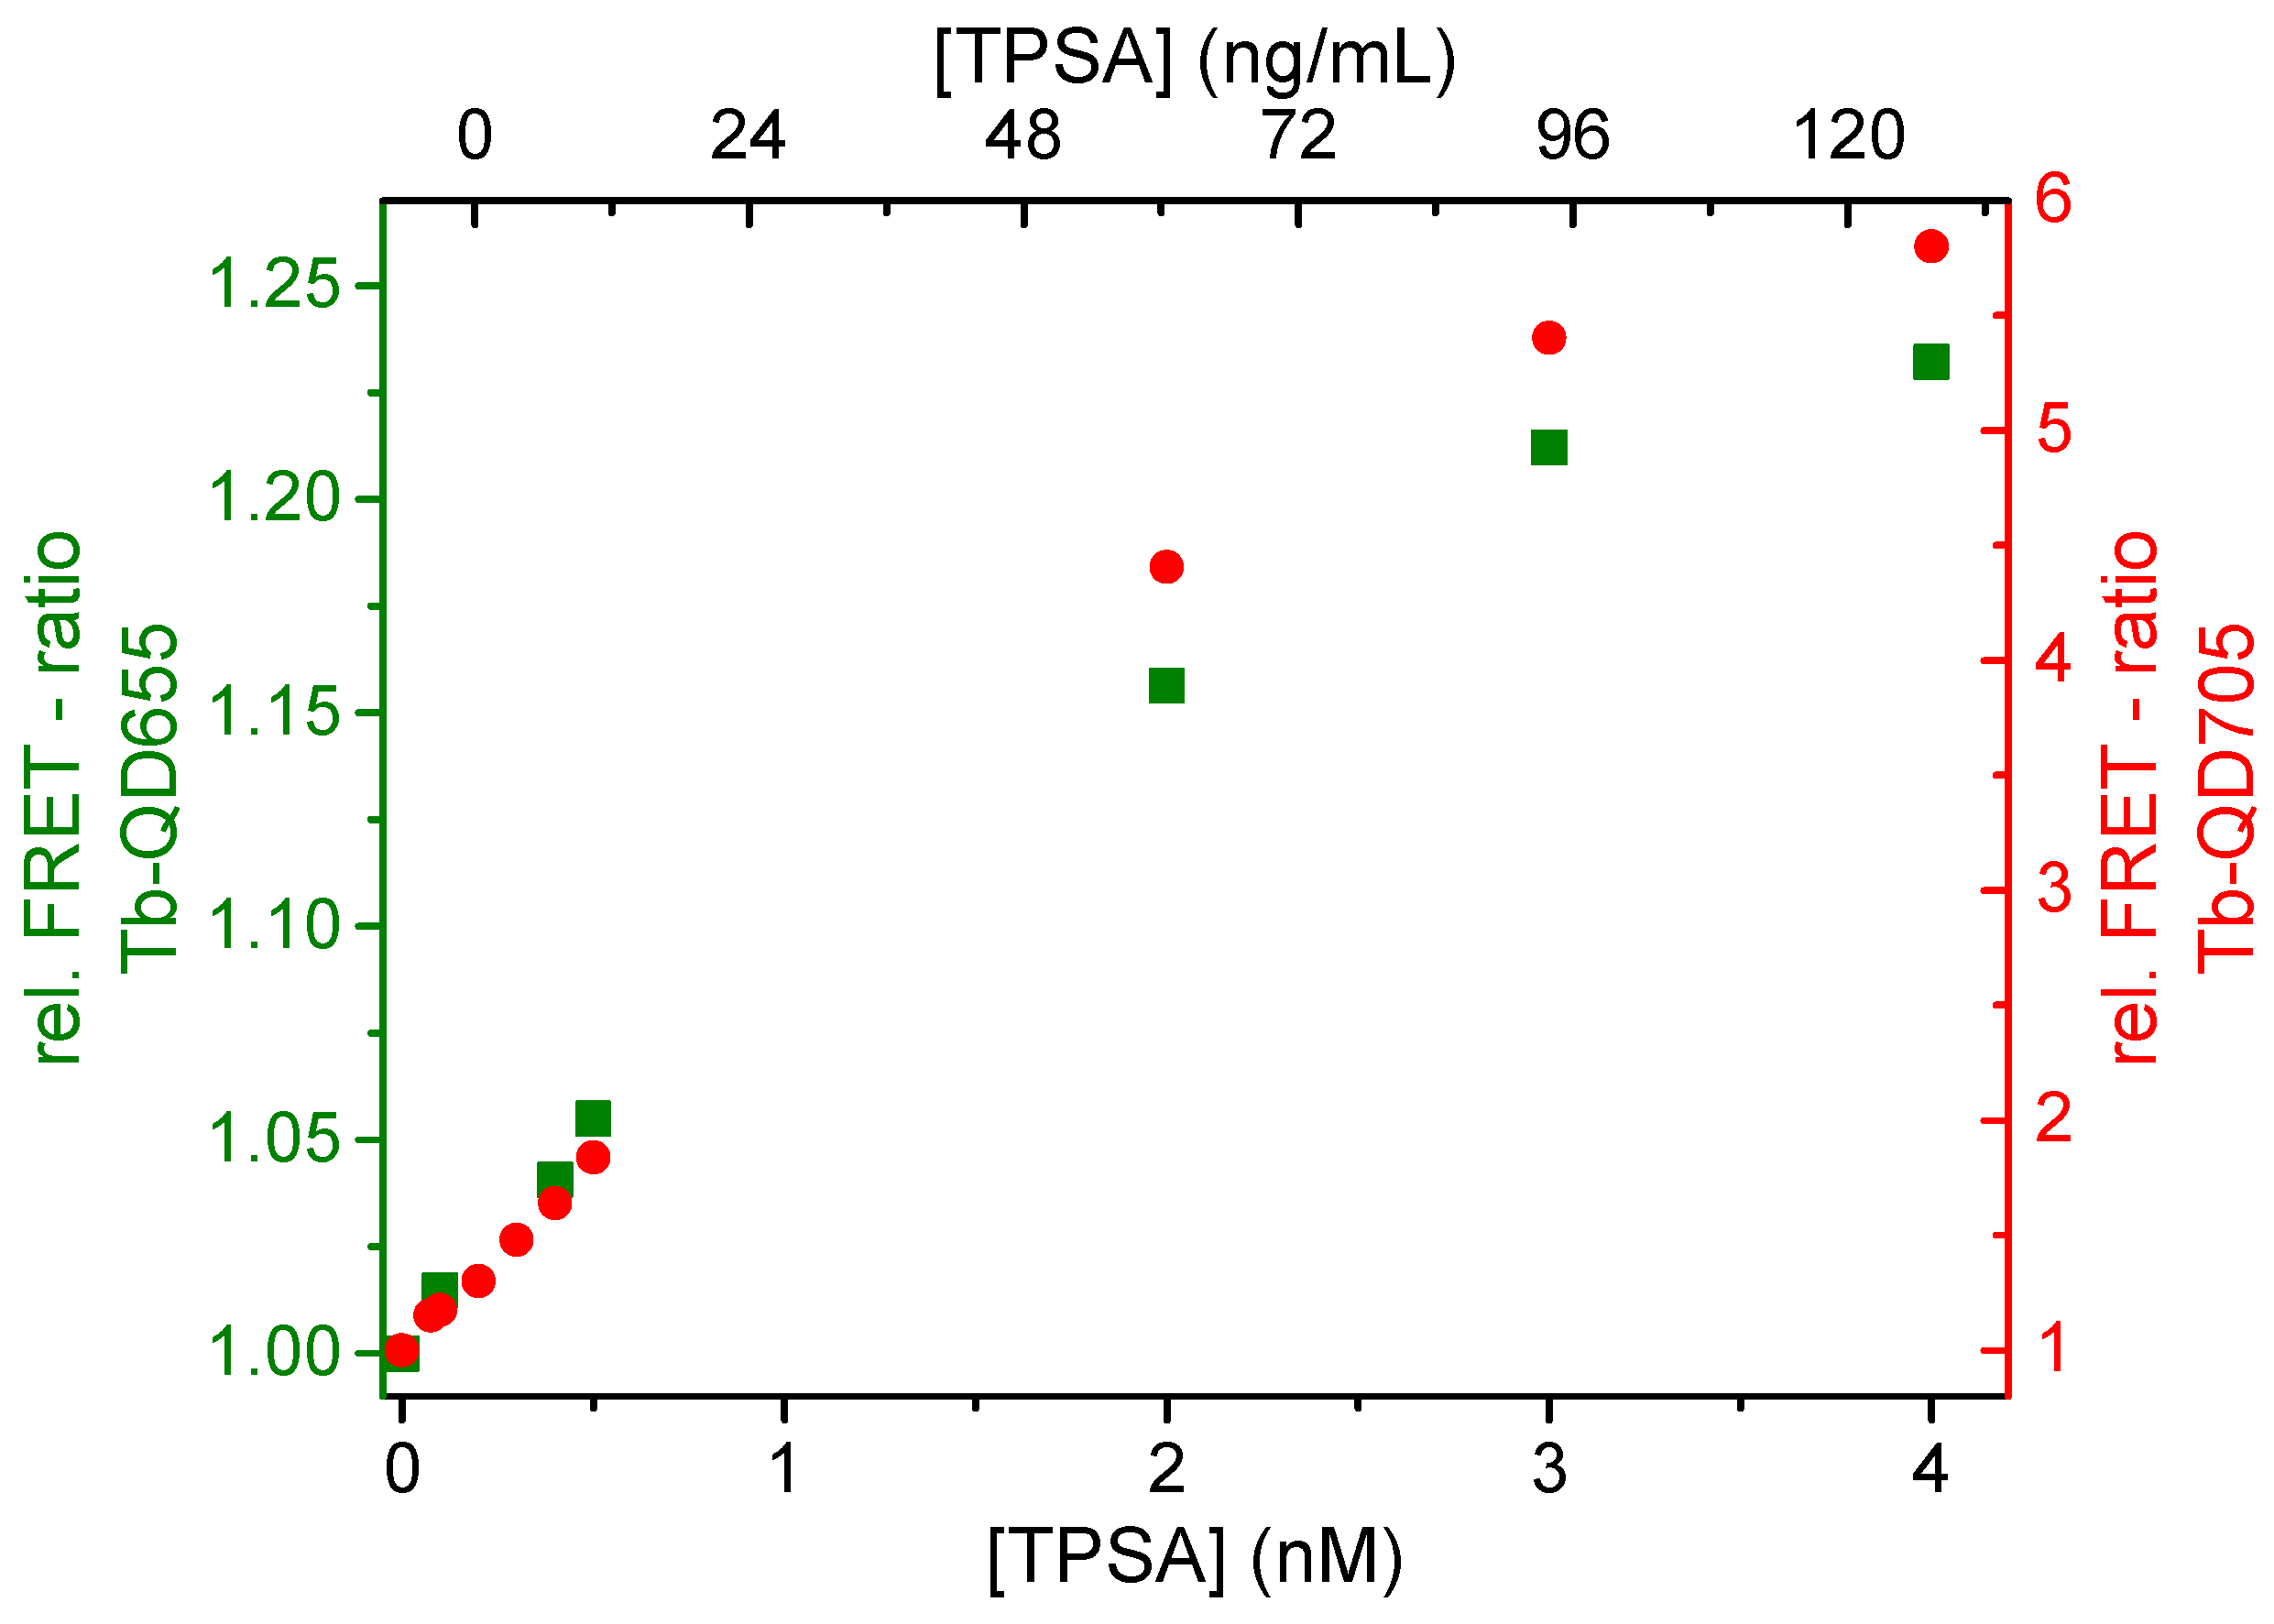
3.3. Duplexed Tb-to-QD FRET Immunoassay

4. Conclusions
Acknowledgments
Author Contributions
Conflicts of Interest
References
- Algar, W.R.; Kim, H.; Medintz, I.L.; Hildebrandt, N. Emerging non-traditional Förster resonance energy transfer configurations with semiconductor quantum dots: Investigations and applications. Coord. Chem. Rev. 2014, 263–264, 65–85. [Google Scholar] [CrossRef]
- Hildebrandt, N.; Wegner, K.D.; Algar, W.R. Luminescent terbium complexes: Superior Förster resonance energy transfer donors for flexible and sensitive multiplexed biosensing. Coord. Chem. Rev. 2014, 273–274, 125–138. [Google Scholar] [CrossRef]
- Biju, V.; Itoh, T.; Ishikawa, M. Delivering quantum dots to cells: Bioconjugated quantum dots for targeted and nonspecific extracellular and intracellular imaging. Chem. Soc. Rev. 2010, 39, 3031–3056. [Google Scholar] [CrossRef] [PubMed]
- Wegner, K.D.; Hildebrandt, N. Quantum dots: Bright and versatile in vitro and in vivo fluorescence imaging biosensors. Chem. Soc. Rev. 2015, 14, 4792–4834. [Google Scholar] [CrossRef] [PubMed]
- Medintz, I.L.; Hildebrandt, N. FRET–Förster Resonance Energy Transfer from Theory to Applications; Wiley-VCH Verlag GmbH: Weinheim, Germany, 2014. [Google Scholar]
- Algar, W.R.; Wegner, D.; Huston, A.L.; Blanco-Canosa, J.B.; Stewart, M.H.; Armstrong, A.; Dawson, P.E.; Hildebrandt, N.; Medintz, I.L. Quantum Dots as Simultaneous Acceptors and Donors in Time-Gated Förster Resonance Energy Transfer Relays: Characterization and Biosensing. J. Am. Chem. Soc. 2012, 134, 1876–1891. [Google Scholar] [CrossRef] [PubMed]
- Morgner, F.; Stufler, S.; Geißler, D.; Medintz, I.L.; Algar, W.R.; Susumu, K.; Stewart, M.H.; Blanco-Canosa, J.B.; Dawson, P.E.; Hildebrandt, N. Terbium to Quantum Dot FRET Bioconjugates for Clinical Diagnostics: Influence of Human Plasma on Optical and Assembly Properties. Sensors 2011, 11, 9667–9684. [Google Scholar] [CrossRef] [PubMed]
- Wild, D. The Immunoassay Handbook: Theory and Applications of Ligand Binding, ELISA, and Related Techniques, 4th ed.; Elsevier: Oxford, UK, 2013. [Google Scholar]
- Charbonnière, L.J.; Hildebrandt, N. Lanthanide Complexes and Quantum Dots: A Bright Wedding for Resonance Energy Transfer. Eur. J. Inorg. Chem. 2008, 2008, 3231–3231. [Google Scholar] [CrossRef]
- Geißler, D.; Linden, S.; Liermann, K.; Wegner, K.D.; Charbonnière, L.J.; Hildebrandt, N. Lanthanides and Quantum Dots as Förster Resonance Energy Transfer Agents for Diagnostics and Cellular Imaging. Inorg. Chem. 2014, 53, 1824–1838. [Google Scholar] [CrossRef] [PubMed]
- Hildebrandt, N.; Löhmannsröben, H.-G. Quantum Dot Nanocrystals and Supramolecular Lanthanide Complexes -Energy Transfer Systems for Sensitive in Vitro Diagnostics and High Throughput Screening in Chemical Biology. Curr. Chem. Biol. 2007, 1, 167–186. [Google Scholar] [CrossRef]
- Charbonnière, L.J.; Hildebrandt, N.; Ziessel, R.F.; Löhmannsröben, H.-G. Lanthanides to Quantum Dots Resonance Energy Transfer in Time-Resolved Fluoro-Immunoassays and Luminescence Microscopy. J. Am. Chem. Soc. 2006, 128, 12800–12809. [Google Scholar] [CrossRef] [PubMed]
- Hildebrandt, N.; Charbonnière, L.J.; Beck, M.; Ziessel, R.F.; Löhmannsröben, H.-G. Quantum Dots as Efficient Energy Acceptors in a Time-Resolved Fluoroimmunoassay. Angew. Chem. Int. Ed. 2005, 44, 7612–7615. [Google Scholar] [CrossRef] [PubMed]
- Jin, Z.; Geißler, D.; Qiu, X.; Wegner, K.D.; Hildebrandt, N. A Rapid, Amplification-Free, and Sensitive Diagnostic Assay for Single-Step Multiplexed Fluorescence Detection of MicroRNA. Angew. Chem. Int. Ed. 2015, 54, 10024–10029. [Google Scholar] [CrossRef] [PubMed]
- Qiu, X.; Hildebrandt, N. Rapid and Multiplexed MicroRNA Diagnostic Assay Using Quantum Dot-Based Förster Resonance Energy Transfer. ACS Nano 2015, 9, 8449–8457. [Google Scholar] [CrossRef] [PubMed]
- Geißler, D.; Stufler, S.; Löhmannsröben, H.-G.; Hildebrandt, N. Six-Color Time-Resolved Förster Resonance Energy Transfer for Ultrasensitive Multiplexed Biosensing. J. Am. Chem. Soc. 2013, 135, 1102–1109. [Google Scholar] [CrossRef] [PubMed]
- Chen, M.-J.; Wu, Y.-S.; Lin, G.-F.; Hou, J.-Y.; Li, M.; Liu, T.-C. Quantum-dot-based homogeneous time-resolved fluoroimmunoassay of alpha-fetoprotein. Anal. Chim. Acta 2012, 741, 100–105. [Google Scholar] [CrossRef] [PubMed]
- Chen, Z.-H.; Wu, Y.-S.; Chen, M.-J.; Hou, J.-Y.; Ren, Z.-Q.; Sun, D.; Liu, T.C. A Novel Homogeneous Time-Resolved Fluoroimmunoassay for Carcinoembryonic Antigen Based on Water-Soluble Quantum Dots. J. Fluoresc. 2013, 23, 649–657. [Google Scholar] [CrossRef] [PubMed]
- Wegner, K.D.; Jin, Z.; Lindén, S.; Jennings, T.L.; Hildebrandt, N. Quantum-Dot-Based Förster Resonance Energy Transfer Immunoassay for Sensitive Clinical Diagnostics of Low-Volume Serum Samples. ACS Nano 2013, 7, 7411–7419. [Google Scholar] [CrossRef] [PubMed]
- Wegner, K.D.; Lindén, S.; Jin, Z.; Jennings., T.L.; el Khoulati, R.; van Bergen en Henegouwen, P.M.; Hidebrandt, N. Nanobodies and Nanocrystals: Highly Sensitive Quantum Dot-Based Homogeneous FRET Immunoassay for Serum-Based EGFR Detection. Small 2014, 10, 734–740. [Google Scholar] [CrossRef] [PubMed]
- Adhyam, M.; Gupta, A.K. A Review on the Clinical Utility of PSA in Cancer Prostate. Indian J. Surg. Oncol. 2012, 3, 120–129. [Google Scholar] [CrossRef] [PubMed]
© 2016 by the authors; licensee MDPI, Basel, Switzerland. This article is an open access article distributed under the terms and conditions of the Creative Commons by Attribution (CC-BY) license (http://creativecommons.org/licenses/by/4.0/).
Share and Cite
Bhuckory, S.; Lefebvre, O.; Qiu, X.; Wegner, K.D.; Hildebrandt, N. Evaluating Quantum Dot Performance in Homogeneous FRET Immunoassays for Prostate Specific Antigen. Sensors 2016, 16, 197. https://doi.org/10.3390/s16020197
Bhuckory S, Lefebvre O, Qiu X, Wegner KD, Hildebrandt N. Evaluating Quantum Dot Performance in Homogeneous FRET Immunoassays for Prostate Specific Antigen. Sensors. 2016; 16(2):197. https://doi.org/10.3390/s16020197
Chicago/Turabian StyleBhuckory, Shashi, Olivier Lefebvre, Xue Qiu, Karl David Wegner, and Niko Hildebrandt. 2016. "Evaluating Quantum Dot Performance in Homogeneous FRET Immunoassays for Prostate Specific Antigen" Sensors 16, no. 2: 197. https://doi.org/10.3390/s16020197