
Experimental Identification of Smartphones Using Fingerprints of Built-In Micro-Electro Mechanical Systems (MEMS)


Abstract
:
1. Introduction
2. Related Work
2.1. Motion Sensor Fingerprinting
2.2. Counterfeit Smartphone Detection
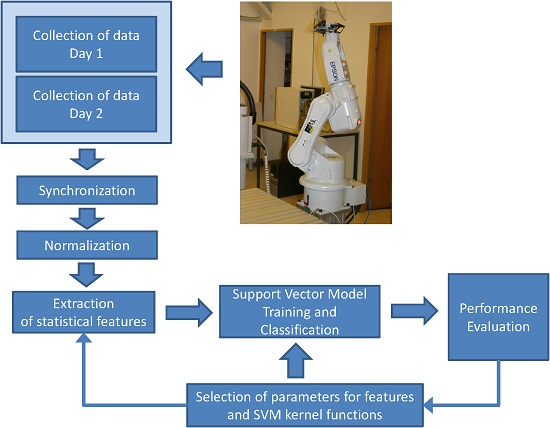
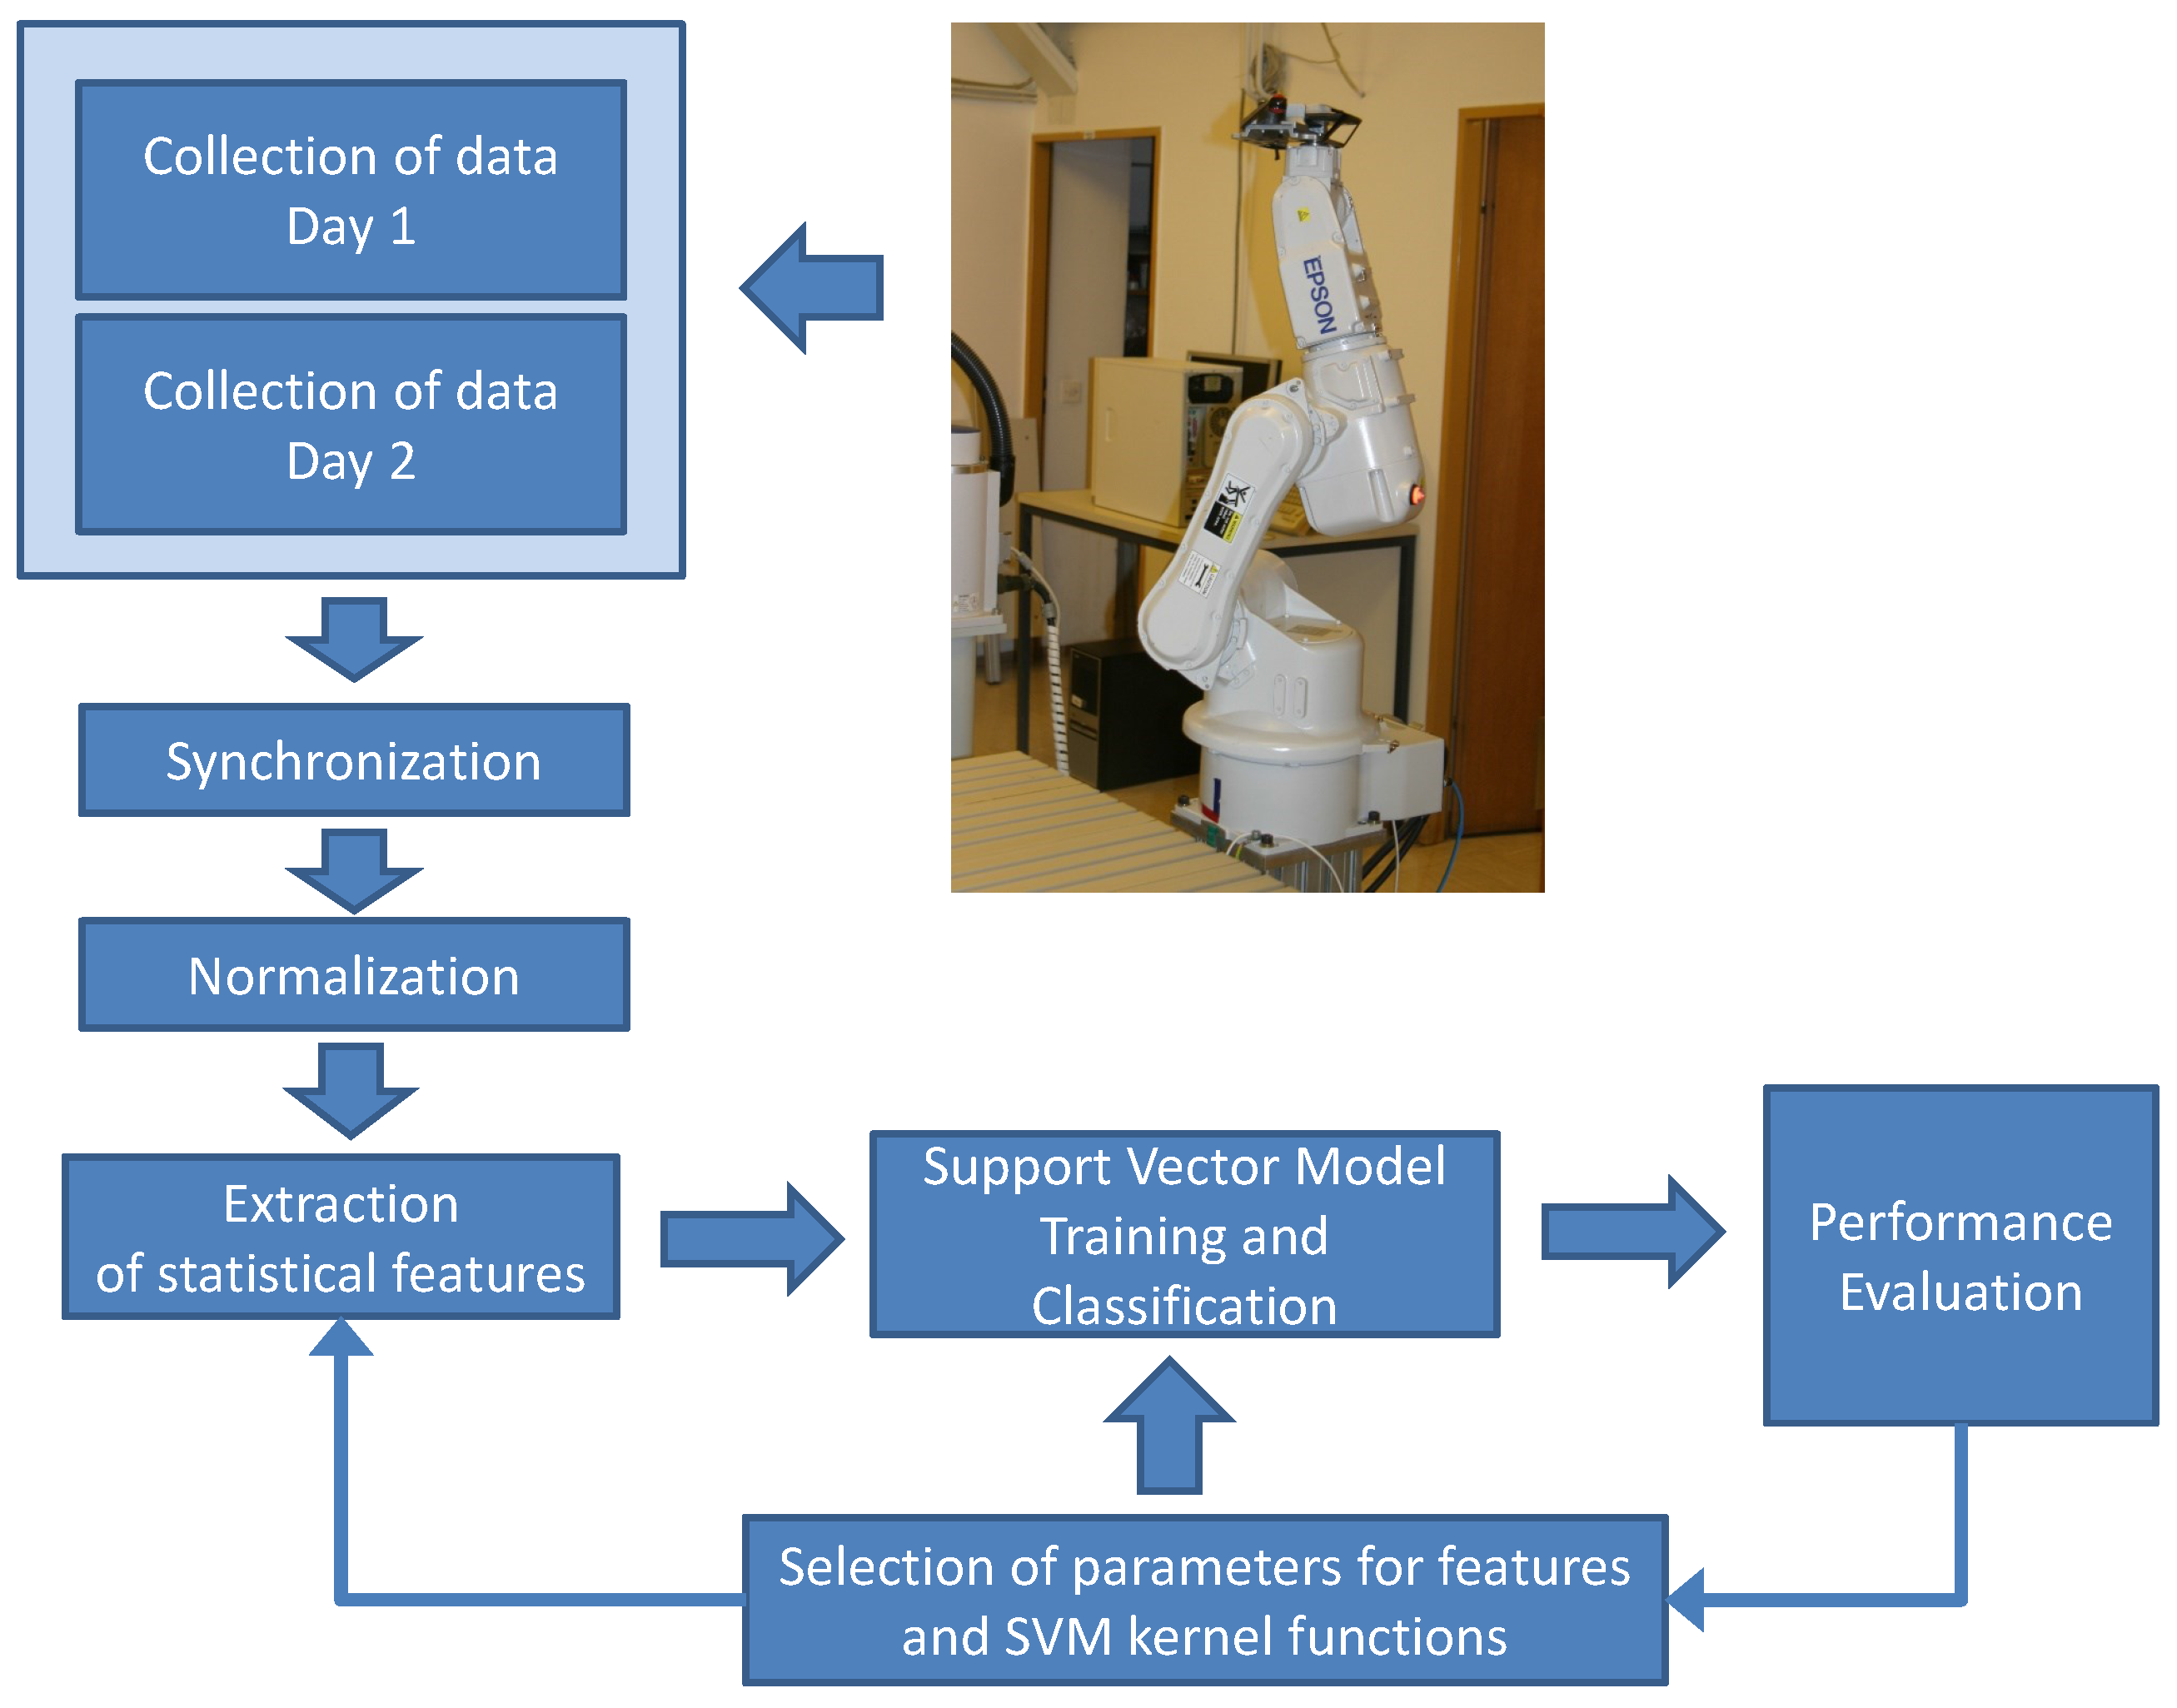
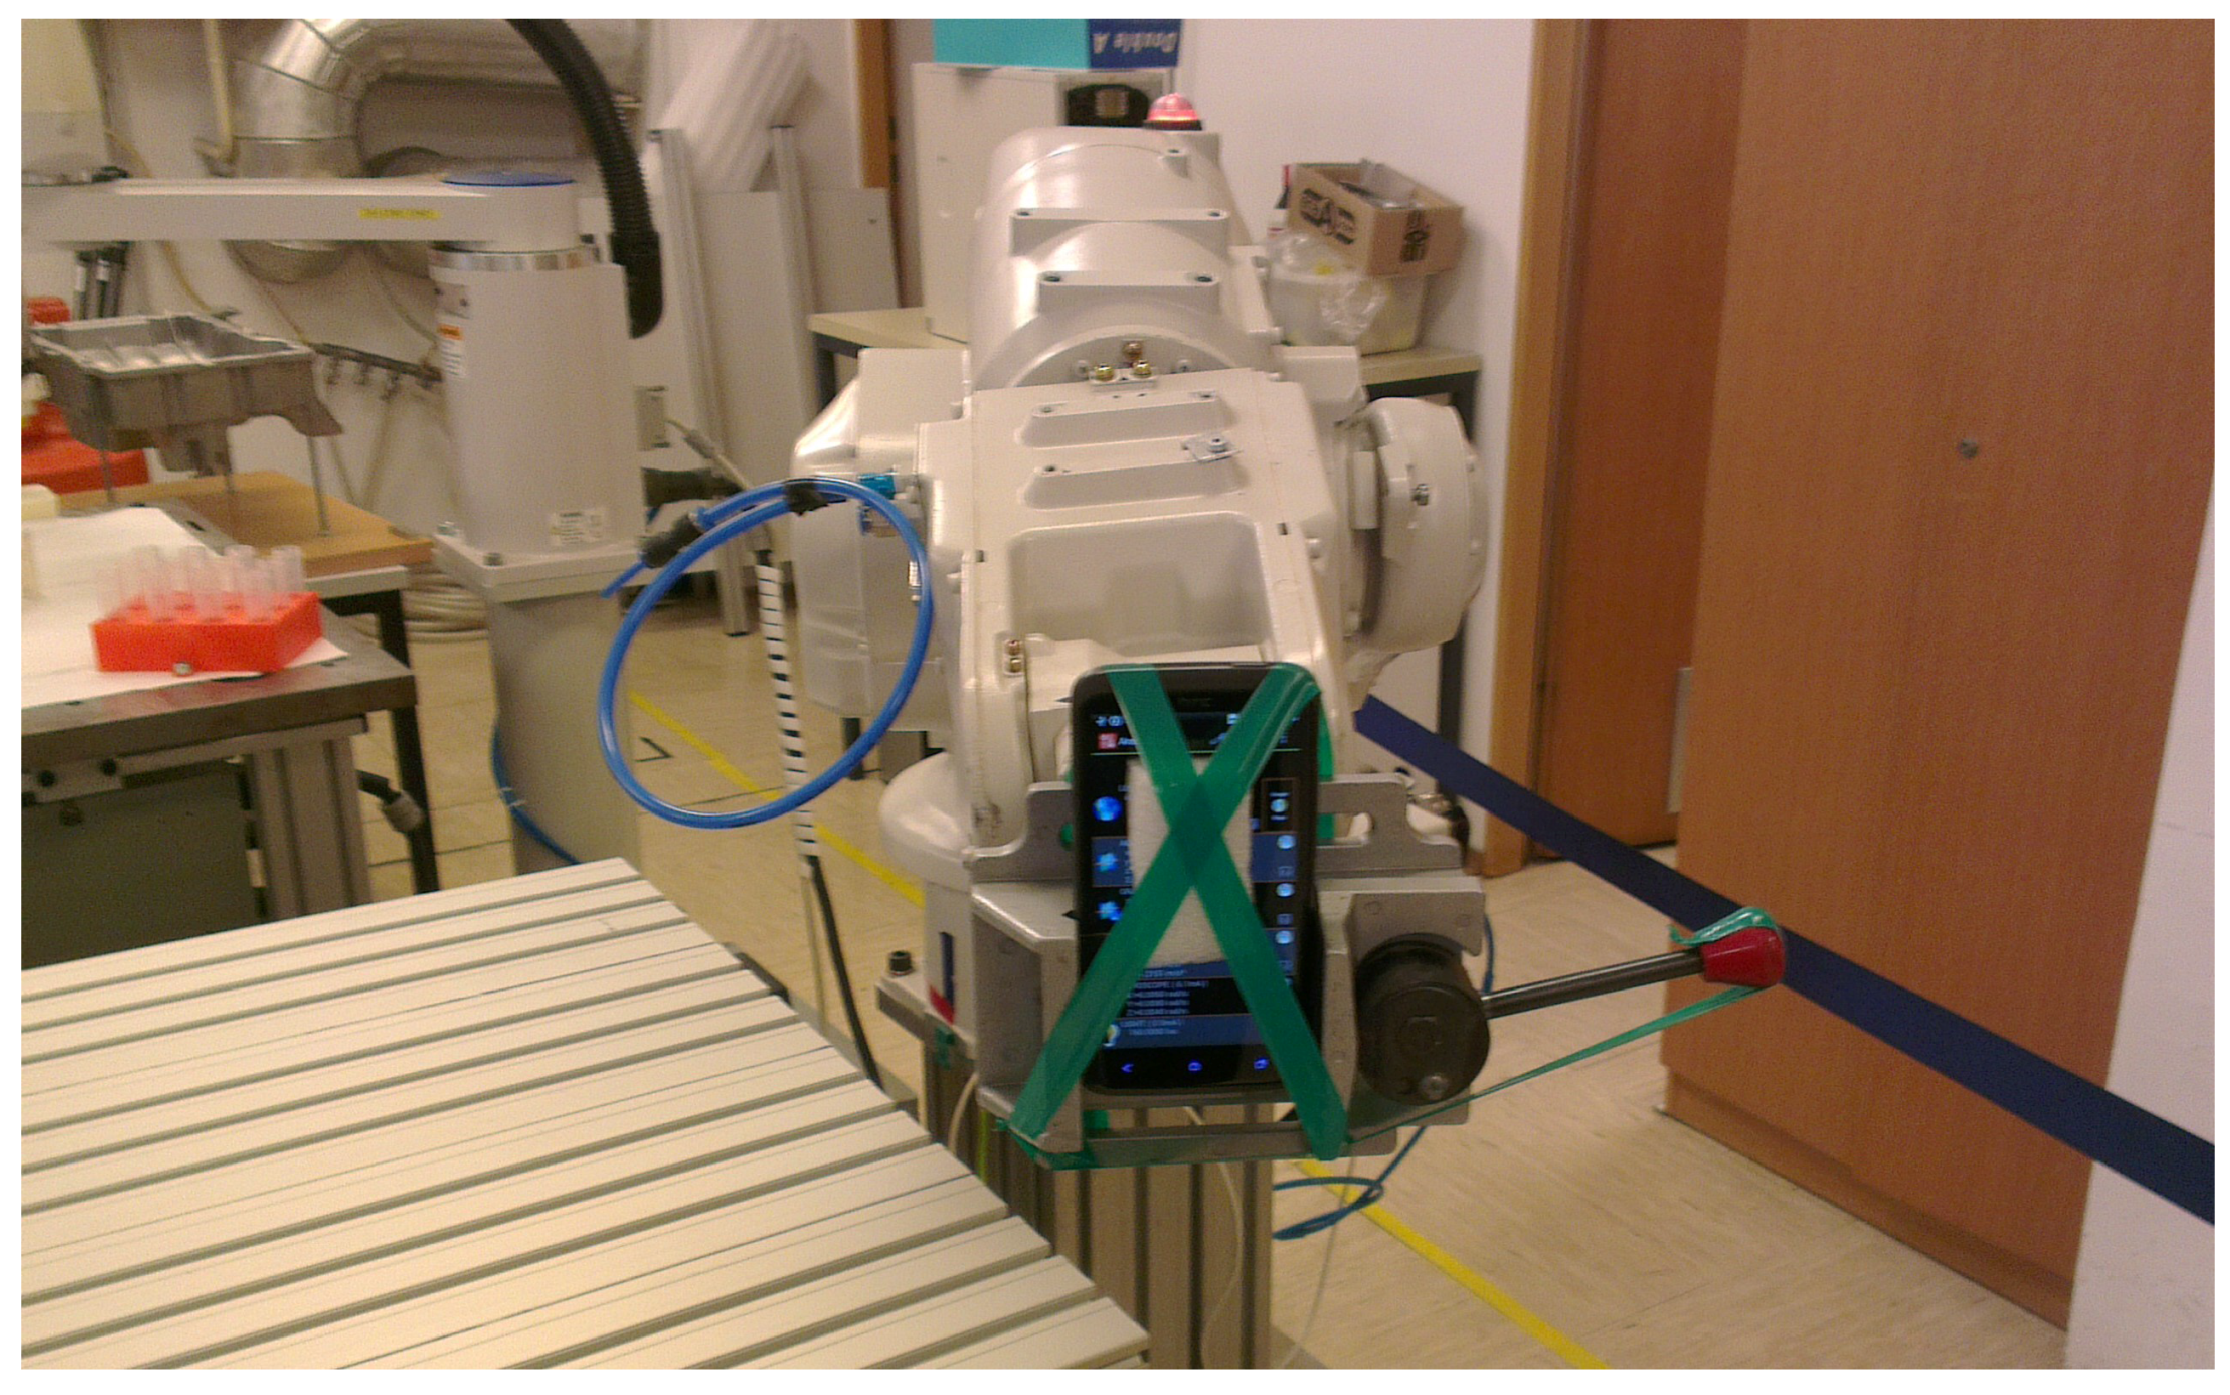
3. Methodology for Data Acquisition and Processing
- Gaussian Radial Basis Function (RBF) kernel with different values of the scaling factor σ.
- Multilayer Perceptron (MLP) kernel, which is a feed-forward artificial neural network model that maps sets of input data onto a set of appropriate outputs. We used a scale which goes from −1 to 1.
- A linear kernel.
- Quadratic kernel.
- Polynomial kernel (with different orders).
4. Experimental Results
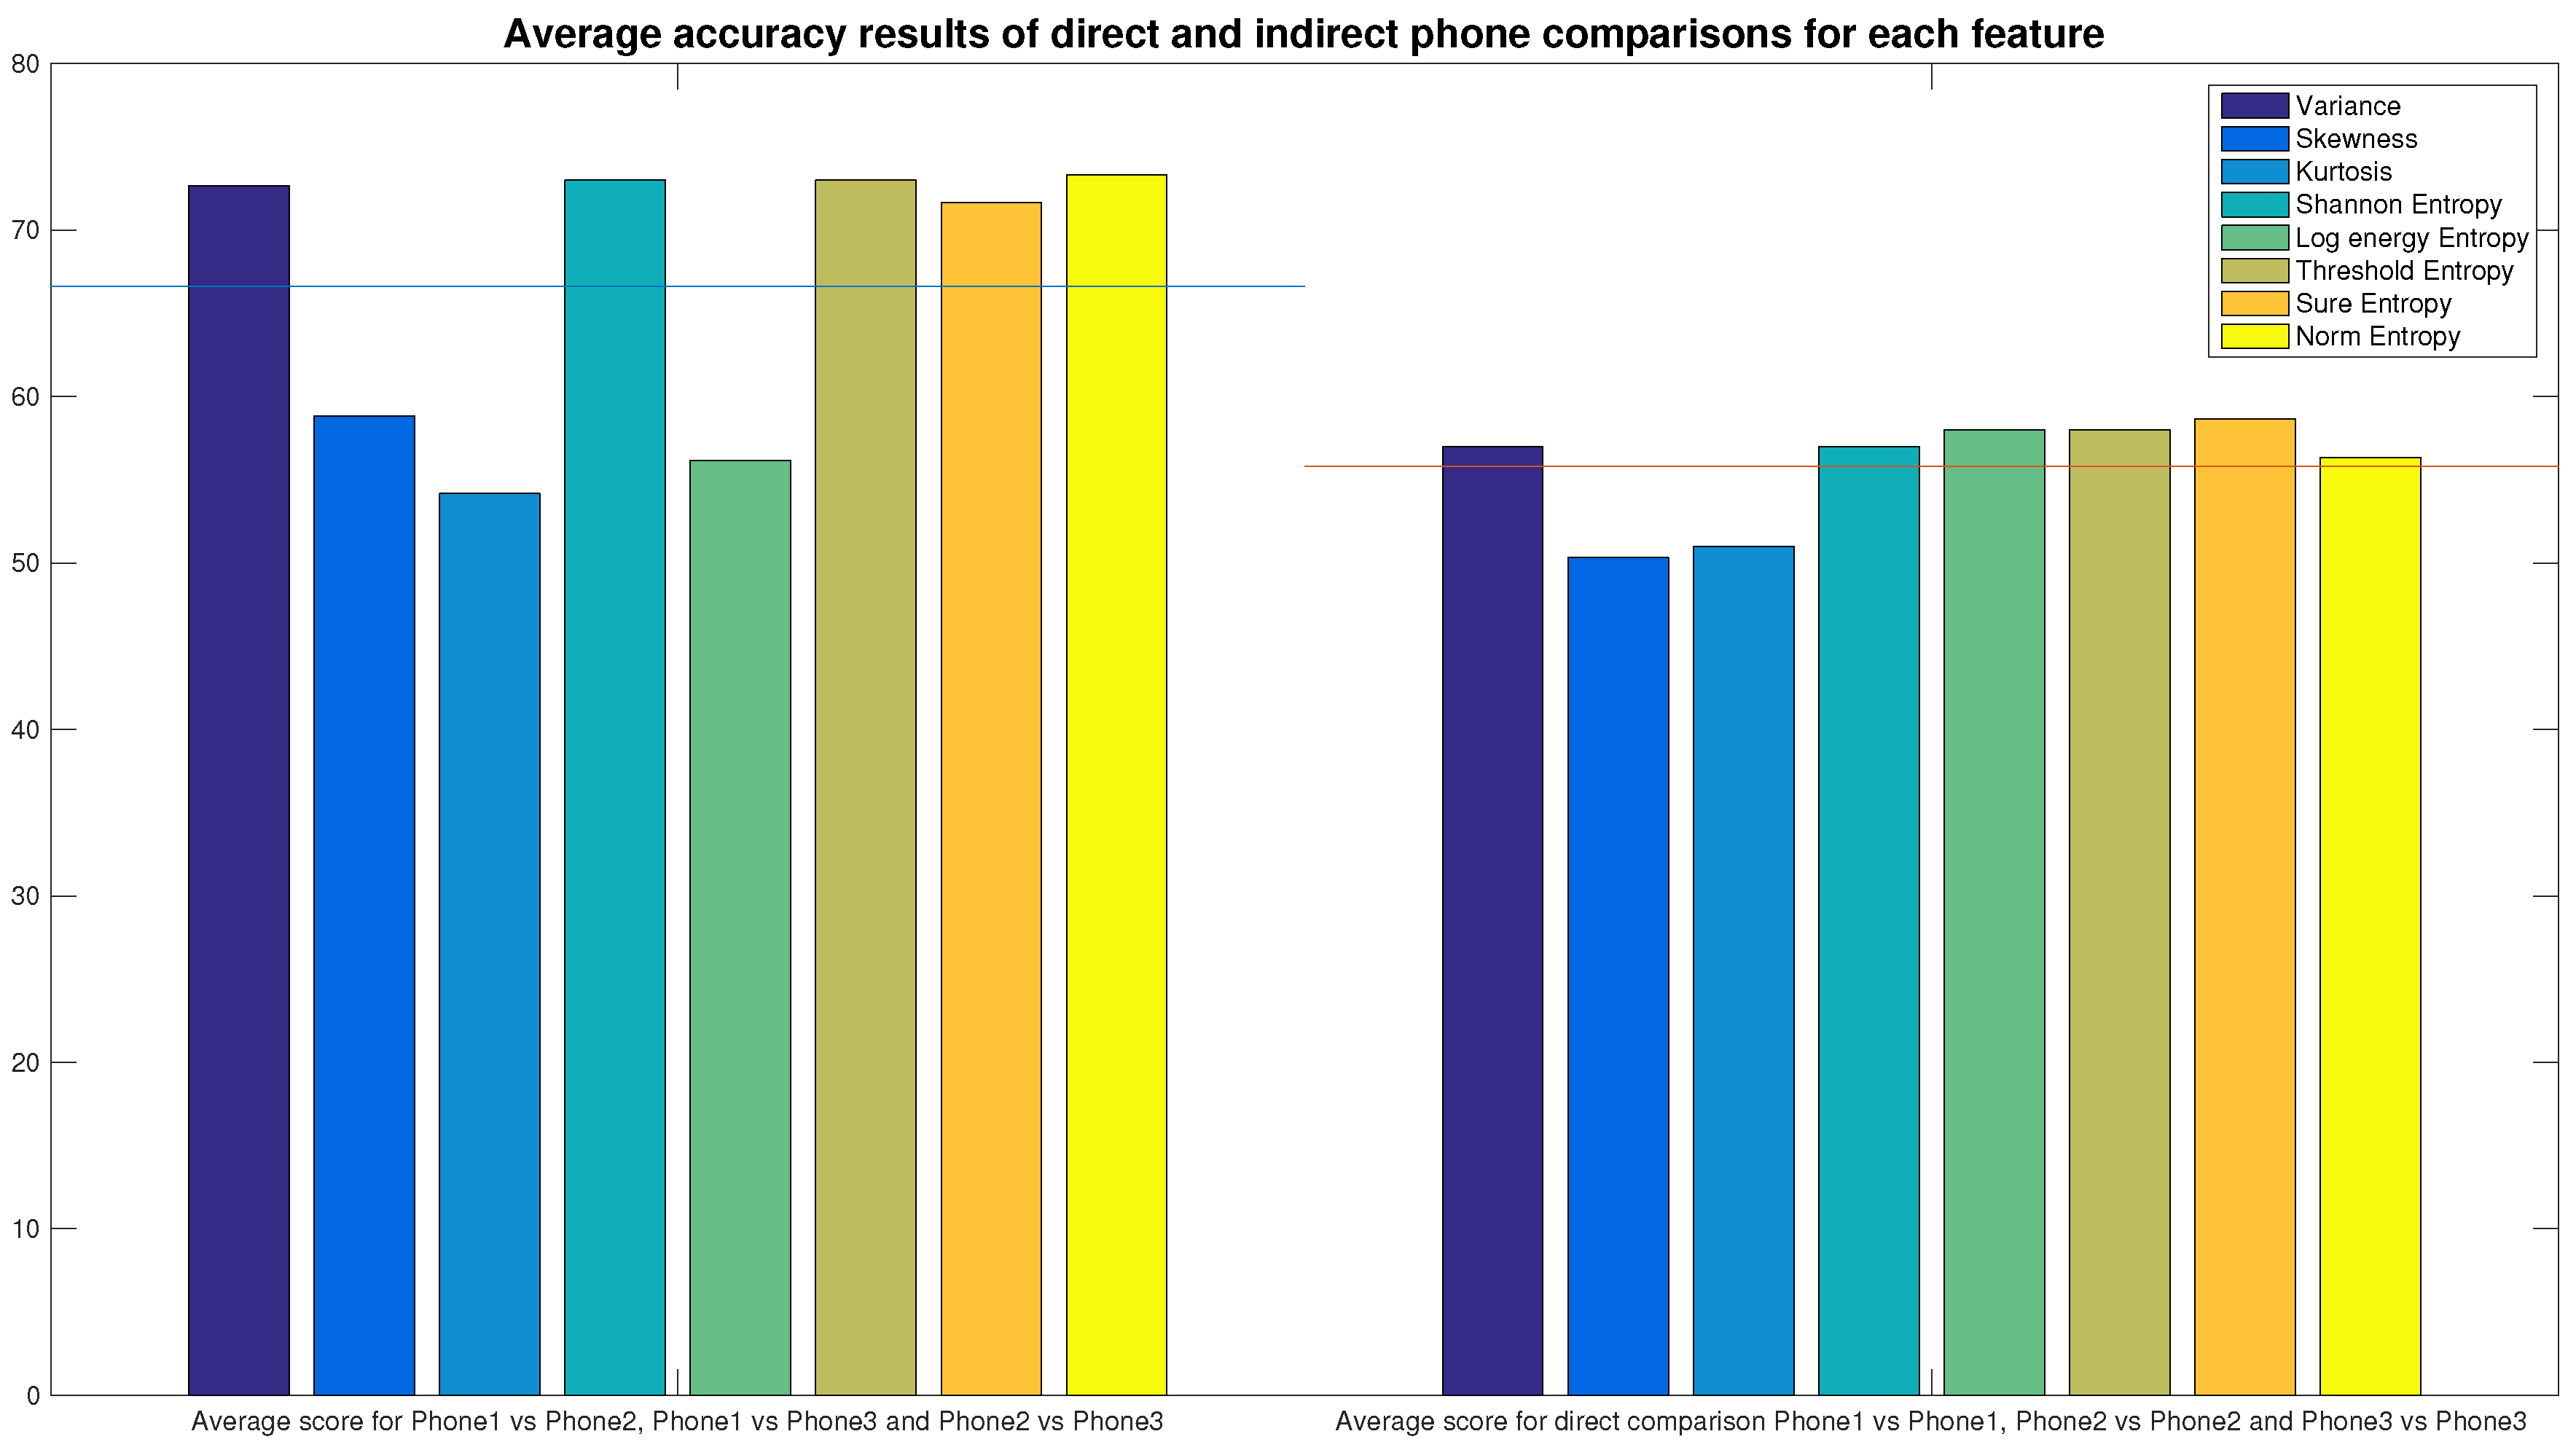
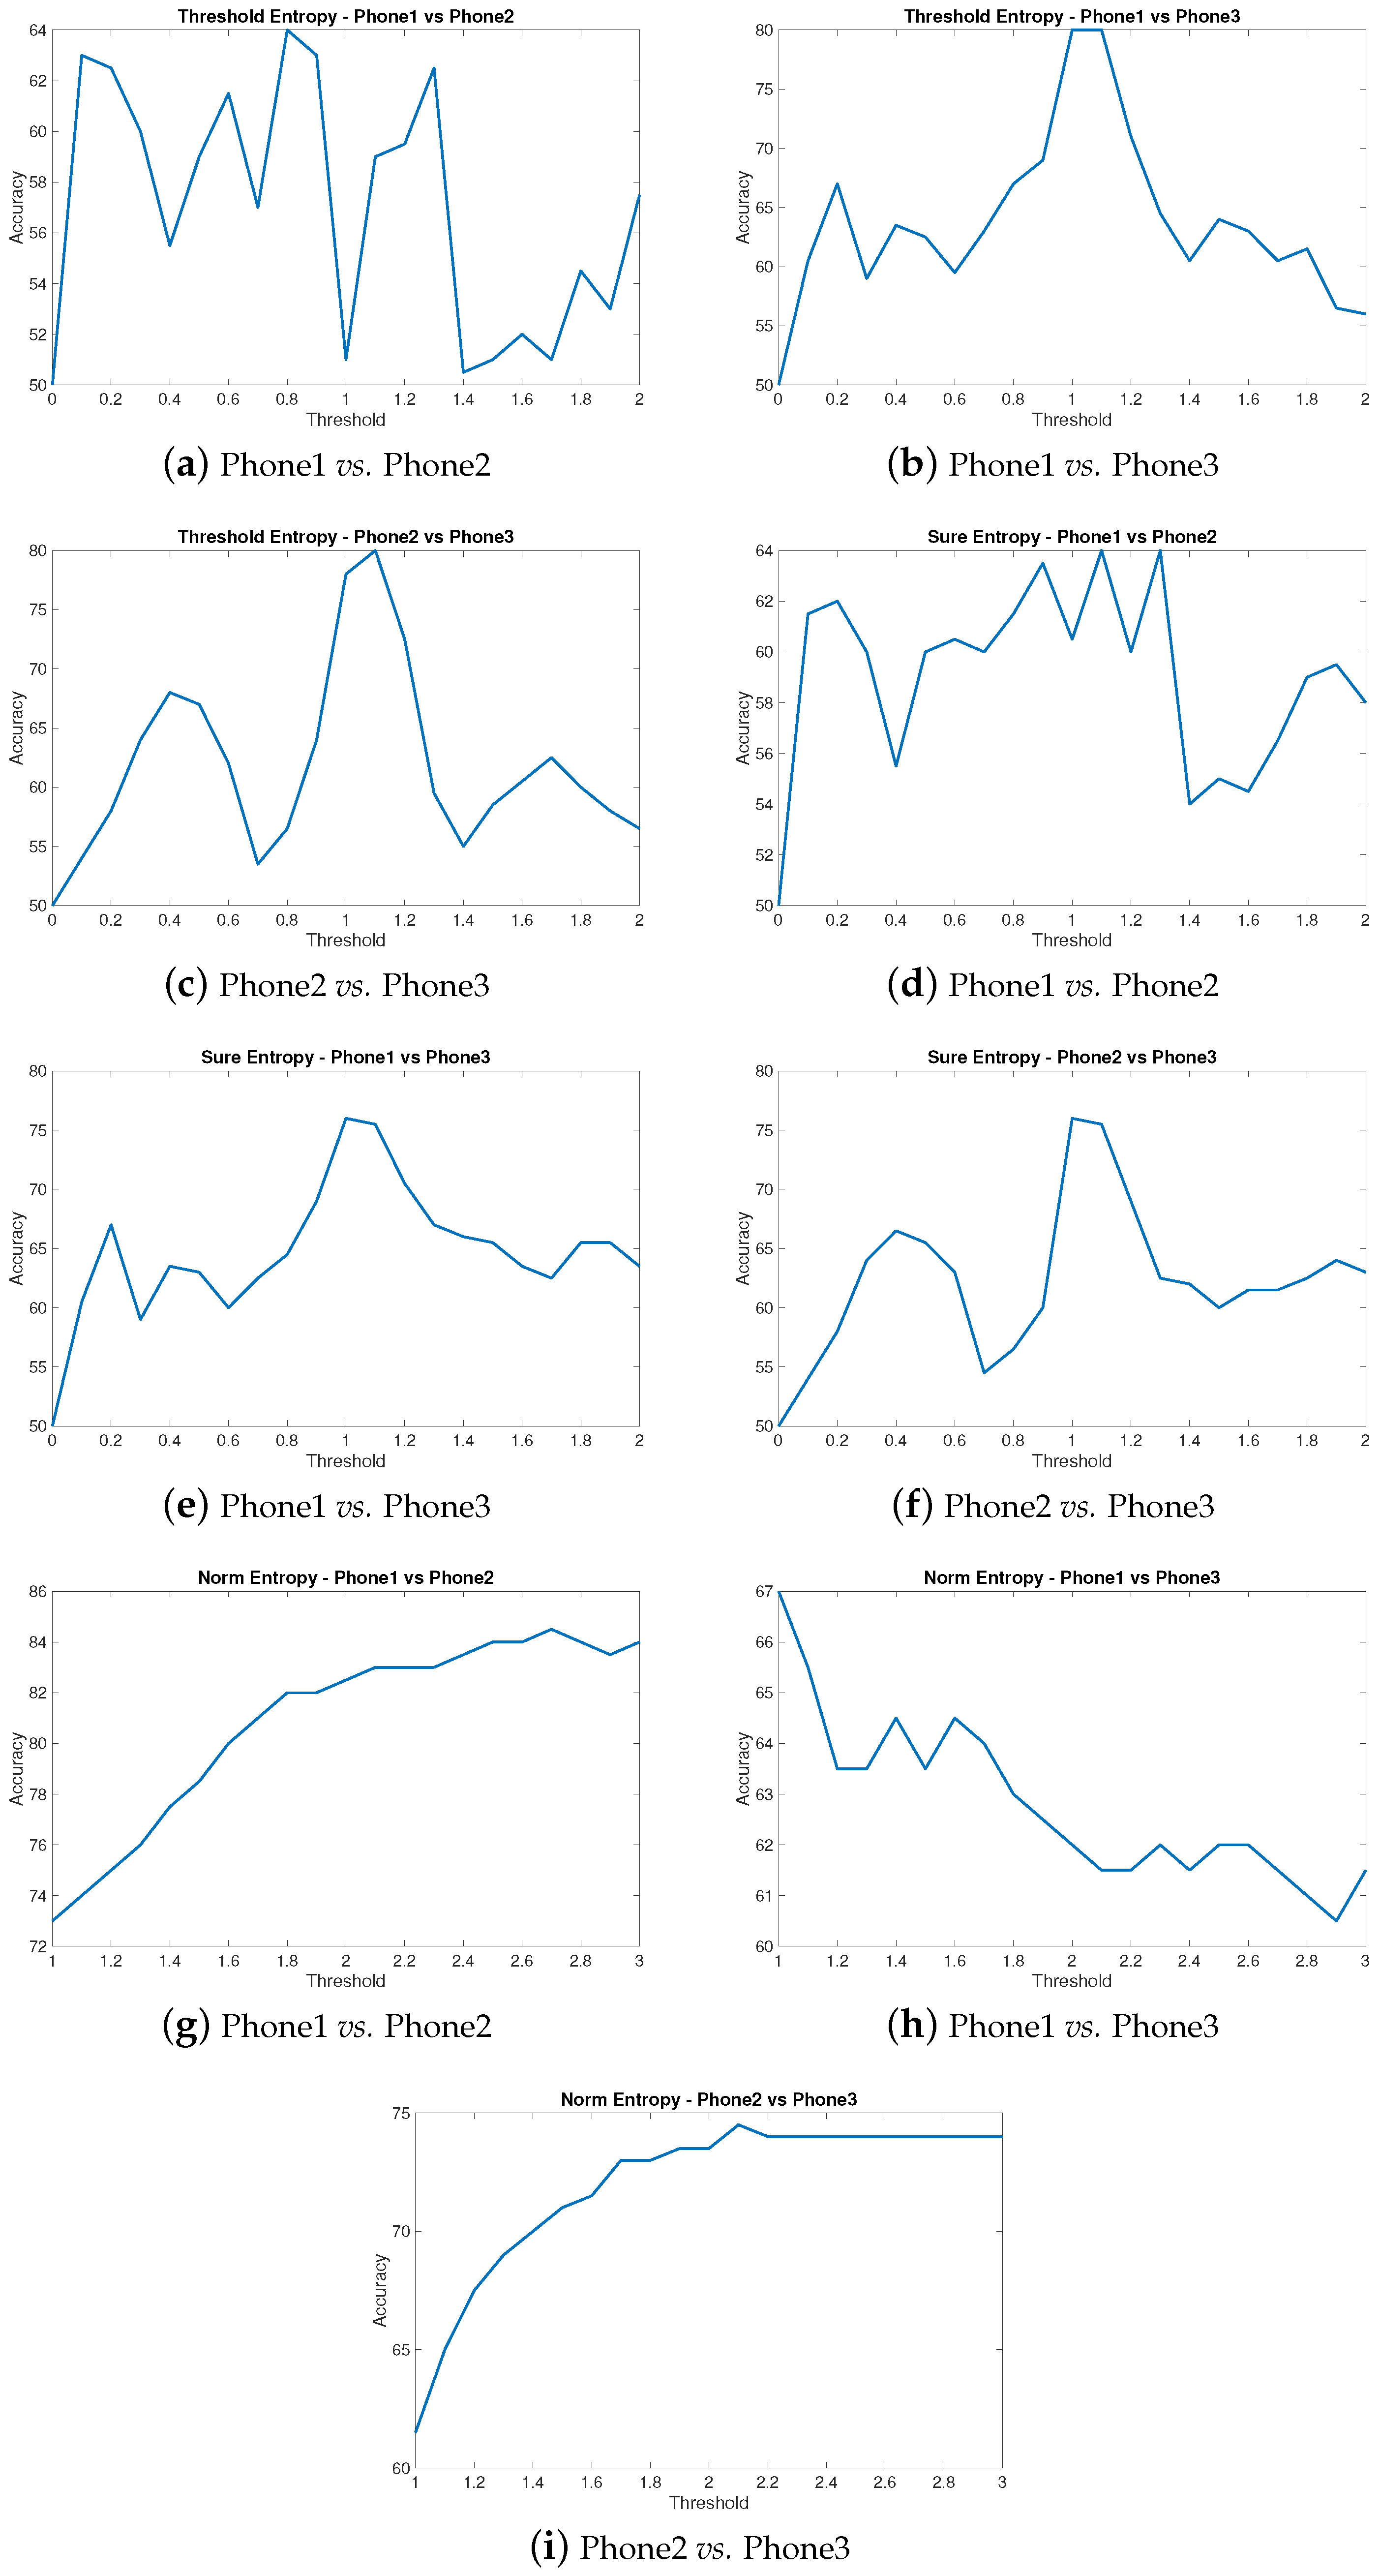
4.1. Features Optimization
4.2. Optimizing the Training Algorithm
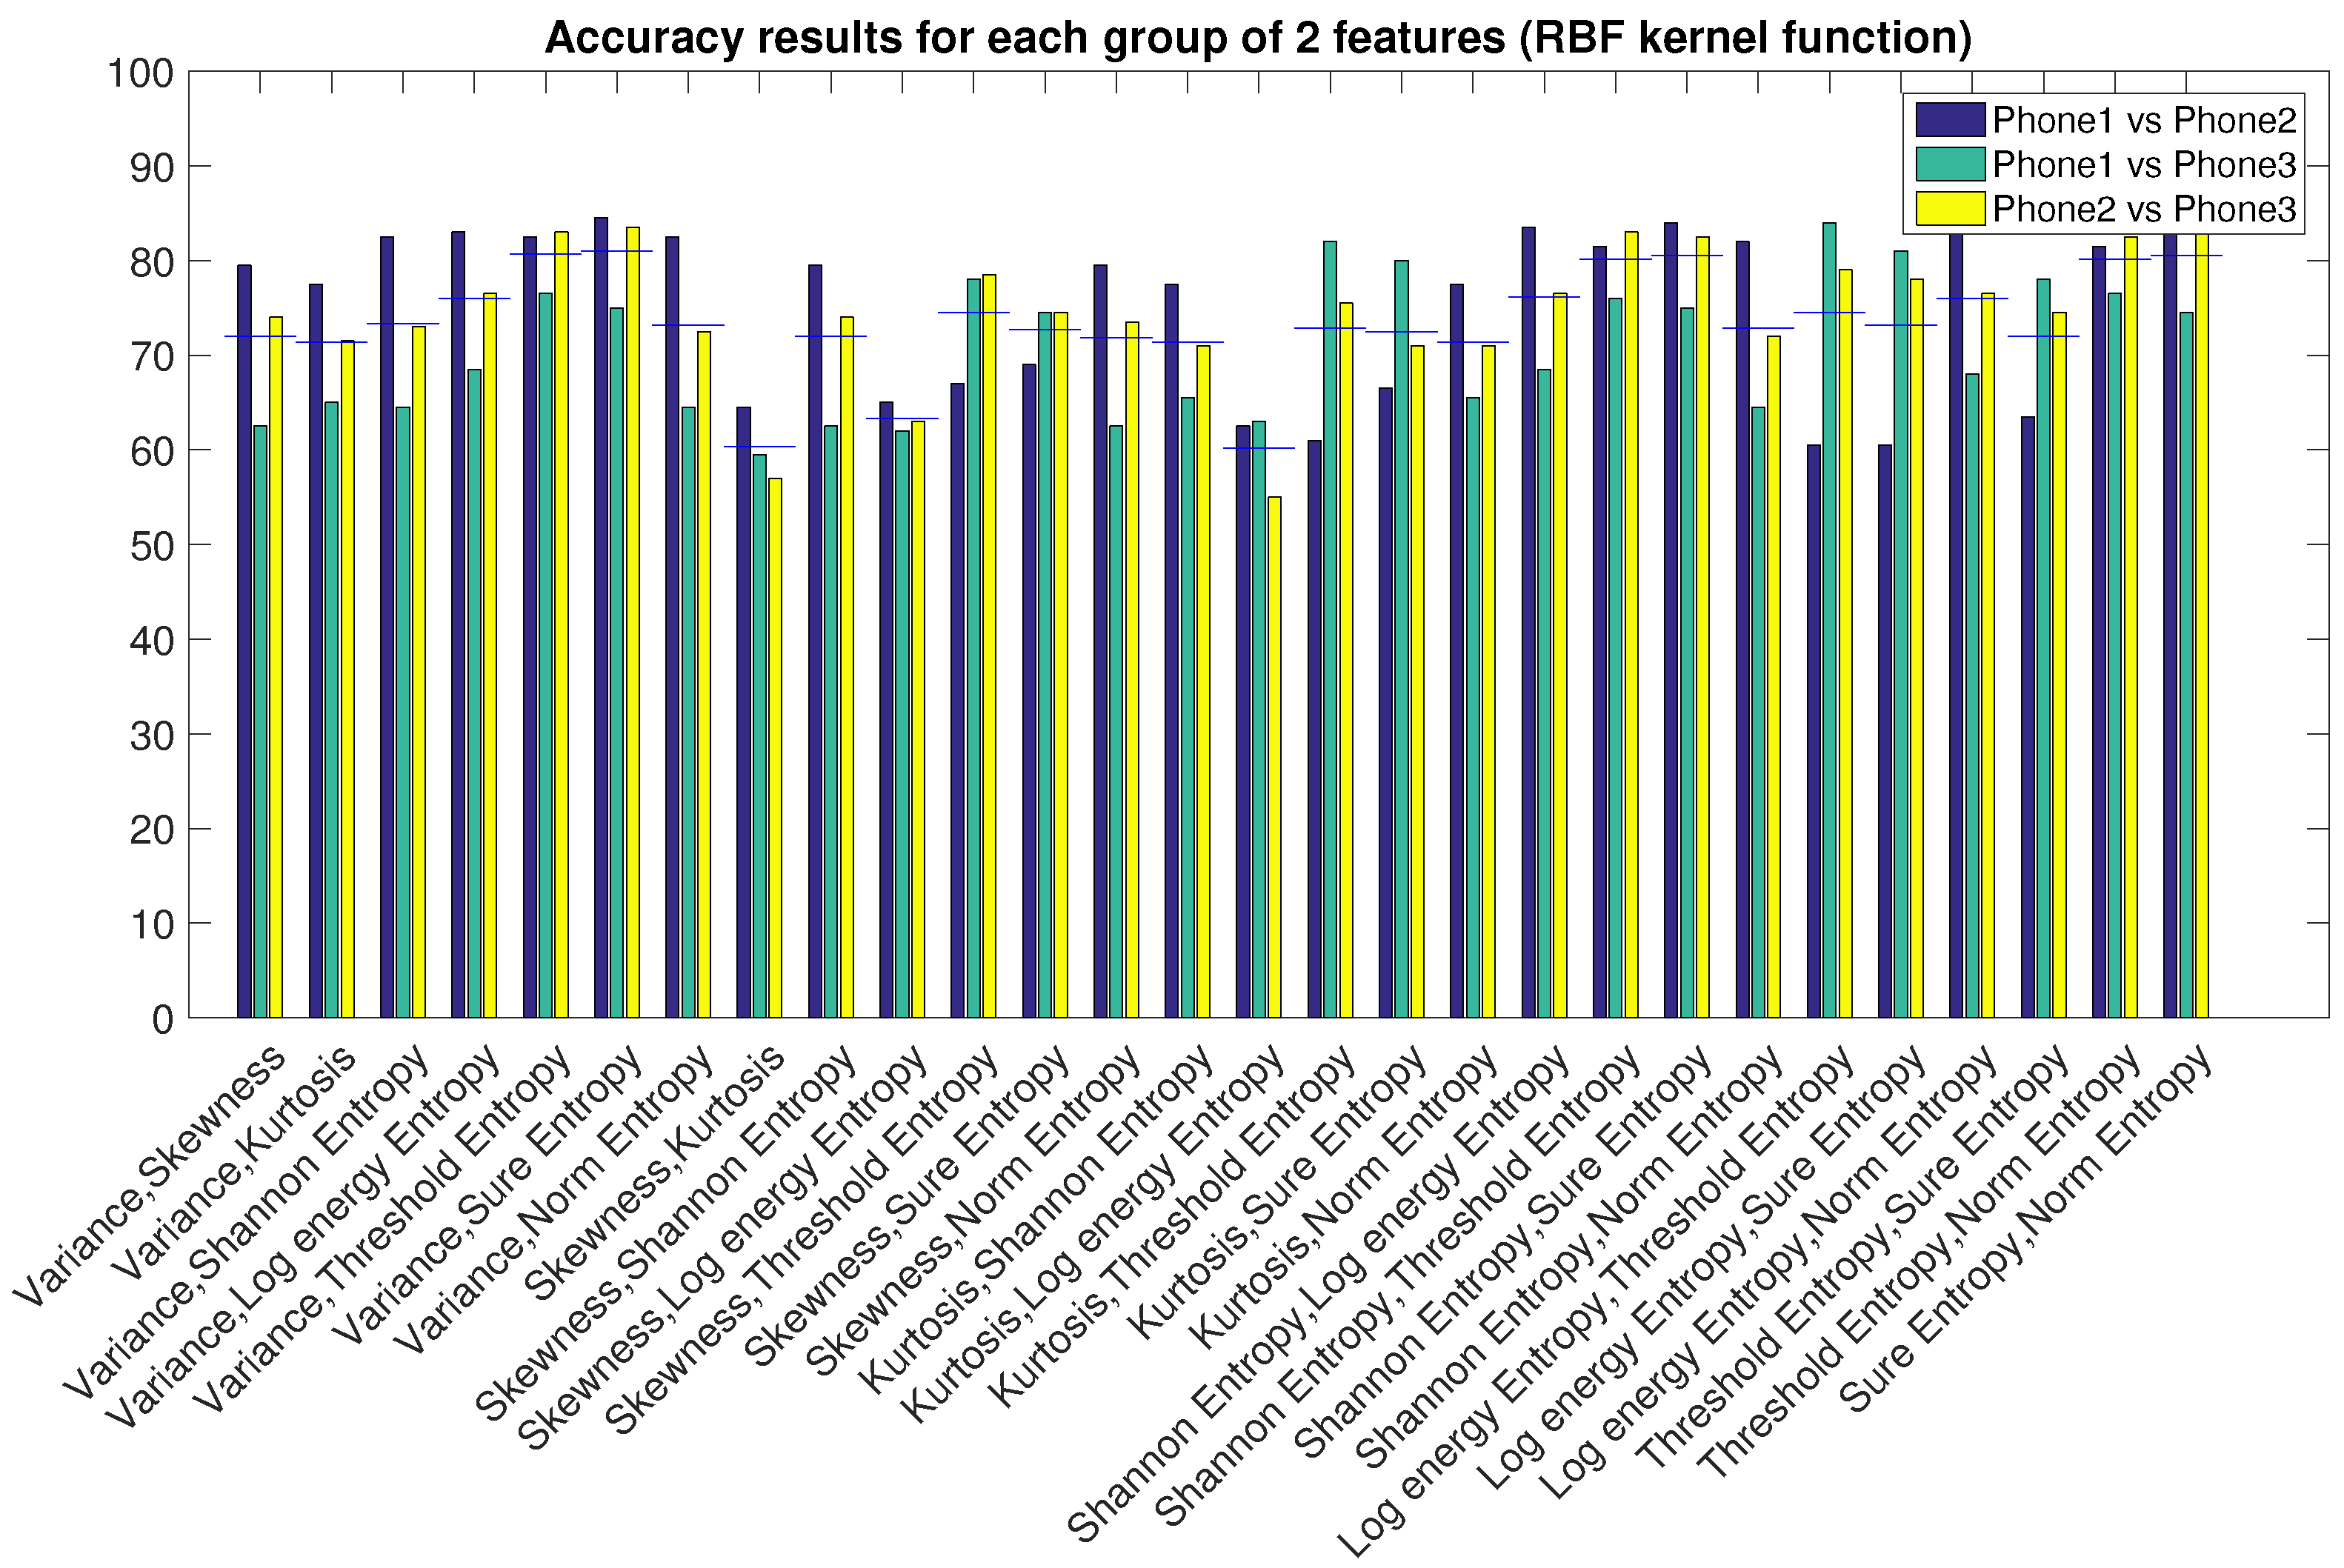
4.3. Features Combination
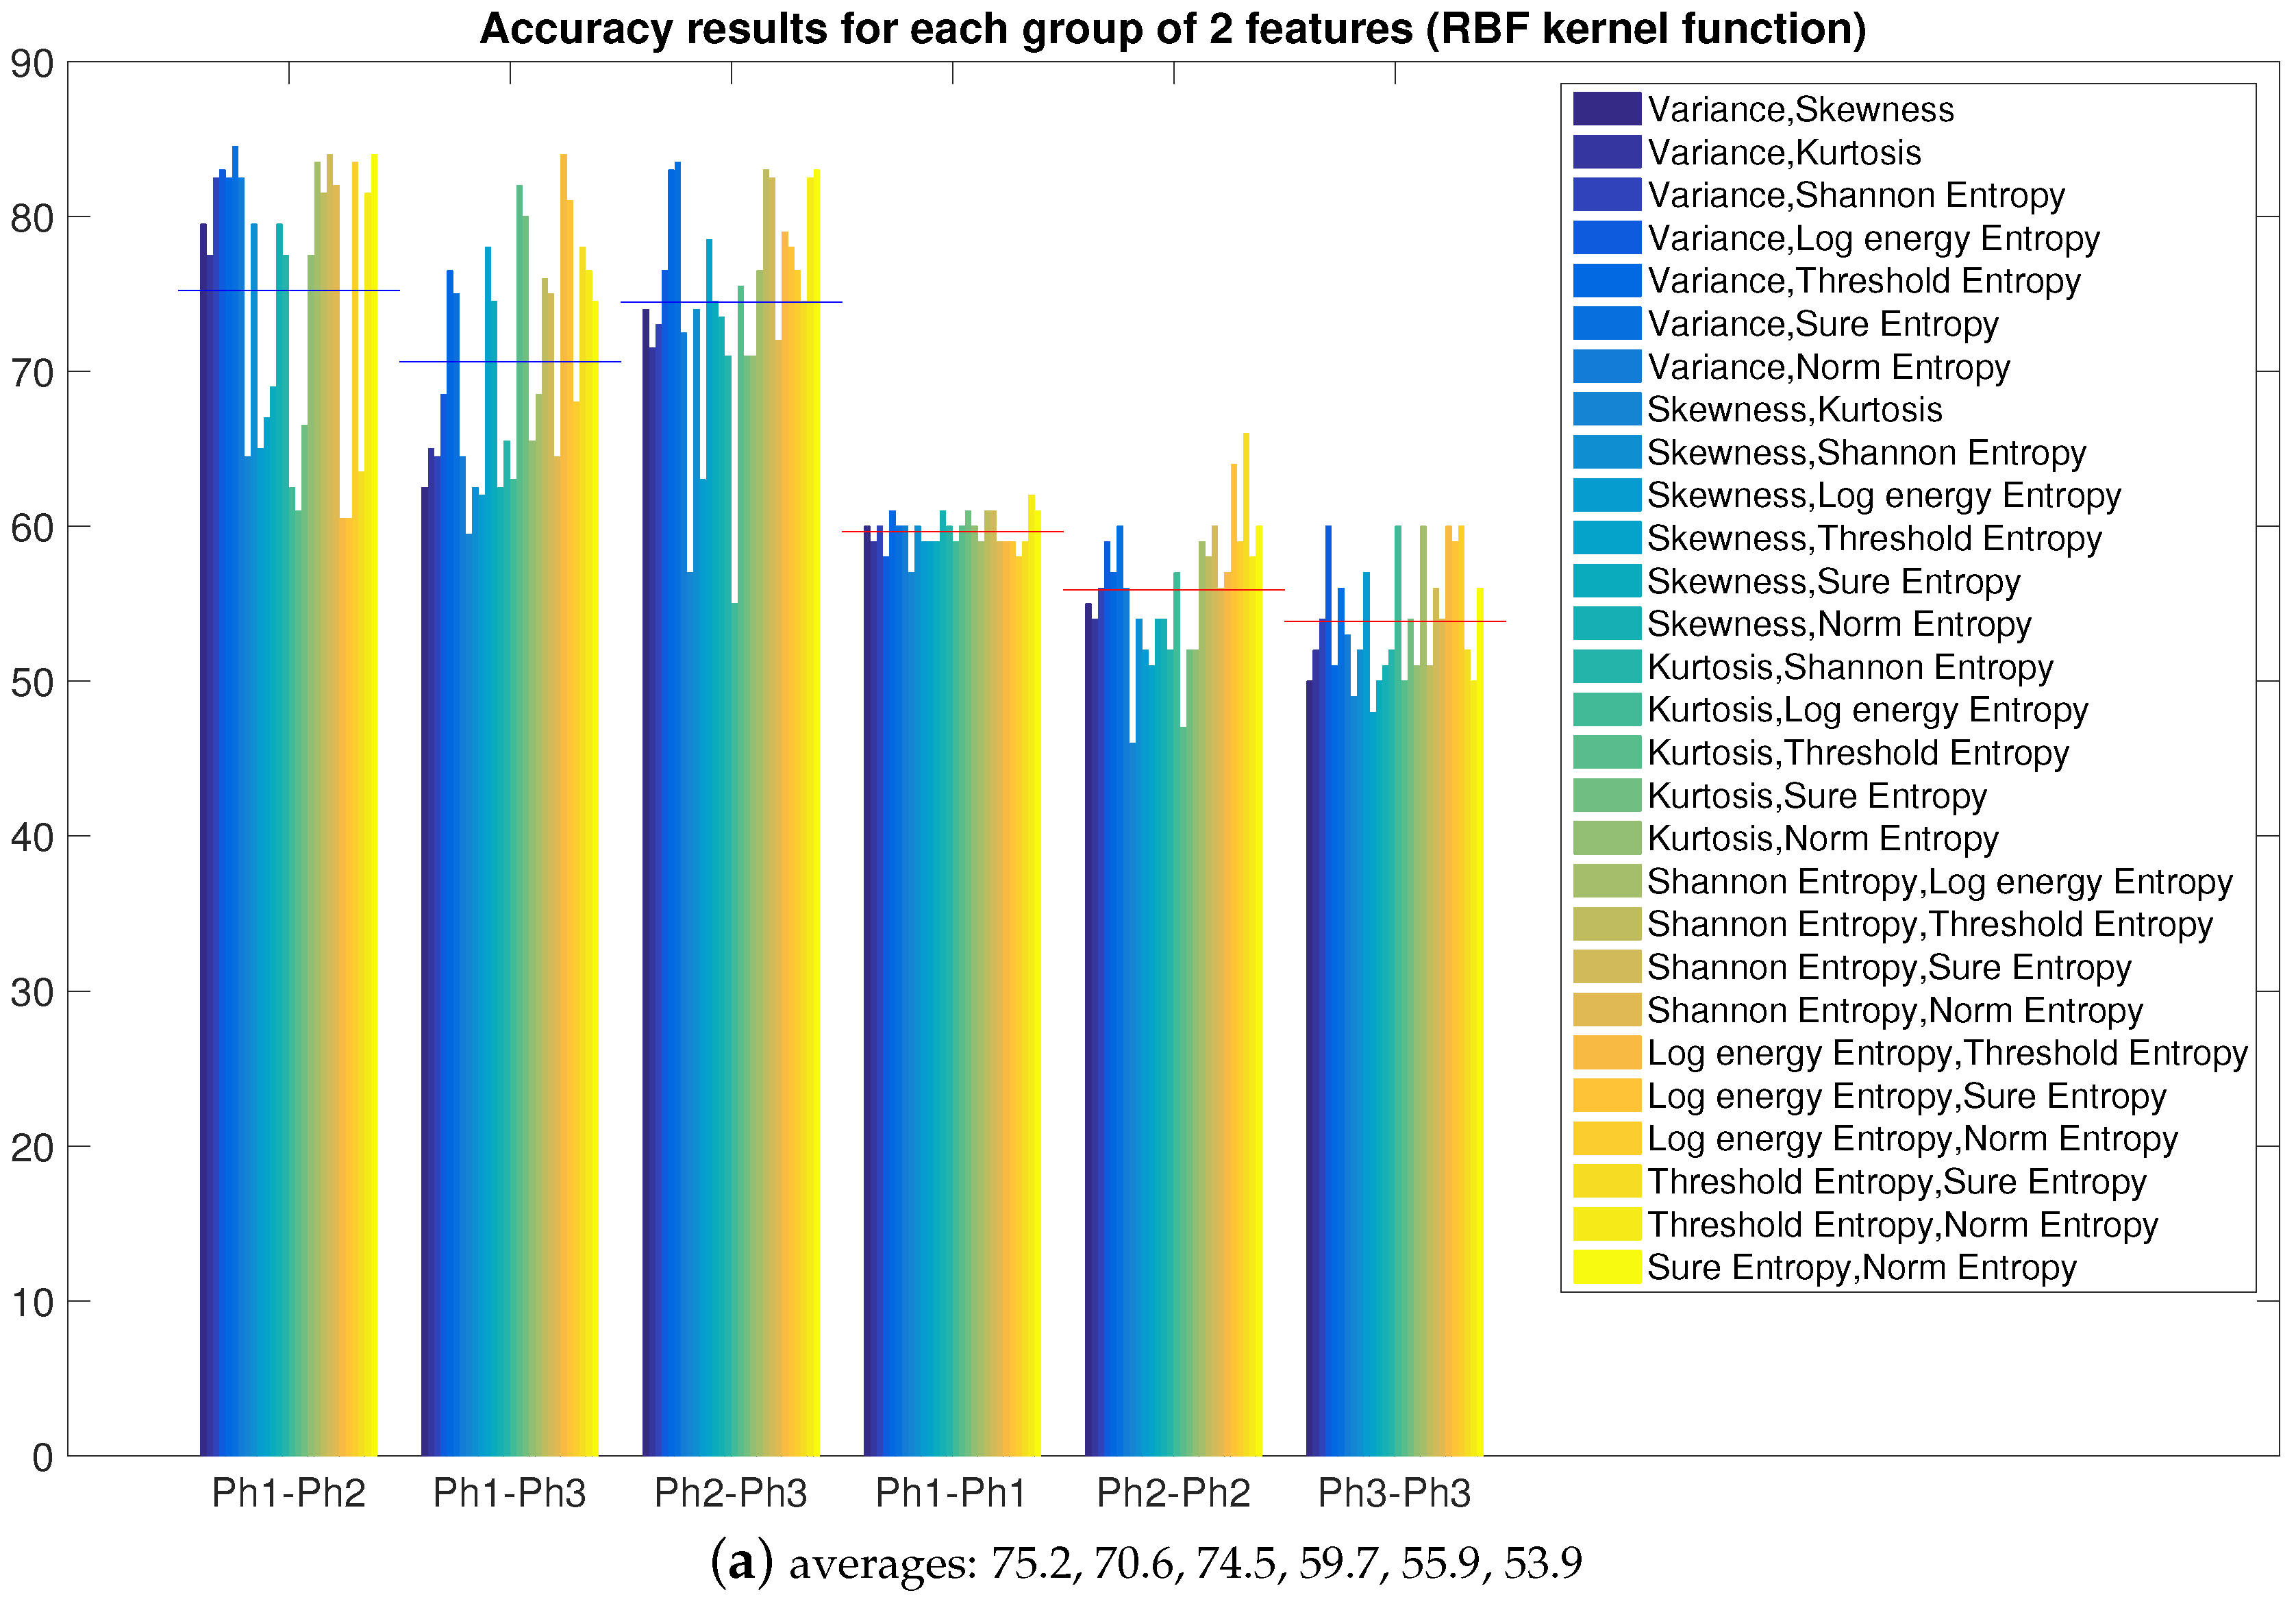
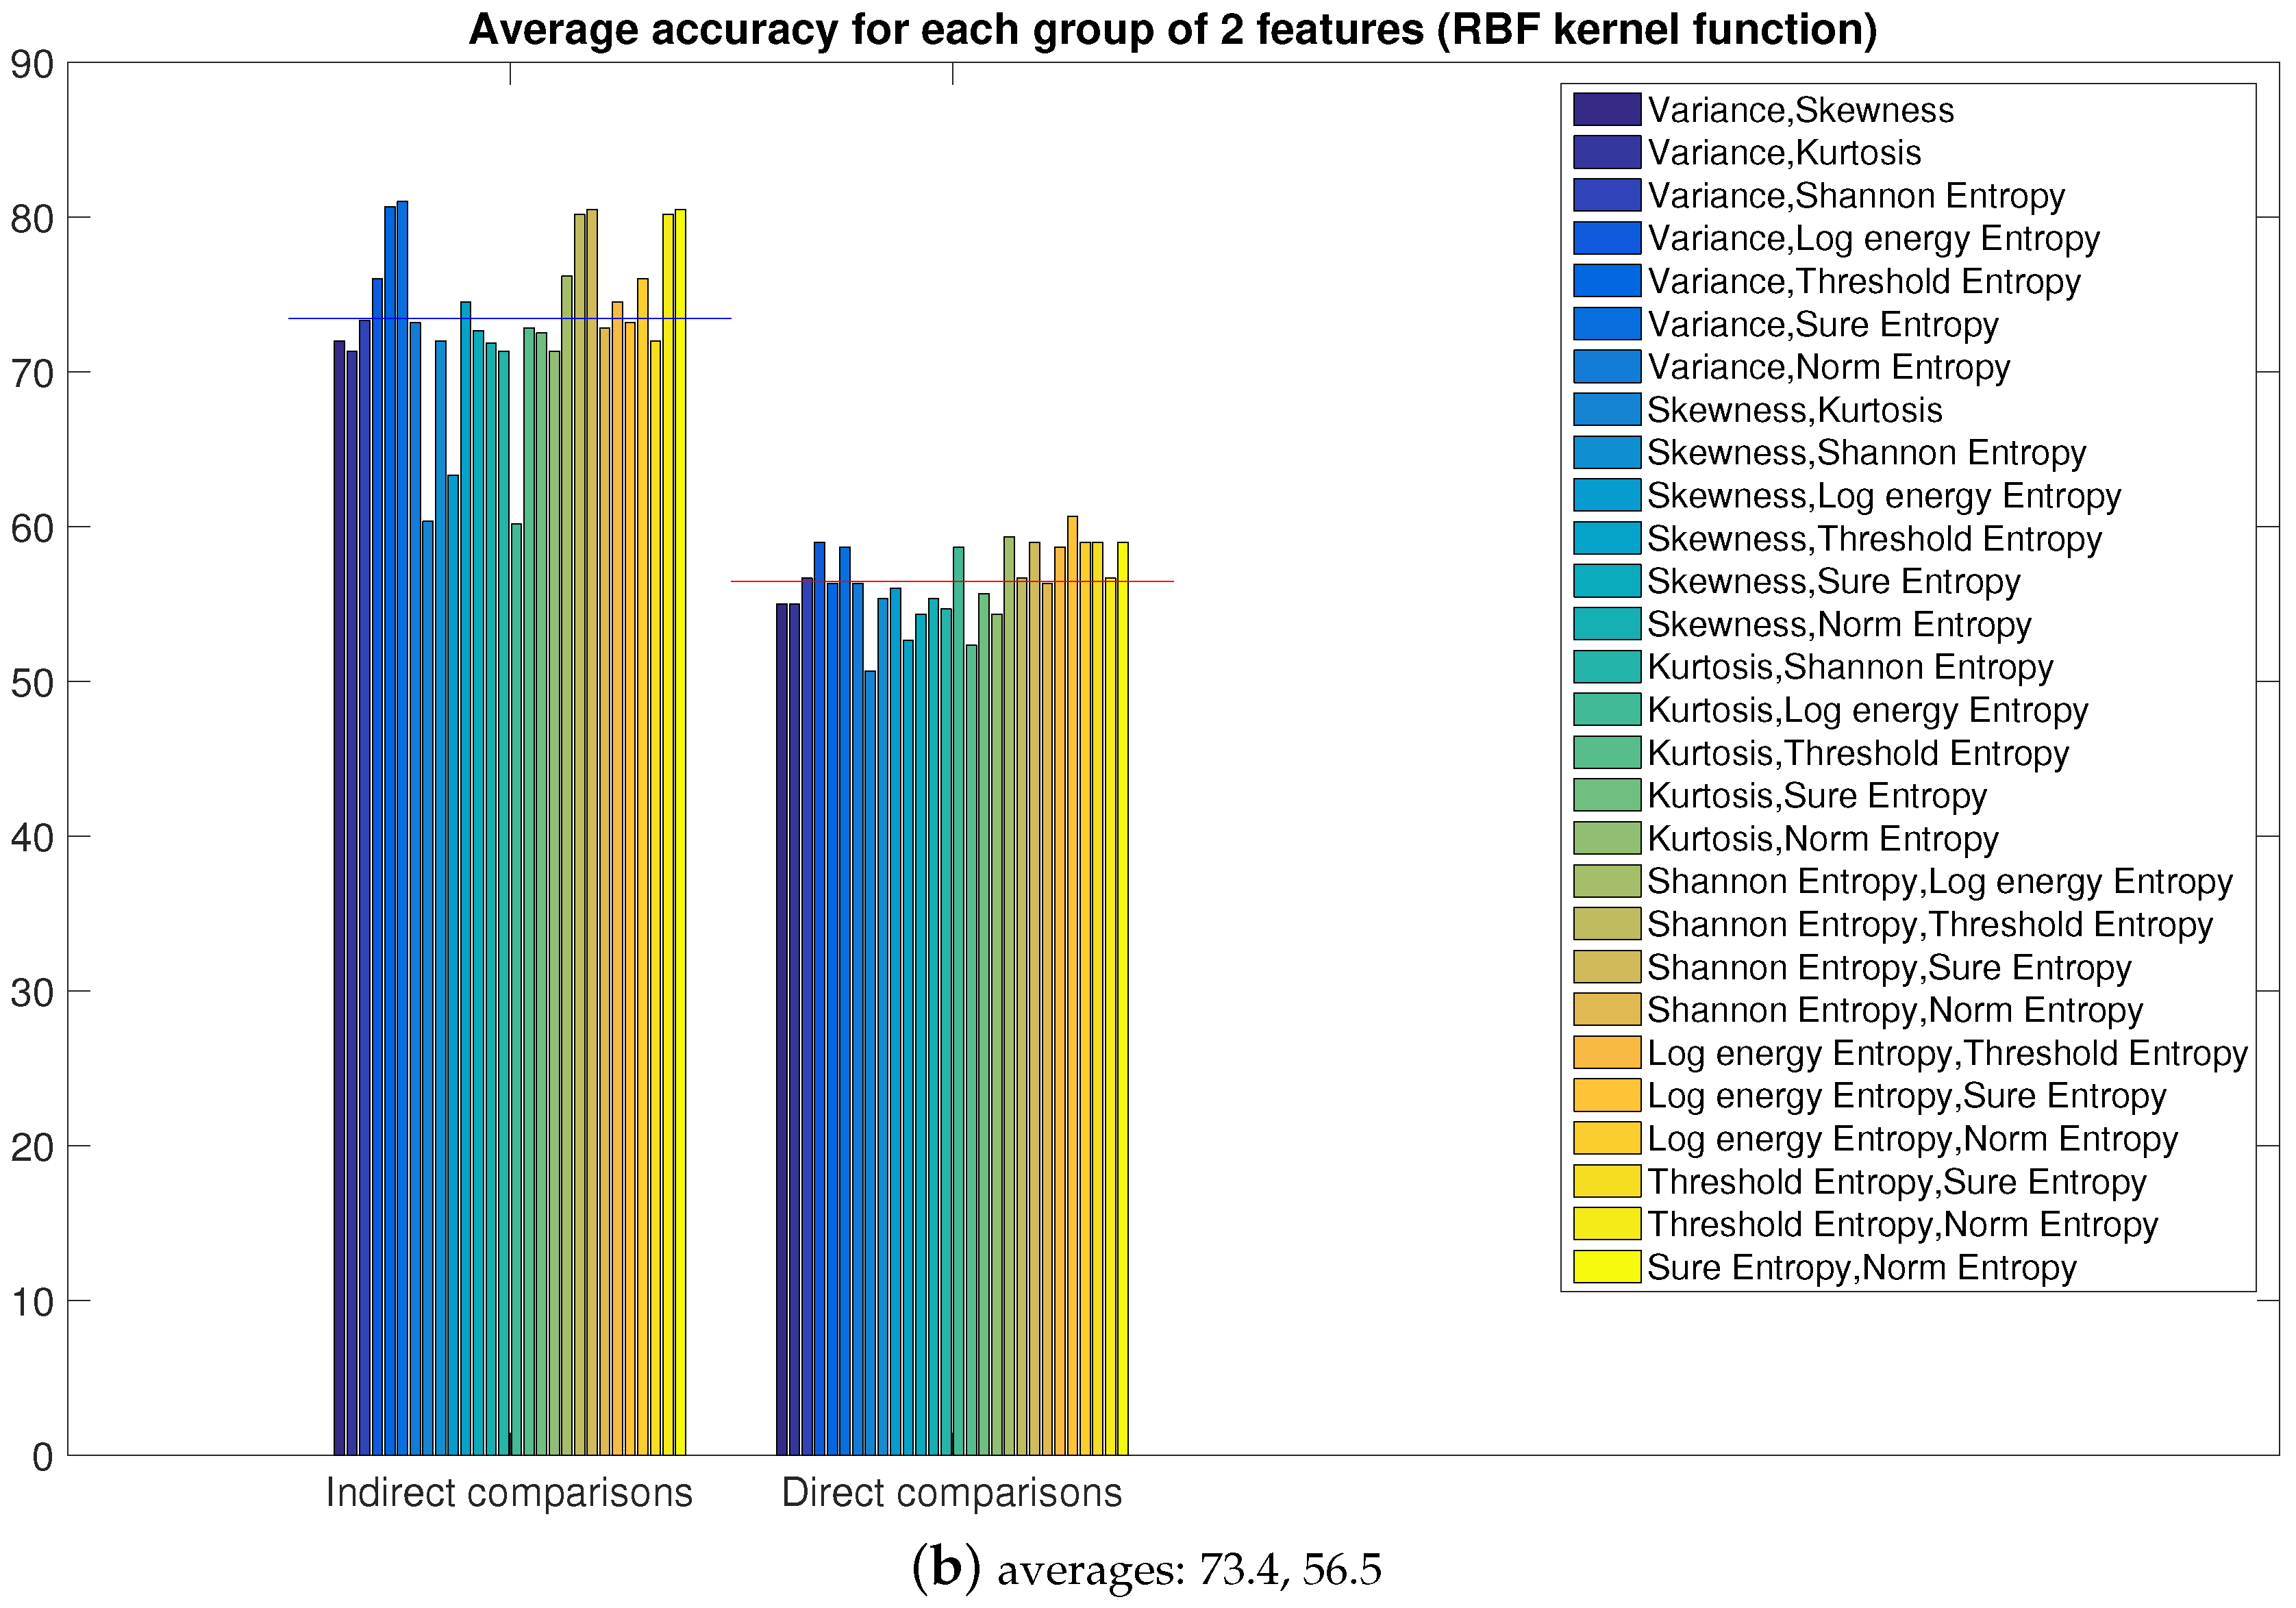
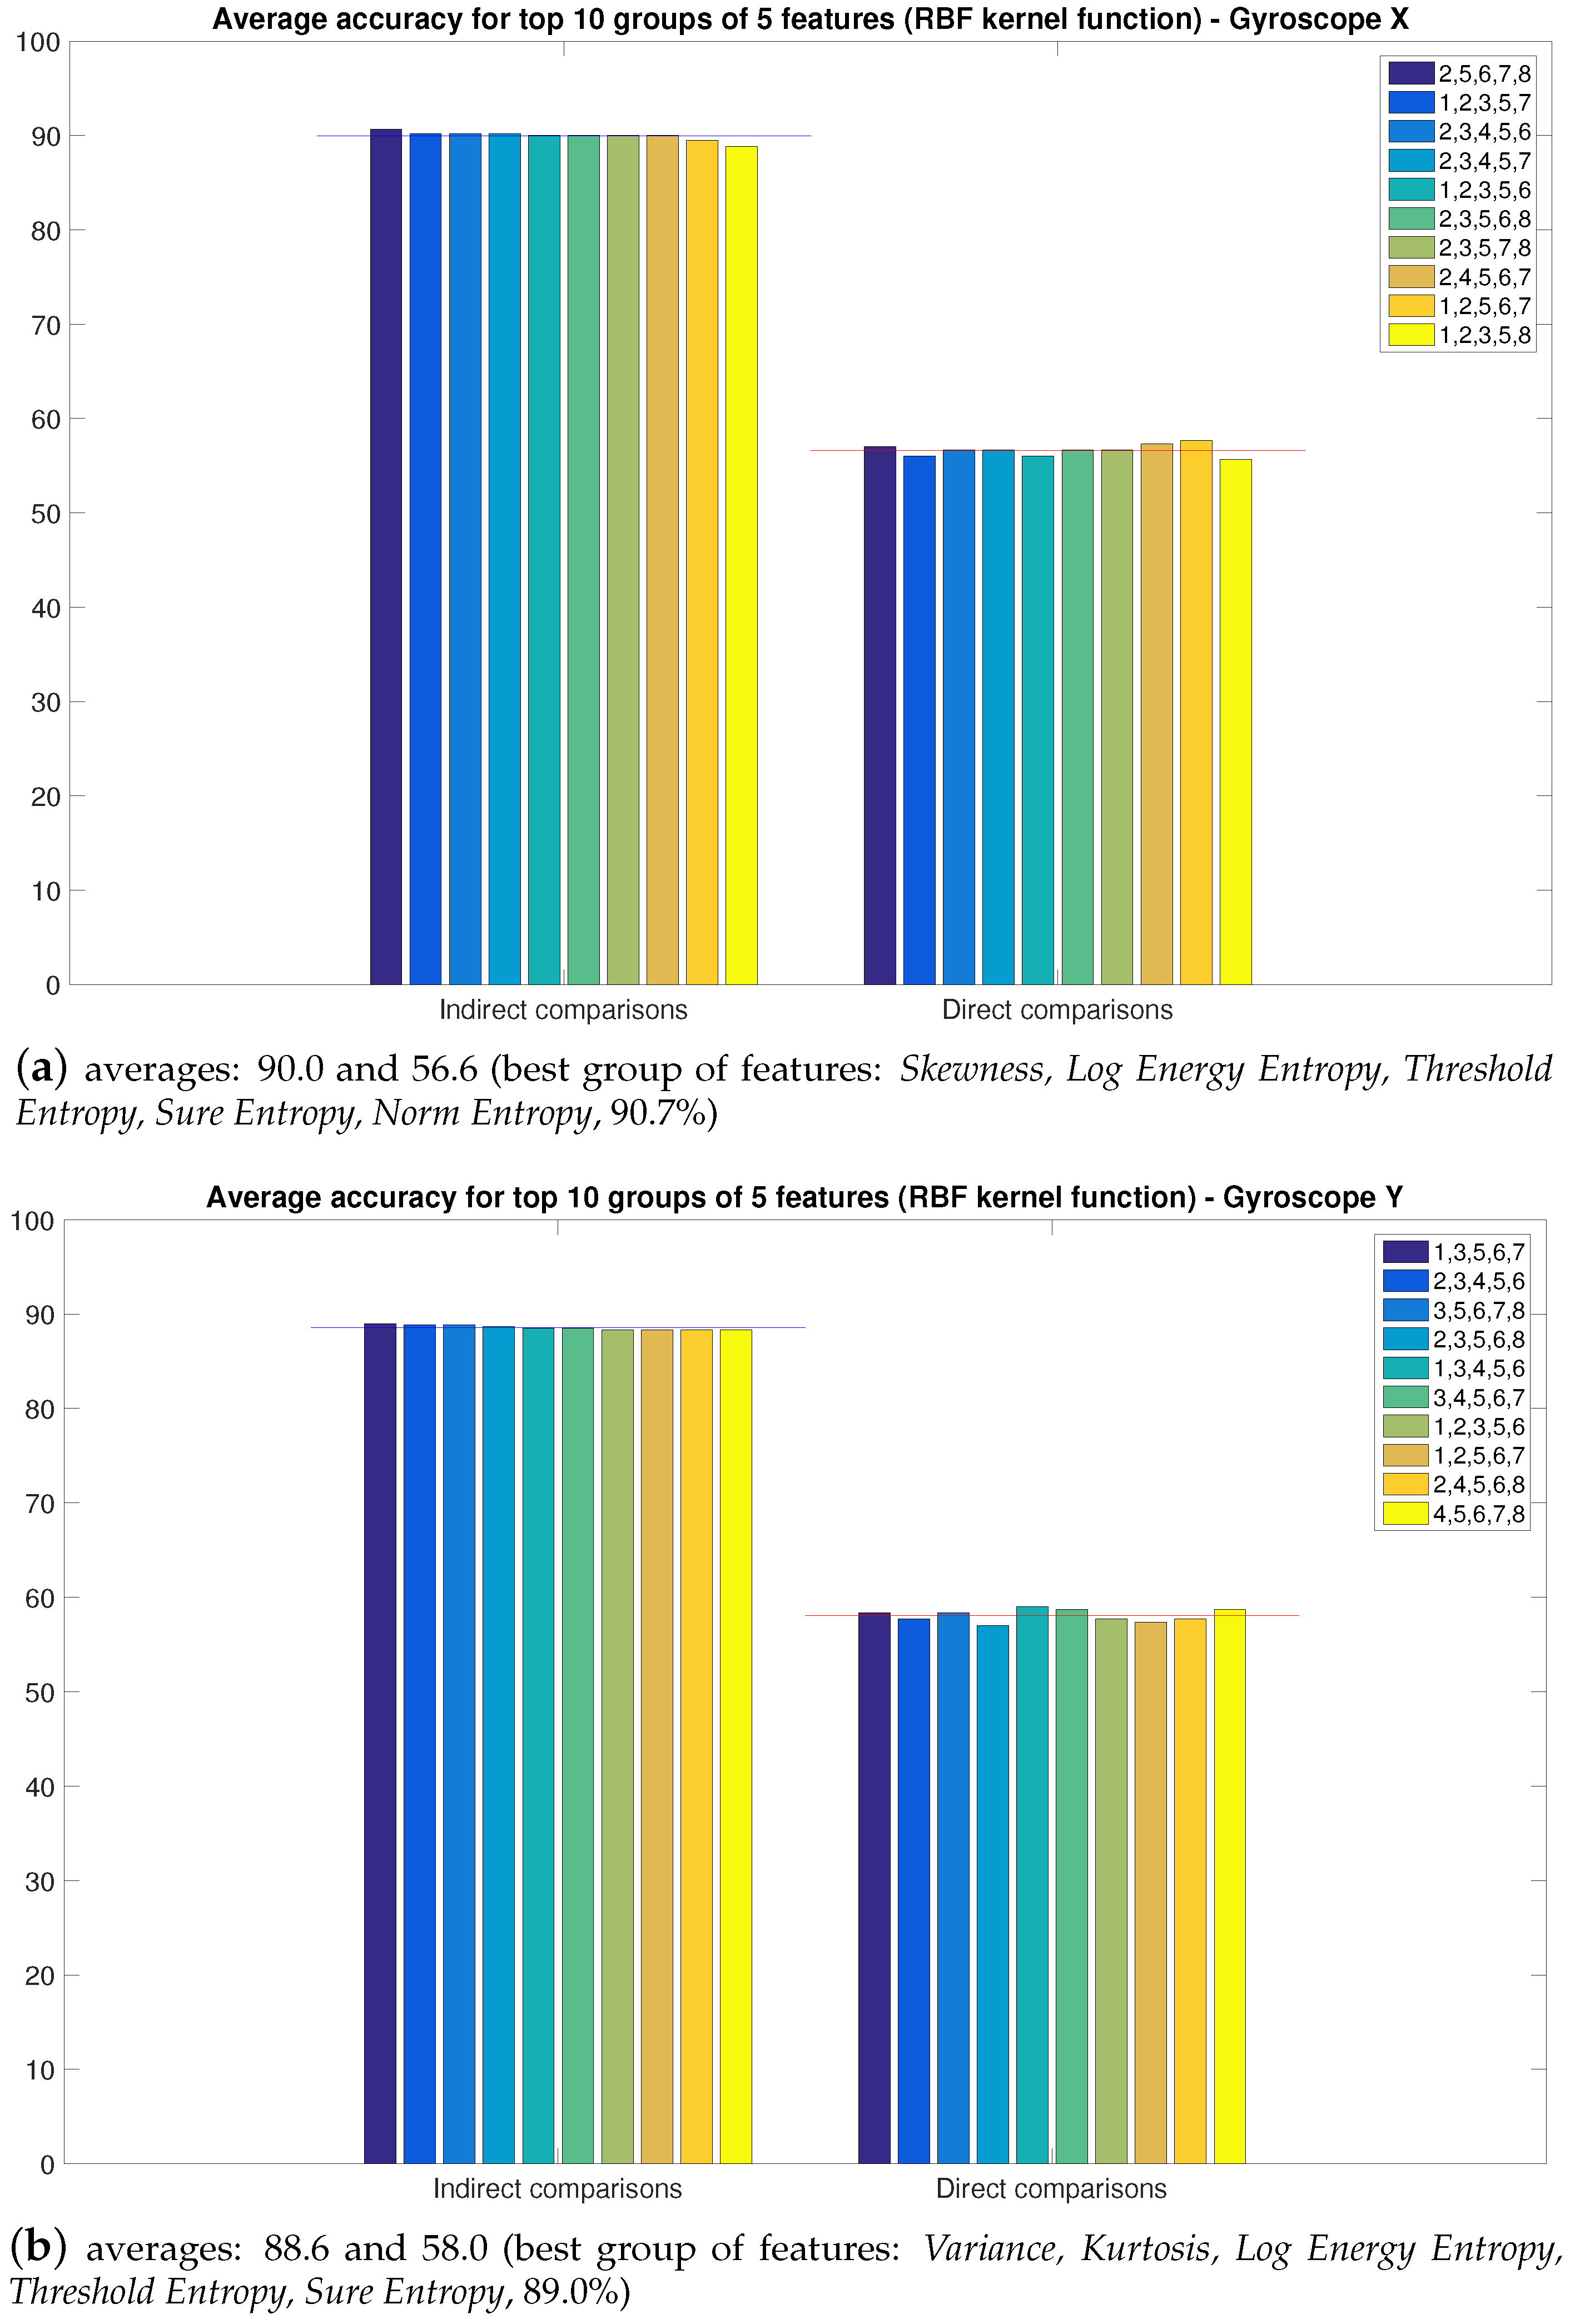
4.3.1. Combination in Groups of Two, Three, Four and Five Features
4.3.2. Combination in Groups of Six, Seven and Eight Features
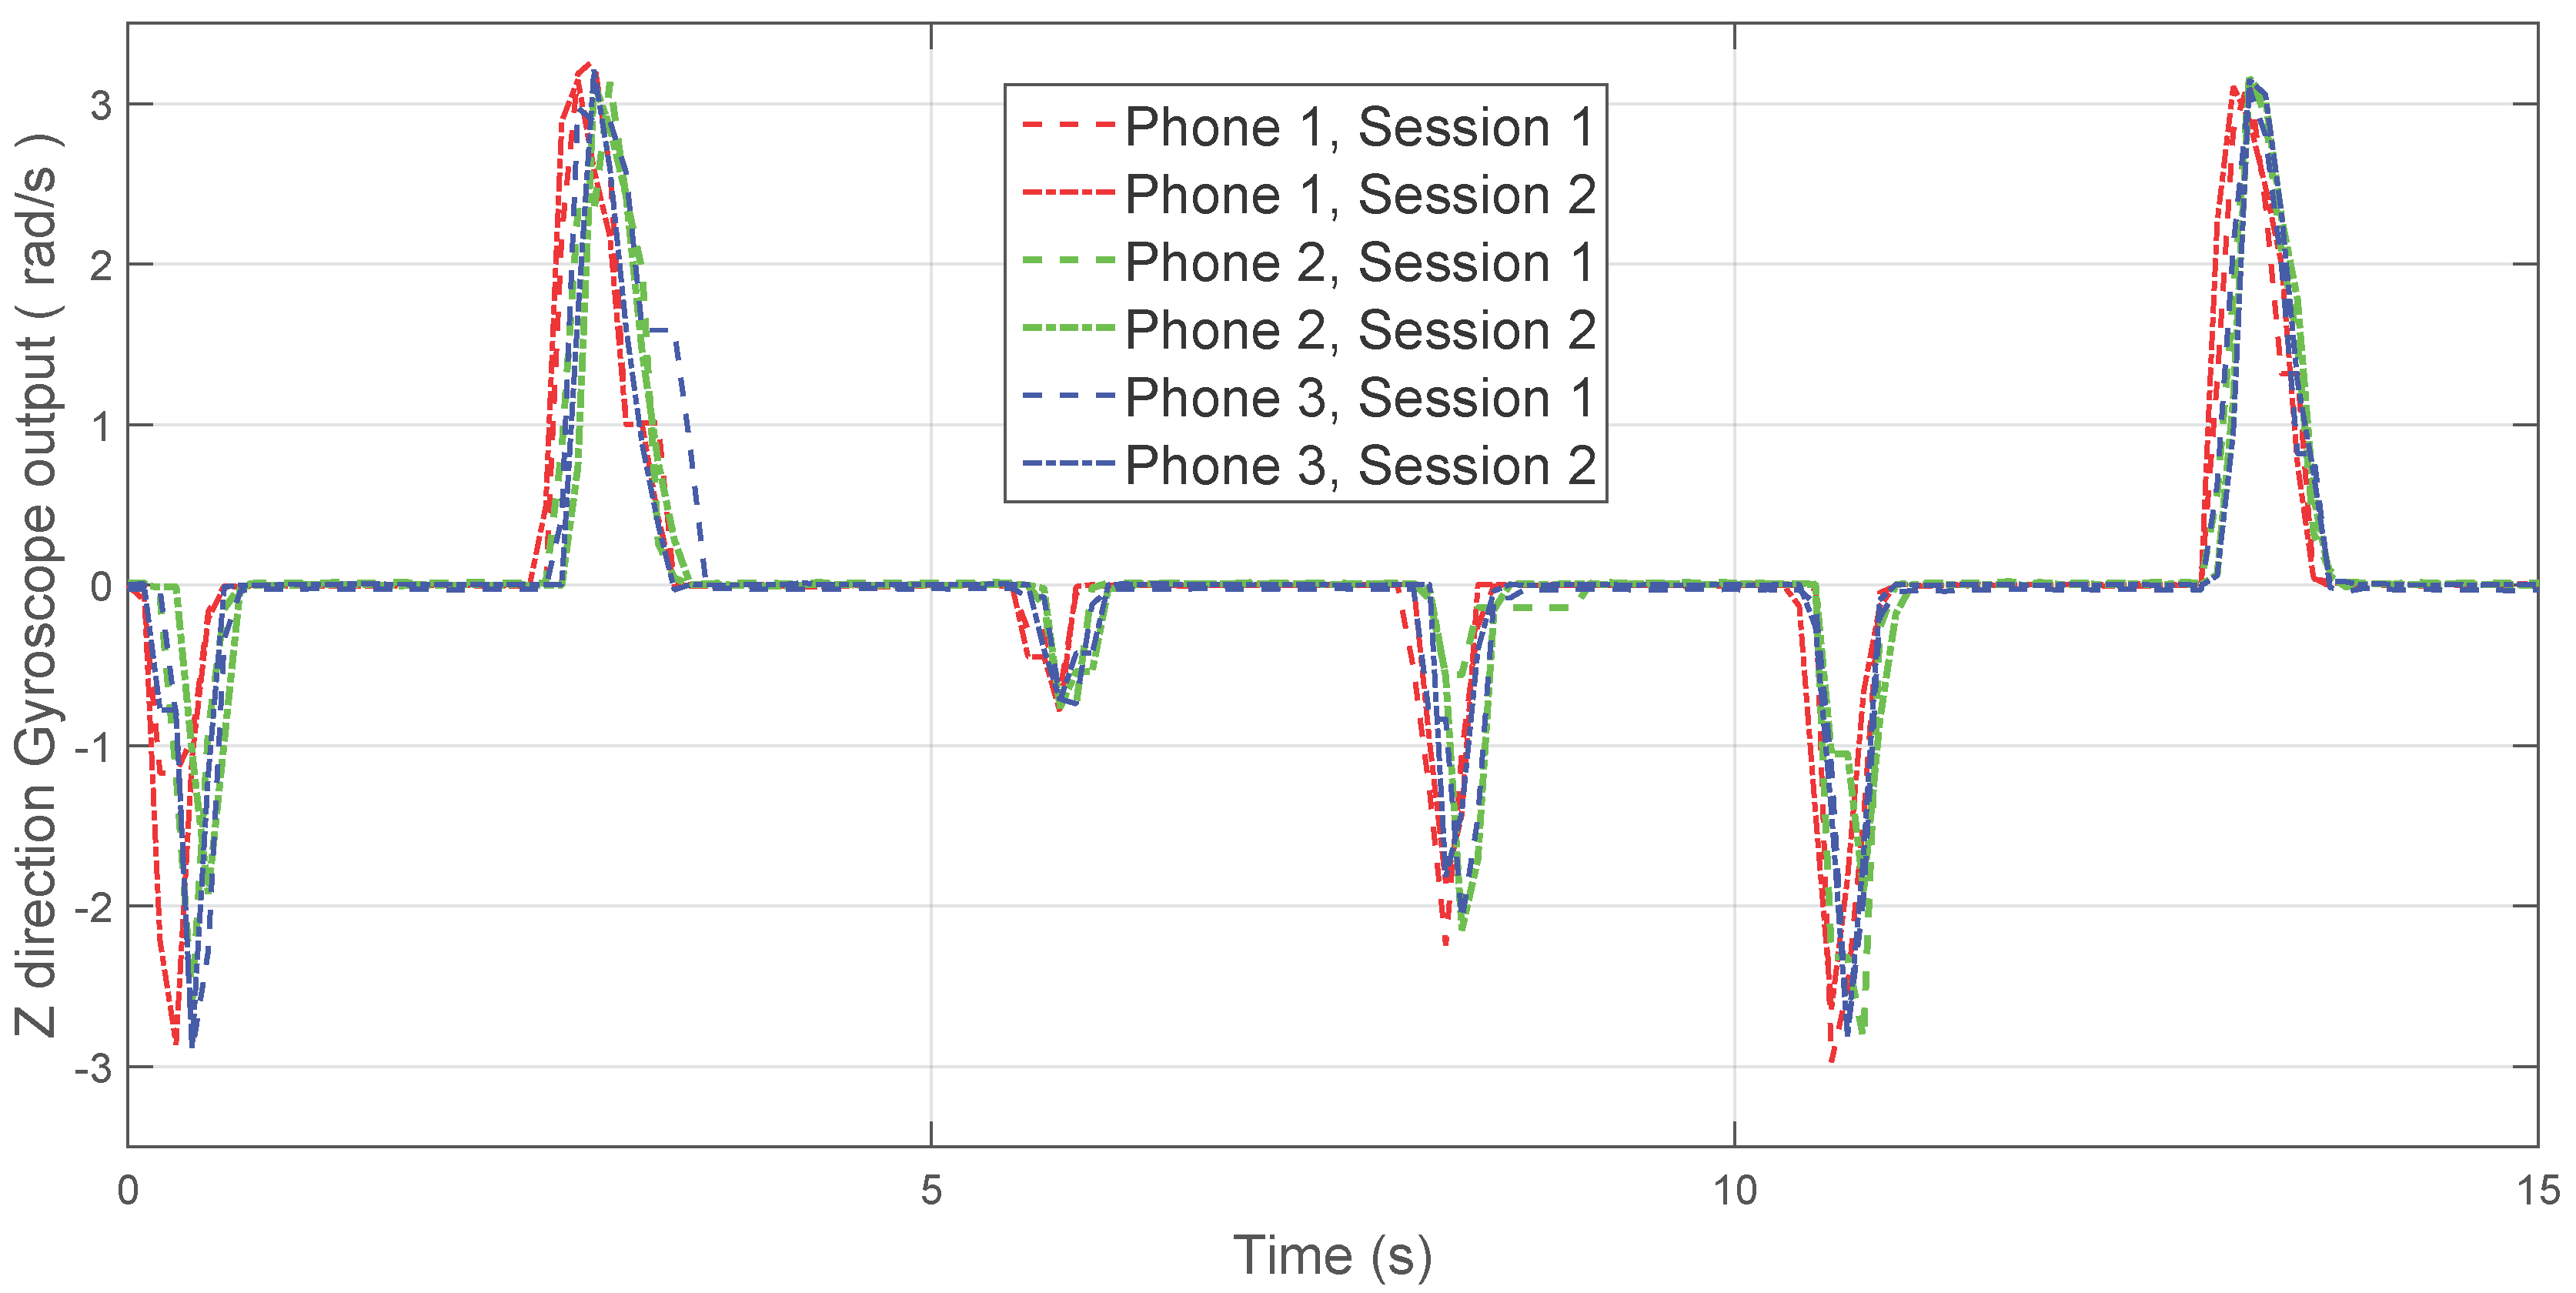
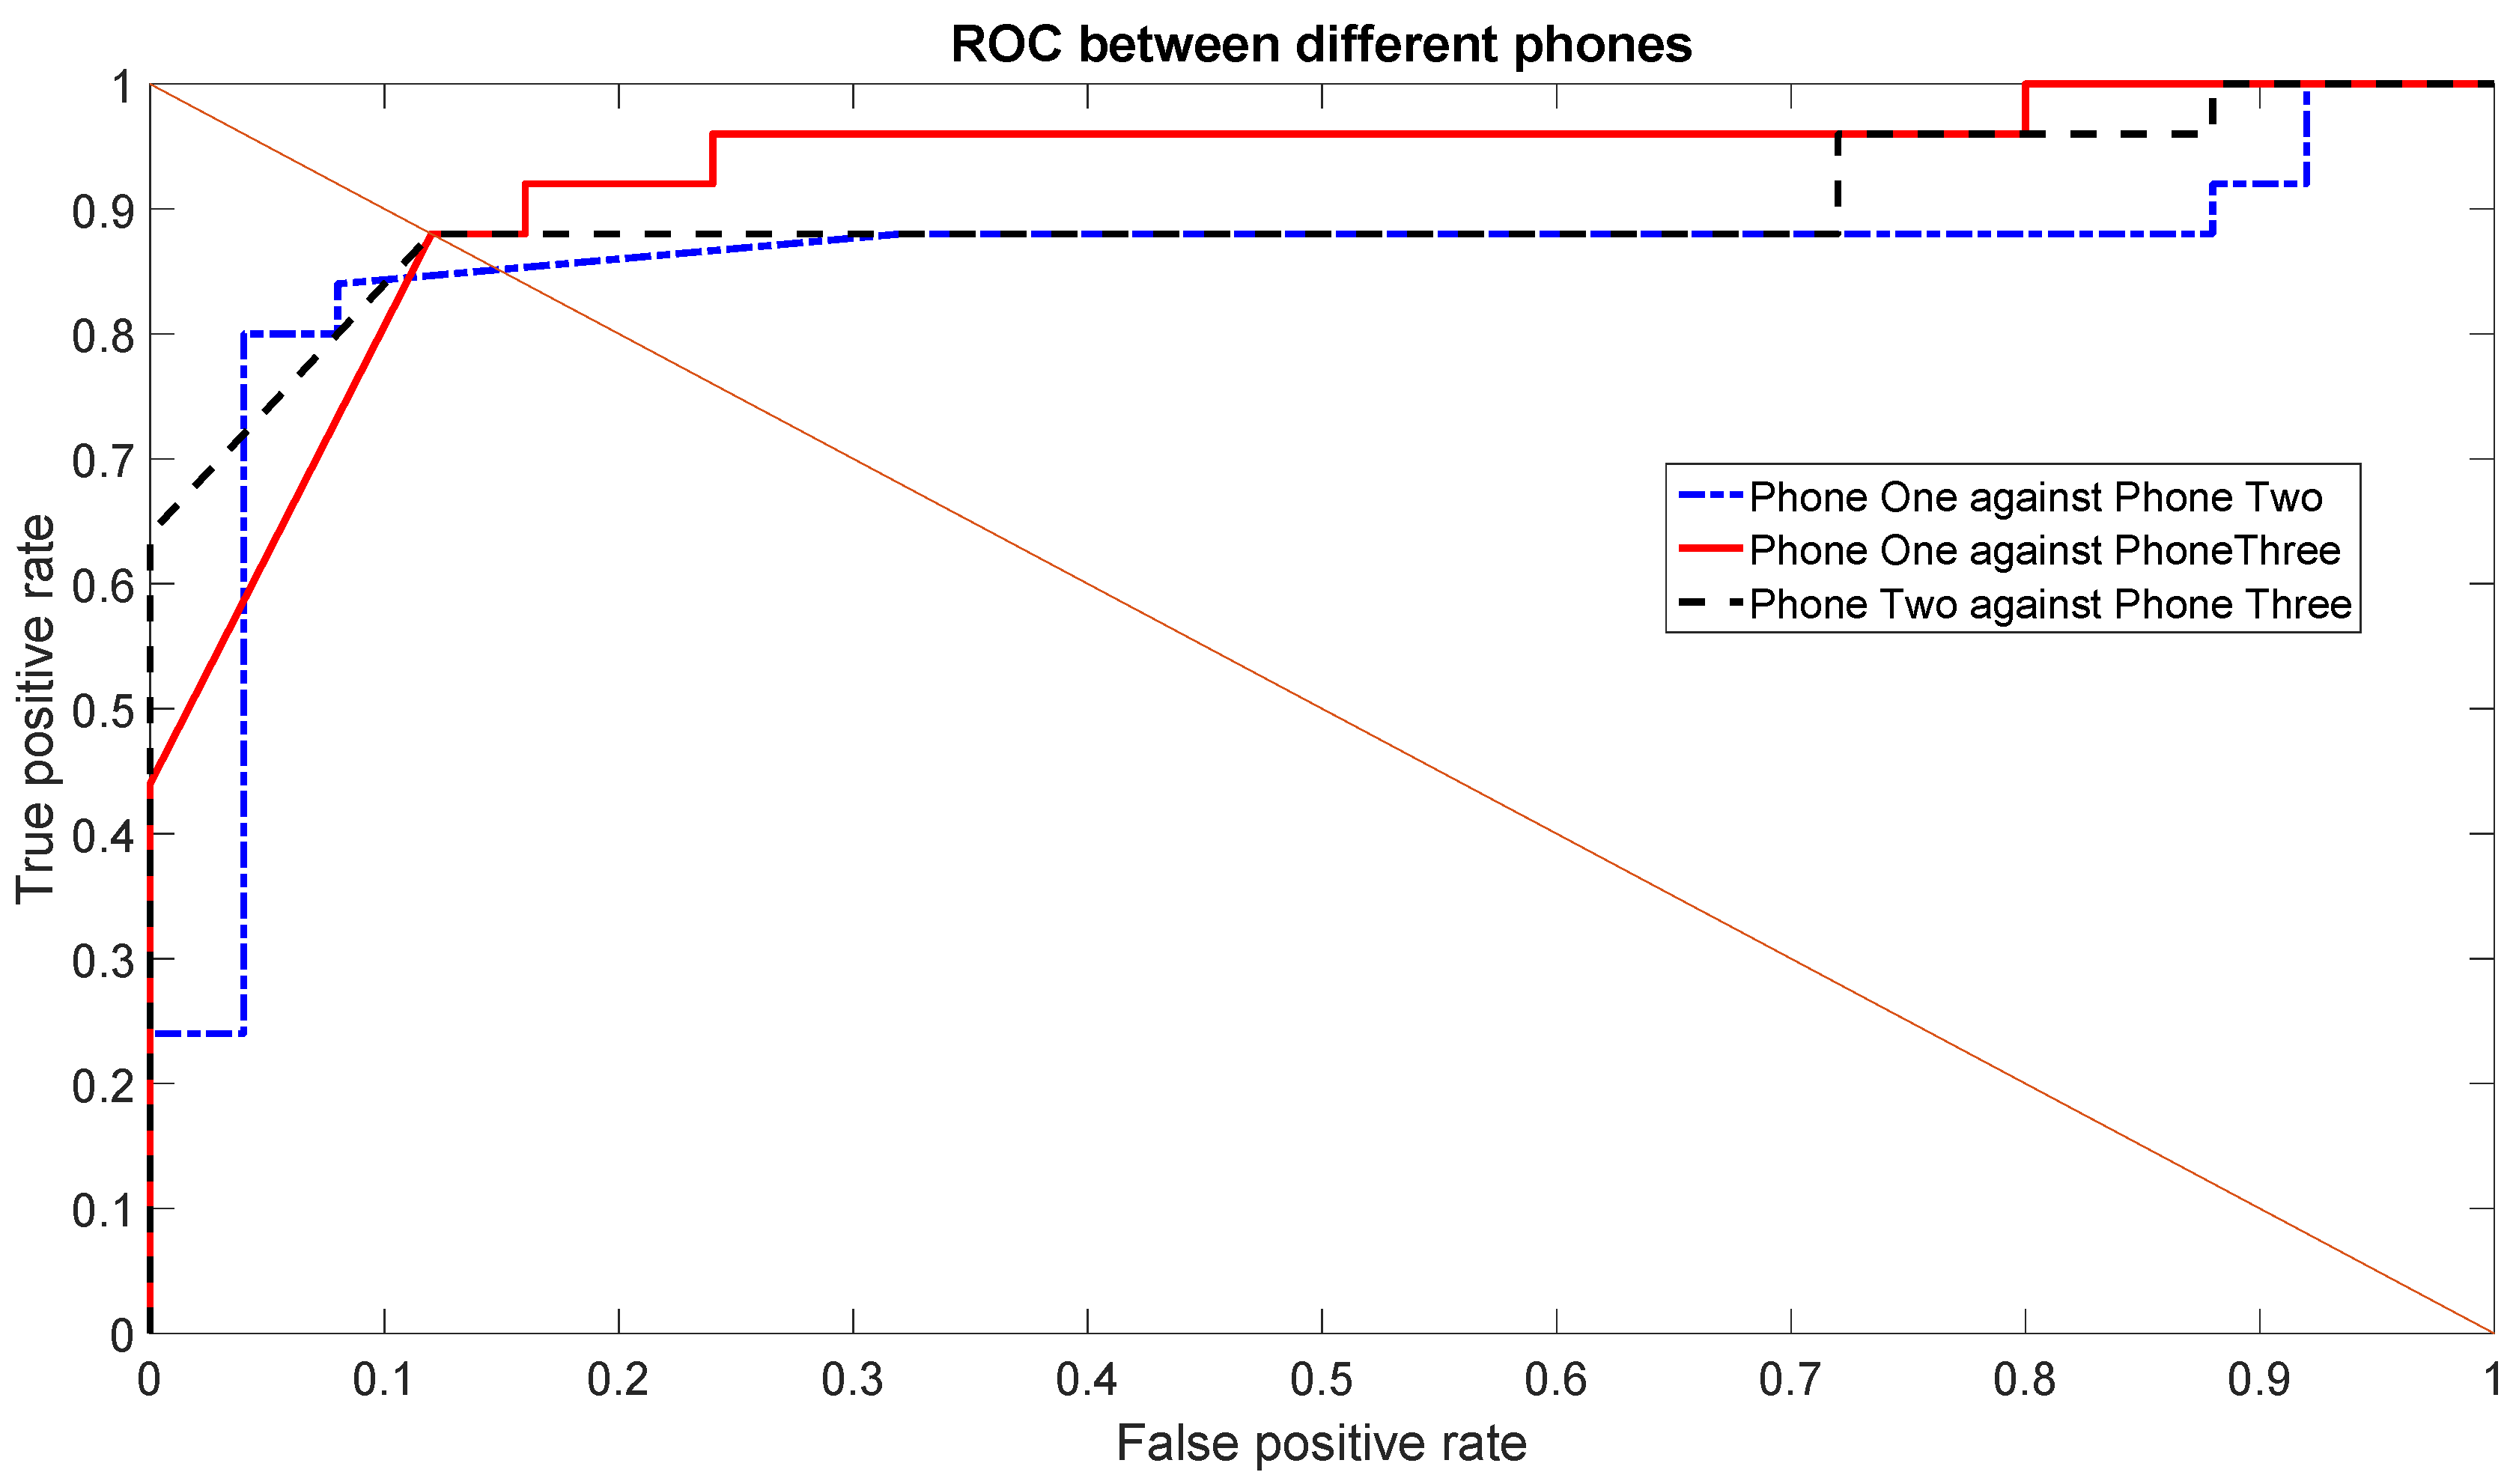
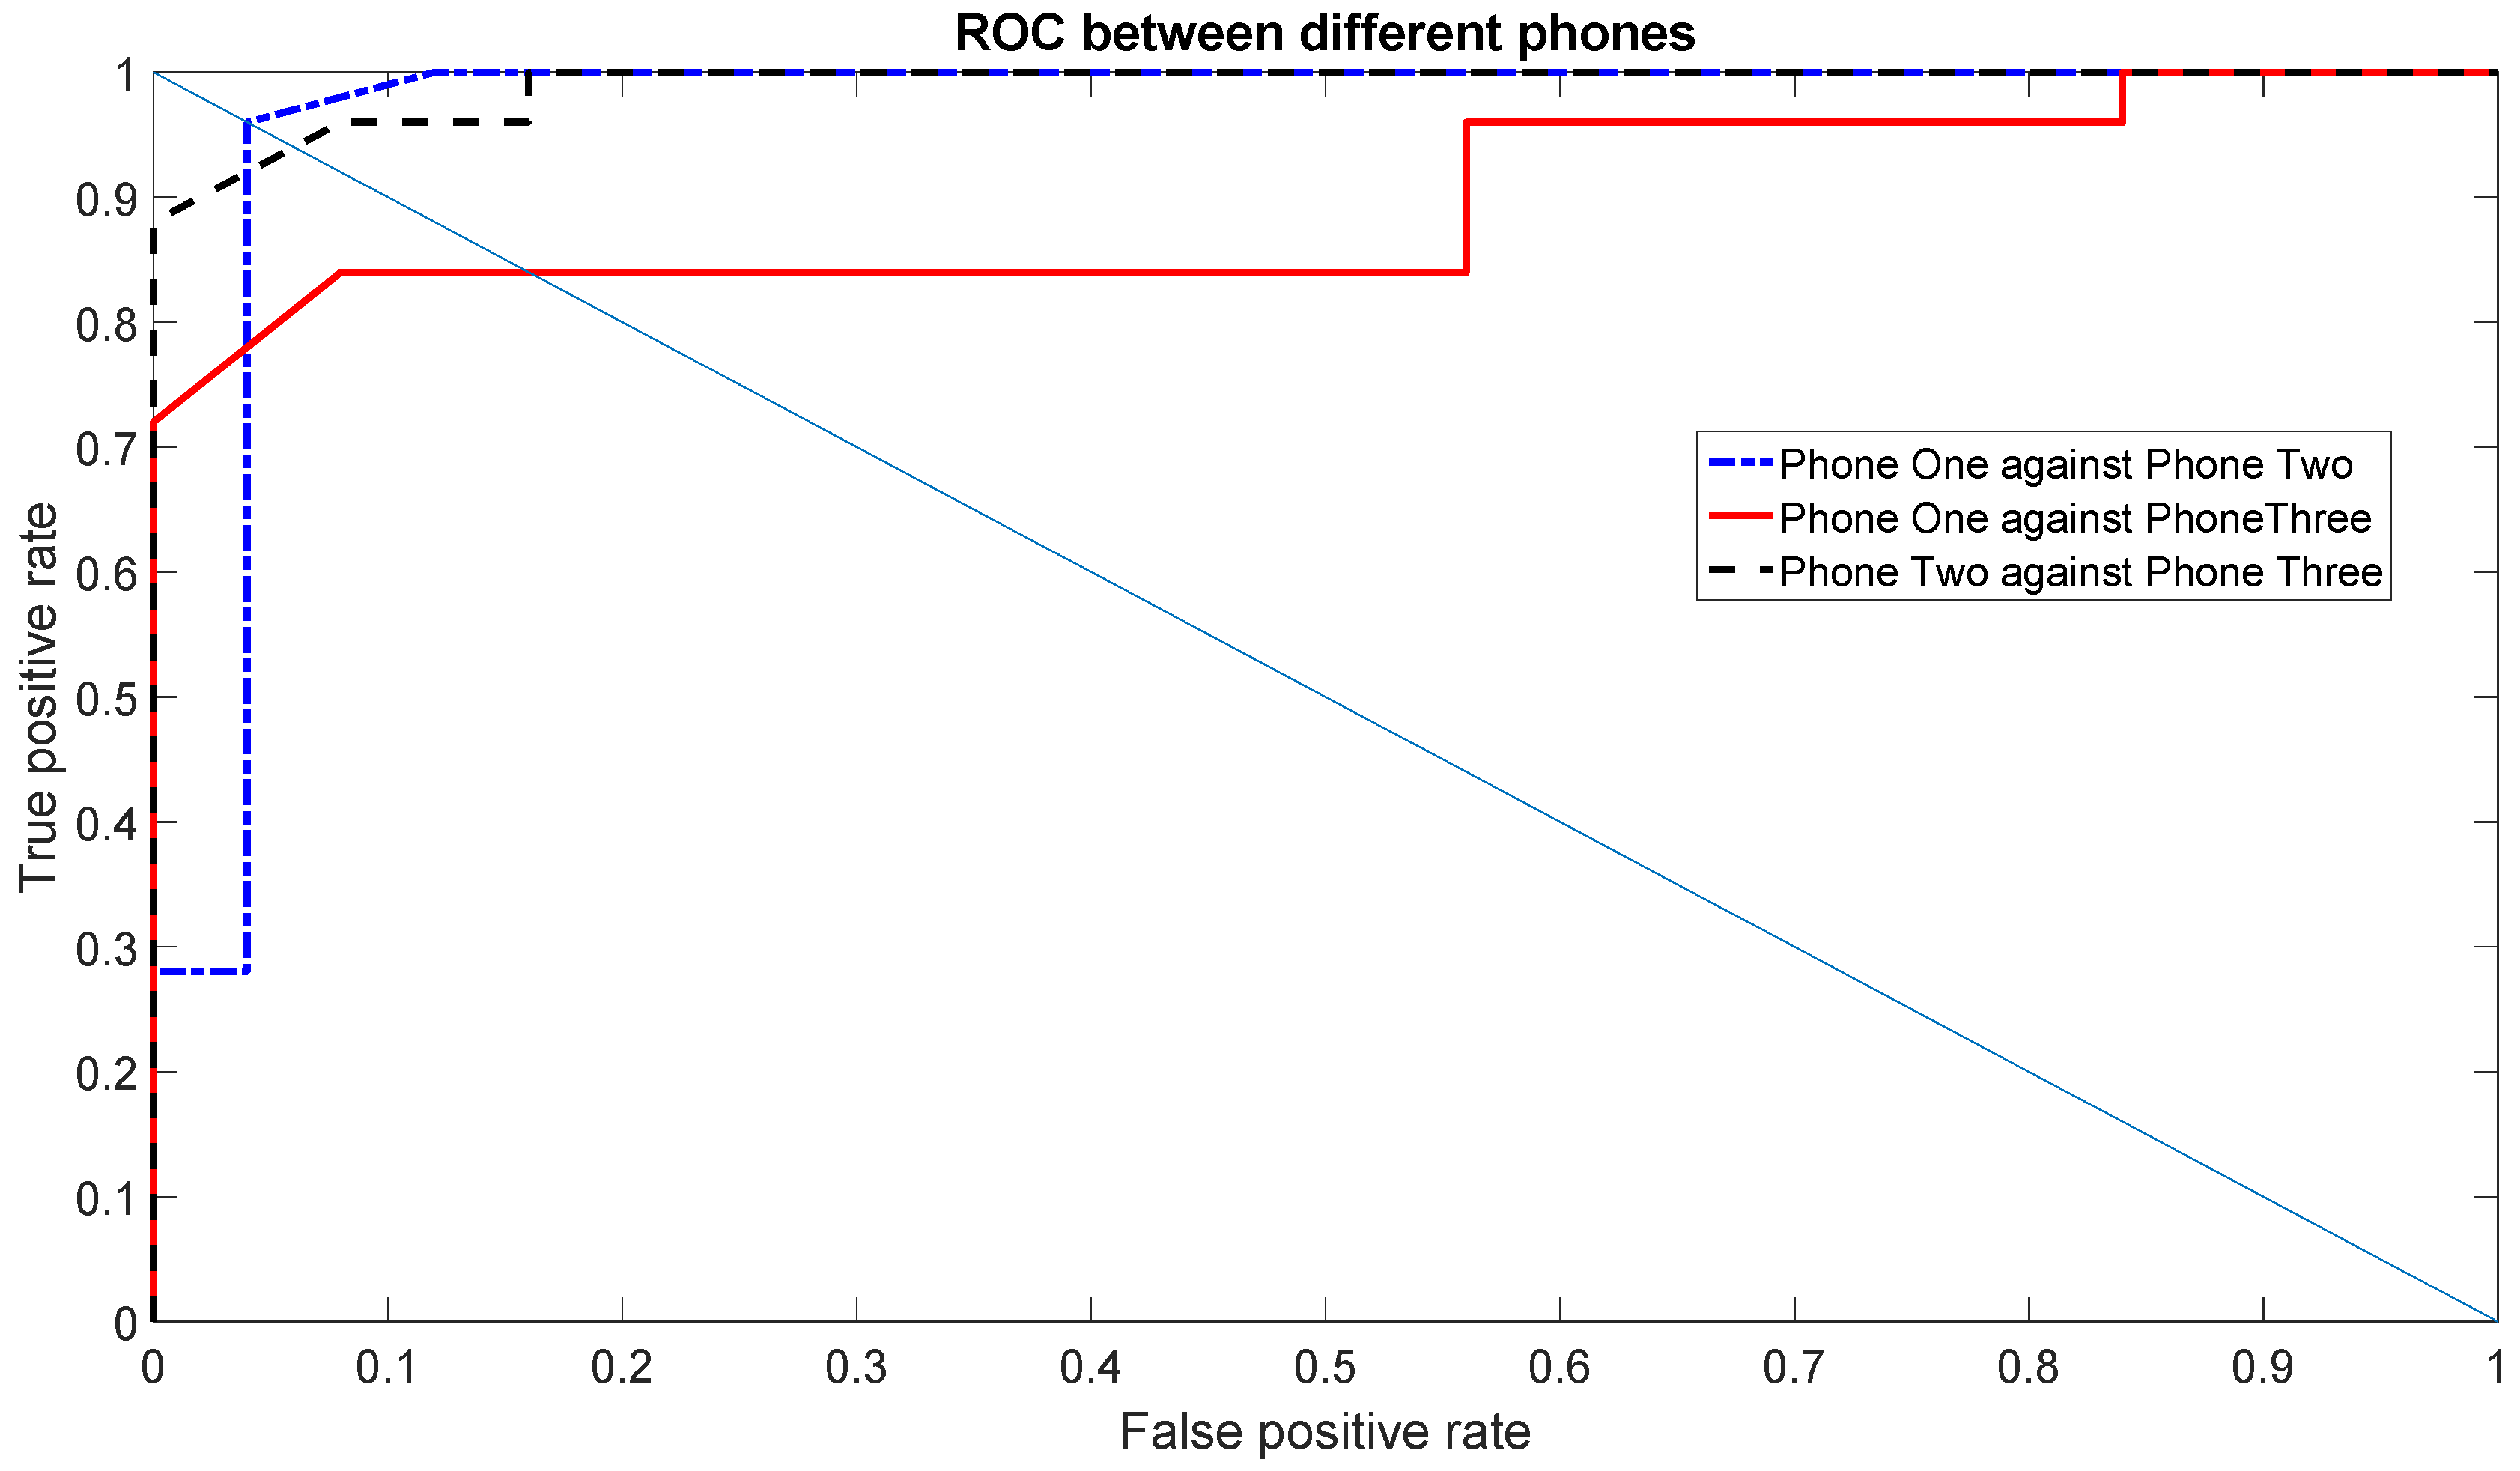
4.4. Analysis of MEMS Components
5. Conclusions
Supplementary Materials
Acknowledgments
Author Contributions
Conflicts of Interest
Abbreviations
| EER | Equal Error Rate |
| IC | Integrated Circuit |
| KKT | Karush–Kuhn–Tucker |
| MEMS | Micro Electro-Mechanical Systems |
| MLP | Multilayer Perceptron |
| PKI | Public Key Infrastructure |
| RBF | Radial Basis Function |
| RF | Radio Frequency |
| ROC | Receiver Operating Characteristics |
| SMO | Sequential Minimal Optimization |
| SVM | Support Vector Machine |
References
- Guin, U.; Huang, K.; DiMase, D.; Carulli, J.; Tehranipoor, M.; Makris, Y. Counterfeit Integrated Circuits: A Rising Threat in the Global Semiconductor Supply Chain. IEEE Proc. 2014, 102, 1207–1228. [Google Scholar] [CrossRef]
- Dey, S.; Roy, N.; Xu, W.; Choudhury, R.R.; Nelakuditi, S. AccelPrint: Imperfections of Accelerometers Make Smartphones Trackable. In Proceedings of the 2014 Network and Distributed System Security (NDSS) Symposium, San Diego, CA, USA, 23–26 February 2014.
- Cellular Telephone Industries Association. Device Hardware Reliability Test Plan V1.0, 2015. Available online: http://www.ctia.org/policy-initiatives/certification/certification-test-plansblue (accessed on 18 May 2016).
- Luque, R.; Casilari, E.; Morón, M.J.; Redondo, G. Comparison and Characterization of Android-Based Fall Detection Systems. Sensors 2014, 14, 18543–18574. [Google Scholar] [CrossRef] [PubMed]
- Incel, O.D. Analysis of Movement, Orientation and Rotation-Based Sensing for Phone Placement Recognition. Sensors 2015, 15, 25474–25506. [Google Scholar] [CrossRef] [PubMed]
- Fenu, G.; Steri, G. Two methods for body parameter analysis using Body Sensor Networks. In Proceedings of the International Conference on Ultra Modern Telecommunications Workshops (ICUMT ’09), St. Petersburg, Russia, 12–14 October 2009; pp. 1–5.
- Fenu, G.; Steri, G. IMU based post-traumatic rehabilitation assessment. In Proceedings of the 2010 3rd International Symposium on Applied Sciences in Biomedical and Communication Technologies (ISABEL), Rome, Italy, 7–10 November 2010; pp. 1–5.
- Bojinov, H.; Michalevsky, Y.; Nakibly, G.; Boneh, D. Mobile Device Identification via Sensor Fingerprinting. 2014. [Google Scholar]
- Das, A.; Borisov, N.; Caesar, M. Exploring Ways To Mitigate Sensor-Based Smartphone Fingerprinting. 2015. [Google Scholar]
- Yang, X.C.; Li, J.P.; Mou, J.P. An anti-counterfeiting method based on VCS for mobile phone’s identification. In Proceedings of the 2012 International Conference on Wavelet Active Media Technology and Information Processing (ICWAMTIP), Chengdu, China, 17–19 December 2012; pp. 169–172.
- Lakafosis, V.; Traille, A.; Lee, H.; Gebara, E.; Tentzeris, M.; DeJean, G.; Kirovski, D. RF Fingerprinting Physical Objects for Anticounterfeiting Applications. IEEE Trans. Microw. Theory Tech. 2011, 59, 504–514. [Google Scholar] [CrossRef]
- Suh, G.; Devadas, S. Physical Unclonable Functions for Device Authentication and Secret Key Generation. In Proceedings of the 44th ACM/IEEE Design Automation Conference (DAC ’07), San Diego, CA, USA, 4–8 June 2007; pp. 9–14.
- Kim, J.; Yun, J.M.; Jung, J.; Song, H.; Kim, J.B.; Ihee, H. Anti-counterfeit nanoscale fingerprints based on randomly distributed nanowires. Nanotechnology 2014, 25, 155303. [Google Scholar] [CrossRef] [PubMed]
- Bertoncini, C.; Rudd, K.; Nousain, B.; Hinders, M. Wavelet Fingerprinting of Radio-Frequency Identification (RFID) Tags. IEEE Trans. Ind. Electron. 2012, 59, 4843–4850. [Google Scholar] [CrossRef]
- Cobb, W.E.; Garcia, E.W.; Temple, M.A.; Baldwin, R.O.; Kim, Y.C. Physical layer identification of embedded devices using RF-DNA fingerprinting. In Proceedings of the Military Communications Conference (MILCOM 2010), San Jose, CA, USA, 31 October–3 November 2010; pp. 2168–2173.
- Cristianini, N.; Shawe-Taylor, J. An Introduction to Support Vector Machines and other Kernel-Based Learning Methods; Cambridge University Press: Cambridge, UK, 2000. [Google Scholar]


| MEMS Component | Threshold Entropy | Sure Entropy | Norm Entropy |
|---|---|---|---|
| Accelerometer X | 1.1 | 1.1 | 2.5 |
| Accelerometer Y | 2.0 | 2.0 | 2.6 |
| Accelerometer Z | 1.8 | 1.9 | 1.1 |
| Gyroscope X | 0.1 | 0.1 | 2.7 |
| Gyroscope Y | 0.1 | 0.8 | 2.5 |
| Gyroscope Z | 0.1 | 0.1 | 3.0 |
| Set of Features | Indirect Comparison | Direct Comparison |
|---|---|---|
| [2 5 6 7 8] | 62.65 | 80.24 |
| [1 2 3 5 7] | 58.8 | 76.71 |
| [2 5 6 7 8] | 58.33 | 79.5988 |
| Set of Features | Indirect Comparison | Direct Comparison |
|---|---|---|
| [1 3 5 6 7] | 58.33 | 91.09 |
| [2 3 4 5 6] | 54.32 | 83.95 |
| [3 5 6 7 8] | 57.09 | 90.43 |
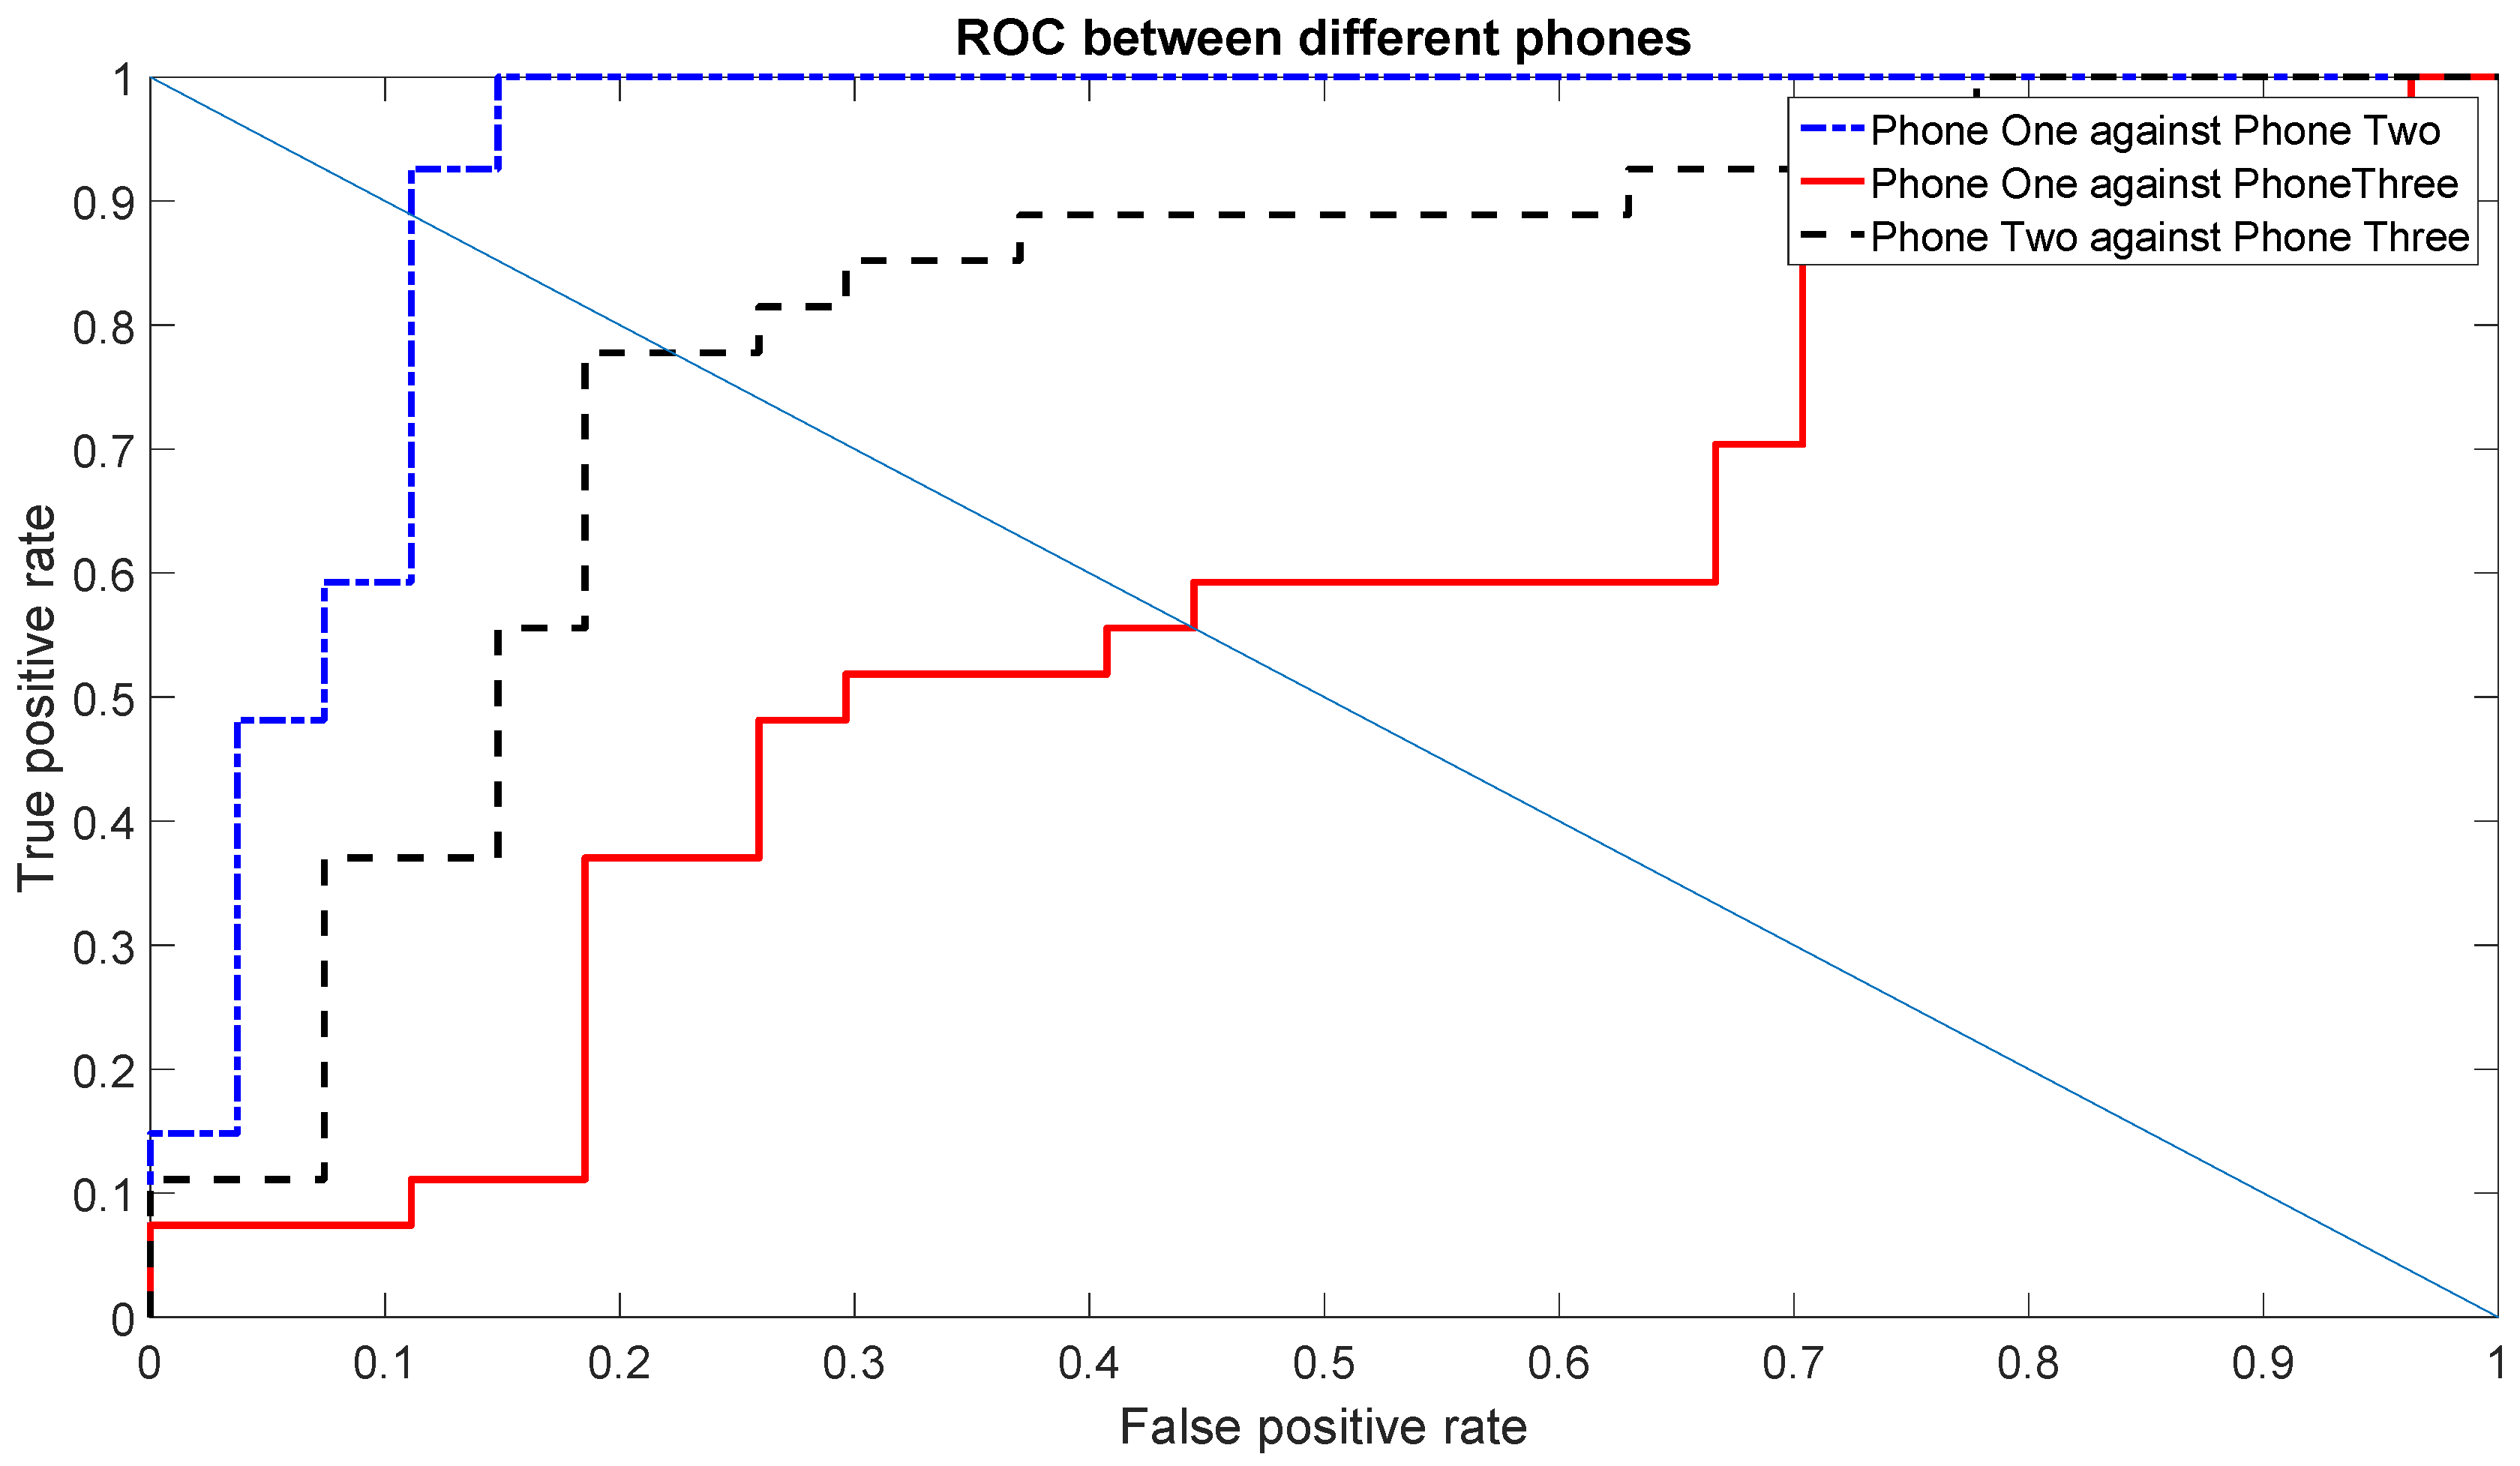
| Equal Error Rate (EER) | Gyroscope X | Gyroscope Y |
|---|---|---|
| Phone One against Phone Two | 0.15 | 0.04 |
| Phone One against Phone Three | 0.12 | 0.17 |
| Phone Two against Phone Three | 0.12 | 0.07 |
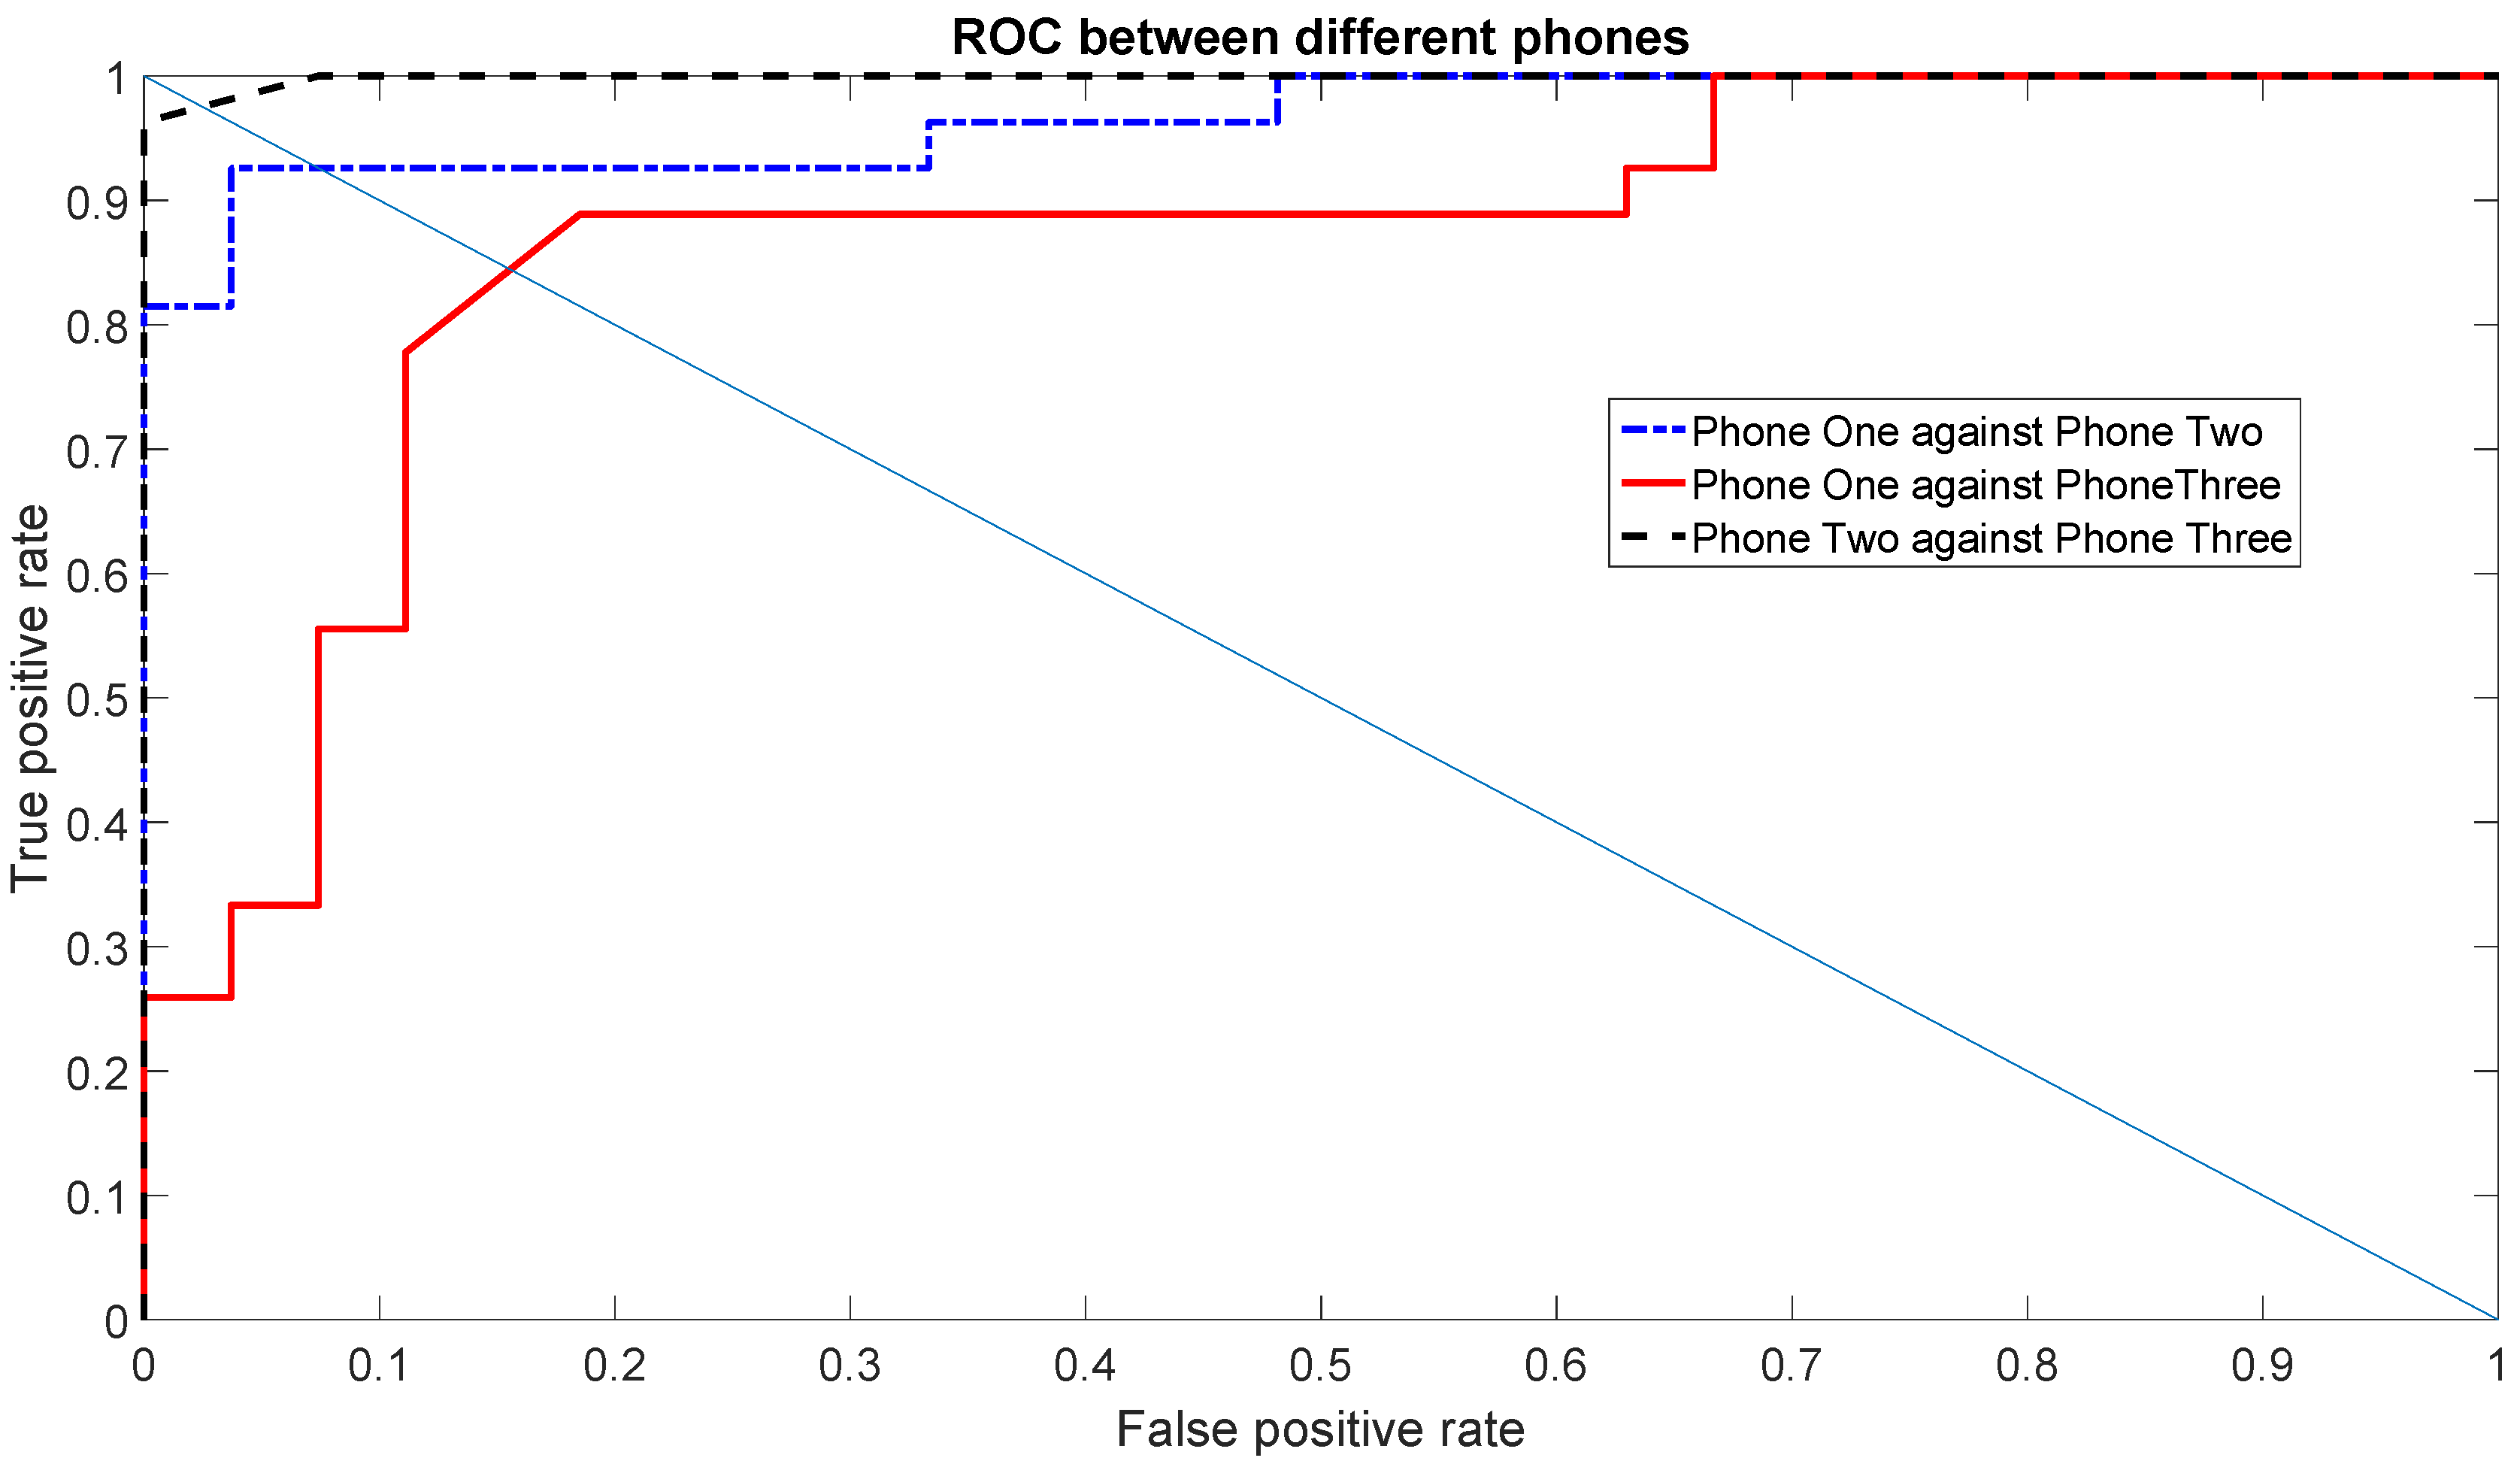
| EER | Gyroscope X | Gyroscope Y |
|---|---|---|
| Phone One against Phone Two | 0.11 | 0.04 |
| Phone One against Phone Three | 0.44 | 0.16 |
| Phone Two against Phone Three | 0.22 | 0.07 |
© 2016 by the authors; licensee MDPI, Basel, Switzerland. This article is an open access article distributed under the terms and conditions of the Creative Commons Attribution (CC-BY) license (http://creativecommons.org/licenses/by/4.0/).
Share and Cite
Baldini, G.; Steri, G.; Dimc, F.; Giuliani, R.; Kamnik, R. Experimental Identification of Smartphones Using Fingerprints of Built-In Micro-Electro Mechanical Systems (MEMS). Sensors 2016, 16, 818. https://doi.org/10.3390/s16060818
Baldini G, Steri G, Dimc F, Giuliani R, Kamnik R. Experimental Identification of Smartphones Using Fingerprints of Built-In Micro-Electro Mechanical Systems (MEMS). Sensors. 2016; 16(6):818. https://doi.org/10.3390/s16060818
Chicago/Turabian StyleBaldini, Gianmarco, Gary Steri, Franc Dimc, Raimondo Giuliani, and Roman Kamnik. 2016. "Experimental Identification of Smartphones Using Fingerprints of Built-In Micro-Electro Mechanical Systems (MEMS)" Sensors 16, no. 6: 818. https://doi.org/10.3390/s16060818