Arrhythmia Evaluation in Wearable ECG Devices
by
 , and
, and
Muammar Sadrawi
1, 
Chien-Hung Lin
2,
Yin-Tsong Lin
2,
Yita Hsieh
2,
Chia-Chun Kuo
2,
Jen Chien Chien
2,
Koichi Haraikawa
2,
Maysam F. Abbod
3 and
and
Jiann-Shing Shieh
1,* 1
Department of Mechanical Engineering and Innovation Center for Big Data and Digital Convergence, Yuan Ze University, Taoyuan, Chung-Li 32003, Taiwan
2
Healthcare and Beauty RD Center, Kinpo Electronics, Inc., New Taipei City 222, Taiwan
3
Department of Electronic and Computer Engineering, Brunel University London, Uxbridge UB8 3PH, UK
*
Author to whom correspondence should be addressed.
Sensors 2017, 17(11), 2445; https://doi.org/10.3390/s17112445
Submission received: 19 September 2017
/
Revised: 20 October 2017
/
Accepted: 21 October 2017
/
Published: 25 October 2017
(This article belongs to the Special Issue Biomedical Sensors and Systems 2017)
Abstract
:This study evaluates four databases from PhysioNet: The American Heart Association database (AHADB), Creighton University Ventricular Tachyarrhythmia database (CUDB), MIT-BIH Arrhythmia database (MITDB), and MIT-BIH Noise Stress Test database (NSTDB). The ANSI/AAMI EC57:2012 is used for the evaluation of the algorithms for the supraventricular ectopic beat (SVEB), ventricular ectopic beat (VEB), atrial fibrillation (AF), and ventricular fibrillation (VF) via the evaluation of the sensitivity, positive predictivity and false positive rate. Sample entropy, fast Fourier transform (FFT), and multilayer perceptron neural network with backpropagation training algorithm are selected for the integrated detection algorithms. For this study, the result for SVEB has some improvements compared to a previous study that also utilized ANSI/AAMI EC57. In further, VEB sensitivity and positive predictivity gross evaluations have greater than 80%, except for the positive predictivity of the NSTDB database. For AF gross evaluation of MITDB database, the results show very good classification, excluding the episode sensitivity. In advanced, for VF gross evaluation, the episode sensitivity and positive predictivity for the AHADB, MITDB, and CUDB, have greater than 80%, except for MITDB episode positive predictivity, which is 75%. The achieved results show that the proposed integrated SVEB, VEB, AF, and VF detection algorithm has an accurate classification according to ANSI/AAMI EC57:2012. In conclusion, the proposed integrated detection algorithm can achieve good accuracy in comparison with other previous studies. Furthermore, more advanced algorithms and hardware devices should be performed in future for arrhythmia detection and evaluation.
1. Introduction
Nowadays, wearable sensor-based system has been applied to wide applications. Fall and activity monitoring study with utilizing wearable sensor has been conducted by Shany et al. [1]. This kind of system was also used for Parkinson’s disease with the combination of Support Vector Machine (SVM) by a study conducted by Patel et al. [2]. Meanwhile, Corbishley et al. used non-invasive and continuous wearable system for breathing monitoring [3]. Furthermore, wearable electrocardiogram (ECG) device was also utilized for the emotion classifications via hear rate variability [4].
Recently, the implementation of intensively evaluated ECG signal through wearable sensor is one of the essential issues for the cardiovascular-related diseases. For example, arrhythmia has been one of the concerning cardiac diseases. Some of the arrhythmia cases are classified as life-threatening events. Therefore, Rosenberg et al. utilized long-term monitoring system for atrial fibrillation monitoring [5]. A study by Baig et al. evaluated wearable ECG system for older-adult population [6]. Furthermore, Fensli et al. utilized wearable sensor for arrhythmia detection applied to tele-home care system via general packet radio service (GPRS) to personal computer as base station. This information will be evaluated by doctors with remote system for the rhythm evaluation by the internet connection server [7]. Lin et al. developed an intelligent telecardiology system for sinus tachycardia, sinus bradycardia, wide QRS complex, atrial fibrillation, and cardiac asystole [8]. This system can also activate emergency alarm. In advanced, Hu et al. had successfully applied hidden Markov model to using wearable system for ECG arrhythmia evaluation [9]. Meanwhile, recent study by Hadiyoso et al. also conducted a study on arrhythmia detection via smart phone [10].
Atrial fibrillation (AF) and ventricular fibrillation (VF) are frequent arrhythmias. The former, AF, is one of the arrhythmias related to age and has serious effect on morbidity, mortality, and cost [11]. AF also is an independent factor and has significant effect on the risk of stroke by a study conducted by Wolf et al. on five thousand cases both female and male for more than thirty years [12]. Kara et al. utilized power spectral density and Daubechies wavelets with backpropagation artificial neural network (ANN) for AF detection [13]. Roonizi et al. used extended Kalman filter to evaluate AF frequency [14]. A study by Mohebbi et al. investigated AF by applying the feature dimension reduction technique with SVM classifier [15]. Abdul-Kadir et al. used dynamic ECG system according to second order differential equation of ECG behavior with cross validation technique by utilizing SVM and ANN as predictors [16]. Recently, Rajpurkar et al. have utilized one of the deep learning techniques, namely a 34-layer convolutional neural network for detecting arrhythmia, including AF [17].
Another arrhythmia is VF. According to McWilliam, VF has strong correlation with sudden cardiac diseases [18] and it is critical to defibrillation [19]. Alonso-Atienza et al. have applied bootstrap resampling-based feature extraction SVM classifier for VF detection [20]. A study by Anas et al. describes how empirical mode decomposition method is used to discriminate VF and non-VF rhythms [21].
Atrial premature complex (APC) and ventricular premature complex (VPC) are other frequent arrhythmias that, according to the ANSI/AAMI EC57:2012, can be classified as supraventricular ectopic beat (SVEB) and ventricular ectopic beat (VEB). Research on detecting these conditions and other arrhythmias have been in several previous studies. Thong et al., have utilized paroxysmal atrial fibrillation for APC calculation [22]. Sayadi et al. have used extended Kalman filter for VPC detection [23]. Similarly, a study by Özbay et al. that evaluated the performance of the neural networks also performed the initialization of fuzzy C-means for APC, VPC, and other ECG arrhythmia [24]. Song et al. utilized support vector machine with the combination of dimensionality reduction using principal component analysis, and linear discriminant analysis for arrhythmia classifier including APC and VPC. They found better result as compared to multilayer perceptron (MLP) and fuzzy inference system [25].
However, these previous studies are relatively computationally complex to be applied to wearable devices. Several studies, which are relatively less computational complexity, performed well for AF and VF detection. For AF detection, Zhou et al. proposed a powerful algorithm for real time detection of AF. This study evaluated the heart rate to create a symbolic and word sequences. In advanced, Shannon entropy was utilized to evaluate the word sequence in order to classify AF [26]. On the other hand, FFT algorithm has been a robust algorithm for signal detection algorithm in recent studies [27,28,29,30] and has been effectively applied for VF detection for decades. For VF, Clayton et al. evaluated signal spectrum by utilizing fast Fourier transform (FFT) and maximum entropy for VF detection [31]. Afonso et al. applied short time Fourier transform (STFT), smoothed pseudo Wigner-Ville distribution and cone-shaped kernel for the VF evaluation [32]. Recently, wearable sensor-based system has been widely applied and utilized, the chance of the real-time evaluation for the arrhythmia detection with the less-complicated algorithms is highly likely an acceptable investigation. Hence, the main purpose of this study is to efficiently apply less complexity algorithms for real-time detection of arrhythmias utilizing wearable devices based on ANSI/AAMI EC57:2012 evaluation.
2. Materials and Methods
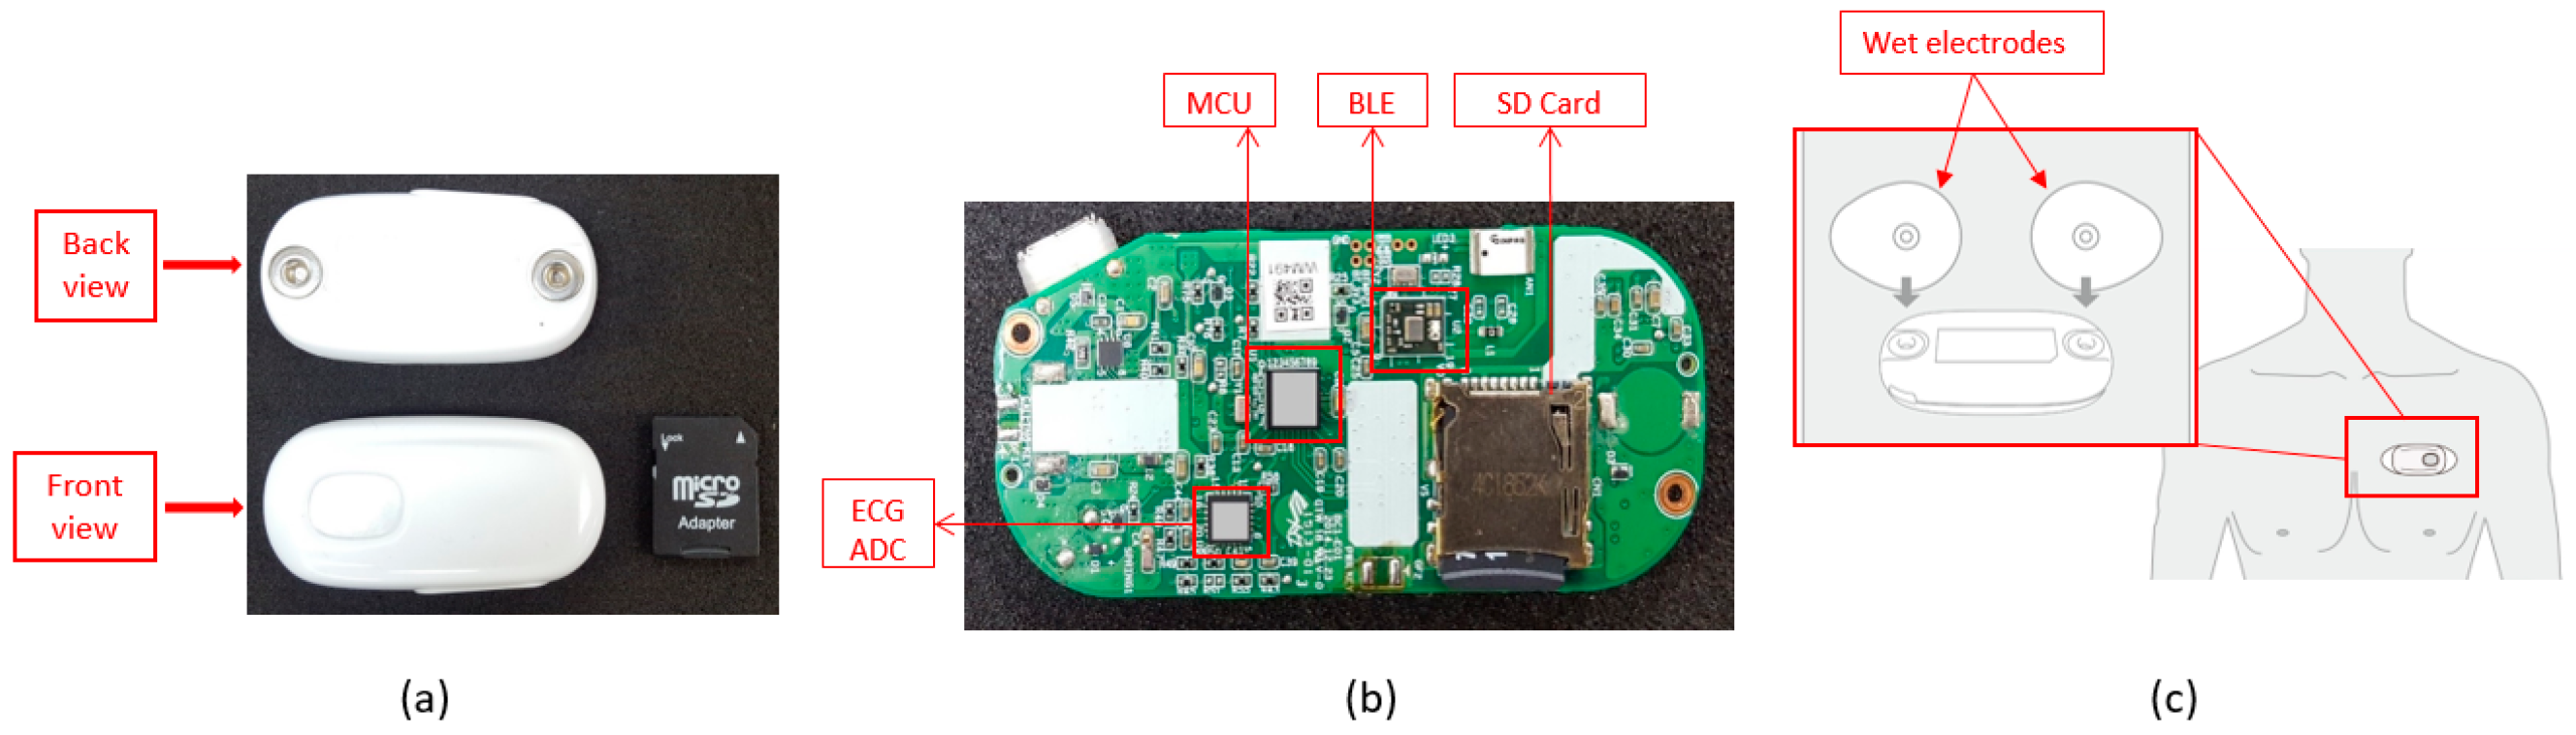
For the hardware part, BC1 ECG device (Bio Clothing One, XYZ life BC1, Kinpo Inc., Taipei, Taiwan) single lead heart rate monitor front end is ADI ADS 8232 (Analog Devices, Inc., Norwood, MA, USA). The BC1 ECG device uses wet electrode. The detail of the BC1 ECG device is shown in Figure 1. Meanwhile, its specification is shown in Table 1. This device is configured by 0.5 Hz two-pole high-pass filter and two-pole 40 Hz for the low-pass filter [33]. For the micro controller unit (MCU), Texas Instruments MSP430 series is selected to have an ultra-low power unit that has 128 KB flash ROM and 8 kB SRAM. This unit is a 16-bit reduced instruction set computer (RISC) architecture of up to 25 MHz system clock with 12-bit analog-to-digital converter (ADC). In further, the Bluetooth low energy (BLE) using Texas Instruments CC25 series (Texas Instruments Incorporated, Dallas, 75243 TX, USA) connection system is utilized to have a power-optimized system-on-chip (SOC) solution that supports maximum 2 Mbps data rates. The small start button powers the device on. The device will detect the connection of the Bluetooth, which will either associate the smartphone or not. When there is no Bluetooth device connection, the device will be turned to off-line state allowing the data to be stored only in the SD card. Meanwhile, the on-line evaluation will send real-time ECG data to the smartphone application for the arrhythmia classification.
This study uses PhysioNet database [34] for algorithm development and testing. Furthermore, simulator data from Fluke ProSim 8 vital sign patient monitor simulator (Fluke Biomedical Division of Fluke Electronics Corporation, Everett, 98203 WA, USA) is conducted for real-time detection. The four databases provided by PhysioNet are American Heart Association database (AHADB), Creighton University Ventricular Tachyarrhythmia database (CUDB) [34,35], MIT-BIH Arrhythmia database (MITDB) [34,36], and MIT-BIH Noise Stress Test database (NSTDB) [34,37]. For SVEB (i.e., APC) classification, 44 records for MITDB is analyzed. Meanwhile for VEB (i.e., VPC) detection, 78 records for AHADB, 44 records for MITDB, and 12 records for NSTDB are used in the evaluation. For AF detection, 44 records for MITDB are utilized for the evaluation. Furthermore, 78 records for AHADB, 44 records for MITDB, and 35 records for CUDB are used for VF classification. Evaluation of sensitivity (Se), positive predictivity (+P), and false positive rate (FPR) are defined for the evaluation performance of SVEB (i.e., APC) and VEB (i.e., VPC). Meanwhile, episode sensitivity (ESe), episode positive predictivity (E + P), duration sensitivity (DSe), and duration positive predictivity (D + P) are utilized for AF and VF detections. All of the evaluations are performed according to ANSI/AAMI EC57:2012 [38].
For simulation and visualization in smartphone for real-time application, Fluke ProSim 8 is also utilized. Simulation data includes several ECG rhythms: normal sinus rhythm, APC, VPC, AF, and VF signals in real-time situation and evaluation on the smartphone. Initially, simulation data from Fluke simulator is transferred to BC1. Programming of the arrhythmia algorithm is conducted in Java (Android) and Objective-C (iOS). The performance of this algorithm is evaluated by WFDB (WaveForm DataBase) software on Windows acquired from PhysioNet.
The integrated evaluation is started by evaluating the APC, VPC, AF, and VF based on ANSI/AAMI EC57:2012, as shown in Figure 2. Originally, the data downloaded from PhysioNet [34,35,36,37] is downsampled to 200 Hz. Initially the 5-min ECG signal is evaluated either based on the beat, for VPC, AF, and APC evaluations or the raw ECG signal, the 2-s window, for VF detection.
VPC evaluation is initiated by the R-R interval evaluation. The evaluation is calculated based-on the study by Hamilton et al. [39]. Another study by Hamilton [40] is utilized for VPC evaluation, as shown on Figure 2A. For AF calculation, the previous evaluation of VPC beat is essentially important. The abnormal beats (i.e., VPC beats) will imitate the R-R interval in the normal rhythm. This phenomenon highly likely increases the uncertainty in classifying either normal or AF rhythm. Previous classification results for detecting VPC will be utilized to reform the original R-R interval by averaging the previous beat and the next beat. The AF evaluation is originally calculated based on Zhou et al. study [26]. The heart rate is calculated from the original R-R interval. This heart rate is converted to symbolic sequence using Equation (1). Furthermore, this symbolic sequence is utilized for the word value by Equation (2) as shown by the following:
where is the heart rate, is the symbolic sequence, and is the word value. This word value sequence evaluation, originally calculated using Shannon entropy, is replaced by sample entropy algorithm [41]. AF evaluation can be seen in Figure 2B.
For APC detection, the morphological ECG is utilized for feature extraction and artificial neural networks. Multi-layer perceptron with backpropagation training algorithm and single hidden layer is utilized. Features for the ANN input extracted from ECG signal are P-R interval, QRS duration, R-R interval, next R-R interval, average, and standard deviation of R-R interval of 10 beats before and after the current beat, and R-wave amplitude, as shown in Figure 2C and Figure 3, which is based on our previous study [42]. The data is divided into 60% for training, 20% for validation, and 20% for testing.
After R-R interval-based algorithm is performed, the raw ECG signal-based evaluation is calculated. The initial 5-min ECG segment is reshaped to several 2-s ECG signals. This evaluation is organized to avoid mixed rhythms for the classification. The periodogram evaluation is utilized by finding its maximum point corresponding to the frequency of the shortened ECG segments. According to Lo et al., the dominant VF waveform frequency is between 1 Hz and 7 Hz [43]. Our study utilizes a similar range with some offset. Three focused area of maximas are defined. The first one is the VF area (p_vf). This area is located in between the frequency of greater than equals to 2.61 Hz and less than equals to 4.95 Hz. The next area is the first area of non-VF (p_nVF), which is between frequency greater than 0.5 Hz and less than 2.61 Hz. The last area is the second non-VF (p_nVF2), which is located between frequency greater than 4.95 Hz and less than or equals to 10 Hz. The ratio of the p_vf to the summation of the p_nVF and p_nVF2 is defined in order to classify either normal or VF rhythm. The threshold of the ratio is fixed to 3.96. The detailed evaluation of the VF arrhythmia can be seen in Figure 2D.
3. Results
Prior to PhysioNet database evaluation, Fluke simulator data of Normal sinus rhythm, APC, VPC, AF, and VF are utilized from BC1 for algorithm evaluation on smartphone in real-time condition. Besides, visualizing real-time signals with its signal annotation are shown in Figure 4. For APC and VPC, detection is evaluated based-on the R-wave of the ECG signal. Meanwhile, normal sinus rhythm, AF and VF evaluation works based-on a segment. The mobile application is also able to store the documented signal with its signal annotation as the off-line evaluation records that can be seen in Figure 5.
The entire evaluation of arrhythmia can be seen in Table 2 and Table 3. For SVEB (i.e., APC) evaluation utilizing the MITDB database, the performances are 79.87%, 67.14%, and 1.323%, respectively, for the gross evaluation of Se, +P and FPR. Meanwhile for the average evaluation, Se, +P and FPR are 71.35%, 36.9%, and 2.098%, respectively.
The next evaluation is VEB (i.e., VPC). For this evaluation, utilizing a study by Hamilton [38], the gross evaluation from AHADB for Se, +P and FPR are 89.75%, 96.08%, and 0.371%, respectively. For average evaluation, Se, +P and FPR are 86.52%, 84.67%, and 0.458%. For MITDB database, the algorithm performances are 93.10%, 95.65% and 0.321% for gross evaluation of Se, +P, and FPR, respectively. Average evaluation has Se, +P, and FPR by 87.27%, 73.26%, and 0.336%, respectively. The third database for the VEB evaluation utilizes the NSTDB database. The performance for this database for gross evaluation respectively for the Se, +P and FPR are 83.22%, 45.79% and 10.180%. The average evaluation has 58.17%, 50.86% and 9.032% respectively Se, +P and FPR.
The next evaluation is for AF and VF rhythms. AF performance evaluation is calculated using MITDB database. For the gross evaluation, the performances are 62%, 100%, 92%, and 92% for ESe, E + P, DSe, and D + P, respectively. The average evaluations for ESe, E + P, DSe, and D + P, are 70%, 100%, 85%, and 86%.
The next evaluation is VF detection. This evaluation starts using AHADB database. For the gross evaluation, performances are 90%, 95%, 28%, and 97% for ESe, E + P, DSe, and D + P, respectively. Average evaluations for ESe, E + P, DSe, and D + P are 94%, 69%, 33%, and 70%. The second database used for VF evaluation is MITDB database. The gross evaluations are 100%, 75%, 69%, and 88% for ESe, E + P, DSe, and D + P, respectively. For average evaluation, it is 100%, 33%, 69%, and 33% for ESe, E + P, DSe, and D + P, respectively. The last database utilized for VF evaluation is CUDB. For this database, the gross evaluations are 83%, 90%, 32%, and 94% for ESe, E + P, DSe, and D + P, respectively. Meanwhile, for average evaluation it is 84%, 83%, 40%, and 84%, for ESe, E + P, DSe, and D + P, respectively.
4. Discussion
This study evaluates several arrhythmias, SVEB (i.e., APC), VEB (i.e., VPC), AF, and VF, based-on ANSI/AAMI EC57:2012 of totally 169 records from three PhysioNet databases with applying less computationally complicated algorithms. The performances of the algorithms are evaluated based-on the sensitivity, positive predictivity, and false positive rate. The applied methods utilized in this study are relatively less complex; namely sample entropy, FFT, and the ANN. For ANN, the features extracted from ECG signal are also acceptable in the feedforward run. This condition has purposed to minimize the computational time, while performing testing in the real-time application.
In order to study the measurement evaluation of previous studies conducted based-on ANSI/AAMI EC57, the results are compared to our results as shown on Table 4 for SVEB and VEB results. For SVEB and VEB, a study conducted by De Chazal et al. [44] is investigated. This study showed that SVEB evaluation produced gross evaluation of Se, +P and FPR as 75.9%, 38.5%, and 4.7%, respectively. For comparison purposes, we found that our study has better performances with respect to gross evaluation of Se, +P and FPR, which are 79.87%, 67.14%, and 1.323%, respectively. For VEB classification, De Chazal et al. [44] has gross evaluation of Se, +P and FPR are 77.7%, 81.9%, and 1.2%. Meanwhile, with utilizing a study by Hamilton [40], our results also showed better achievement by producing 93.1%, 95.65%, and 0.321%, respectively, for gross evaluation of Se, +P and FPR.
For AF study, results are compared with a previous study conducted by Young et al. [45]. This study performed hidden Markov model (HMM) evaluation using ANSI/AAMI:EC57 for evaluation. Twelve MIT-BIH Arrhythmia database records were utilized for training. Furthermore, for testing data, MIT-BIH AF database was used. In order to perform a comparison to this study, only training results from Young et al. study are investigated. From the results of Young et al. study, a sensitivity evaluation provides a better result of 97.7% as compared to this study evaluating 44 MIT-BIH Arrhythmia database records for ESe that has 62%, and DSe that has 92% for gross statistics evaluations. However, this study produces better results for both E + P that has 100%, and D + P that has 92% for gross statistics evaluations in comparison to their study, which resulted in 86.77% for the positive predictivity.
For a VF comparison study, studies by Park et al. [46] and Moraes et al. [47] are utilized. A study by Park et al. evaluated AHADB and MIT-BIH arrhythmia databases by applying decision rule-based algorithm and utilizing ANSI/AAMI:EC57. This study has evaluated the duration sensitivity and duration positive predictivity. For AHADB evaluations, a study by Park et al., utilized 11 records from AHADB, have 98.1% and 99.1%, respectively, for the DSe and D + P results. Meanwhile, our study, evaluating 78 records from AHADB, for DSe and D + P produces 28% and 97%, respectively for gross statistics evaluations. Furthermore, for MIT-BIH arrhythmia database evaluation, a study by Park et al., evaluated only record 207, has 88.5% and 86.3% for DSe and D + P, respectively. Hence, this study, utilizing 44 records, has achieved 69% and 88% for DSe and D + P, respectively.
Another study is performed for the purpose of VF evaluation comparison. Moraes et al. [47] conducted a study by combining two algorithms, VF filter leakage and complexity measure algorithms. This study has also utilized ANSI/AAMI:EC57 for the evaluation of CUDB. The combined algorithm by Moraes et al. study provided sensitivity and positive predictivity evaluations, by utilizing 30 records. For comparison study purposes, our results, utilizing 35 records, have 83% for ESe and 32% for DSe gross statistics evaluations. Meanwhile, a study by Moraes et al. has 70.32% for the sensitivity. In addition, the results of this study have 90% for E + P and 94% for D + P gross statistics evaluations. However, study by Moraes et al. has 94.66% positive predictivity. The overall comparison of the PhysioNet-based database for the AF and VF can be seen by Table 5.
The evaluation of AF evaluation in the wearable ECG device is compared to study by Lin et al. [8]. This study applied the expert system algorithm. A three-lead ECG device with 512 Hz sampling frequency and 12-bit resolution was utilized for 10 normal and 20 AF patients. For the evaluation, the 12-lead ECG system result was investigated by the cardiologists. The sensitivity and the positive predictive performance are 94.56% and 99.39%, respectively. For the comparison, Lin et al. study performed better accuracy than our study. However, our study evaluates the episode and duration separately according to ANSI/AAMI:EC57 for the sensitivity and positive predictivity.
For computational time, a study by Chakroborty et al. is utilized for the comparison [48]. This study proposed a solution for the arrhythmia classifications. The classified arrhythmias are normal, left bundle branch block (LBBB), right bundle branch block (RBBB), PVC, and PAC. The MIT-BIH Arrhythmia database was utilized for the evaluation. This study provided the overall evaluation time is 6875.3 s. For this study in computational time evaluation, the personal computer (PC), and smartphone-based computational time are evaluated. The PC specification is MacBook Air, Intel Core i5, and 1.6 GHz. Meanwhile, the smartphone is iPhone 5S, A7 chip, 64-bit architecture, and 1.3 GHz frequency. The results show that the computational time for the PC-based calculation is about 174.802 s. Luckily, smartphone-based calculation produces 1840.791 s. The evaluation time in PC and smartphone for MIT-BIH Arrhythmia database can be seen in Table 6. On average, the PC-based computational is 3.591 s and the smartphone-based takes 41.836 s. Meanwhile, our proposed study has been shown less computational time, as shown in Table 7. However, this comparison may not be fully acceptable due to the comparison of LBBB and RBBB detections versus with AF and VF evaluations.
There are several limitations of this study. The first comes from the sliding window for detecting AF. In this study evaluation using sample entropy needs a huge number of the R-R interval. This condition makes delay for the evaluation. However, according to Logan et al., the 5-min sliding window is an acceptable wait for AF detection cases [49].
The second one, ideally, the evaluation of AF and VF should be performed at the same time. However, AF evaluation is performed based-on RR interval and VF evaluation, which is based-on raw ECG signal, these conditions will affect one another. For AF, when evaluation follows VF detection using the raw ECG segment, it will be in an RR shortage condition for the evaluation. Meanwhile, for VF, when the evaluation follows the AF detection (i.e., the R-R interval-based calculation), it highly likely mixes some rhythms inside the calculation window.
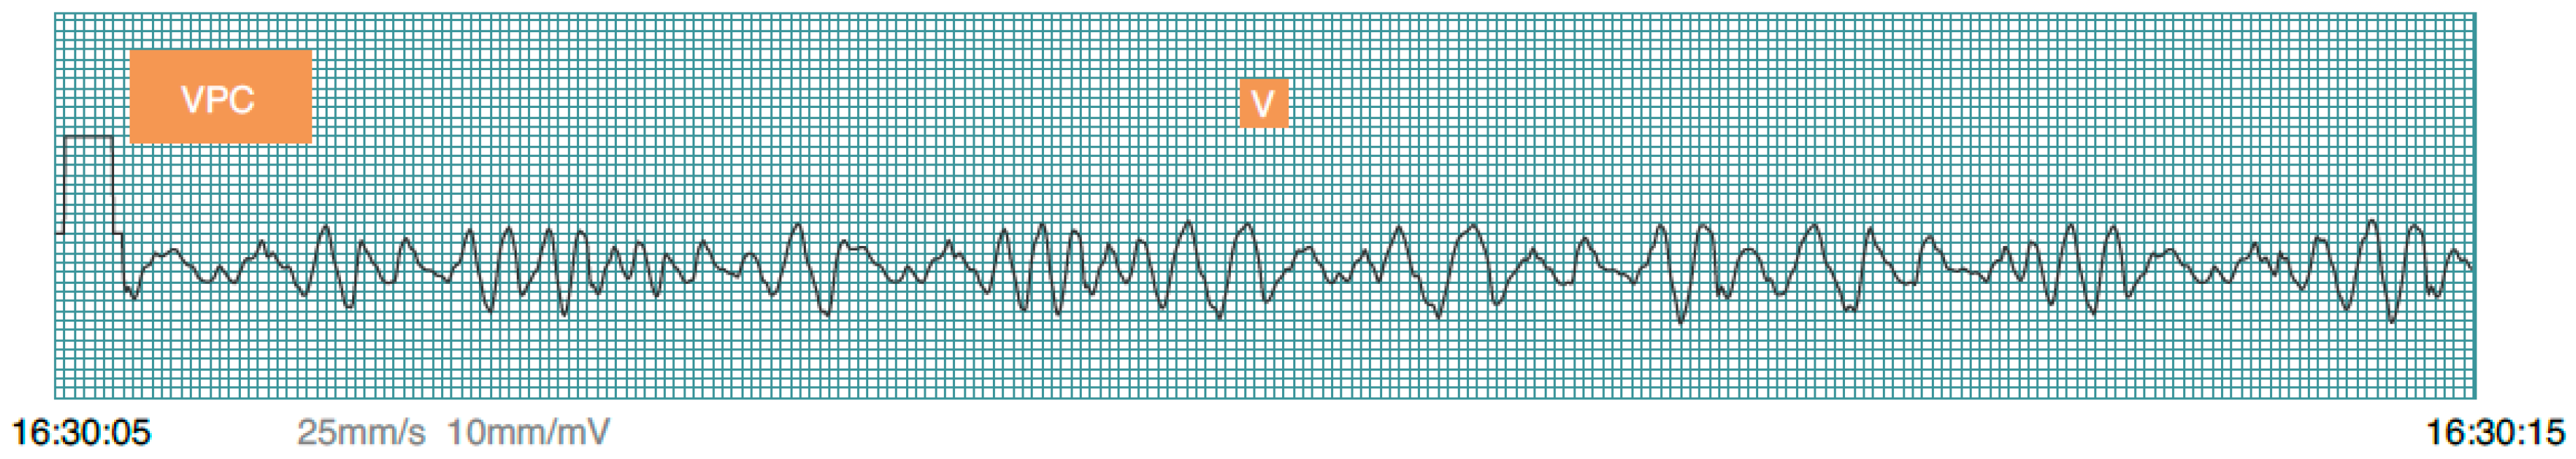
The next limitation is the algorithm sequence. Due to our study placing VF detection as the last evaluation, it may appear that VF wave and signal that is close to its wave are similar to the QRS complex classified as VPC class, as shown in Figure 6. This disadvantage is highly likely to be one of the factors negatively affecting VF detection.
For SVEB (i.e., APC) detection, according to ANSI/AAMI EC57, the evaluation should cover all data records. This condition will make a requirement to evaluate not only testing and validation data, but also training data of the ANN, which is learnt by the model in the training.
The device also has several limitations. For this system, the microcontroller unit speed is up to 25 MHz and the Bluetooth module will only support the data transferring maximum 2 Mbps data rates. In this study, utilizing single lead evaluation, these MCU and BLE still work very well. However, these conditions will make our device highly likely to have a problem for the multi-lead ECG signal evaluation.
For the electrode, this study utilizes a wet-based electrode. This electrode may have some disadvantages for the long-term user. The dry-up [50] and sweating [51] may affect the quality of the signal. In further, the utilization of the dry electrode will generate solutions for the wet electrode limitations in biopotential-based evaluation [52,53,54,55]. The dry electrode will be one of the future works for our study.
5. Conclusions
This study has developed an integrated method from several algorithms for arrhythmia detection by applying the relatively less complicated algorithms, which has purposed of the real-time wearable device for the arrhythmia detection. The system performs based on the R-R interval and the raw ECG signal for detecting the ECG abnormalities. This study evaluated 169 records from four databases in PhysioNet. Our study results for SVEB (i.e., APC) and VEB (i.e., VPC) have improved as compared to a previous study by utilizing the evaluation of ANSI/AAMI EC57:2012. For AF detection, most of the evaluations provide a positive achievement except for the episode sensitivity. Meanwhile, for VF, the episode sensitivity provides the decision from the whole databases ranging from 83% to 100%, except for the MITDB episode positive predictivity, which is 75%. In conclusion, our integrated algorithm detection can achieve a good accuracy in comparison to other previous studies. However, more advanced algorithms, faster MCU & BLE devices, and dry electrodes will be utilized as future works for our study. This will be a big advantage in solving data transfer problem and allow dry electrode multi-lead ECG system for more advanced arrhythmia detection and better evaluation.
Acknowledgments
This research is financially supported by Cal-Comp Electronics & Communications Co., Ltd., and Kinpo Electronics, Inc. New Taipei City, Taiwan. This research is also supported by Innovation Center for Big Data and Digital Convergence, Yuan Ze University, Taiwan.
Author Contributions
M.S., C.-H.L. and Y.-T.L. developed the algorithms and analyzed the data. Y.H. designed the Firmware. C.-C.K. designed the hardware. M.S. wrote the paper. J.-S.S., M.F.A., J.C.C. and K.H. evaluated and supervised the study.
Conflicts of Interest
The authors declare no conflict of interest.
References
- Shany, T.; Redmond, S.J.; Narayanan, M.R.; Lovell, N.H. Sensors-based wearable systems for monitoring of human movement and falls. IEEE Sens. J. 2012, 12, 658–670. [Google Scholar] [CrossRef]
- Patel, S.; Lorincz, K.; Hughes, R.; Huggins, N.; Growdon, J.; Standaert, D.; Akay, M.; Dy, J.; Welsh, M.; Bonato, P. Monitoring motor fluctuations in patients with Parkinson’s disease using wearable sensors. IEEE Trans. Inf. Technol. Biomed. 2009, 13, 864–873. [Google Scholar] [CrossRef] [PubMed] [Green Version]
- Corbishley, P.; Rodríguez-Villegas, E. Breathing detection: Towards a miniaturized, wearable, battery-operated monitoring system. IEEE Trans. Biomed. Eng. 2008, 55, 196–204. [Google Scholar] [CrossRef] [PubMed]
- Guo, H.W.; Huang, Y.S.; Chien, J.C.; Shieh, J.S. Short-term analysis of heart rate variability for emotion recognition via a wearable ECG device. In Proceedings of the IEEE International Conference on Intelligent Informatics and Biomedical Sciences (ICIIBMS), Okinawa, Japan, 28–30 November 2015; pp. 262–265. [Google Scholar]
- Rosenberg, M.A.; Samuel, M.; Thosani, A.; Zimetbaum, P.J. Use of a noninvasive continuous monitoring device in the management of atrial fibrillation: A pilot study. Pacing Clin. Electrophysiol. 2013, 36, 328–333. [Google Scholar] [CrossRef] [PubMed] [Green Version]
- Baig, M.M.; Gholamhosseini, H.; Connolly, M.J. A comprehensive survey of wearable and wireless ECG monitoring systems for older adults. Med. Biol. Eng. Comput. 2013, 51, 485–495. [Google Scholar] [CrossRef] [PubMed]
- Fensli, R.; Gunnarson, E.; Gundersen, T. A wearable ECG-recording system for continuous arrhythmia monitoring in a wireless tele-home-care situation. In Proceedings of the 18th IEEE Symposium on Computer-Based Medical Systems, Dublin, Ireland, 23–24 June 2005; pp. 407–412. [Google Scholar]
- Lin, C.T.; Chang, K.C.; Lin, C.L.; Chiang, C.C.; Lu, S.W.; Chang, S.S.; Lin, B.S.; Liang, H.Y.; Chen, R.J.; Lee, Y.T.; et al. An intelligent telecardiology system using a wearable and wireless ECG to detect atrial fibrillation. IEEE Trans. Inf. Technol. Biomed. 2010, 14, 726–733. [Google Scholar] [PubMed]
- Hu, S.; Wei, H.; Chen, Y.; Tan, J. A real-time cardiac arrhythmia classification system with wearable sensor networks. Sensors 2012, 12, 12844–12869. [Google Scholar] [CrossRef] [PubMed]
- Hadiyoso, S.; Usman, K.; Rizal, A. Arrhythmia detection based on ECG signal using Android mobile for athlete and patient. In Proceedings of the IEEE 3rd International Conference on Information and Communication Technology (ICoICT), Nusa Dua, Bali, 27–29 May 2015; pp. 166–171. [Google Scholar]
- Fuster, V.; Rydén, L.E.; Cannom, D.S.; Crijns, H.J.; Curtis, A.B.; Ellenbogen, K.A.; Halperin, J.L.; Le Heuzey, J.Y.; Kay, G.N.; Lowe, J.E.; et al. ACC/AHA/ESC 2006 guidelines for the management of patients with atrial fibrillation–executive summary: A report of the American College of Cardiology/American Heart Association Task Force on practice guidelines and the European Society of Cardiology Committee for Practice Guidelines (Writing Committee to Revise the 2001 Guidelines for the Management of Patients with Atrial Fibrillation) Developed in collaboration with the European Heart Rhythm Association and the Heart Rhythm Society. Eur. Heart J. 2006, 27, 1979–2030. [Google Scholar] [PubMed]
- Wolf, P.A.; Abbott, R.D.; Kannel, W.B. Atrial fibrillation as an independent risk factor for stroke: The Framingham Study. Stroke 1991, 22, 983–988. [Google Scholar] [CrossRef] [PubMed]
- Kara, S.; Okandan, M. Atrial fibrillation classification with artificial neural networks. Pattern Recognit. 2007, 40, 2967–2973. [Google Scholar] [CrossRef]
- Roonizi, E.K.; Sassi, R. Dominant atrial fibrillatory frequency estimation using an extended Kalman smoother. In Proceedings of the Computing in Cardiology Conference (CinC), Vancouver, BC, Canada, 11–14 September 2016; pp. 989–992. [Google Scholar]
- Mohebbi, M.; Ghassemian, H. Detection of atrial fibrillation episodes using SVM. In Proceedings of the EMBS 30th Annual International Conference of the IEEE Engineering in Medicine and Biology Society, Vancouver, BC, Canada, 20–25 August 2008; pp. 177–180. [Google Scholar]
- Abdul-Kadir, N.A.; Safri, N.M.; Othman, M.A. Dynamic ECG features for atrial fibrillation recognition. Comput. Methods Progr. Biomed. 2016, 136, 143–150. [Google Scholar] [CrossRef] [PubMed]
- Rajpurkar, P.; Hannun, A.Y.; Haghpanahi, M.; Bourn, C.; Ng, A.Y. Cardiologist-Level Arrhythmia Detection with Convolutional Neural Networks. arXiv, 2017; arXiv:1707.01836. [Google Scholar]
- McWilliam, J.A. Cardiac failure and sudden death. Br. Med. J. 1889, 1, 6. [Google Scholar] [CrossRef] [PubMed]
- Weaver, W.D.; Copass, M.K.; Bufi, D.; Ray, R.; Hallstrom, A.P.; Cobb, L.A. Improved neurologic recovery and survival after early defibrillation. Circulation 1984, 69, 943–948. [Google Scholar] [CrossRef] [PubMed]
- Alonso-Atienza, F.; Rojo-Álvarez, J.L.; Rosado-Muñoz, A.; Vinagre, J.J.; García-Alberola, A.; Camps-Valls, G. Feature selection using support vector machines and bootstrap methods for ventricular fibrillation detection. Expert Syst. Appl. 2012, 39, 1956–1967. [Google Scholar] [CrossRef]
- Anas, E.M.A.; Lee, S.Y.; Hasan, M.K. Exploiting correlation of ECG with certain EMD functions for discrimination of ventricular fibrillation. Comput. Biol. Med. 2011, 41, 110–114. [Google Scholar] [CrossRef] [PubMed]
- Thong, T.; McNames, J.; Aboy, M.; Goldstein, B. Prediction of paroxysmal atrial fibrillation by analysis of atrial premature complexes. IEEE Trans. Biomed. Eng. 2004, 51, 561–569. [Google Scholar] [CrossRef] [PubMed]
- Sayadi, O.; Shamsollahi, M.B.; Clifford, G.D. Robust detection of premature ventricular contractions using a wave-based Bayesian framework. IEEE Trans. Biomed. Eng. 2010, 57, 353–362. [Google Scholar] [CrossRef] [PubMed]
- Özbay, Y.; Ceylan, R.; Karlik, B. A fuzzy clustering neural network architecture for classification of ECG arrhythmias. Comput. Biol. Med. 2006, 36, 376–388. [Google Scholar] [CrossRef] [PubMed]
- Song, M.H.; Lee, J.; Cho, S.P.; Lee, K.J.; Yoo, S.K. Support vector machine based arrhythmia classification using reduced features. Int. J. Control Autom. Syst. 2005, 3, 571. [Google Scholar]
- Zhou, X.; Ding, H.; Wu, W.; Zhang, Y. A real-time atrial fibrillation detection algorithm based on the instantaneous state of heart rate. PLoS ONE 2015, 10, e0136544. [Google Scholar] [CrossRef] [PubMed]
- Gowid, S.; Dixon, R.; Ghani, S. Performance Comparison Between Fast Fourier Transform-Based Segmentation, Feature Selection, and Fault Identification Algorithm and Neural Network for the Condition Monitoring of Centrifugal Equipment. J. Dyn. Syst. Meas. Control 2017, 139, 061013. [Google Scholar] [CrossRef]
- Bucci, O.M.; Migliore, M.D. A Novel Nonuniform Fast Fourier Transform Algorithm and Its Application to Aperiodic Arrays. IEEE Antennas Wirel. Propag. Lett. 2017, 16, 1472–1475. [Google Scholar] [CrossRef]
- Glowacz, A. Recognition of Acoustic Signals of Loaded Synchronous Motor Using FFT, MSAF-5 and LSVM. Arch. Acoust. 2015, 40, 197–203. [Google Scholar] [CrossRef]
- Kotus, J. Multiple sound sources localization in free field using acoustic vector sensor. Multimedia Tools Appl. 2015, 74, 4235–4251. [Google Scholar] [CrossRef] [PubMed]
- Clayton, R.H.; Murray, A. Estimation of the ECG signal spectrum during ventricular fibrillation using the fast Fourier transform and maximum entropy methods. In Proceedings of the IEEE Computers in Cardiology, London, UK, 5–8 September 1993; pp. 867–870. [Google Scholar]
- Afonso, V.X.; Tompkins, W.J. Detecting ventricular fibrillation. IEEE Eng. Med. Biol. Mag. 1995, 14, 152–159. [Google Scholar] [CrossRef]
- Analog Devices. Single-Lead, Heart Rate Monitor Front End. AD8232 Datasheet. 2012. Available online: http://www.analog.com/media/en/technical-documentation/data-sheets/AD8232.pdf (accessed on 30 September 2017).
- Goldberger, A.L.; Amaral, L.A.; Glass, L.; Hausdorff, J.M.; Ivanov, P.C.; Mark, R.G.; Mietus, J.E.; Moody, G.B.; Peng, C.K.; Stanley, H.E. Physiobank, physiotoolkit, and physionet. Circulation 2000, 101, e215–e220. [Google Scholar] [CrossRef] [PubMed]
- Nolle, F.M.; Badura, F.K.; Catlett, J.M.; Bowser, R.W.; Sketch, M.H. CREI-GARD, a new concept in computerized arrhythmia monitoring systems. Comput. Cardiol. 1986, 13, 515–518. [Google Scholar]
- Moody, G.B.; Mark, R.G. The impact of the MIT-BIH arrhythmia database. IEEE Eng. Med. Biol. Mag. 2001, 20, 45–50. [Google Scholar] [CrossRef] [PubMed]
- Moody, G.B.; Muldrow, W.; Mark, R.G. A noise stress test for arrhythmia detectors. Comput. Cardiol. 1984, 11, 381–384. [Google Scholar]
- Association for the Advancement of Medical Instrumentation. Testing and Reporting Performance Results of Cardiac Rhythm and st Segment Measurement Algorithms; ANSI/AAMI EC57; Association for the Advancement of Medical Instrumentation: Arlington, VA, USA, 2012. [Google Scholar]
- Hamilton, P.S.; Tompkins, W.J. Quantitative investigation of QRS detection rules using the MIT/BIH arrhythmia database. IEEE Trans. Biomed. Eng. 1986, 12, 1157–1165. [Google Scholar] [CrossRef]
- Hamilton, P.S. Open Source ECG Analysis Software Documentation; EP Limited: Somerville, MA, USA, 2002. [Google Scholar]
- Richman, J.S.; Moorman, J.R. Physiological time-series analysis using approximate entropy and sample entropy. Am. J. Physiol. Heart Circ. Physiol. 2000, 278, H2039–H2049. [Google Scholar] [PubMed]
- Lin, C.H.; Chien, J.C.; Haraikawa, K.; Huang, Y.S.; Guo, H.W.; Shieh, J.S. A modular integrating algorithm for multiple arrhythmia detection. In Proceedings of the IEEE International Conference on Communication Problem-Solving (ICCP), Taipei, Taiwan, 7–9 September 2016; pp. 1–2. [Google Scholar]
- Lo, M.T.; Lin, L.Y.; Hsieh, W.H.; Ko, P.C.I.; Liu, Y.B.; Lin, C.; Chang, Y.C.; Wang, C.Y.; Young, V.H.W.; Chiang, W.C.; et al. A new method to estimate the amplitude spectrum analysis of ventricular fibrillation during cardiopulmonary resuscitation. Resuscitation 2013, 84, 1505–1511. [Google Scholar] [CrossRef] [PubMed]
- De Chazal, P.; O’Dwyer, M.; Reilly, R.B. Automatic classification of heartbeats using ECG morphology and heartbeat interval features. IEEE Trans. Biomed. Eng. 2004, 51, 1196–1206. [Google Scholar] [CrossRef] [PubMed]
- Young, B.; Brodnick, D.; Spaulding, R. A comparative study of a hidden Markov model detector for atrial fibrillation. In Proceedings of the IEEE Signal Processing Society Workshop Neural Networks for Signal Processing IX, Madison, WI, USA, 23–25 August 1999; pp. 468–476. [Google Scholar]
- Park, S.B.; Yoon, H.R. Development and Evaluation of an Improved Algorithm for Detection of Ventricular Fibrillation. In World Congress on Medical Physics and Biomedical Engineering 2006; Springer: Berlin/Heidelberg, Germany, 2007; pp. 1174–1177. [Google Scholar]
- Moraes, J.C.T.B.; Blechner, M.; Vilani, F.N.; Costa, E.V. Ventricular fibrillation detection using a leakage/complexity measure method. In Proceedings of the IEEE Computers in Cardiology, Memphis, TN, USA, 22–25 September 2002; pp. 213–216. [Google Scholar]
- Chakroborty, S.; Patil, M.A. Real-time arrhythmia classification for large databases. In Proceedings of the 36th Annual International Conference of the IEEE Engineering in Medicine and Biology Society (EMBC), Chicago, IL, USA, 26–30 August 2014; pp. 1448–1451. [Google Scholar]
- Logan, B.; Healey, J. Robust detection of atrial fibrillation for a long term telemonitoring system. In Proceedings of the IEEE Computers in Cardiology, Lyon, France, 25–28 September 2005; pp. 619–622. [Google Scholar]
- Hoffmann, K.P.; Ruff, R. Flexible dry surface-electrodes for ECG long-term monitoring. In Proceedings of the 29th Annual International Conference of the IEEE Engineering in Medicine and Biology Society, Lyon, France, 22–26 August 2007; pp. 5739–5742. [Google Scholar]
- Abdoli-Eramaki, M.; Damecour, C.; Christenson, J.; Stevenson, J. The effect of perspiration on the sEMG amplitude and power spectrum. J. Electromyogr. Kinesiol. 2012, 22, 908–913. [Google Scholar] [CrossRef] [PubMed]
- Baba, A.; Burke, M.J. Measurement of the electrical properties of ungelled ECG electrodes. Int. J. Biol. Biomed. Eng. 2008, 2, 89–97. [Google Scholar]
- Gargiulo, G.D.; Bifulco, P.; Cesarelli, M.; Fratini, A.; Romano, M. Problems in assessment of novel biopotential front-end with dry electrode: A brief review. Machines 2014, 2, 87–98. [Google Scholar] [CrossRef]
- Winter, B.B.; Webster, J.G. Reductionl of interference due to common mode voltage in biopotential amplifiers. IEEE Trans. Biomed. Eng. 1983, 1, 58–62. [Google Scholar] [CrossRef]
- Chi, Y.M.; Jung, T.P.; Cauwenberghs, G. Dry-contact and noncontact biopotential electrodes: Methodological review. IEEE Rev. Biomed. Eng. 2010, 3, 106–119. [Google Scholar] [CrossRef] [PubMed]
Figure 1.
The BC1 electrocardiogram (ECG) device: (a) Front and back views; (b) Processing, transmitting and saving units detail; and, (c) Position with the electrodes.
Figure 1.
The BC1 electrocardiogram (ECG) device: (a) Front and back views; (b) Processing, transmitting and saving units detail; and, (c) Position with the electrodes.

Figure 2.
Integrated arrhythmia evaluation flowchart; (A) Ventricular premature complex detection; (B) Atrial fibrillation detection; (C) Atrial premature complex detection; (D) Ventricular fibrillation detection.
Figure 2.
Integrated arrhythmia evaluation flowchart; (A) Ventricular premature complex detection; (B) Atrial fibrillation detection; (C) Atrial premature complex detection; (D) Ventricular fibrillation detection.
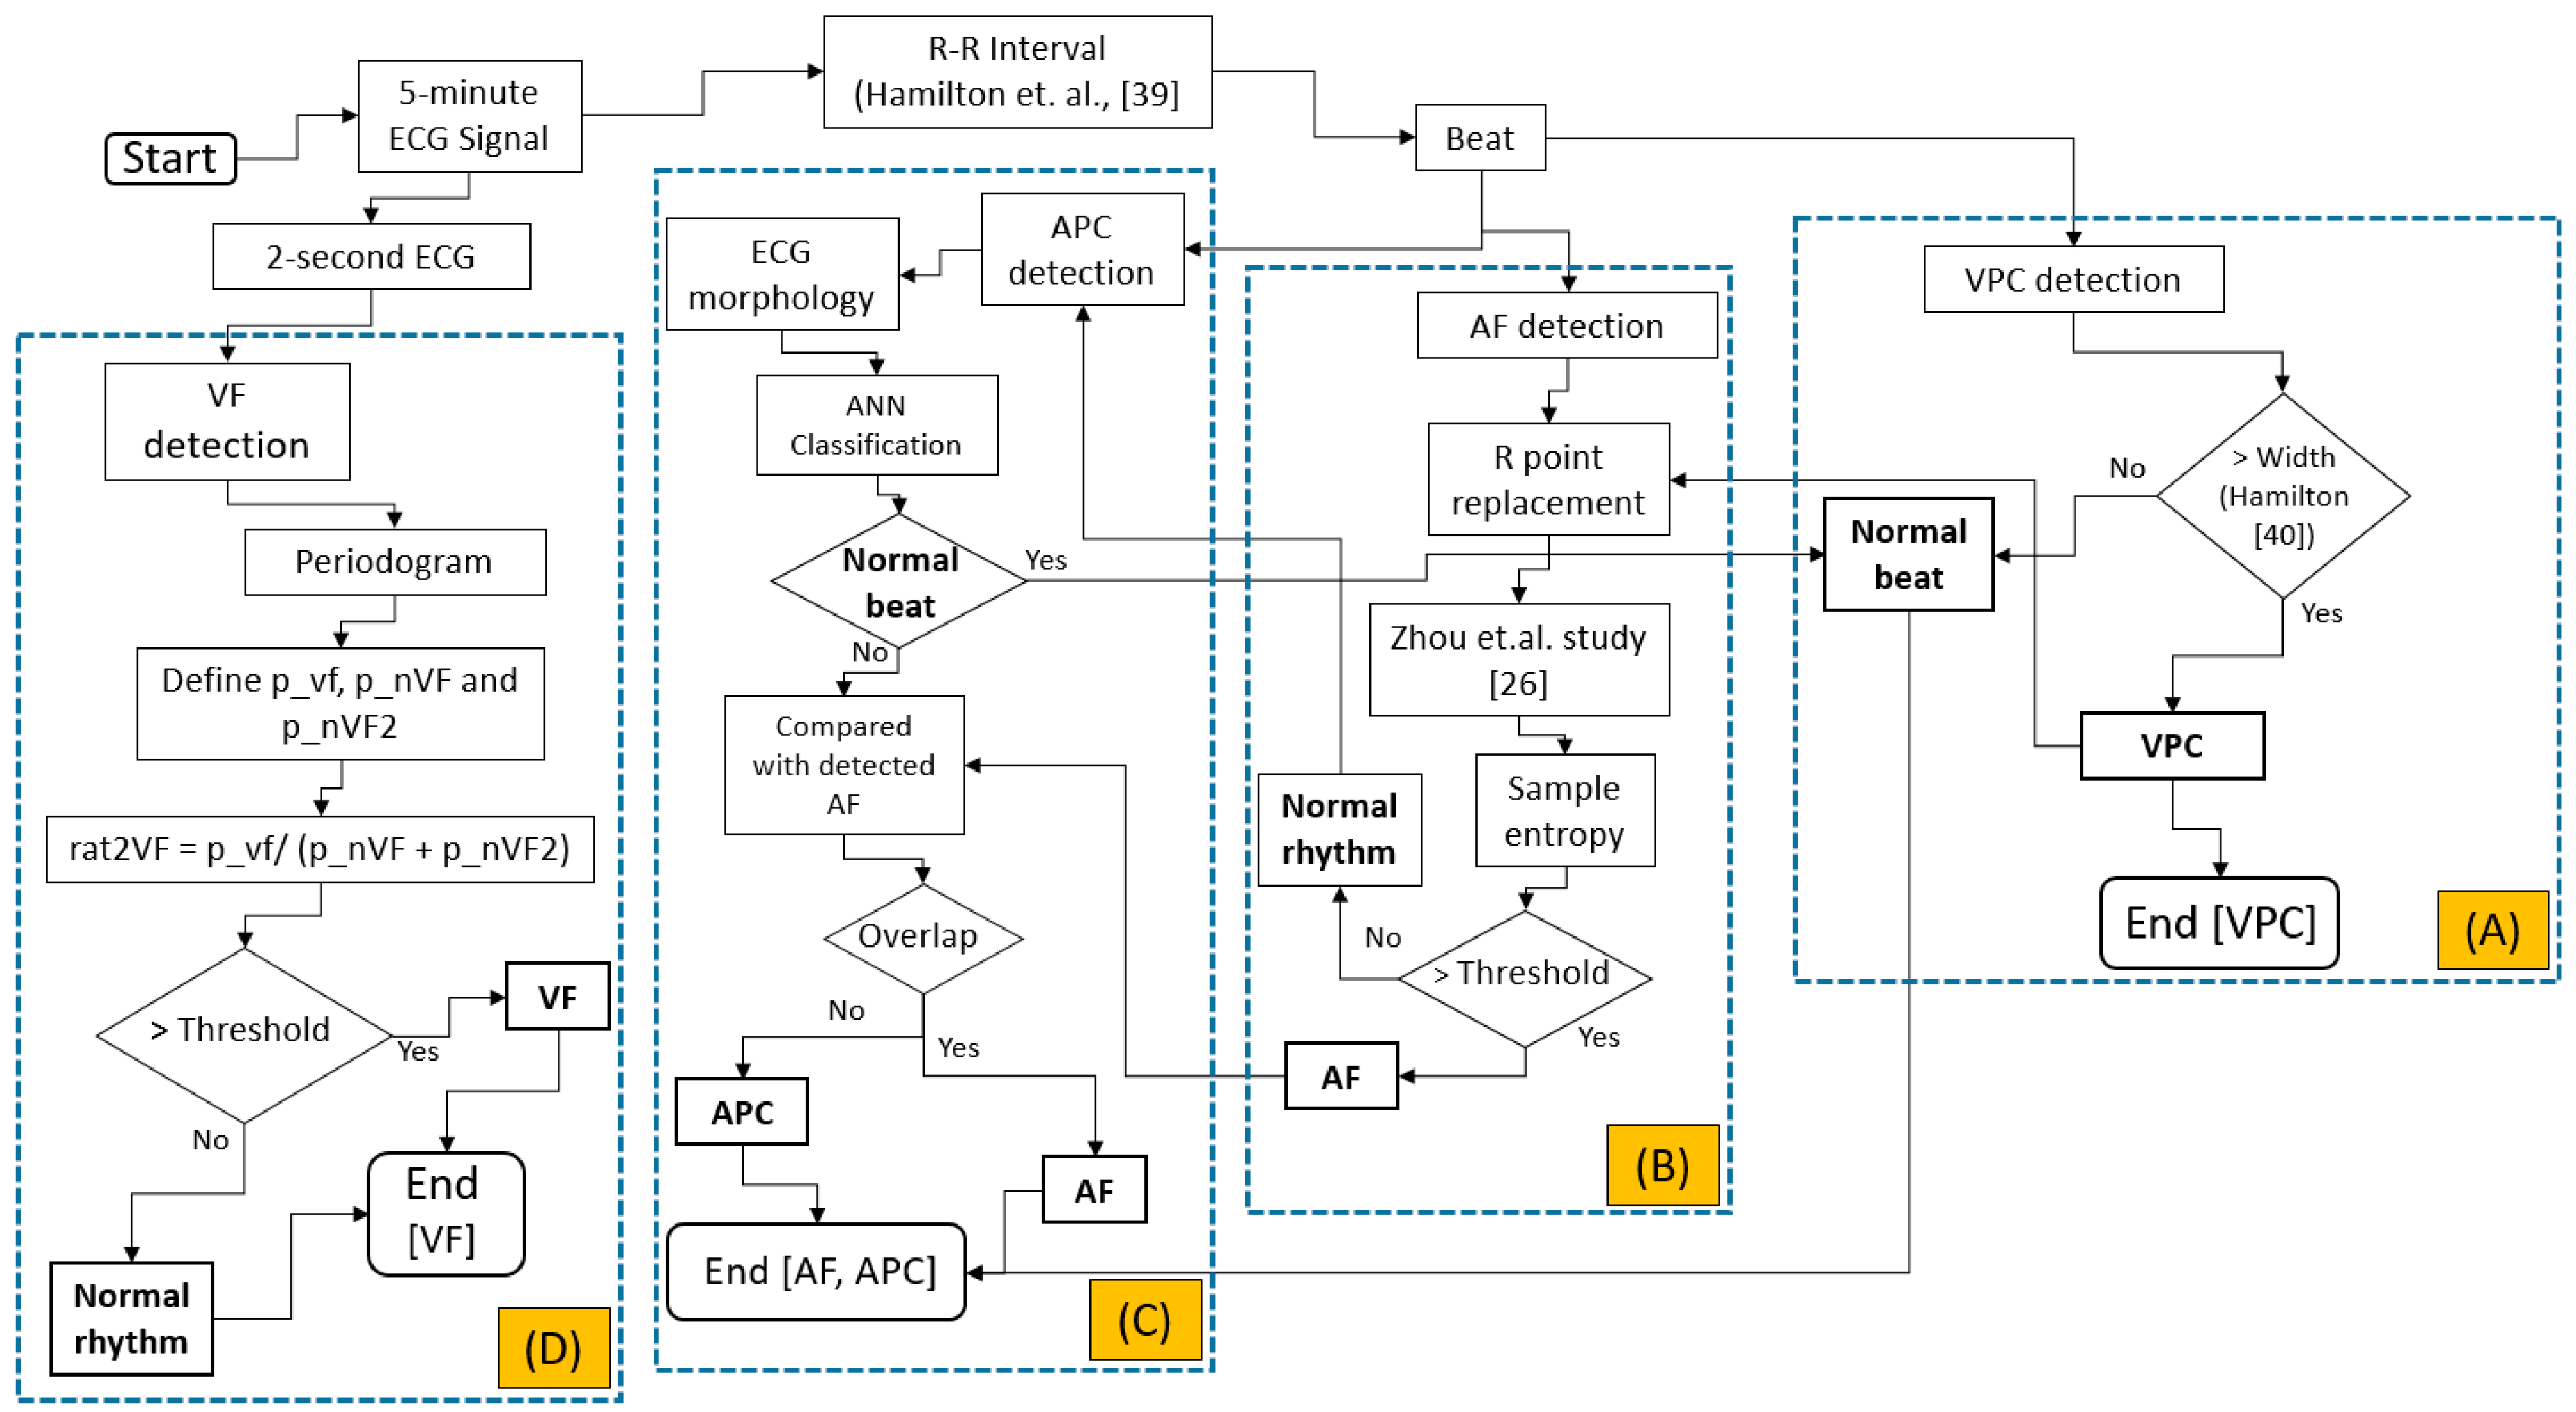
Figure 3.
Artificial neural network (ANN) structure for detecting normal or abnormal beat in APC detection algorithm.
Figure 3.
Artificial neural network (ANN) structure for detecting normal or abnormal beat in APC detection algorithm.
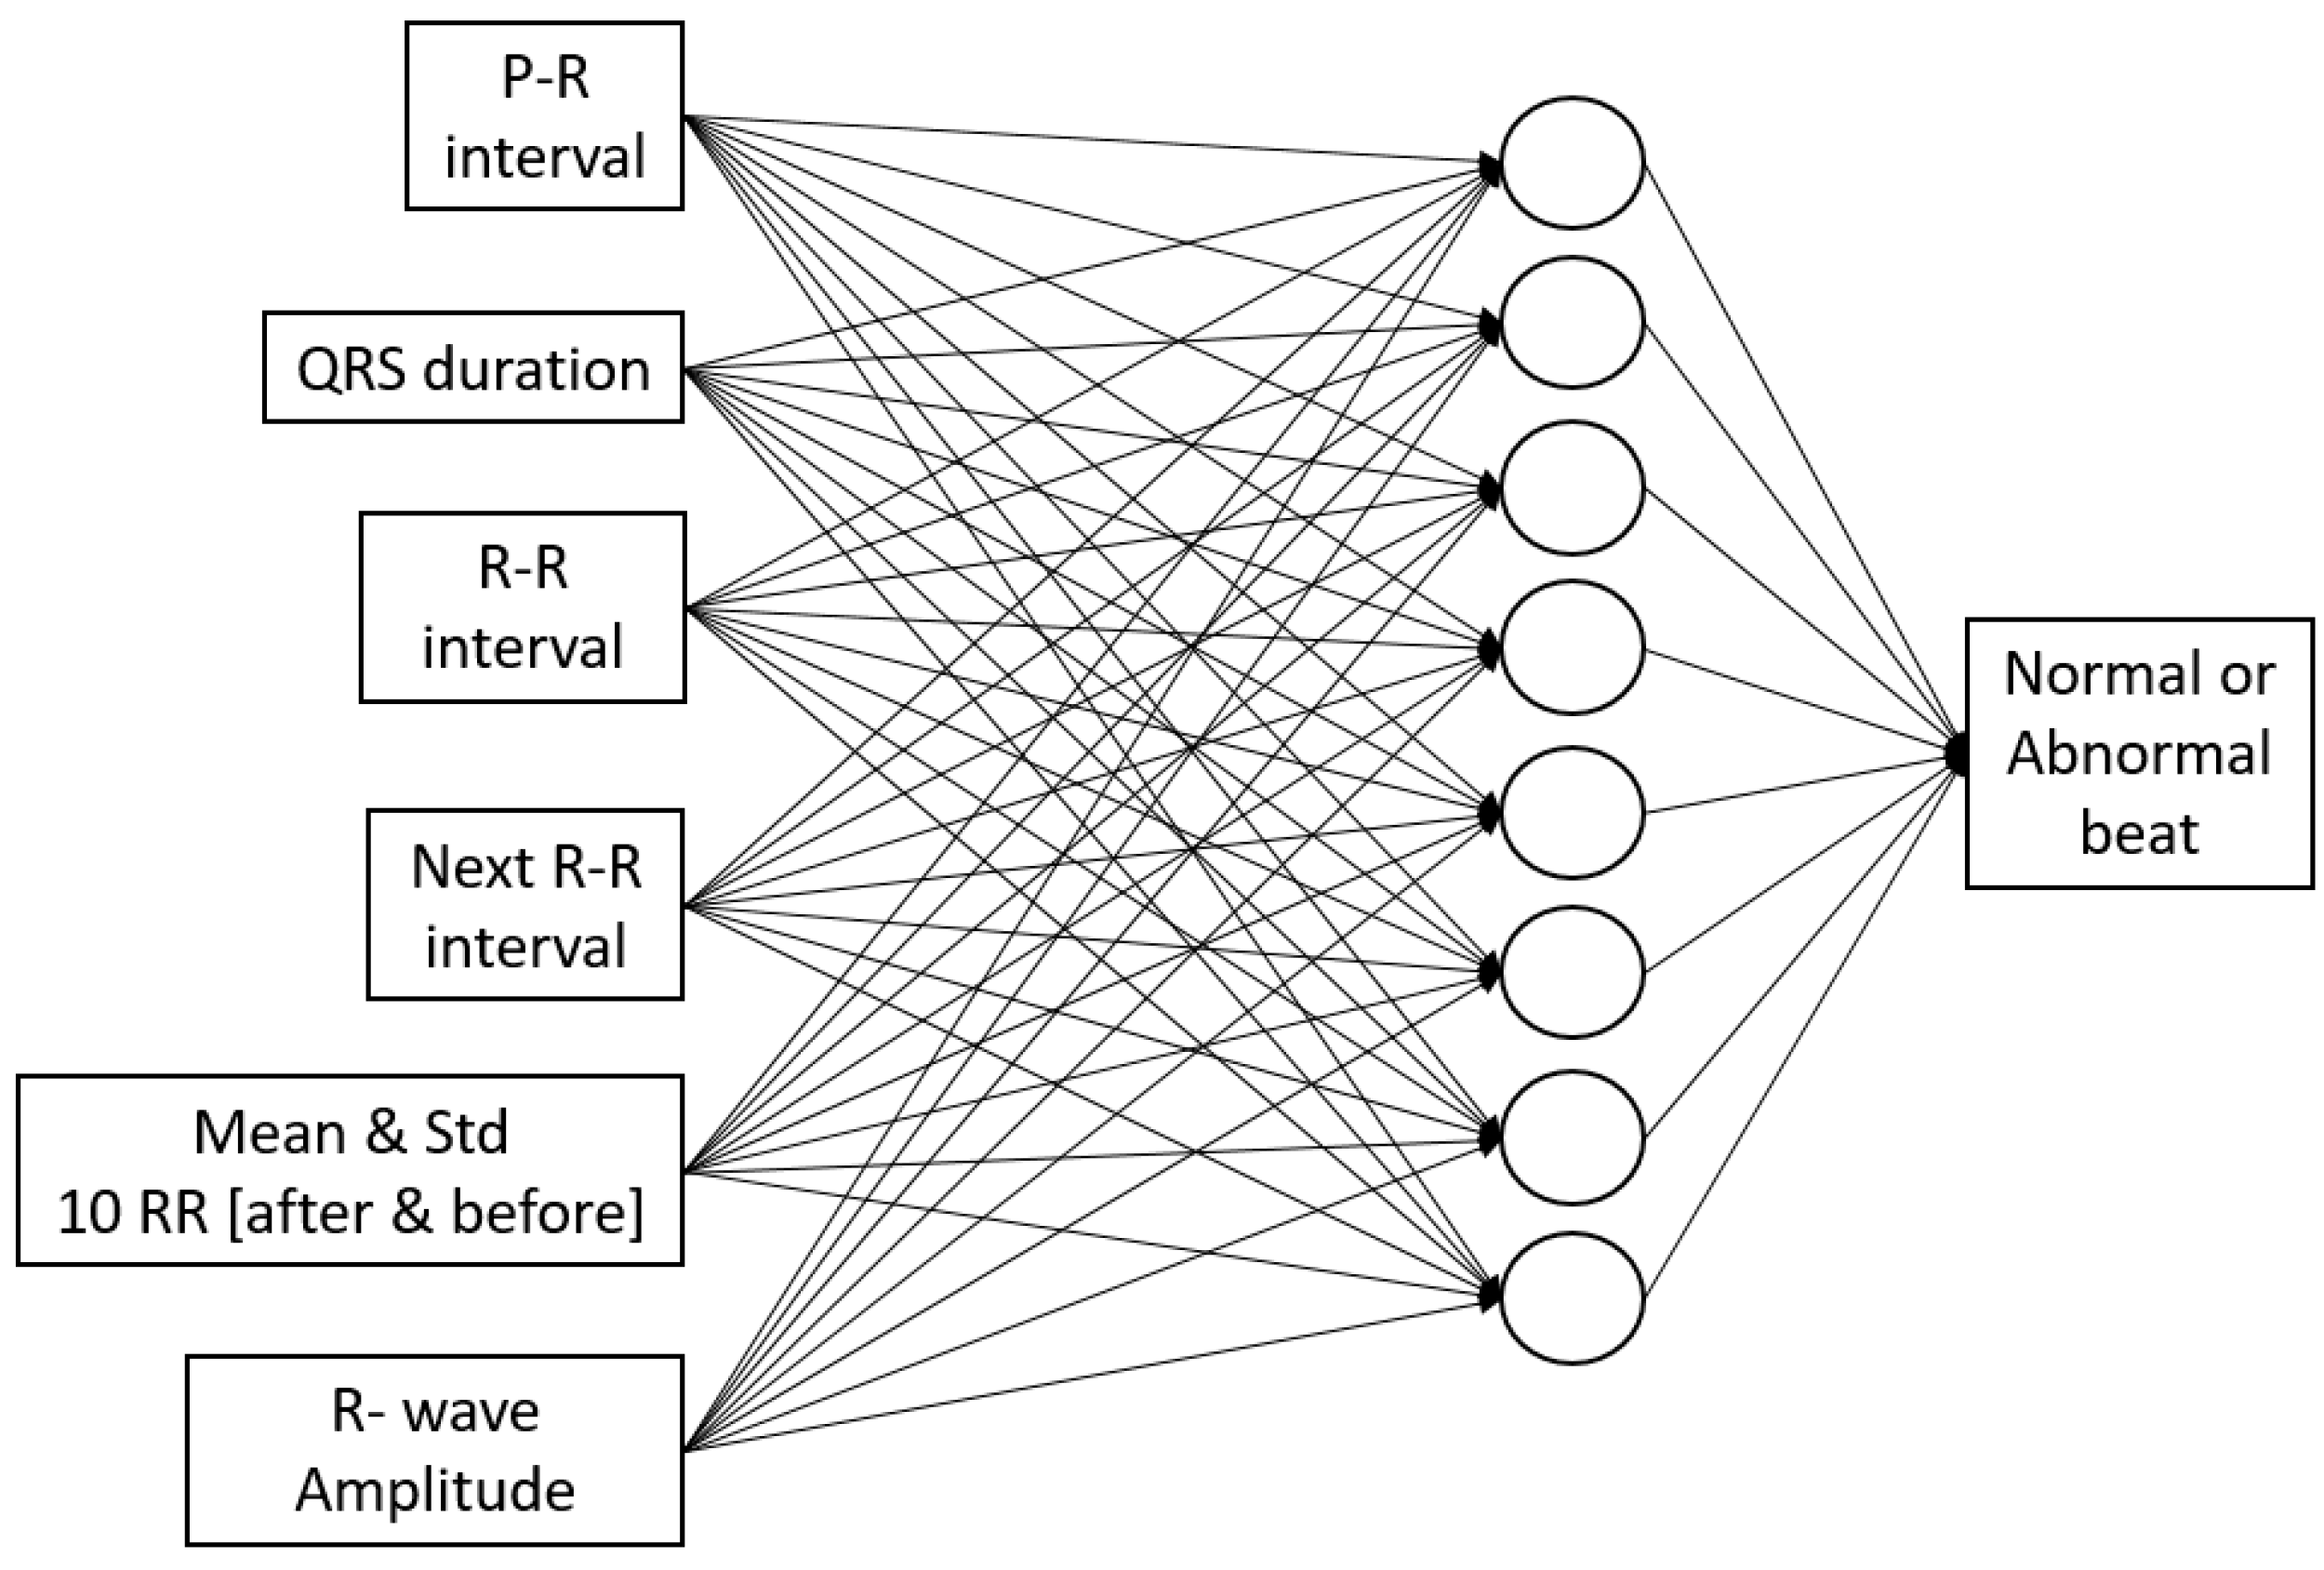
Figure 4.
Simulation result from Fluke simulator displayed on mobile phone; (a) Normal sinus rhythm; (b) Atrial Premature Complex (APC); (c) Ventricular Premature Complex (VPC); (d) Atrial fibrillation; and, (e) Ventricular fibrillation.
Figure 4.
Simulation result from Fluke simulator displayed on mobile phone; (a) Normal sinus rhythm; (b) Atrial Premature Complex (APC); (c) Ventricular Premature Complex (VPC); (d) Atrial fibrillation; and, (e) Ventricular fibrillation.
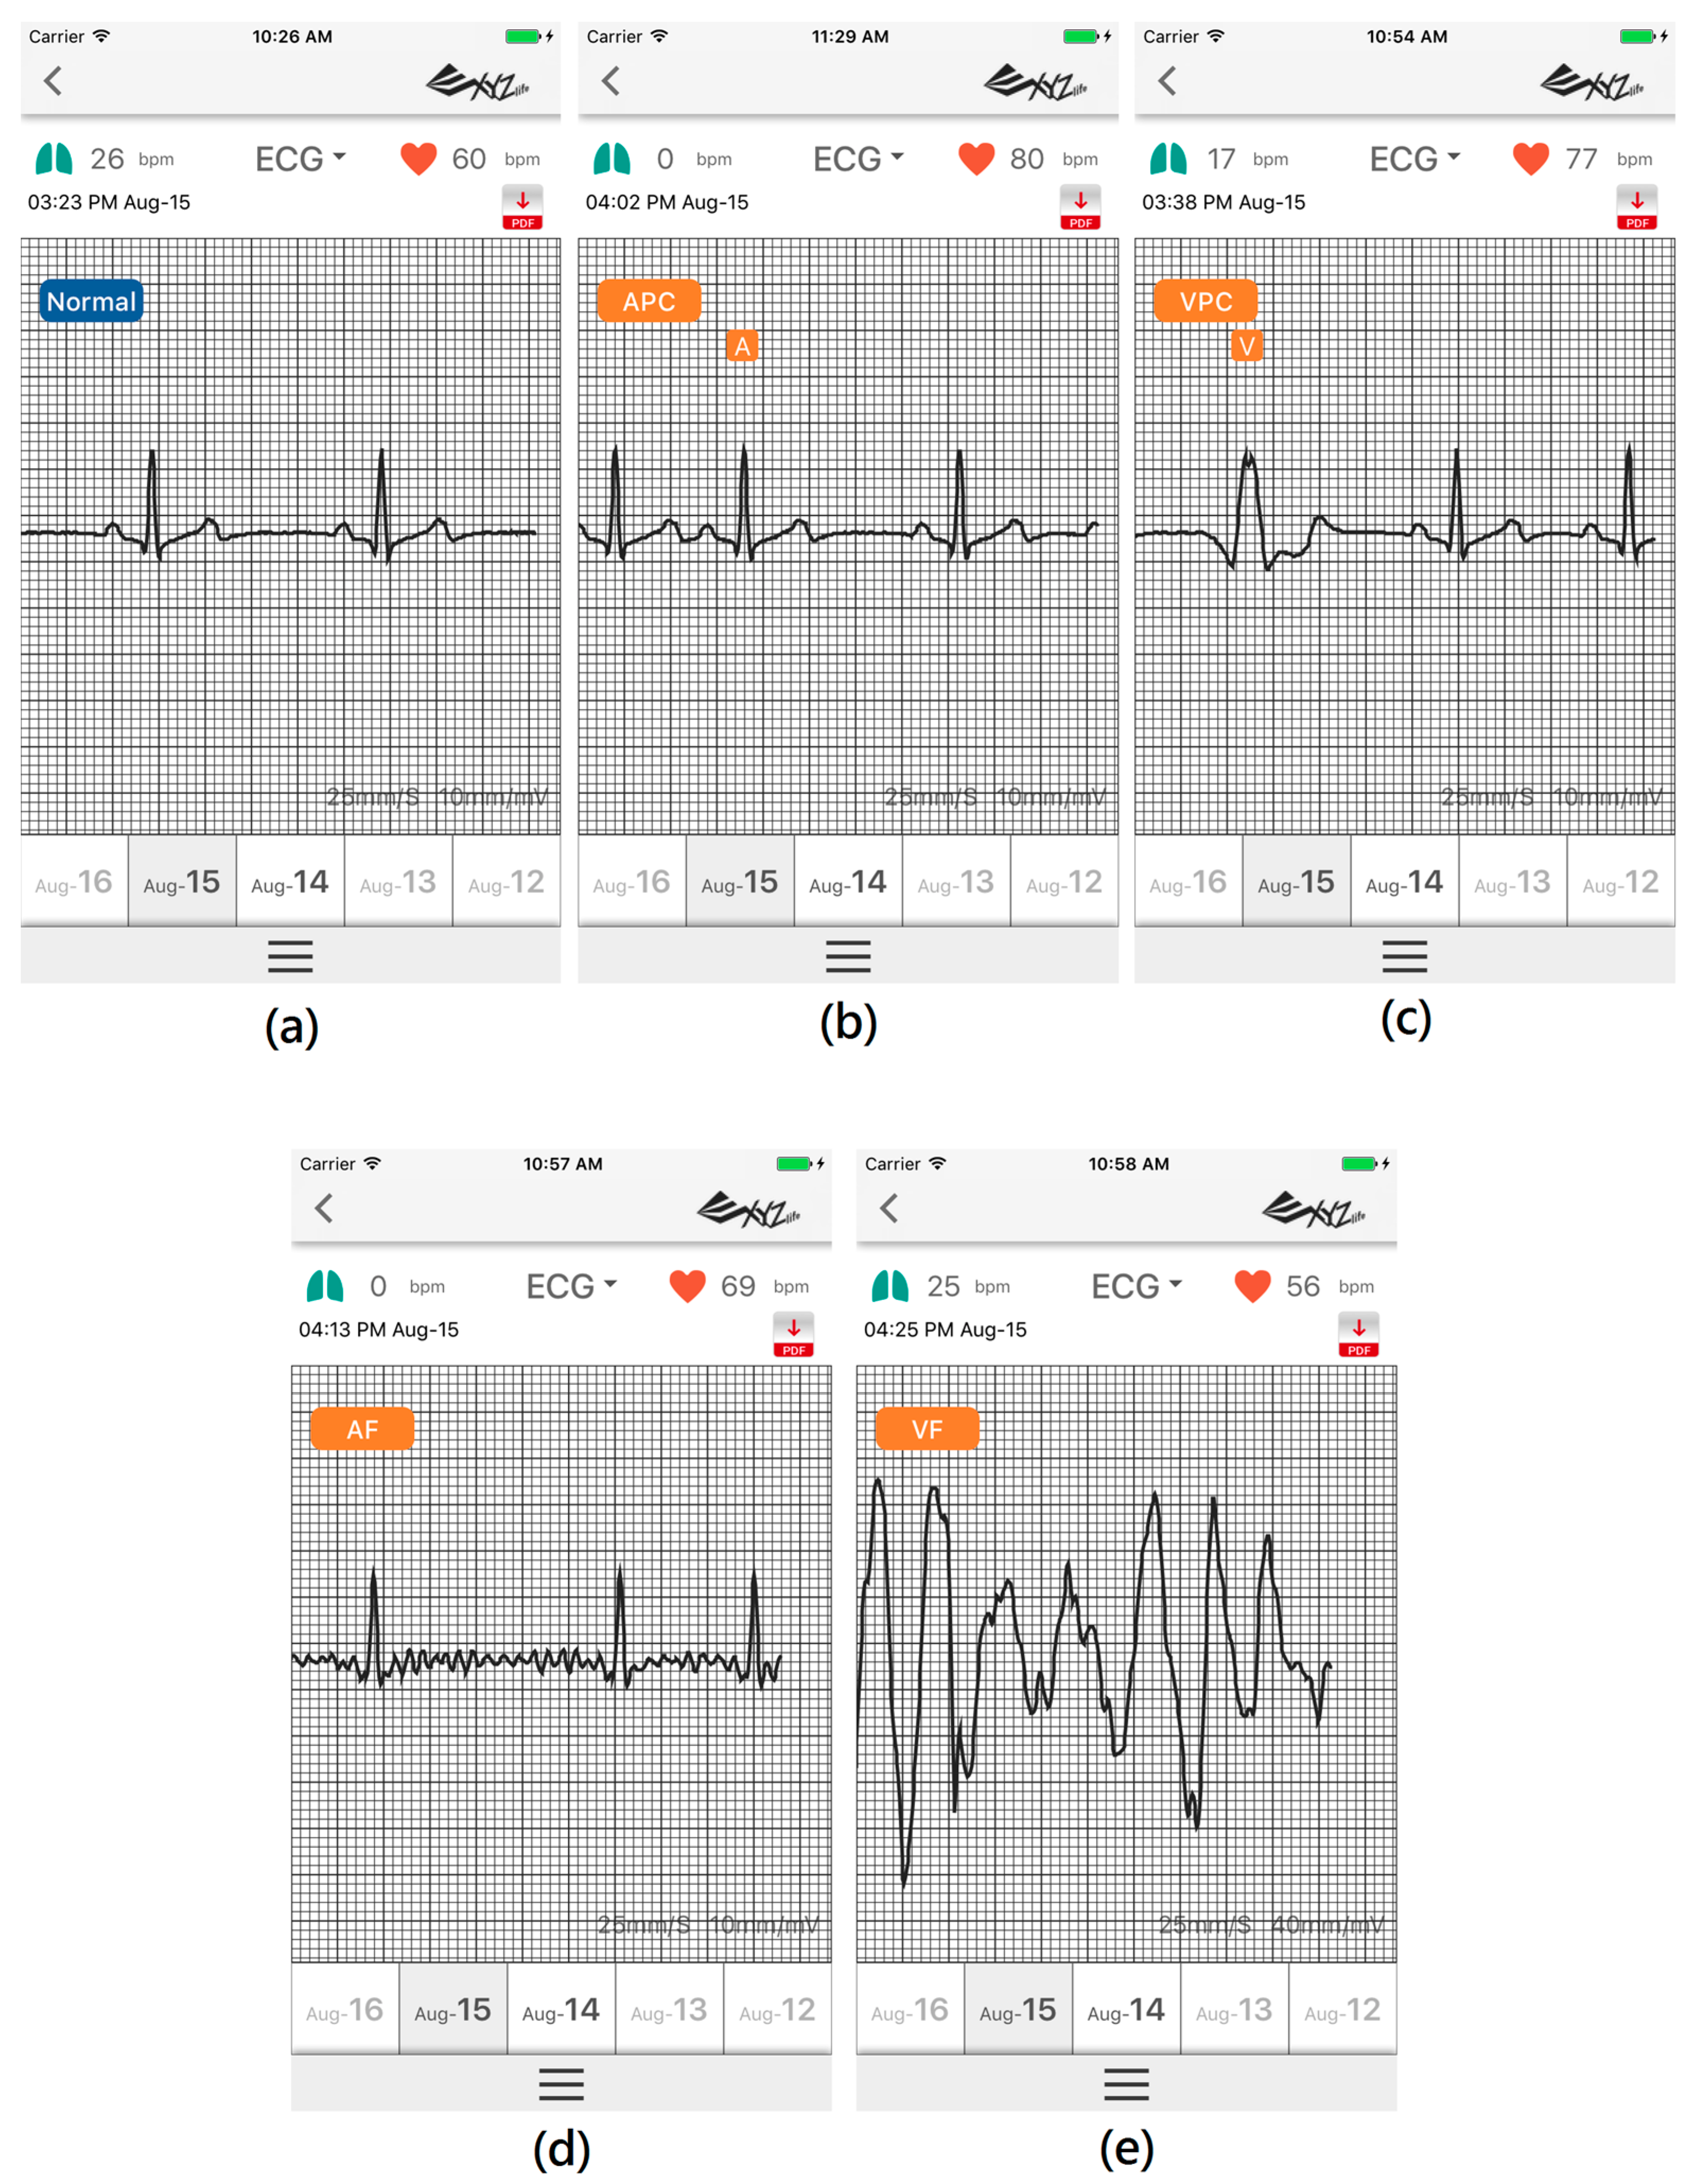
Figure 5.
Documented simulation results from Fluke simulator; (a) Normal sinus rhythm; (b) Atrial Premature Complex (APC); (c) Ventricular Premature Complex (VPC); (d) Atrial fibrillation and (e) Ventricular fibrillation.
Figure 5.
Documented simulation results from Fluke simulator; (a) Normal sinus rhythm; (b) Atrial Premature Complex (APC); (c) Ventricular Premature Complex (VPC); (d) Atrial fibrillation and (e) Ventricular fibrillation.
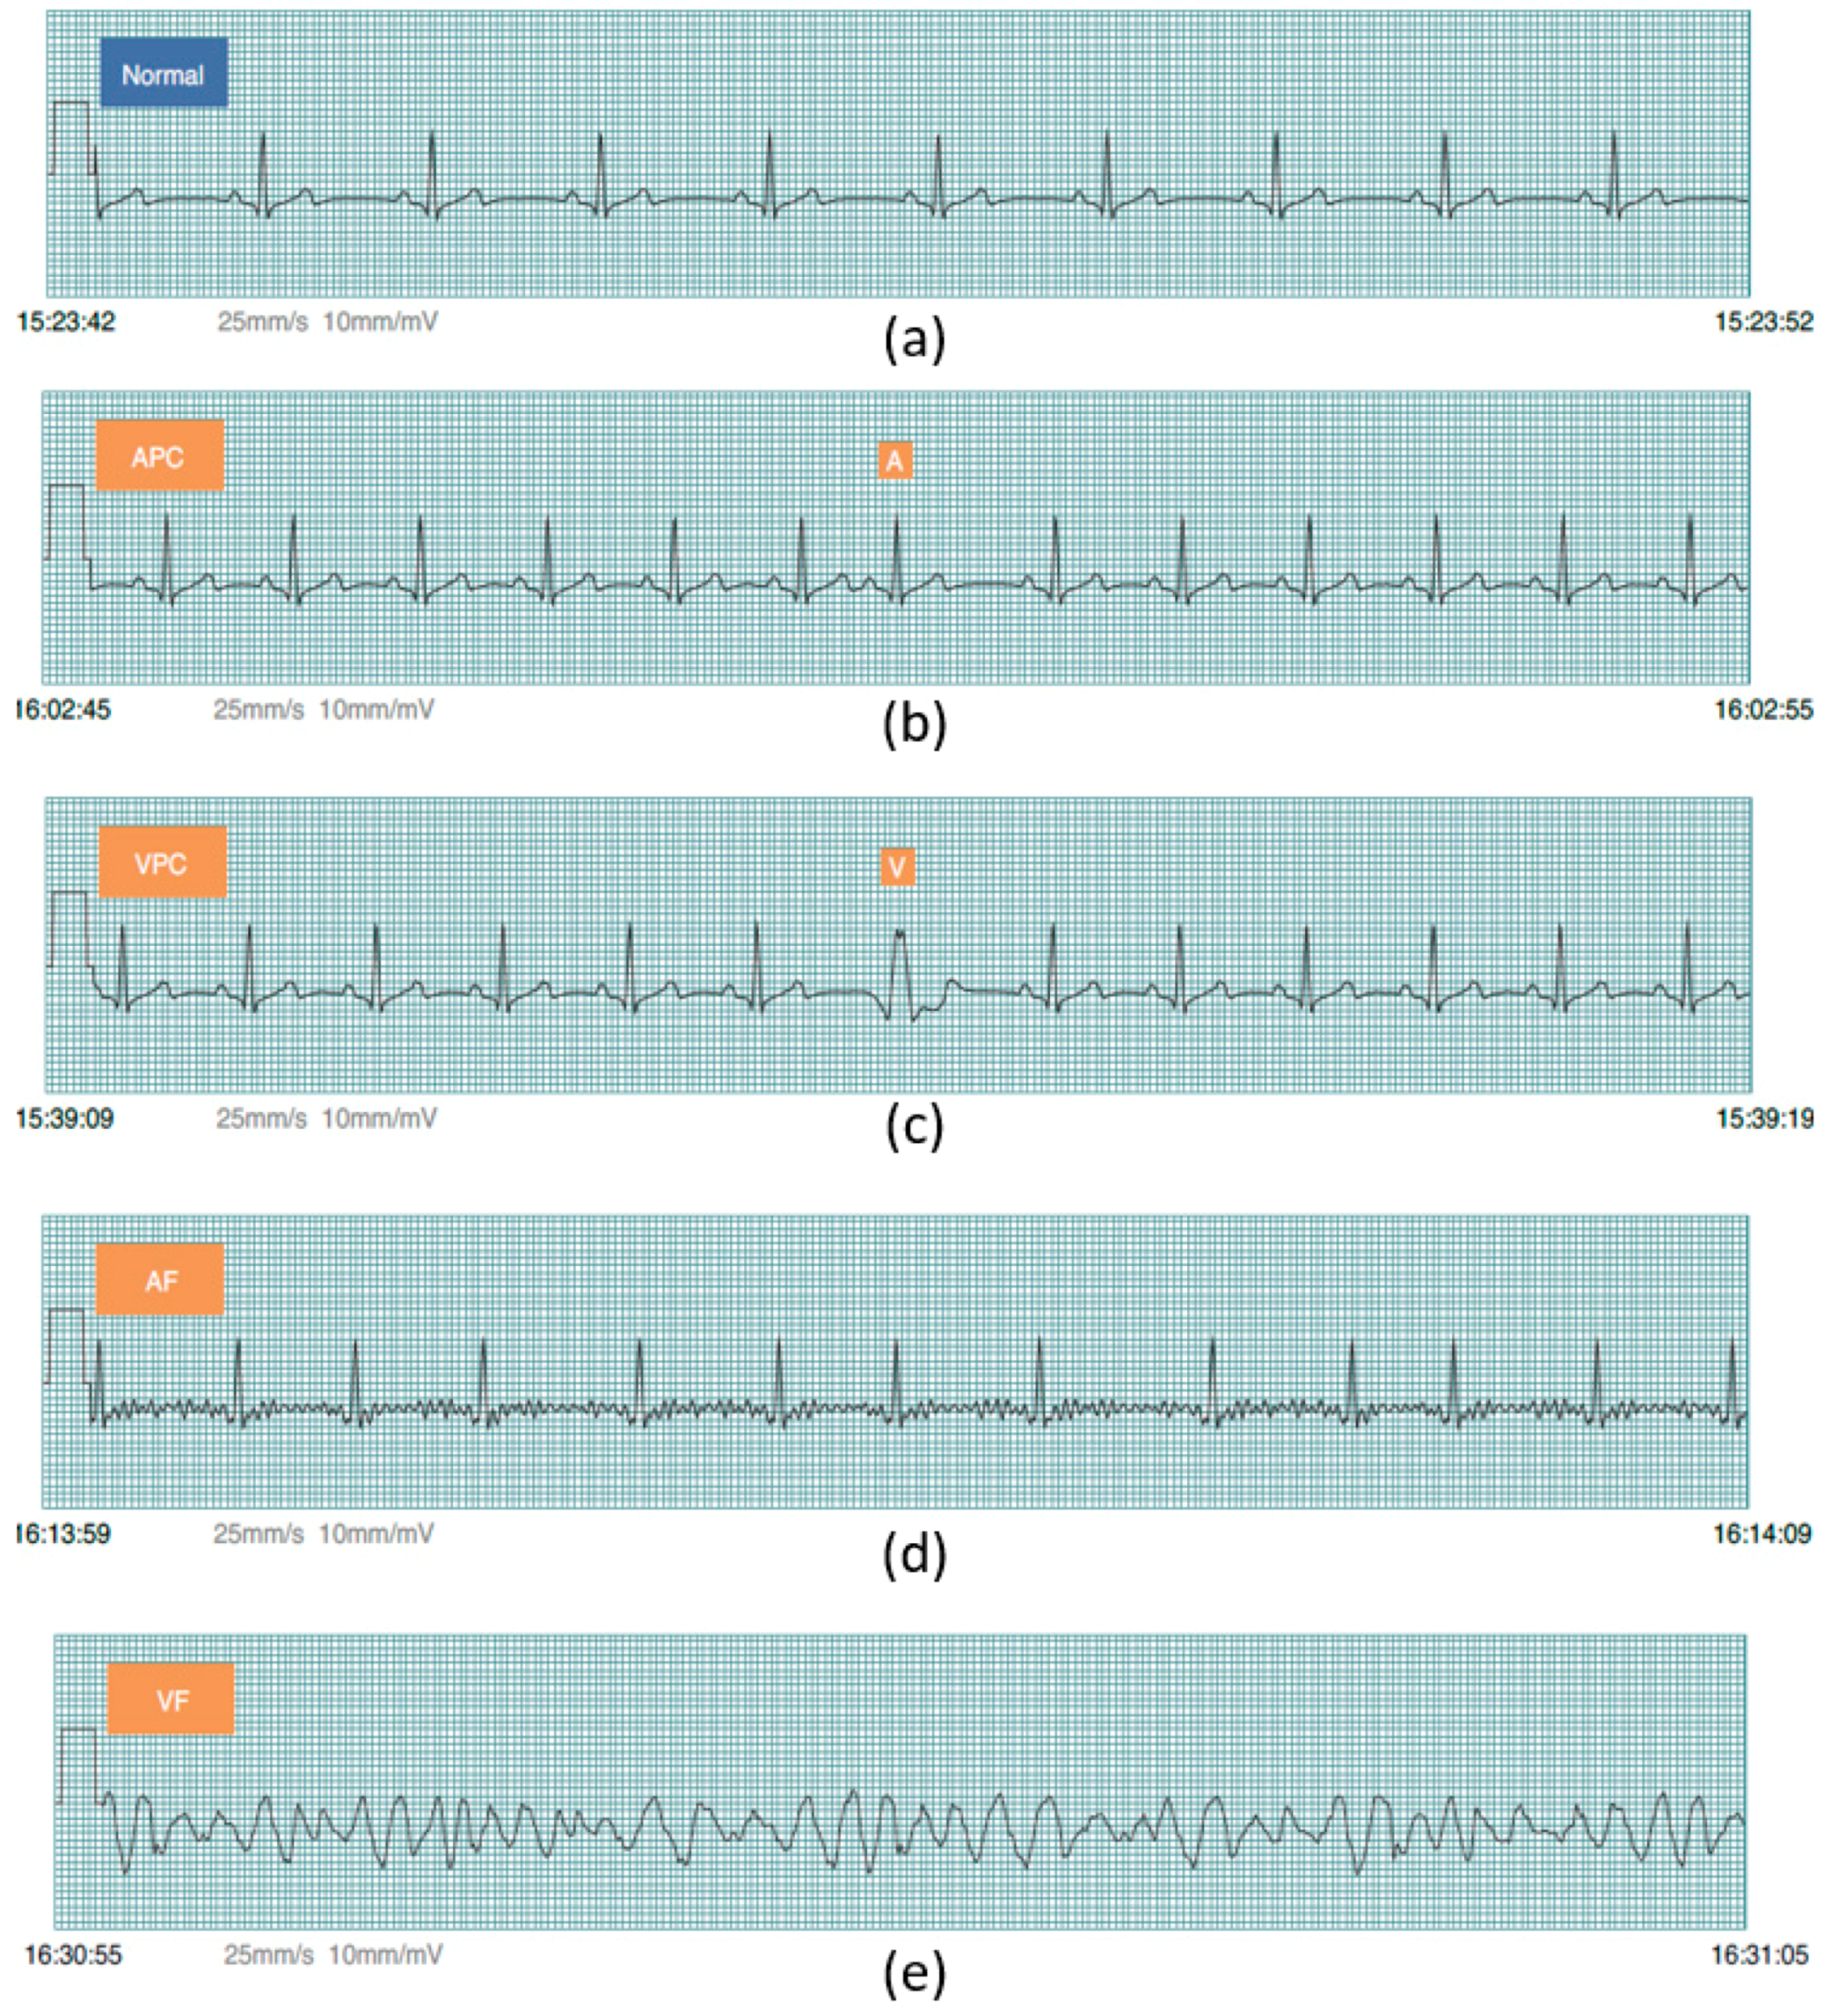
Figure 6.
The misclassified VF rhythm to a VPC beat.

Table 1.
The BC1 device specification.
| CMRR (Common-mode rejection ratio) | 80 dB (dc to 60 Hz) |
| High signal gain | (G = 100) with dc blocking capabilities |
| Single-supply operation | 2.0 V to 3.5 V |
| ADC (Analog-to-Digital Converter) | 12-bit |
| Input Impedance | 5 Giga Ohm |
Table 2.
The entire supraventricular ectopic beat (SVEB) (i.e., APC) and ventricular ectopic beat (VEB) (i.e., VPC) evaluation result. (* = exclude records 2202, 8205; ** = exclude records 102, 104, 107, 217; N/A: not available. Se = Sensitivity, +P = Positive predictivity and FPR = False positive rate).
| Database | Statistics | SVEB | VEB | ||||
|---|---|---|---|---|---|---|---|
| Se | +P | FPR | Se | +P | FPR | ||
| AHADB * | Gross | N/A | N/A | N/A | 89.75 | 96.08 | 0.371 |
| Average | N/A | N/A | N/A | 86.52 | 84.67 | 0.458 | |
| MITDB ** | Gross | 79.87 | 67.14 | 1.323 | 93.10 | 95.65 | 0.321 |
| Average | 71.35 | 36.9 | 2.098 | 87.27 | 73.26 | 0.336 | |
| NSTDB | Gross | N/A | N/A | N/A | 83.22 | 45.79 | 10.180 |
| Average | N/A | N/A | N/A | 58.17 | 50.86 | 9.032 | |
Table 3.
The entire atrial fibrillation (AF) and VF evaluation result. (* = exclude records 2202, 8205; ** = exclude records 102, 104, 107, 217; N/A: not available. ESe = Episode sensitivity, E + P = Episode positive predictivity, DSe = Duration sensitivity, D + P = Duration positive predictivity).
Table 3.
The entire atrial fibrillation (AF) and VF evaluation result. (* = exclude records 2202, 8205; ** = exclude records 102, 104, 107, 217; N/A: not available. ESe = Episode sensitivity, E + P = Episode positive predictivity, DSe = Duration sensitivity, D + P = Duration positive predictivity).
| Database | Statistics | AF | VF | ||||||
|---|---|---|---|---|---|---|---|---|---|
| ESe | E + P | DSe | D + P | ESe | E + P | DSe | D + P | ||
| AHADB * | Gross | N/A | N/A | N/A | N/A | 90 | 95 | 28 | 97 |
| Average | N/A | N/A | N/A | N/A | 94 | 69 | 33 | 70 | |
| MITDB ** | Gross | 62 | 100 | 92 | 92 | 100 | 75 | 69 | 88 |
| Average | 70 | 100 | 85 | 86 | 100 | 33 | 69 | 33 | |
| CUDB | Gross | N/A | N/A | N/A | N/A | 83 | 90 | 32 | 94 |
| Average | N/A | N/A | N/A | N/A | 84 | 83 | 40 | 84 | |
Table 4.
The SVEB (i.e., APC) and VEB (i.e., VPC) result comparison.
| Sensitivity (%) | Positive Predictivity (%) | False Positive Rate (%) | ||||
|---|---|---|---|---|---|---|
| This Study | De Chazal et al. [44] | This Study | De Chazal et al. [44] | This Study | De Chazal et al. [44] | |
| SVEB | 79.87 | 75.9 | 67.14 | 38.5 | 1.323 | 4.7 |
| VEB | 93.1 | 77.7 | 95.65 | 81.9 | 0.321 | 1.2 |
Table 5.
The AF and VF result comparison. (N/A = not available).
| Arrhythmia | Studies | Database | Number of Data | Evaluation | |||||
|---|---|---|---|---|---|---|---|---|---|
| Gross Statistics | Se | +P | |||||||
| ESe | E + P | DSe | D + P | ||||||
| Atrial Fibrillation | Proposed study | MITDB | 44 | 62 | 100 | 92 | 92 | N/A | N/A |
| Young et al. [45] | 12 | N/A | N/A | N/A | N/A | 97.7 | 86.77 | ||
| Ventricular Fibrillation | Proposed study | AHADB | 78 | 90 | 95 | 28 | 97 | N/A | N/A |
| Park et al. [46] | 11 | N/A | N/A | 98.1 | 99.1 | N/A | N/A | ||
| Proposed study | MITDB | 44 | 100 | 75 | 69 | 88 | N/A | N/A | |
| Park et al. [46] | 1 | N/A | N/A | 88.5 | 86.3 | N/A | N/A | ||
| Proposed study | CUDB | 35 | 83 | 90 | 32 | 94 | N/A | N/A | |
| Moraes et al. [47] | 30 | N/A | N/A | N/A | N/A | 70.32 | 64.66 | ||
Table 6.
The proposed integrated algorithm evaluation time in PC and smartphone for the MIT-BIH Arrhythmia database.
Table 6.
The proposed integrated algorithm evaluation time in PC and smartphone for the MIT-BIH Arrhythmia database.
| Record | Smartphone (s) | PC (s) | Record | Smartphone (s) | PC (s) |
|---|---|---|---|---|---|
| 100 | 40.975 | 3.638 | 203 | 41.699 | 3.891 |
| 101 | 40.964 | 3.508 | 205 | 43.084 | 4.167 |
| 103 | 41.256 | 3.653 | 207 | 42.842 | 3.625 |
| 105 | 41.337 | 4.747 | 208 | 43.104 | 4.454 |
| 106 | 41.028 | 4.404 | 209 | 43.124 | 4.075 |
| 108 | 40.916 | 3.194 | 210 | 41.366 | 3.780 |
| 109 | 41.146 | 3.400 | 212 | 42.986 | 3.794 |
| 111 | 41.131 | 3.077 | 213 | 43.163 | 4.284 |
| 112 | 41.239 | 2.716 | 214 | 42.557 | 3.266 |
| 113 | 40.822 | 2.623 | 215 | 43.226 | 3.502 |
| 114 | 41.064 | 2.716 | 219 | 41.539 | 2.901 |
| 115 | 40.980 | 2.361 | 220 | 42.468 | 2.883 |
| 116 | 41.361 | 2.909 | 221 | 41.376 | 2.924 |
| 117 | 40.698 | 2.404 | 222 | 42.292 | 3.393 |
| 118 | 41.143 | 4.853 | 223 | 42.831 | 3.643 |
| 119 | 41.020 | 2.702 | 228 | 42.581 | 4.730 |
| 121 | 41.003 | 2.942 | 230 | 42.579 | 3.656 |
| 122 | 41.278 | 3.073 | 231 | 42.252 | 3.605 |
| 123 | 40.672 | 2.799 | 232 | 41.961 | 3.719 |
| 124 | 41.001 | 3.200 | 233 | 44.042 | 5.681 |
| 200 | 40.861 | 4.761 | 234 | 43.96 | 5.239 |
| 201 | 41.831 | 3.406 | Sum | 1840.791 | 158.013 |
| 202 | 42.033 | 3.718 | Mean | 41.836 | 3.591 |
| STD | 0.942 | 0.771 |
Table 7.
The study evaluation time comparison in personal computer (PC) and smartphone for the MIT-BIH Arrhythmia database. (N/A = not available).
Table 7.
The study evaluation time comparison in personal computer (PC) and smartphone for the MIT-BIH Arrhythmia database. (N/A = not available).
| Study | Arrhythmia | Device Evaluation Time (S) | |
|---|---|---|---|
| Smartphone | PC | ||
| Proposed study | Normal, APC, VPC, AF, VF | 1840.791 | 158.013 |
| Chakroborty et al. [48] | Normal, APC, VPC, LBBB, RBBB | N/A | 6875.3 |
© 2017 by the authors. Licensee MDPI, Basel, Switzerland. This article is an open access article distributed under the terms and conditions of the Creative Commons Attribution (CC BY) license (http://creativecommons.org/licenses/by/4.0/).
Share and Cite
MDPI and ACS Style
Sadrawi, M.; Lin, C.-H.; Lin, Y.-T.; Hsieh, Y.; Kuo, C.-C.; Chien, J.C.; Haraikawa, K.; Abbod, M.F.; Shieh, J.-S. Arrhythmia Evaluation in Wearable ECG Devices. Sensors 2017, 17, 2445. https://doi.org/10.3390/s17112445
AMA Style
Sadrawi M, Lin C-H, Lin Y-T, Hsieh Y, Kuo C-C, Chien JC, Haraikawa K, Abbod MF, Shieh J-S. Arrhythmia Evaluation in Wearable ECG Devices. Sensors. 2017; 17(11):2445. https://doi.org/10.3390/s17112445
Chicago/Turabian StyleSadrawi, Muammar, Chien-Hung Lin, Yin-Tsong Lin, Yita Hsieh, Chia-Chun Kuo, Jen Chien Chien, Koichi Haraikawa, Maysam F. Abbod, and Jiann-Shing Shieh. 2017. "Arrhythmia Evaluation in Wearable ECG Devices" Sensors 17, no. 11: 2445. https://doi.org/10.3390/s17112445
Note that from the first issue of 2016, this journal uses article numbers instead of page numbers. See further details here.