Highly Sensitive FPW-Based Microsystem for Rapid Detection of Tetrahydrocannabinol in Human Urine
by

Je-Wei Lan
1, 
Chia-Hsu Hsieh
1,
I-Yu Huang
1,
Yu-Cheng Lin
2,
Tsung-Yi Tsai
1 and
Chua-Chin Wang
1,* 1
Department of Electrical Engineering, National Sun Yat-sen University, Kaohsiung 80424, Taiwan
2
Department of Engineering Science, National Cheng Kung University, Tainan 70101, Taiwan
*
Author to whom correspondence should be addressed.
Sensors 2017, 17(12), 2760; https://doi.org/10.3390/s17122760
Submission received: 13 October 2017
/
Revised: 21 November 2017
/
Accepted: 23 November 2017
/
Published: 29 November 2017
(This article belongs to the Special Issue Bio-MEMS for Precision Medicine)
Abstract
:This paper presents a highly sensitive flexural plate-wave (FPW)-based microsystem for rapid detection of tetrahydrocannabinol (THC) in human urine. First, a circular-type interdigital transducer (IDT) was integrated with a circular-type silicon-grooved reflective grating structure (RGS) to reduce insertion loss. Then, with lower insertion loss (−38.758 dB), the FPW device was used to develop a novel THC biosensor, and the results reveal that this FPW-THC biosensor has low detection limit (1.5625 ng/mL) and high mass-sensitivity (126.67 cm2/g). Finally, this biosensor was integrated with field-programmable gate array (FPGA) board and discrete components for prototyping a FPW readout system, whose maximum error was 12.378 kHz to ensure that the linearity of detection up to R-square is equal to 0.9992.
1. Introduction
Drug abuse and addiction have been serious health and social problems in recent years, which also lead to a high crime rate [1,2]. Among all illegal drugs in Taiwan, marijuana is the most controversial one, which affects human both mentally and physically [3]. For example, smoking marijuana will cause increased heartbeat, lowered blood pressure, blunted short-term memories, and lost focus. Therefore, a reliable, effective, and portable screening microsystem used in early detection will certainly reduce, or even prevent, drug abuse and addiction. Tetrahydrocannabinol (THC) is the main ingredient of marijuana, an active chemical in cannabis, and one of the oldest hallucinogenic drugs ever known. Notably, detecting THC concentration is important as well as carcinoembryonic antigen (CEA) concentration for diseases or tumors related to lung, liver, stomach, colorectal, and breast, etc.
Urinanalysis is the main drug testing method among which enzyme-linked immunosorbent assay (ELISA) techniques [4], surface plasmon resonance (SPR) [5], high performance liquid chromatography (HPLC) [6,7] and gas chromatography-mass spectrometry (GC-MS) [8,9,10] are mostly used. Although these four technologies present high sensitivity and accuracy, their expensive instruments, large dimensions, time-consuming sample pretreatment, and lack of real-time monitoring functions limit their applications. To solve the above issues, acoustic sensors have been developed for molecular mass detection in the last two decades [11,12,13,14,15], including thickness shear mode (TSM), surface acoustic wave (SAW), shear horizontal acoustic plate mode (SH-APM), and flexural plate-wave (FPW). Table 1 qualitatively summarizes the characteristics of the four sensor families discussed. For biosensing application in contact with liquid, there are some points to be concerned: (1) high mass sensitivity; (2) particle motions are transverse only, or have phase velocities lower than the speed of sound in the liquid to avoid the energy dissipation; and (3) low operating frequency for easy detecting circuit design. Among the three points concerned above, the FPW sensor is the most suitable for biosensing applications since it has high mass sensitivity at low operating frequency Thus, it is used as the biosensor in this paper.
This paper presents a FPW-based biosensor for rapid detection of THC antigen in urine by using micro-electromechanical systems (MEMS) and cystamine-glutaraldehyde-based self-assembled monolayers (SAMs) technologies. To further justify the detection architecture, this biosensor needs a readout system. Wang et al. reported a high-precision readout system based on FPW sensors, where the resonant frequency shift is proportional to CEA concentration [16]. However, the input range of operational amplifier (OPA) requires at least 20 MHz bandwidth, and using too many OPAs result in higher power consumption and larger layout area. To resolve the bandwidth problem, we used an amplitude to voltage converter (AVC), and since the output DC voltage of AVC is proportional to the amplitude of the input signal, the filter of the previous design composed of OPAs is no longer required.
2. Fabrication of FPW-Based THC Biosensor and Design of Readout System Circuit
2.1. Fabrication of FPW-Based THC Biosensor
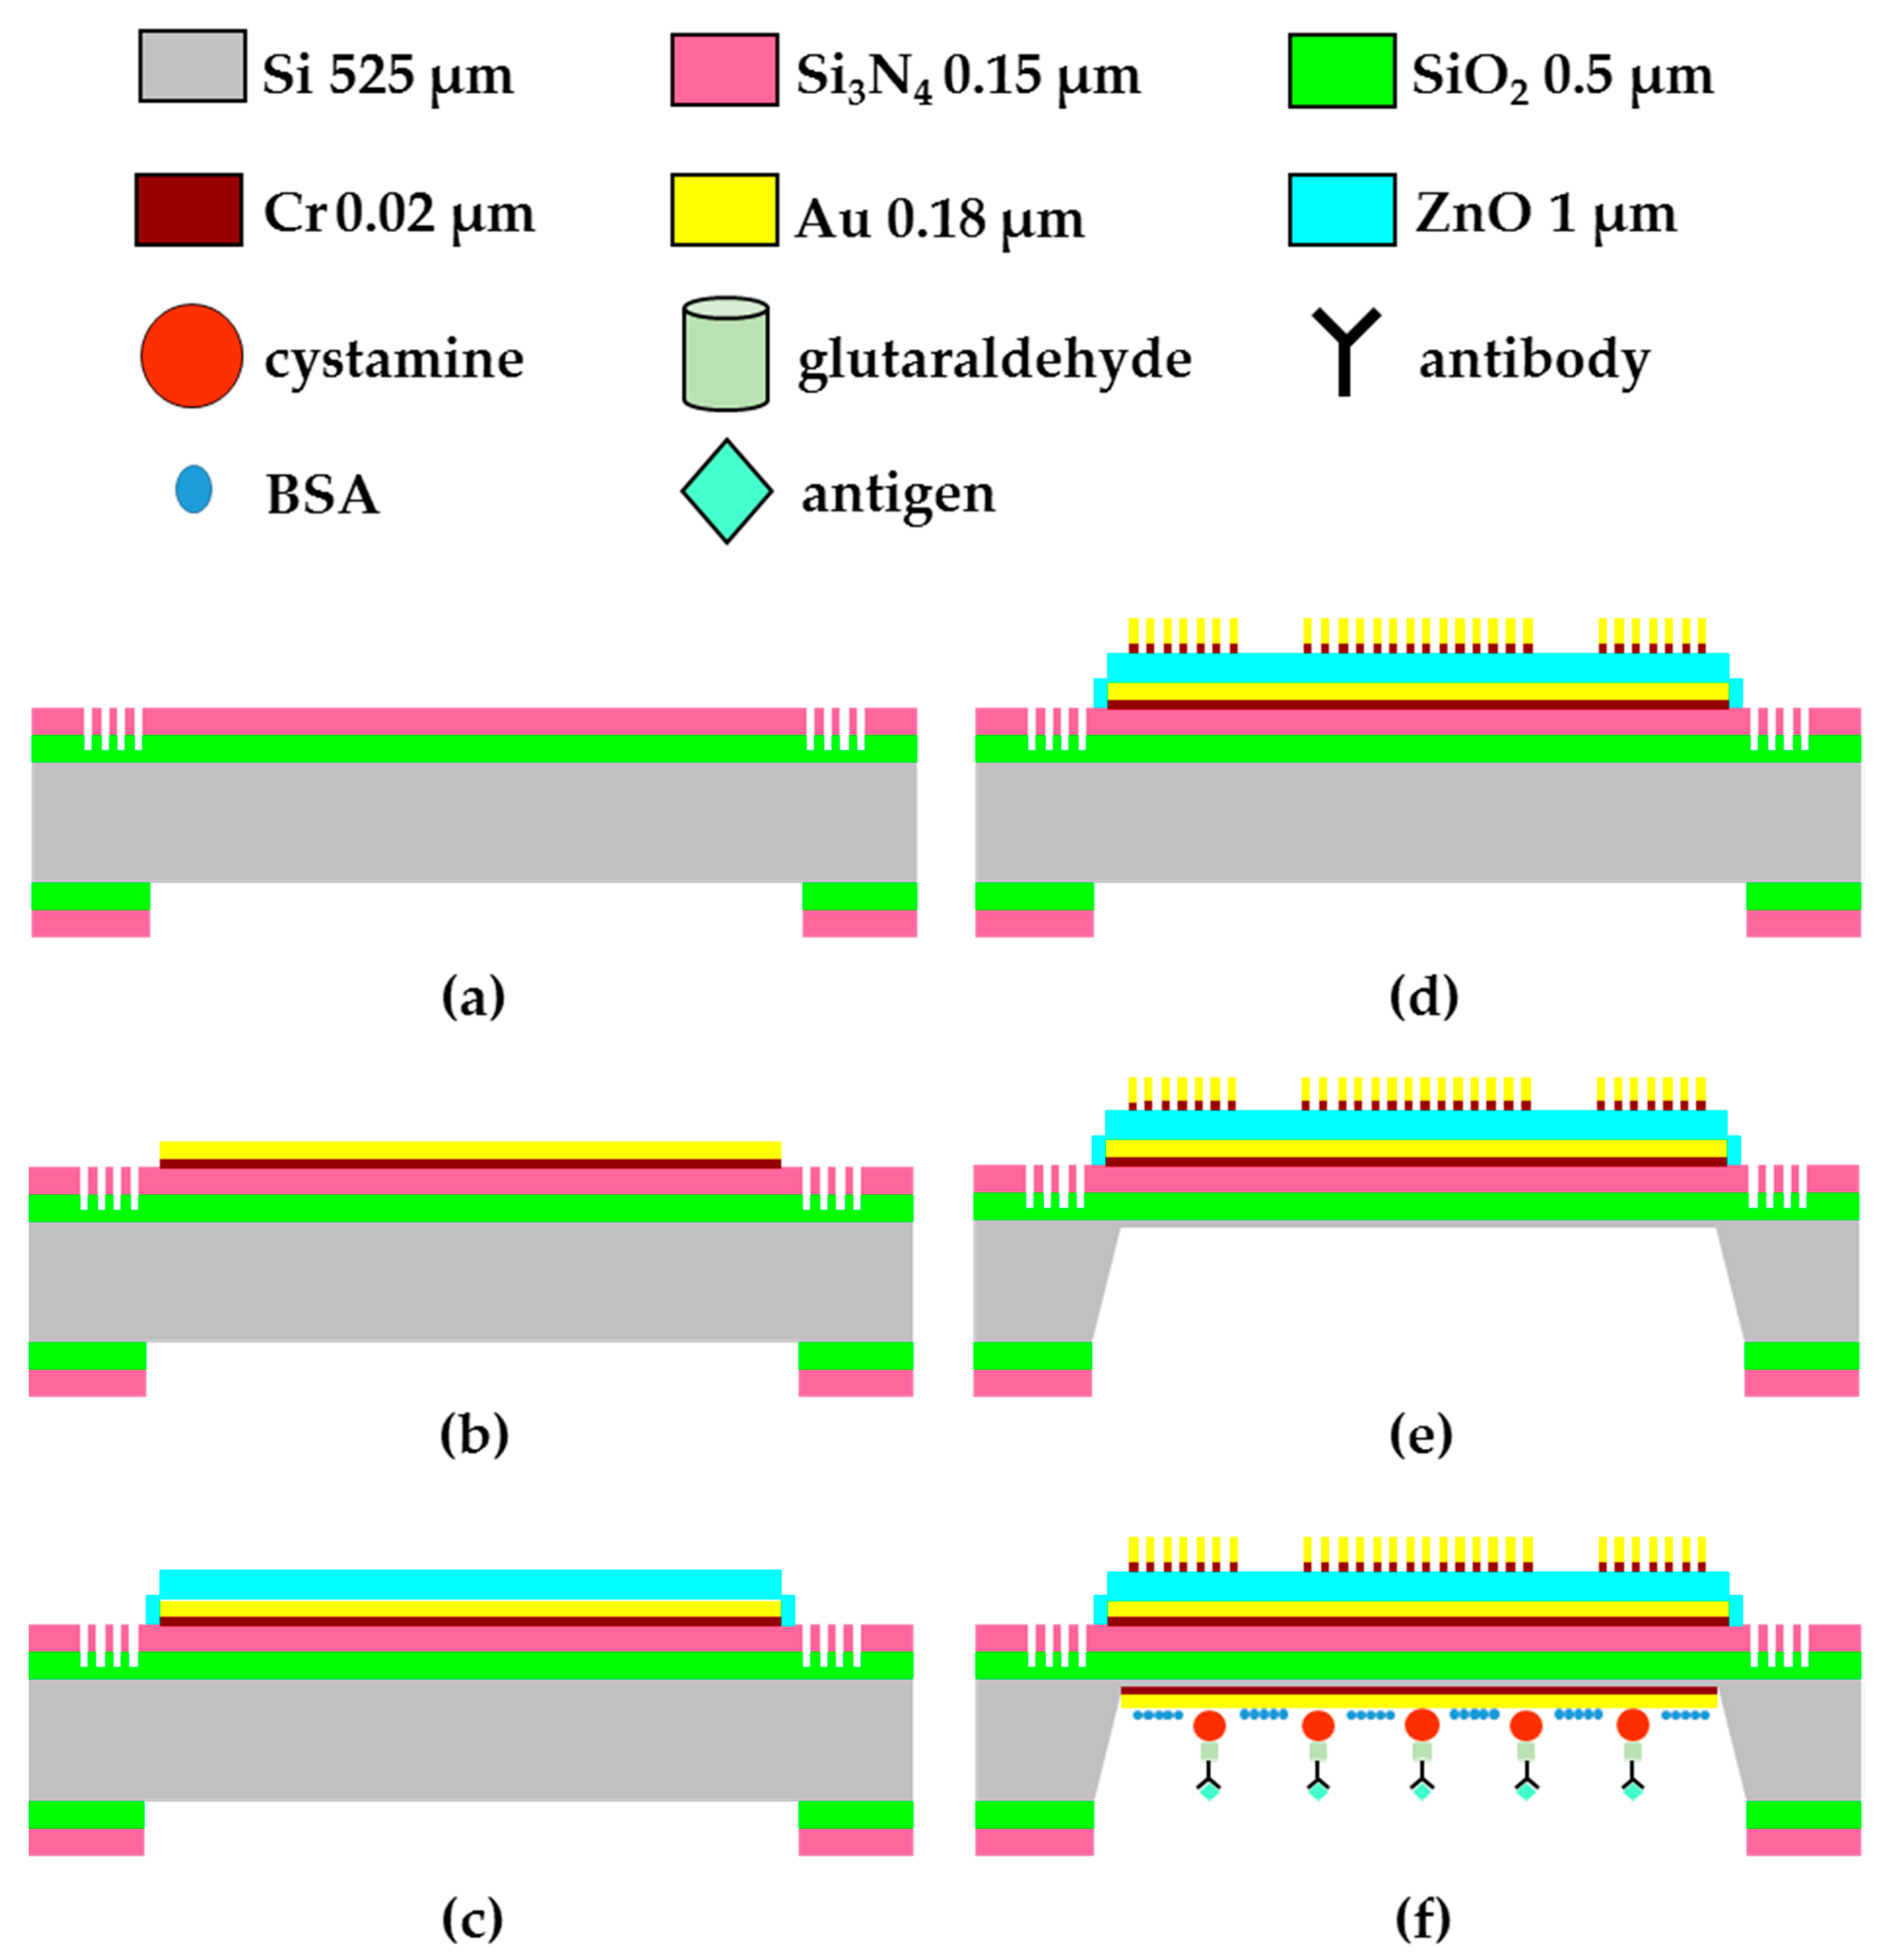
The main processing steps of the FPW transducer are shown in Figure 1: (a) deposit SiO2/Si3N4 (0.5/0.15 μm), etch Si-groove RGS (0.3 μm), and pattern backside SiO2/Si3N4; (b) deposit and pattern Cr/Au (0.02/0.15 μm) ground electrode; (c) deposit and pattern ZnO (1 μm); (d) deposit and pattern Cr/Au (0.02/0.18 μm) IDTs; (e) etch the backside silicon by using 30 wt % KOH at 60 °C and 30 wt % KOH at 27 °C; (f) the THC antibody has to be coated on the back-side silicon cavity to catch the THC antigen in urine. For the detailed manufacturing process flows, please refer to [17].
Figure 2 presents the final configurations of the FPW-based biosensor and the integrated cystamine SAM/glutaraldehyde/THC antibody/THC antigen multilayer. SAMs technology is used in the gold (Au) surface with cysteine dialdehyde method (cystamine-glutaraldehyde method) for chemical adsorption, since SAMs have high stability, simple fabrication, and variability of terminal functional groups, and are widely used for the ideal surface of basic scientific research and biological surface science. Cystamine is a solution of molecular compounds with a sulphurated group at one end and with an amine group, NH2, at the other end. The sulphurated group bonds to the Au electrode surface to form a covalent bond [18,19,20]. Glutaraldehyde is an organic compound with aldehyde (−CHO) at the both ends, and its main function is to bridge between cystamine and protein antibodies.
The experimental procedure of the cystamine-glutaraldehyde method is as follows. (1) Immerse the wafer in 20 mM cystamine solution for 1 h and clean with DI water. (2) Immerse the wafer in glutaraldehyde solution for 1 h and clean with DI water. (3) Titrate 10 μL of THC antibody solution onto the upper surface of the Au electrode, which is then exposed to a temperature of 27 °C and a relative humidity of 100% RH for 1 h. The wafer was then cleaned with wash buffer, PBS, and DI water. (4) Titrated 20 μL of BSA solution on the upper surface of the Au electrode, and after a 30-min reaction, the surface is cleaned with wash buffer, PBS, and DI water. (5) Titrated 10 μL of THC urine specimens at six different concentrations (1.5625, 3.125, 7.25, 12.5, 25, and 50 ng/mL) on the upper surface of the Au electrode for measurement.
2.2. FPW Readout System Circuit Design
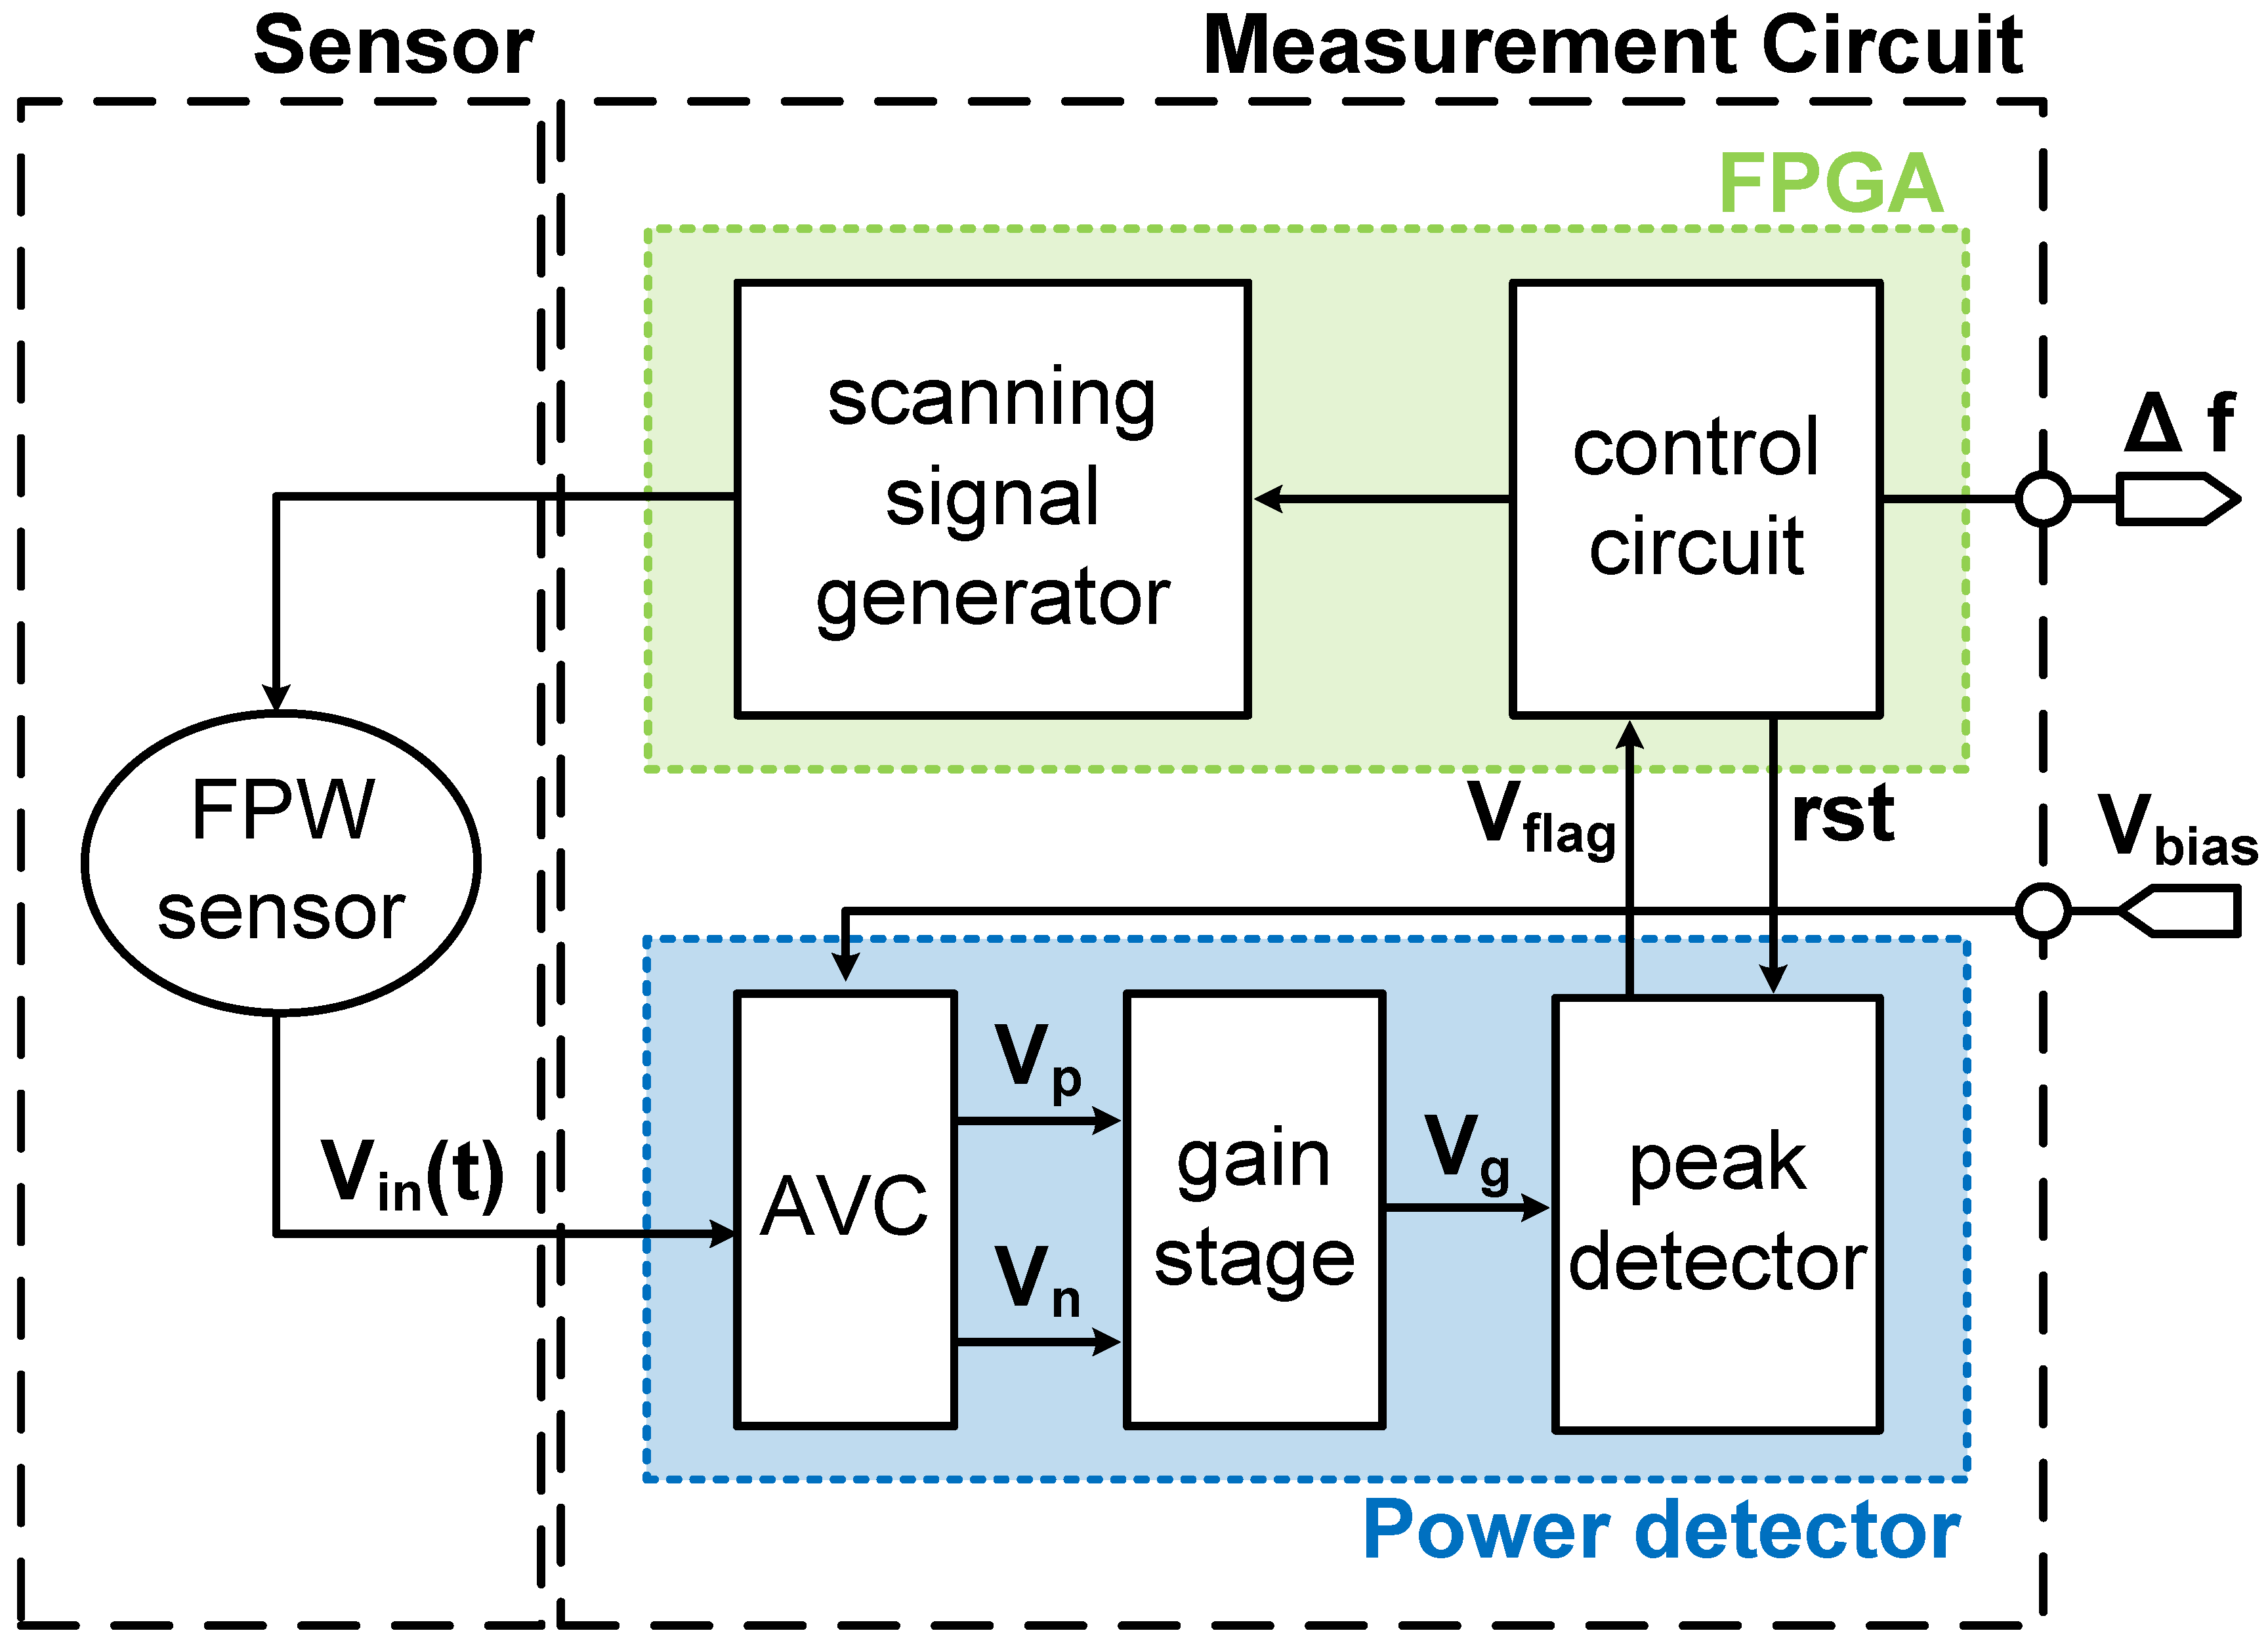
The proposed FPW readout system, as shown in Figure 3, is mainly divided into two parts: the sensor and the measurement circuit. The measurement circuit was composed of a scanning signal generator, and control circuit (FPGA), AVC, gain stage, and peak detector (power detector). Note that the scanning signal generator and control circuit were implemented by FPGA to ensure reliability. The scanning signal generator generated sinusoidal waves with various frequency, which was used as the testing resonance frequency. Featured with that of the input signal and with the resonance frequency, the FPW sensor generated a corresponding output with the highest amplitude. The amplitude to voltage converter (AVC) then transformed AC signals into DC voltages, Vp and Vn. The DC voltages were enlarged in gain stage, and a peak detector [21,22,23,24,25] monitored the output DC voltage Vg, where Vflag was generated to control circuit when the maximum was detected. Note that all the mentioned procedures were calibrated in test cycles. When the FPW sensor detected different concentrations of marijuana, the corresponding Vin(t) with different frequencies was also detected in the following test cycles. Finally, the control circuit calculated the different resonant frequencies through two test cycles.
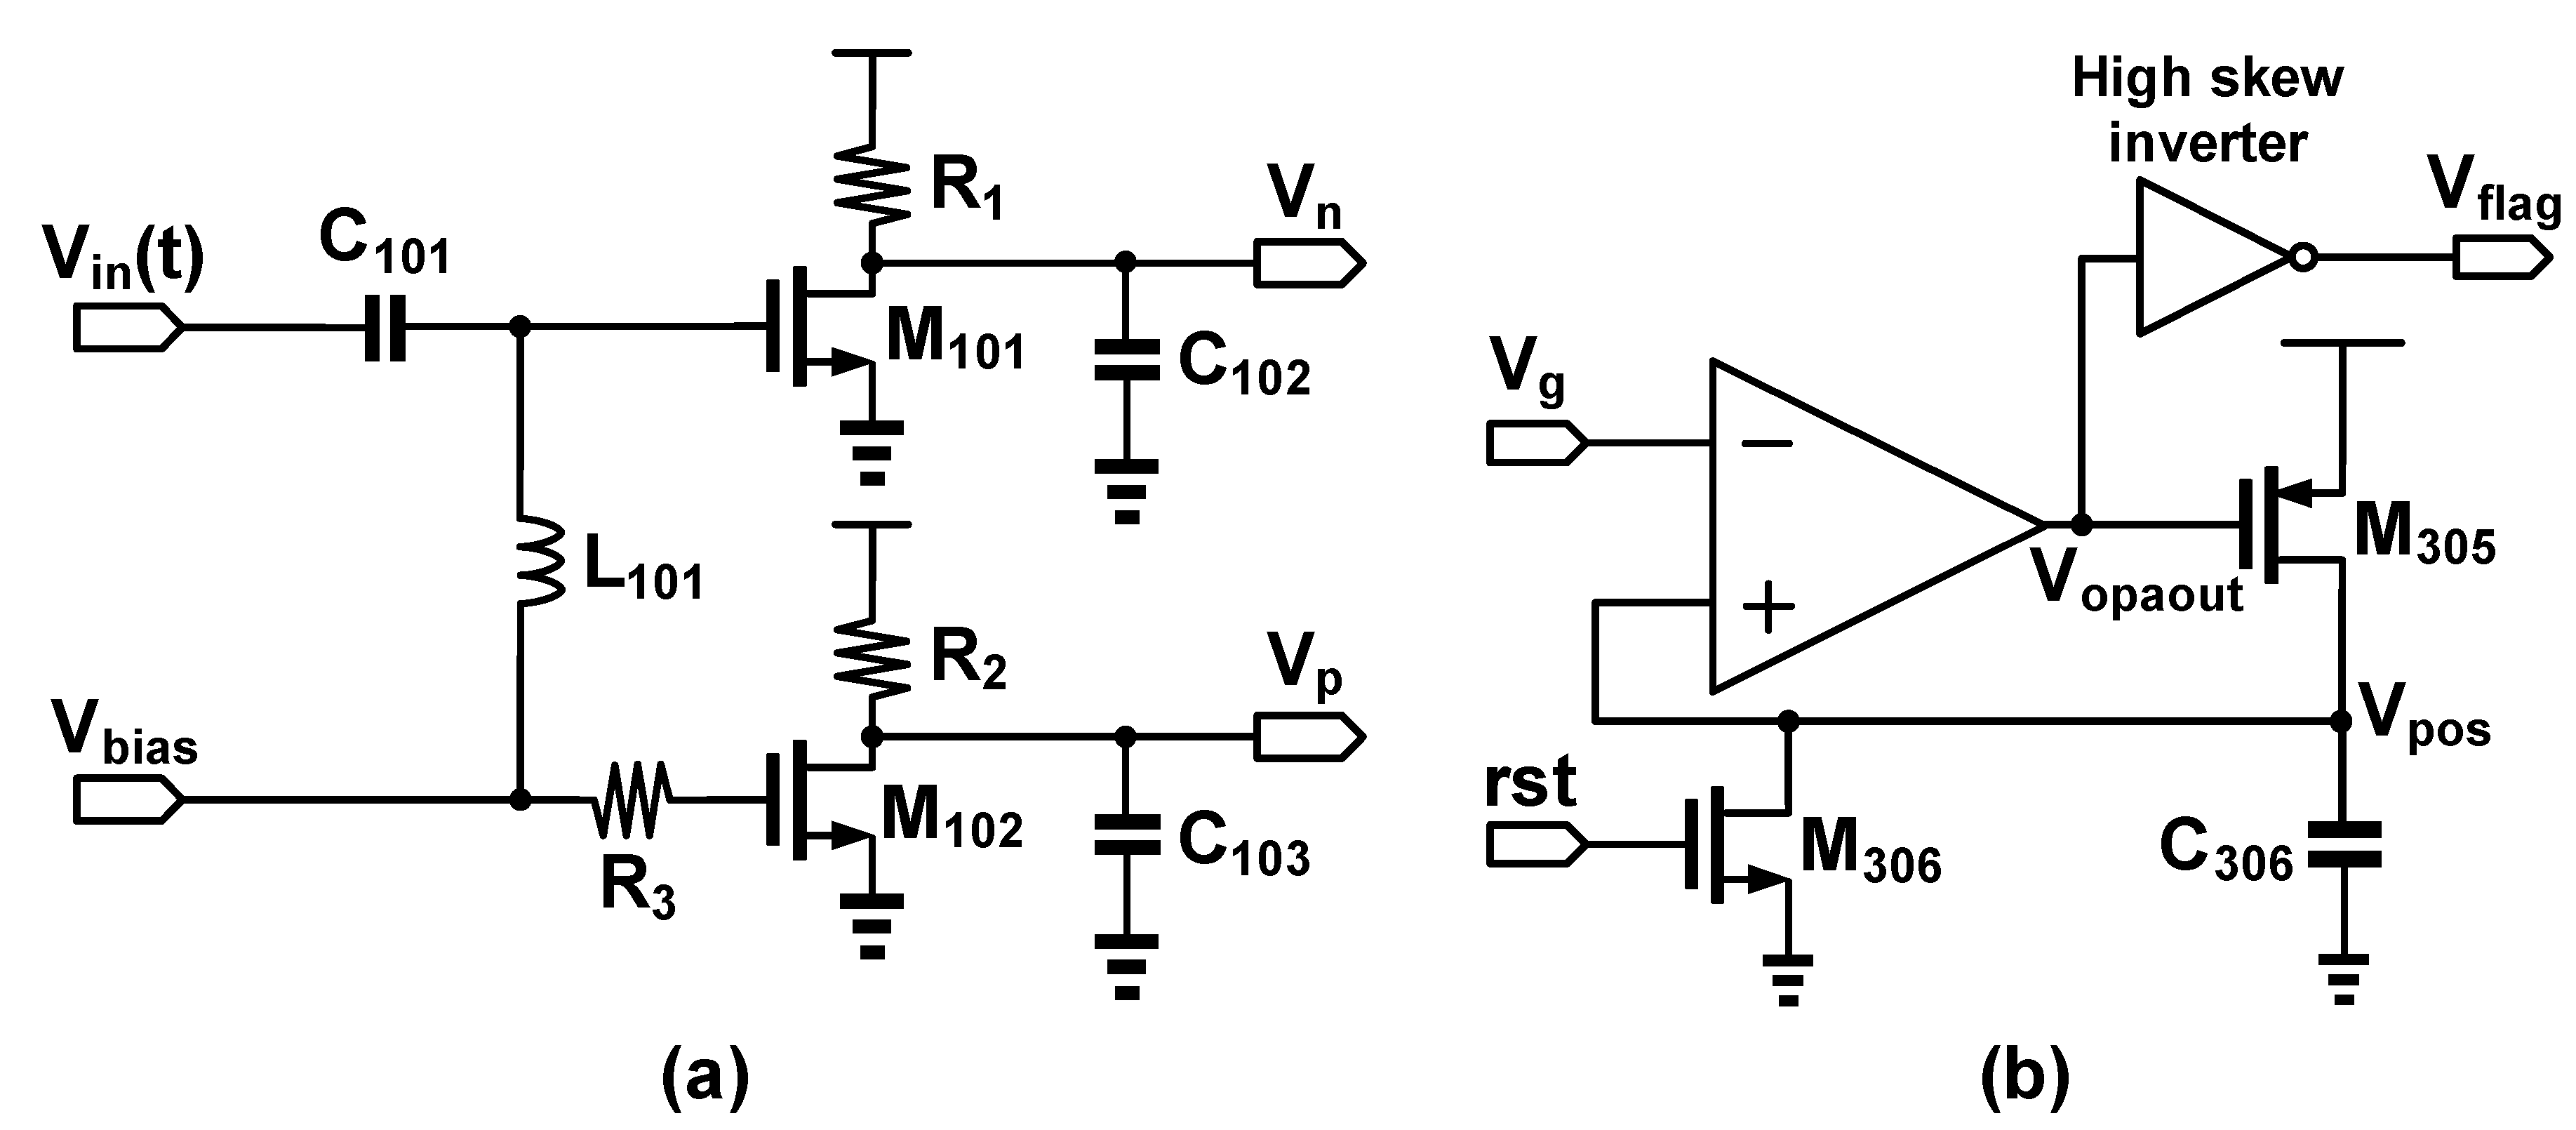
The schematic of AVC, as shown in Figure 4a, has a large capacitor C101 filtering out the DC component of Vin(t). Vbias is used to bias M101 and M102 into saturation region, since Vin(t) is a relatively small signal. L101 is an inductor to isolate AC signal ripples coupled from the upper circuit. Note that the combination of R1 and C102, and R2 and C103 act as a low pass filter for DC voltages, Vn and Vp, respectively, where Vp is a constant voltage level and Vn is a voltage level corresponding to input signal amplitude by contrast. Gain stage comprises two circuits, namely, OPA-based subtractor and OPA-based amplifier. The subtractor generates the difference, Vg, between Vn and Vp, while the amplifier enlarges Vg which is then coupled to the peak detector.
Figure 4b presents the schematic of the peak detector composed of an OPA, a high skew inverter, a capacitor, and two transistors. When Vg is larger than Vpos, Vopaout turns on M305 to charge C306. However, charging C306 raises the voltage level of Vpos and leads to a negative feedback mechanism. Once if Vg is smaller than Vpos, Vopaout is pulled up toward VDD to pull down Vflag. Therefore, a new peak voltage is detected. Note that M306 is used to reset the voltage level of C306 at the beginning of any detection.
2.3. Preparation of the THC Urine Specimens
This study uses THC urine specimen which was prepared by the following procedures. First, we put 100 μL of THC stock solution (at 100 ng/mL concentration) into a 1.7 mL microcentrifuge tube, and then added 100 μL of negative urine solution into the tube. Finally, we mixed the urine and the THC solution well to prepare 50 ng/mL THC urine specimens for experiment. We also used the serial dilution to prepare THC urine specimens of 25, 12.5, 7.25, 3.125, and 1.5625 ng/mL concentrations.
3. Experimental Results and Analysis
3.1. Characterization of the Proposed FPW-Based THC Biosensor
A commercial Cascade RHM-06/V probe station and Agilent E5074 (Beaverton, OR, USA) network analyzer were used to measure the center frequency of the developed FPW device at room temperature. Two Cascade coplanar 150 ground–signal–ground (GSG) input probes were connected to the input and output IDTs of the FPW devices. As shown in Figure 5, the circular-type FPW devices have low insertion loss (−38.758 dB), low center frequency (25.06 MHz), and their signal-to-noise ratios are higher than those of conventional FPW devices.
The solid-state mass-sensitivity of the FPW devices was also investigated. Five different thicknesses of Al thin-film (from 1000 to 5000 Å and the thickness of pitch is 1000 Å) were deposited onto the surface of backside silicon to measure the changes of frequency. As shown in Figure 6, given the five different Al mass (from 27 to 135 μg/cm2 and each interval is 27 μg/cm2), the frequency shift of the circular FPW device is 39.33, 75.33, 95.0, 132.0, and 183.68 kHz, respectively. According to the reference [13], the mass loading of the floating thin plate, which causes change in resonant frequency—where denotes the center frequency of operation, denotes the change of the resonant frequency due to a change in mass per unit area (), and Sm is the mass sensitivity of the FPW device—is given by the equation
The mass-sensitivity of the proposed FPW devices of circular IDTs/RGS are 126.67 cm2/g, and thus have the same high sensing linearity (R-square is 0.9579), which is beneficial to develop its associate readout circuit.
Table 2 is the comparison between the four sensing characteristics (detection time, limit of detection, linear range, testing equipment size) in the optimum compositions and those in previous studies [4,7,26]. Although the prior biosensing system has a lower limit of detection, the implemented FPW-based THC biosensing system presents the fastest response time, the widest linear range and the smallest testing system size. Therefore, the proposed biosensing system is more reliable, effective, portable, and suitable for early detection of THC.
3.2. Measurement of FPW Readout System Prototype
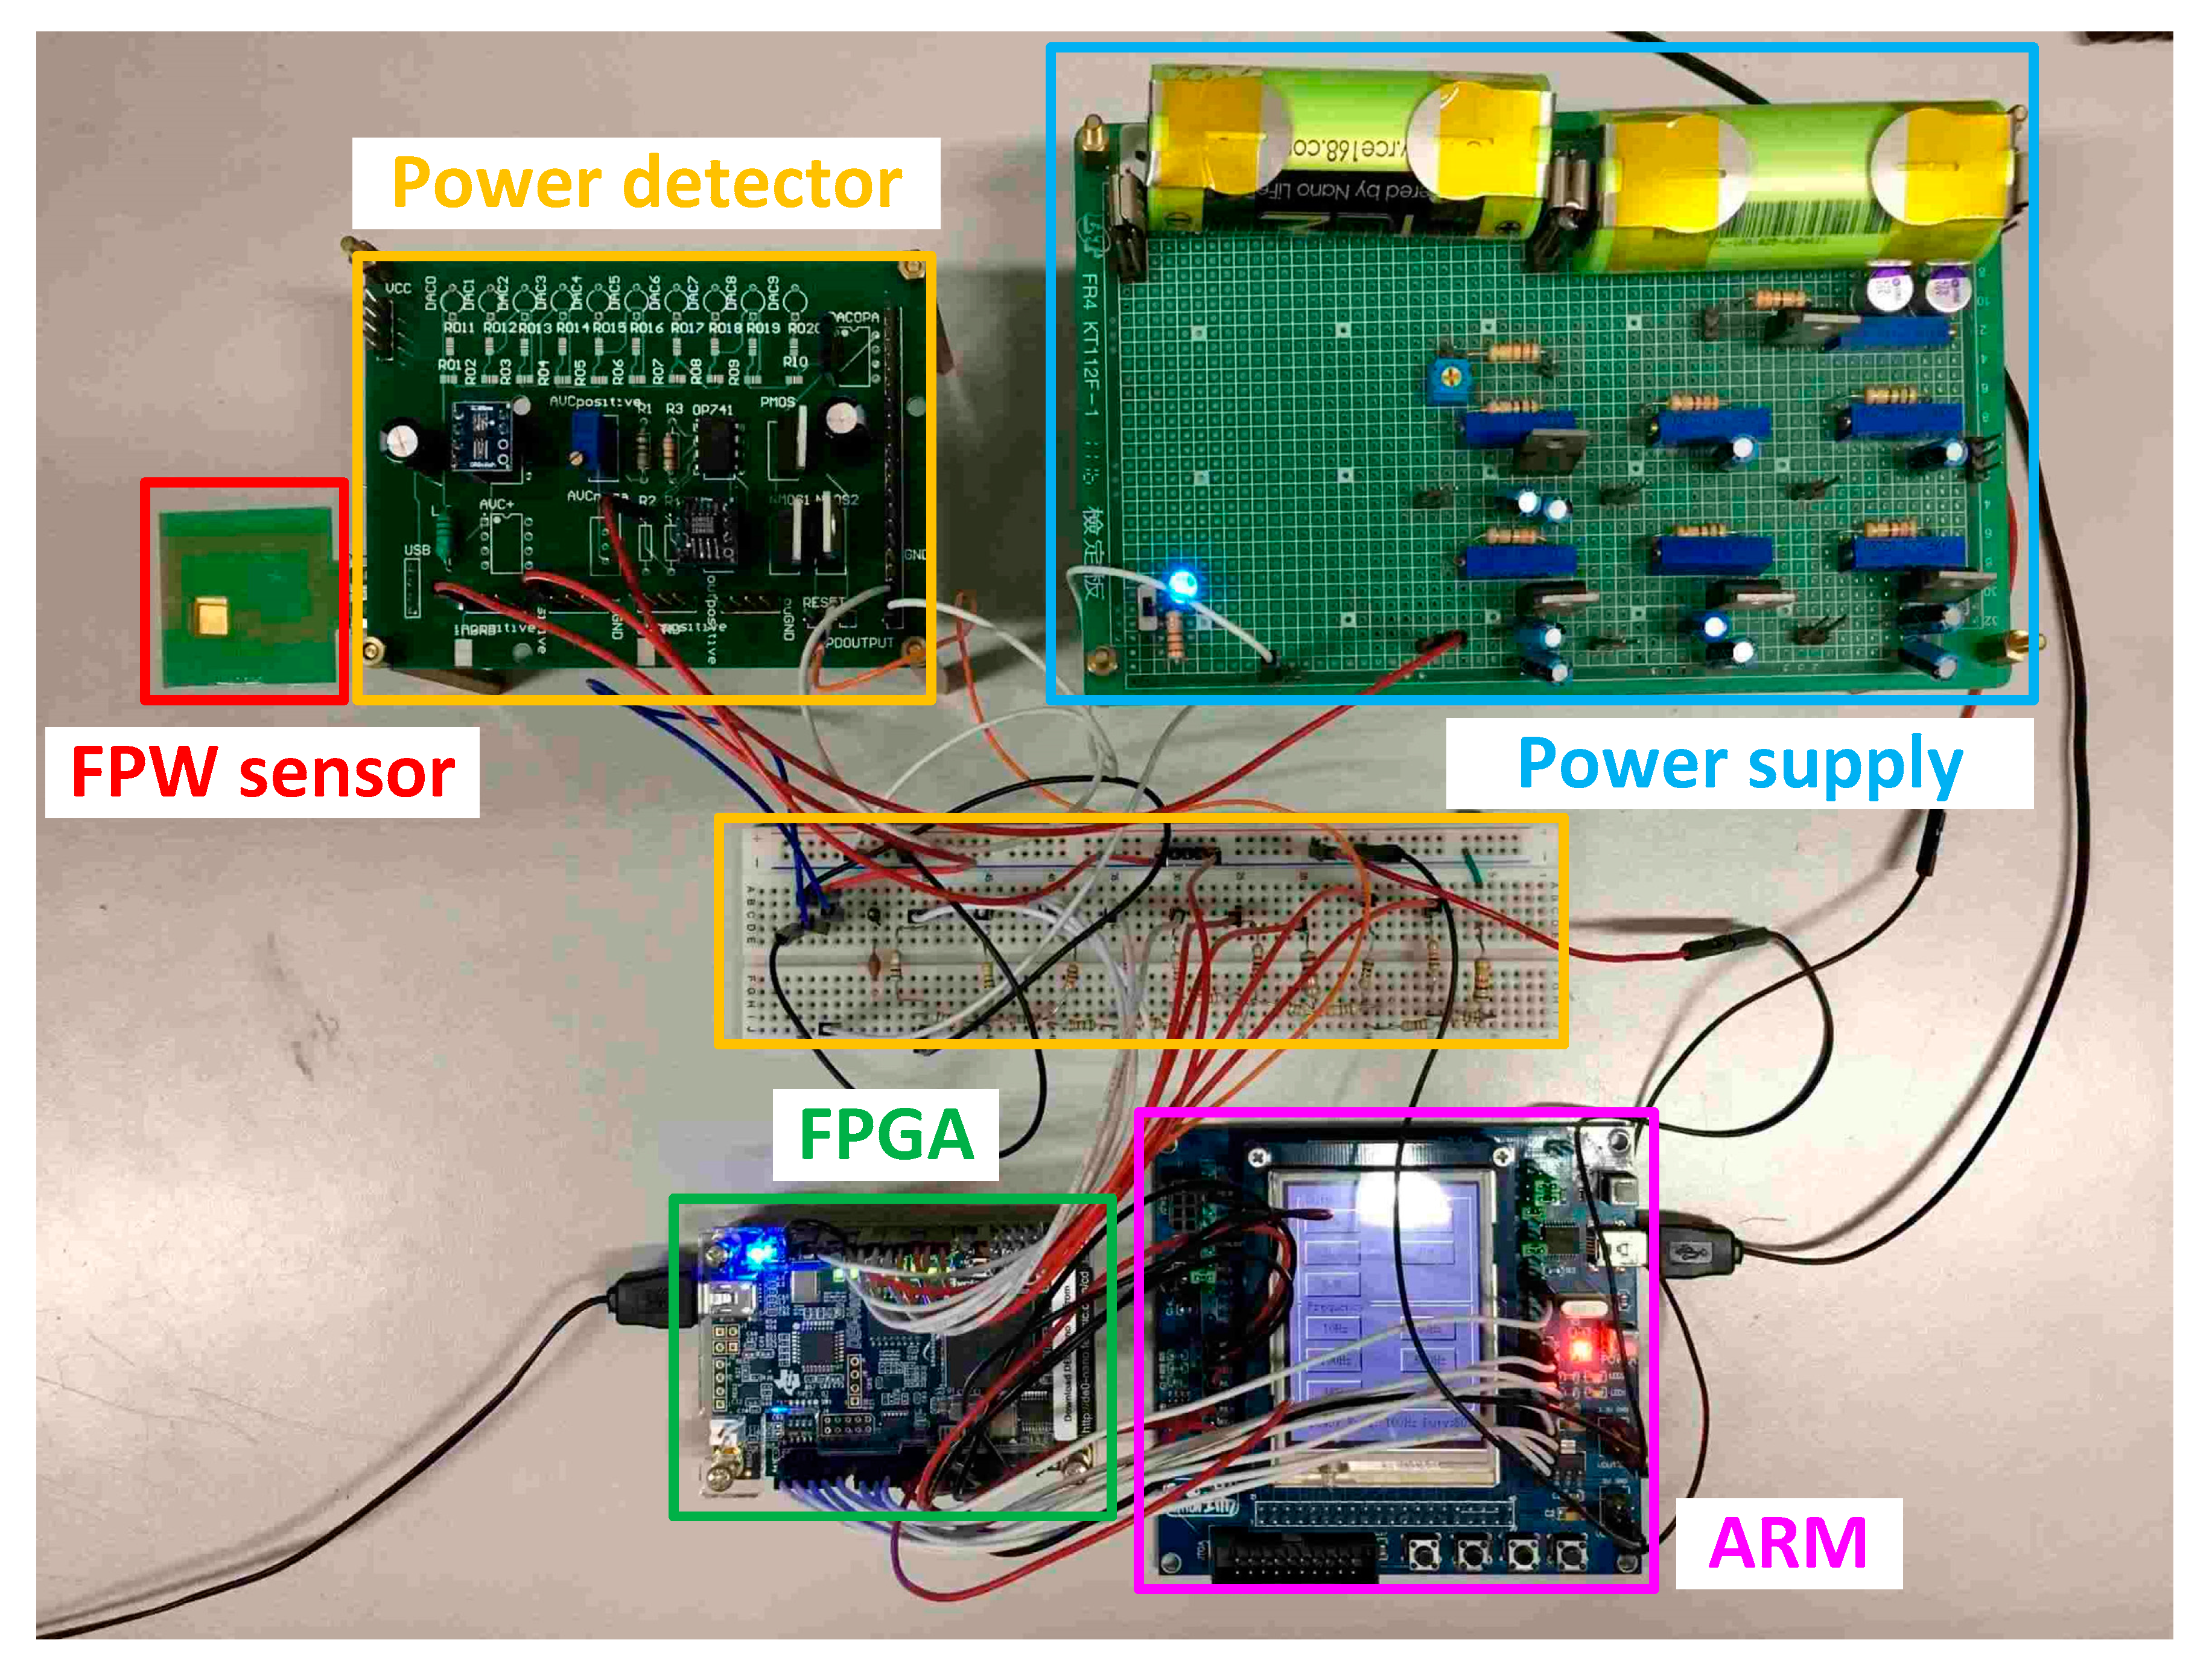
The FPW readout system prototype, as shown in Figure 7, is composed of a FPGA (control circuit and scanning signal generator), FPW sensor, power detector with discrete components (AVC, gain stage, and peak detector), and ARM board for displaying results. To increase the reliability, decoupling capacitors were coupled to restrain the noise; Li-ion batteries were also used in the power supply.
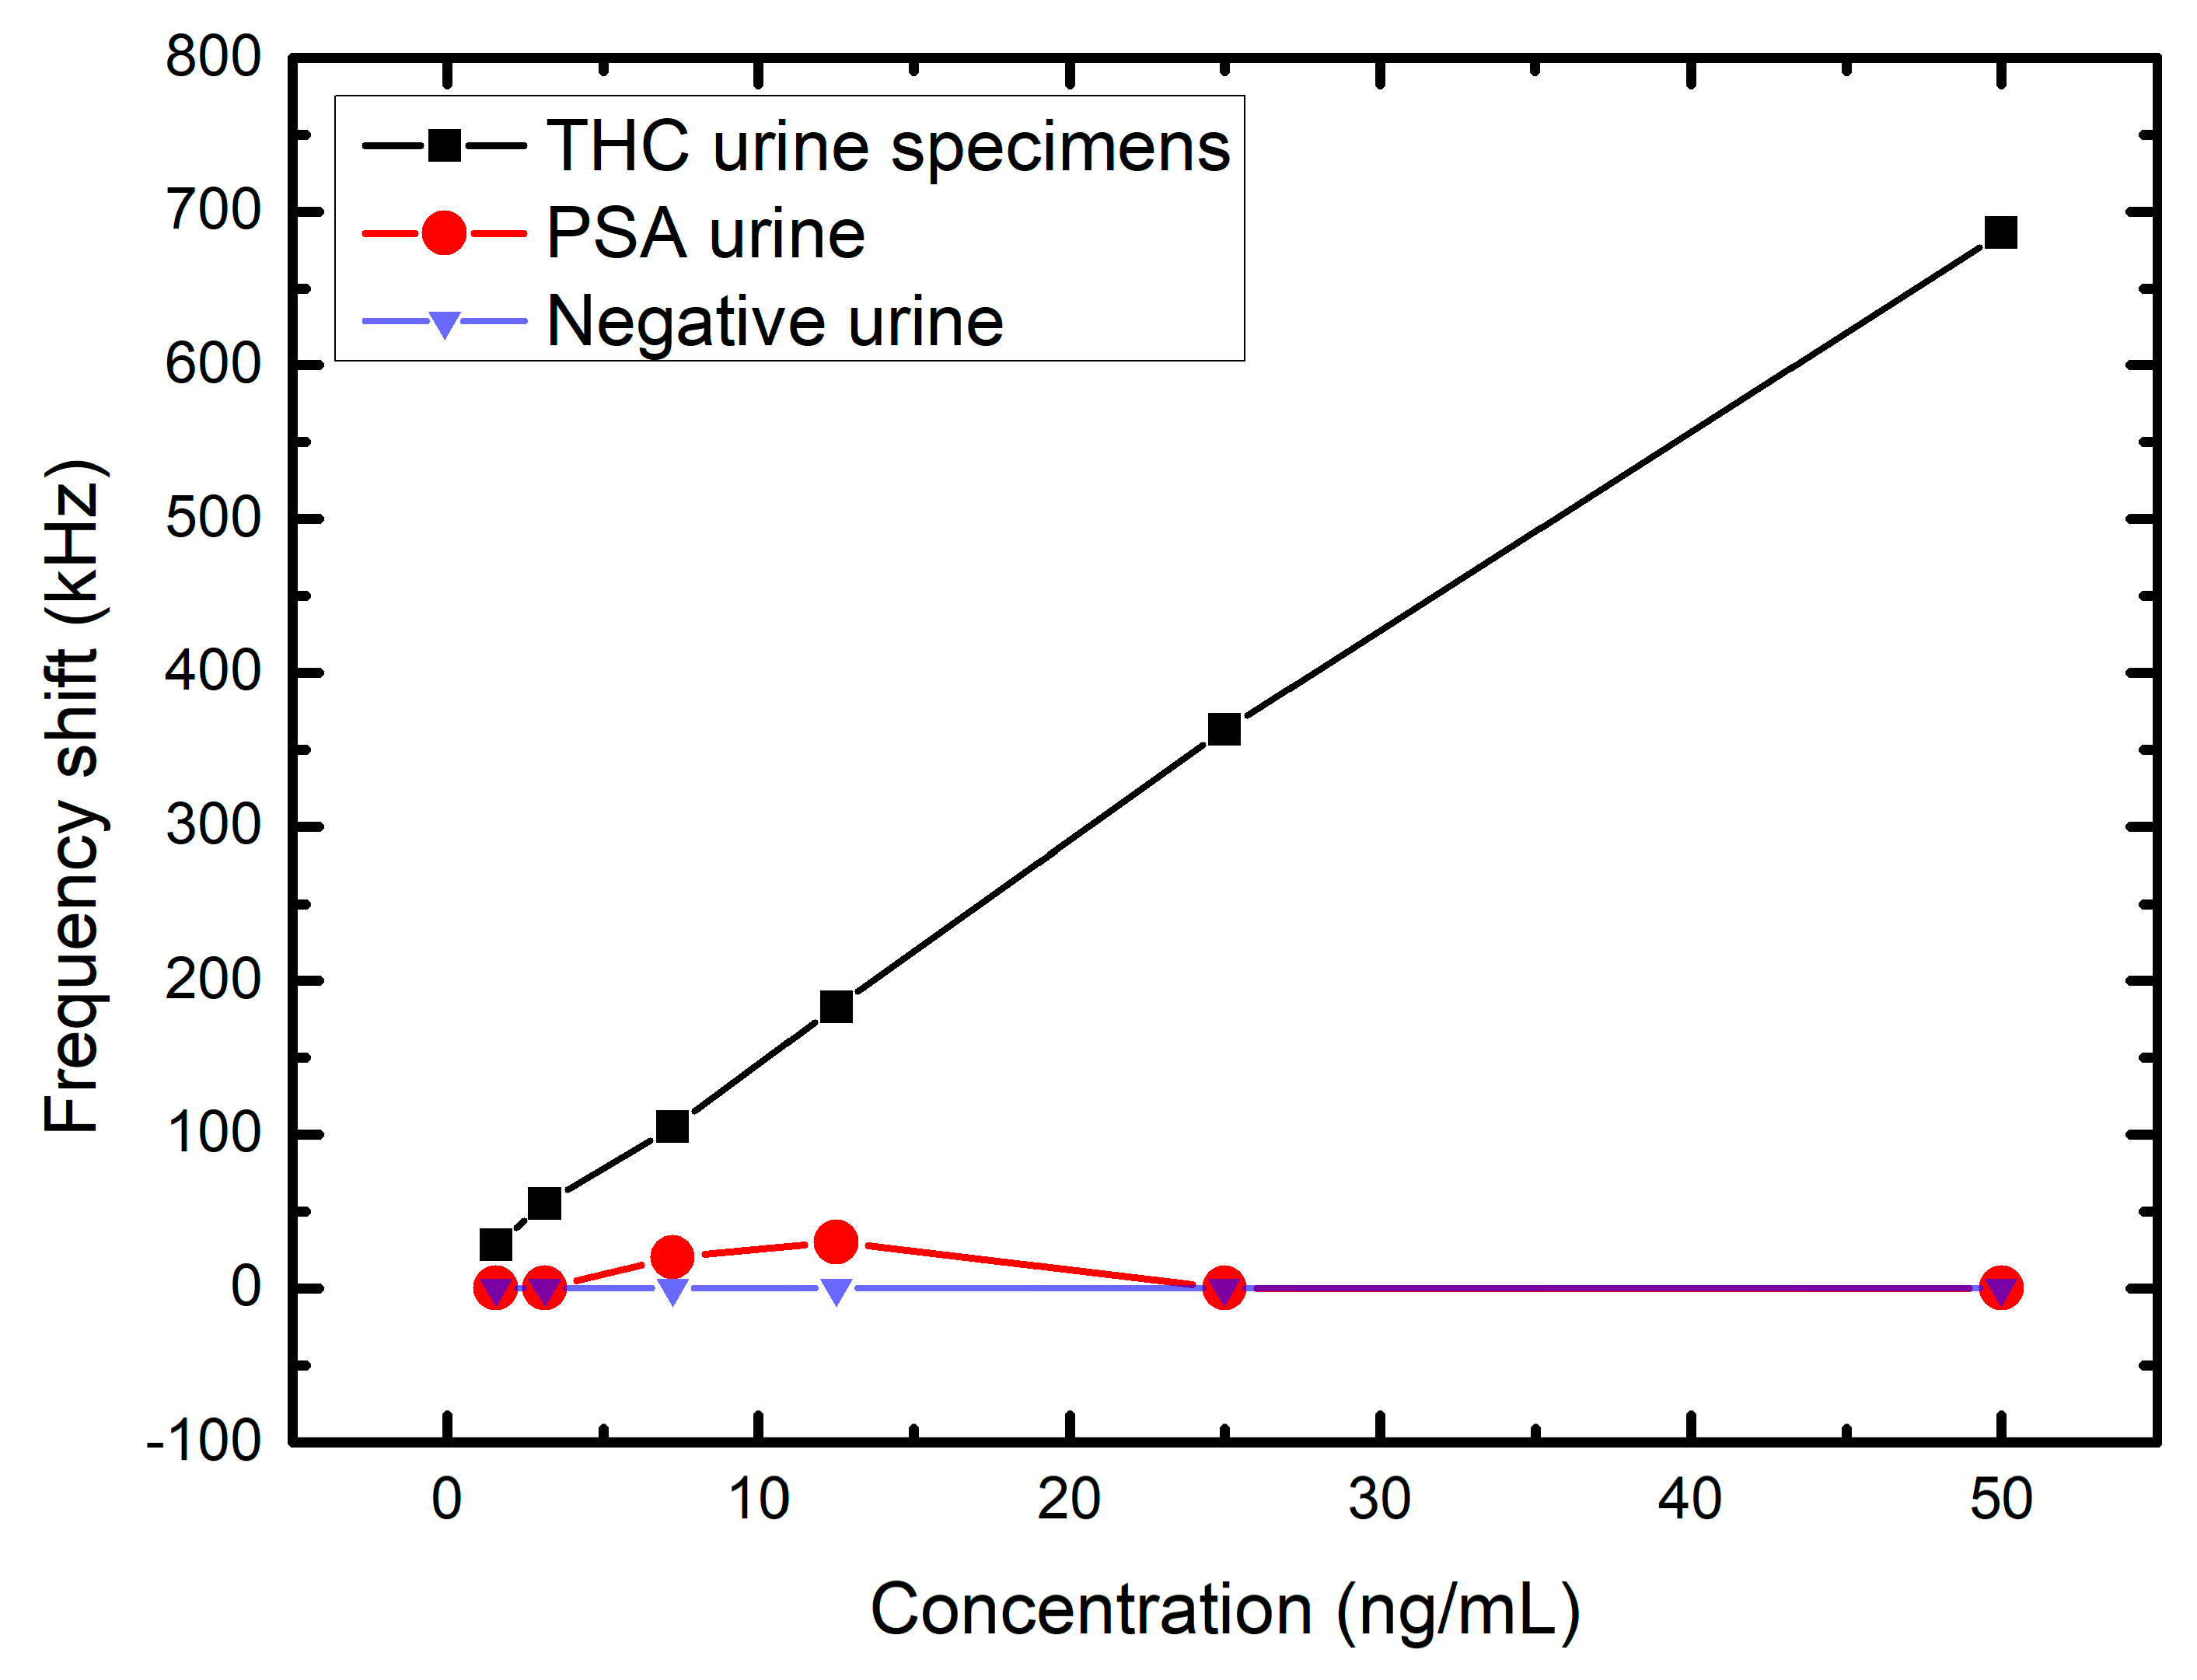
The output result of the FPW readout system prototype is shown in Figure 8 and Table 3, where six different concentration of THC urine specimens—e.g., 0, 1.5625, 3.125, 7.25, 12.5, 25, and 50 ng/mL—are measured. The y-axis is the measured average frequency shift (without the worst deviation data) of each concentration when the system is steady. The maximum error is 0.012 MHz and the linearity R-square is equal to 0.9992. The negative urine (without any protein or other biomolecules) is used as the negative control. As shown in Figure 9, the frequency shift is zero when the negative urine is measured. In additional, six different concentration of prostate specific antigen (PSA) urine are also measured in this paper, there are no frequency shift at 1.5625, 3.125, 25, and 50 ng/mL, and the frequency shifts are only 20–30 kHz at 7.25 and 12.5 ng/mL (which can be considered measurement errors). Notably, before every concentration is being tested, the FPW sensor will be rinsed first, and held until it dries out. Then the sensor is coated with THC antibody on the back-side silicon cavity again to ensure the precision of measurements.
The comparison between this work and the previous works [16,28] is shown in Table 4, where this work has the least error. Most important of all, only two OPAs (one in the gain stage and the other in the peak detector) are used, which effectively reduce the complexity in designing high bandwidth OPAs.
4. Conclusions
To reduce insertion loss of FPW devices, the circular-type IDTs/RGS configuration was proposed. Thanks to the low insertion loss (−38.758 dB) and low center frequency (25.06 MHz) of this novel device, development for a readout IC and bio-sensing microsystem can be easier. Additionally, a novel FPW-based THC biosensor was developed using MEMS and SAMs technologies. The realized FPW-THC biosensors have a low detection limit for THC antigen (1.5625 ng/mL), a short response time (<10 min), and a high mass-sensitivity (126.67 cm2/g for circular IDTs/RGS). Moreover, based on the developed FPW devices, the FPW readout system for THC detection was prototyped, and has been proven to attain higher linearity (R-square = 0.9992) and less OPAs (only 2). Thanks to the proposed AVC circuit, the coupling problems of AC and DC components were also resolved.
Acknowledgments
This investigation is partially supported by Ministry of Science and Technology under grant MOST 105-2622-E-006-018-CC2, MOST 105-2218-E-110-006, MOST 105-2221-E-110-080, and MOST 104-2622-E-006-040-CC2. The authors would like to express their deepest gratefulness to Chip Implementation Center of National Applied Research Laboratories, Taiwan, for their chip fabrication and EDA tool support. The authors are also indebted to the National Nano Device Laboratories (NDL) and National Sun Yat-sen University in Taiwan for their assistance in providing access to their processing facilities.
Author Contributions
Je-Wei Lan contributed to the specifications of FPW-based THC biosensor, the design and fabrication of the FPW devices, and the data analysis. I-Yu Huang proposed the idea of the novel FPW-based biosensor. Chia-Hsu Hsieh wrote the FPW-based biosensor sections of this manuscript. I-Yu Huang and Yu-Cheng Lin provided an internal review. Chua-Chin Wang was in charge of system prototyping and Tsung-Yi Tsai carried out the overall circuit. All authors contributed to the concept, design, and performance of the experiments.
Conflicts of Interest
The authors declare no conflict of interest.
References
- Lee, S.F.; Hsu, J.; Tsay, W.I. The trend of drug abuse in Taiwan during the years 1999 to 2011. J. Food Drug Anal. 2013, 4, 390–396. [Google Scholar] [CrossRef]
- Feng, L.Y.; Yu, W.J.; Chang, W.T.; Han, E.; Chung, H.; Li, J.H. Comparison of illegal drug use pattern in Taiwan and Korea from 2006 to 2014. Subst. Abuse Treat. Prev. Policy 2016, 11, 624–630. [Google Scholar] [CrossRef] [PubMed]
- Wohlfarth, A.; Weinmann, W. Bioanalysis of new designer drugs. Bioanalysis 2010, 2, 965–979. [Google Scholar] [CrossRef] [PubMed]
- Agius, R.; Nadulski, T.; Moore, M. Validation of LUCIO®-Direct-ELISA kits for the detection of drugs of abuse in urine: Application to the new German driving licenses re-granting guidelines. Forensic Sci. Int. 2012, 215, 38–45. [Google Scholar] [CrossRef] [PubMed]
- Sun, Y.S. Optical biosensors for label-free detection of biomolecular interactions. Instrum. Sci. Technol. 2014, 42, 109–127. [Google Scholar] [CrossRef]
- Backer, B.D.; Debrus, B.; Lebrun, P.; Theunis, L.; Dubois, N.; Decock, L.; Verstraete, A.; Hubert, P.; Charlier, C. Innovative development and validation of an HPLC/DAD method for the qualitative and quantitative determination of major cannabinoids in cannabis plant material. J. Chromatogr. B 2009, 877, 4115–4124. [Google Scholar] [CrossRef] [PubMed]
- Zgair, A.; Wong, J.C.M.; Sabri, A.; Fischer, P.M.; Barrett, D.A.; Constantinescu, C.S.; Gershkovich, P. Development of a simple and sensitive HPLC–UV method for the simultaneous determination of cannabidiol and ∆9-tetrahydrocannabinol in rat plasma. J. Pharm. Biomed. Anal. 2015, 114, 145–151. [Google Scholar] [CrossRef] [PubMed]
- Caplan, Y.H. Abbott phencyclidine and barbiturates abused drug assays: Valuation and comparison ofADx FPIA, TDx FPIA, EMIT, and GC/MS methods. J. Forensic Sci. 1989, 34, 289–292. [Google Scholar] [CrossRef]
- Kim, S.Y.; Kim, J.Y.; Kwon, W.; In, M.K.; Kim, Y.E.; Paeng, K.-J. Method development for simultaneous determination of amphetamine type stimulants and cannabinoids in urine using GC-MS. Microchem. J. 2013, 110, 326–333. [Google Scholar] [CrossRef]
- Geiser, L.; Cherkaoui, S.; Veuthey, J.L. Simultaneous analysis of some amphetamine derivatives in urine by nonaqueous capillary capillary electrophoresis coupled to electrospary ionization mass spectrometry. J. Chromatogr. A 2000, 895, 111–121. [Google Scholar] [CrossRef]
- Huang, I.Y.; Lee, M.C. Development of a FPW allergy biosensor for human IgE detection by MEMS and cystamine-based SAM technologies. Sens. Actuators B Chem. 2008, 132, 340–348. [Google Scholar] [CrossRef]
- Krishnamurthy, S.; Atashbar, M.Z.; Bazuin, B.J. Burst transceiver unit for wireless passive SAW sensing system. IEEE Trans. Instrum. Meas. 2009, 58, 3476–3753. [Google Scholar] [CrossRef]
- Ballantine, D.S., Jr.; White, R.M.; Martin, S.J.; Ricco, A.J.; Frye, G.C.; Zellars, E.T.; Wohltjen, H. Acoustic Wave Sensors: Theory, Design, and Physicochemical Application; Academic Press: Salt Lake, UT, USA, 1996; pp. 36–134. [Google Scholar]
- Grate, J.W.; Stephen, J.M.; Richard, M.W. Acoustic wave microsensors. Anal. Chem. 1993, 65, 940A–948A. [Google Scholar] [CrossRef]
- Ferrari, V.; Lucklum, R. Overview of Acoustic-Wave Microsensors: In Piezoelectric Transducers and Applications, 2nd ed.; Arnau, A., Ed.; Springer: Berlin/Heidelberg, Germany, 2008. [Google Scholar]
- Wang, C.C.; Sung, T.C.; Liao, C.H.; Chang, C.M.; Lan, J.W.; Huang, I.Y. A CEA concentration measurement system using FPW biosensors and frequency-shift readout IC. In Proceedings of the IEEE International Conference on Electronics, Circuits and Systems (ICECS), Busan, Korea, 17–19 November 2013. [Google Scholar]
- Lan, J.W.; Huang, I.Y.; Lin, Y.C.; Lin, C.Y.; Chen, J.L.; Hsieh, C.H. Development of an FPW Biosensor with Low Insertion Loss and High Fabrication Yield for Detection of Carcinoembryonic Antigen. Sensors 2016, 16, 1729. [Google Scholar] [CrossRef] [PubMed]
- Schreiber, F. Structure and growth of self-assembling monolayers. Prog. Surf. Sci. 2000, 65, 151–256. [Google Scholar] [CrossRef]
- Love, J.C.; Estroff, L.A.; Kriebel, J.K.; Nuzzo, R.G.; Whitesides, G.M. Self-assembled monolayers of thiolates on metals as a form of nanotechnology. Chem. Rev. 2005, 105, 1103–1169. [Google Scholar] [CrossRef] [PubMed]
- Vericat, C.; Vela, M.E.; Corthey, G.; Pensa, E.; Cortes, E.; Fonticelli, M.H.; Ibanez, F.; Benitez, G.E.; Carro, P.; Salvarezza, R.C. Self-assembled monolayers of thiolateson metals: A review article on sulfur-metal chemistry and surface structures. RSC Adv. 2014, 4, 27730–27754. [Google Scholar] [CrossRef]
- Hsu, C.H.; Lin, Y.R.; Tsai, Y.D.; Chen, Y.C.; Wang, C.C. A frequency-shift readout system for FPW allergy biosensor. In Proceedings of the IEEE International Conference on IC Design Technology (ICICDT), Kaohsiung, Taiwan, 2–4 May 2011. [Google Scholar]
- Wang, C.C.; Hsu, C.H.; Tsai, Y.D.; Chen, Y.C.; Lee, M.C.; Huang, I.Y. A fast FPW-based protein concentration measurement system. In Proceedings of the IEEE International Symposium on Circuits and Systems (ISCAS), Seoul, Korea, 20–23 May 2012. [Google Scholar]
- Lee, T.J.; Hsiao, W.C.; Wang, C.C. 20 MHz accurate peak detector for FPW allergy biosensor with digital calibration. In Proceedings of the International Symposium on Integrated Circuits (ISIC), Singapore, 12–14 December 2011. [Google Scholar]
- Wang, C.C.; Wang, D.S.; Chen, S.Y.; Chang, C.M. A wide range and high conversion gain power detector for frequency shift sensing applications. In Proceedings of the IEEE International Midwest Symposium on Circuits and Systems (MWSCAS), Fort Collins, CO, USA, 2–5 August 2015. [Google Scholar]
- Yang, S.H.; Wang, C.C. Feed-forward output swing prediction AGC with parallel-detect singular-store peak detector. Microelectron. J. 2012, 43, 250–256. [Google Scholar] [CrossRef]
- Product Information of MaxSignal® THC ELISA Test Kit. Available online: http://www.biooscientific.com/Forensic-Drug-Detection/MaxSignal-THC-ELISA-Test-Kit (accessed on 11 April 2016).
- Khajuria, H.; Nayak, B.P. Detection of ∆9-tetrahydrocannabinol (THC) in hair using GC-MS. Egypt. J. Forensic Sci. 2014, 4, 17–20. [Google Scholar] [CrossRef]
- Wang, C.C.; Liao, C.H.; Chang, C.M.; Lan, J.W.; Huang, I.Y. A fast CEA analyzer prototype for point of care testing. In Proceedings of the IEEE International Conference on Electron Devices and Solid-State Circuits (EDSSC), Chengdu, China, 18–20 June 2014. [Google Scholar]
Figure 1.
Main processing steps of the proposed FPW device: (a) deposit SiO2/Si3N4, etch Si-groove RGS, and pattern backside SiO2/Si3N4; (b) deposit and pattern Cr/Au ground electrode; (c) deposit and pattern ZnO; (d) deposit and pattern Cr/Au IDTs; (e) etch the backside silicon by using 30 wt % KOH at 60 °C and 30 wt % KOH at 27 °C; (f) the THC antibody has to be coated on the back-side silicon cavity to catch the THC antigen in urine.

Figure 2.
Schematic diagram for the integration of cystamine SAM, glutaraldehyde, THC antibody, and THC antigen in multilayers.
Figure 2.
Schematic diagram for the integration of cystamine SAM, glutaraldehyde, THC antibody, and THC antigen in multilayers.
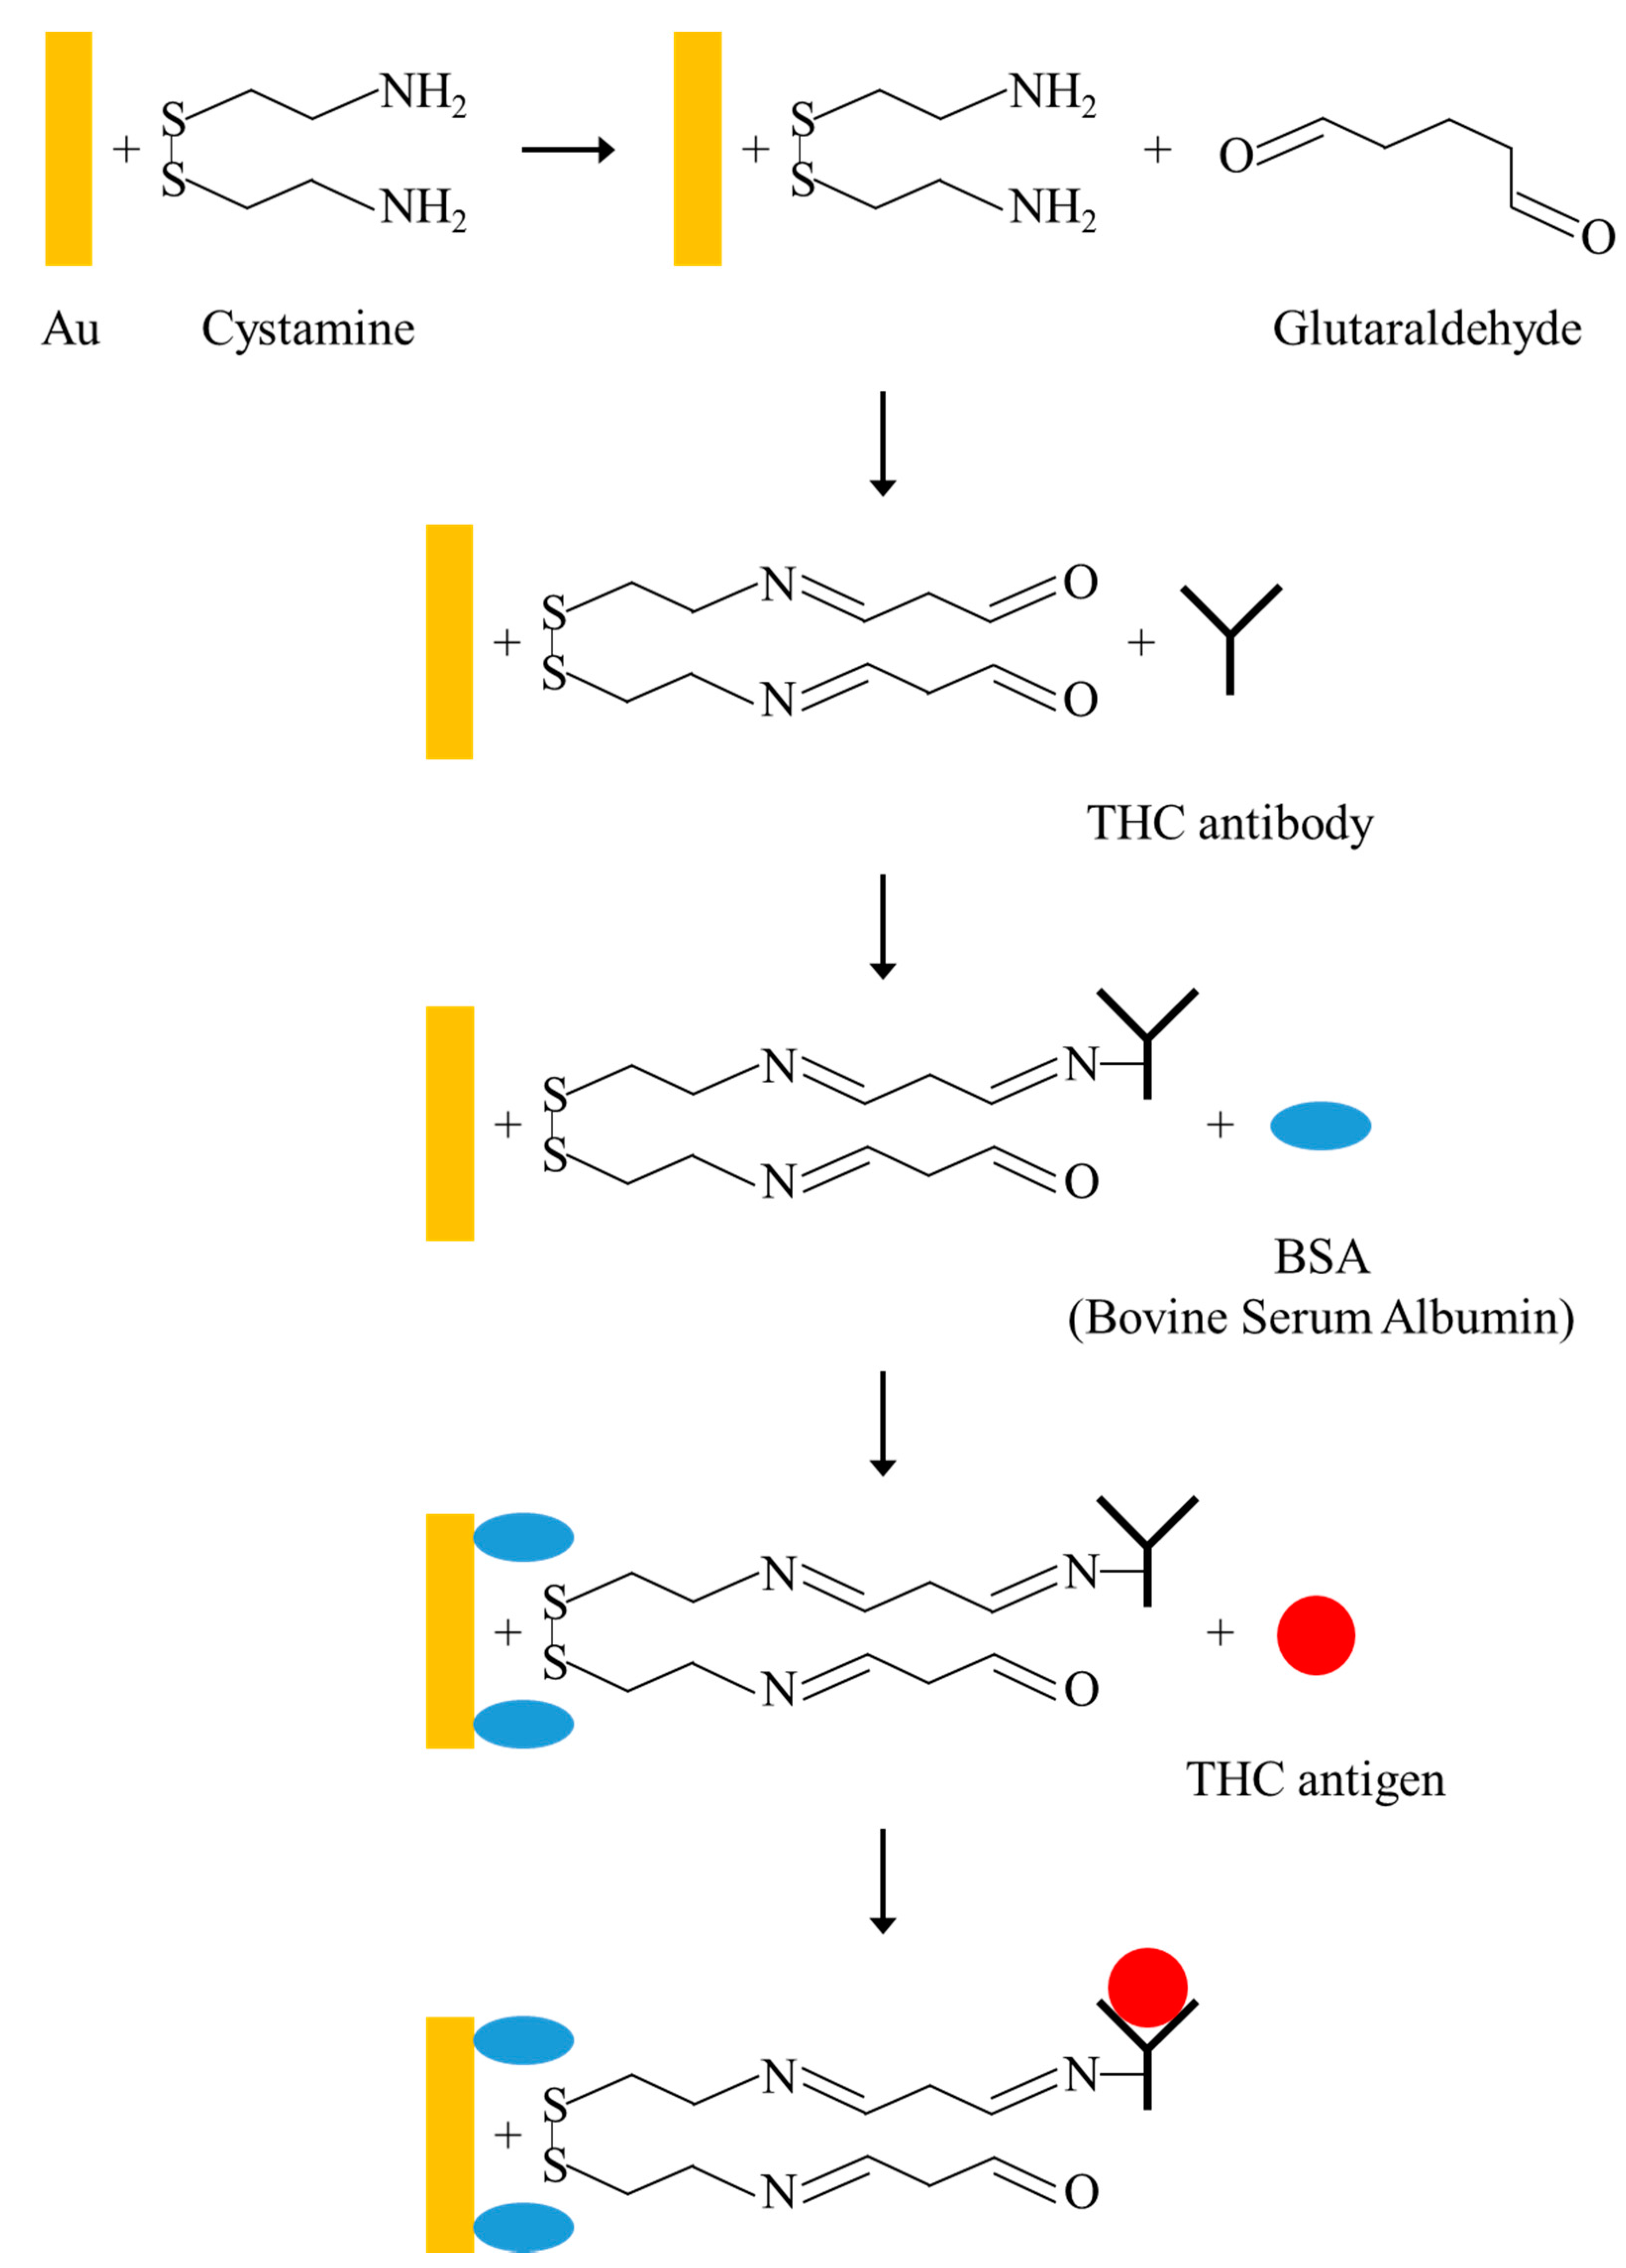
Figure 3.
Block diagram of the FPW readout system.

Figure 4.
Schematic of (a) amplitude-to-voltage converter (AVC) and (b) peak detector.

Figure 5.
Frequency responses of the proposed FPW device.
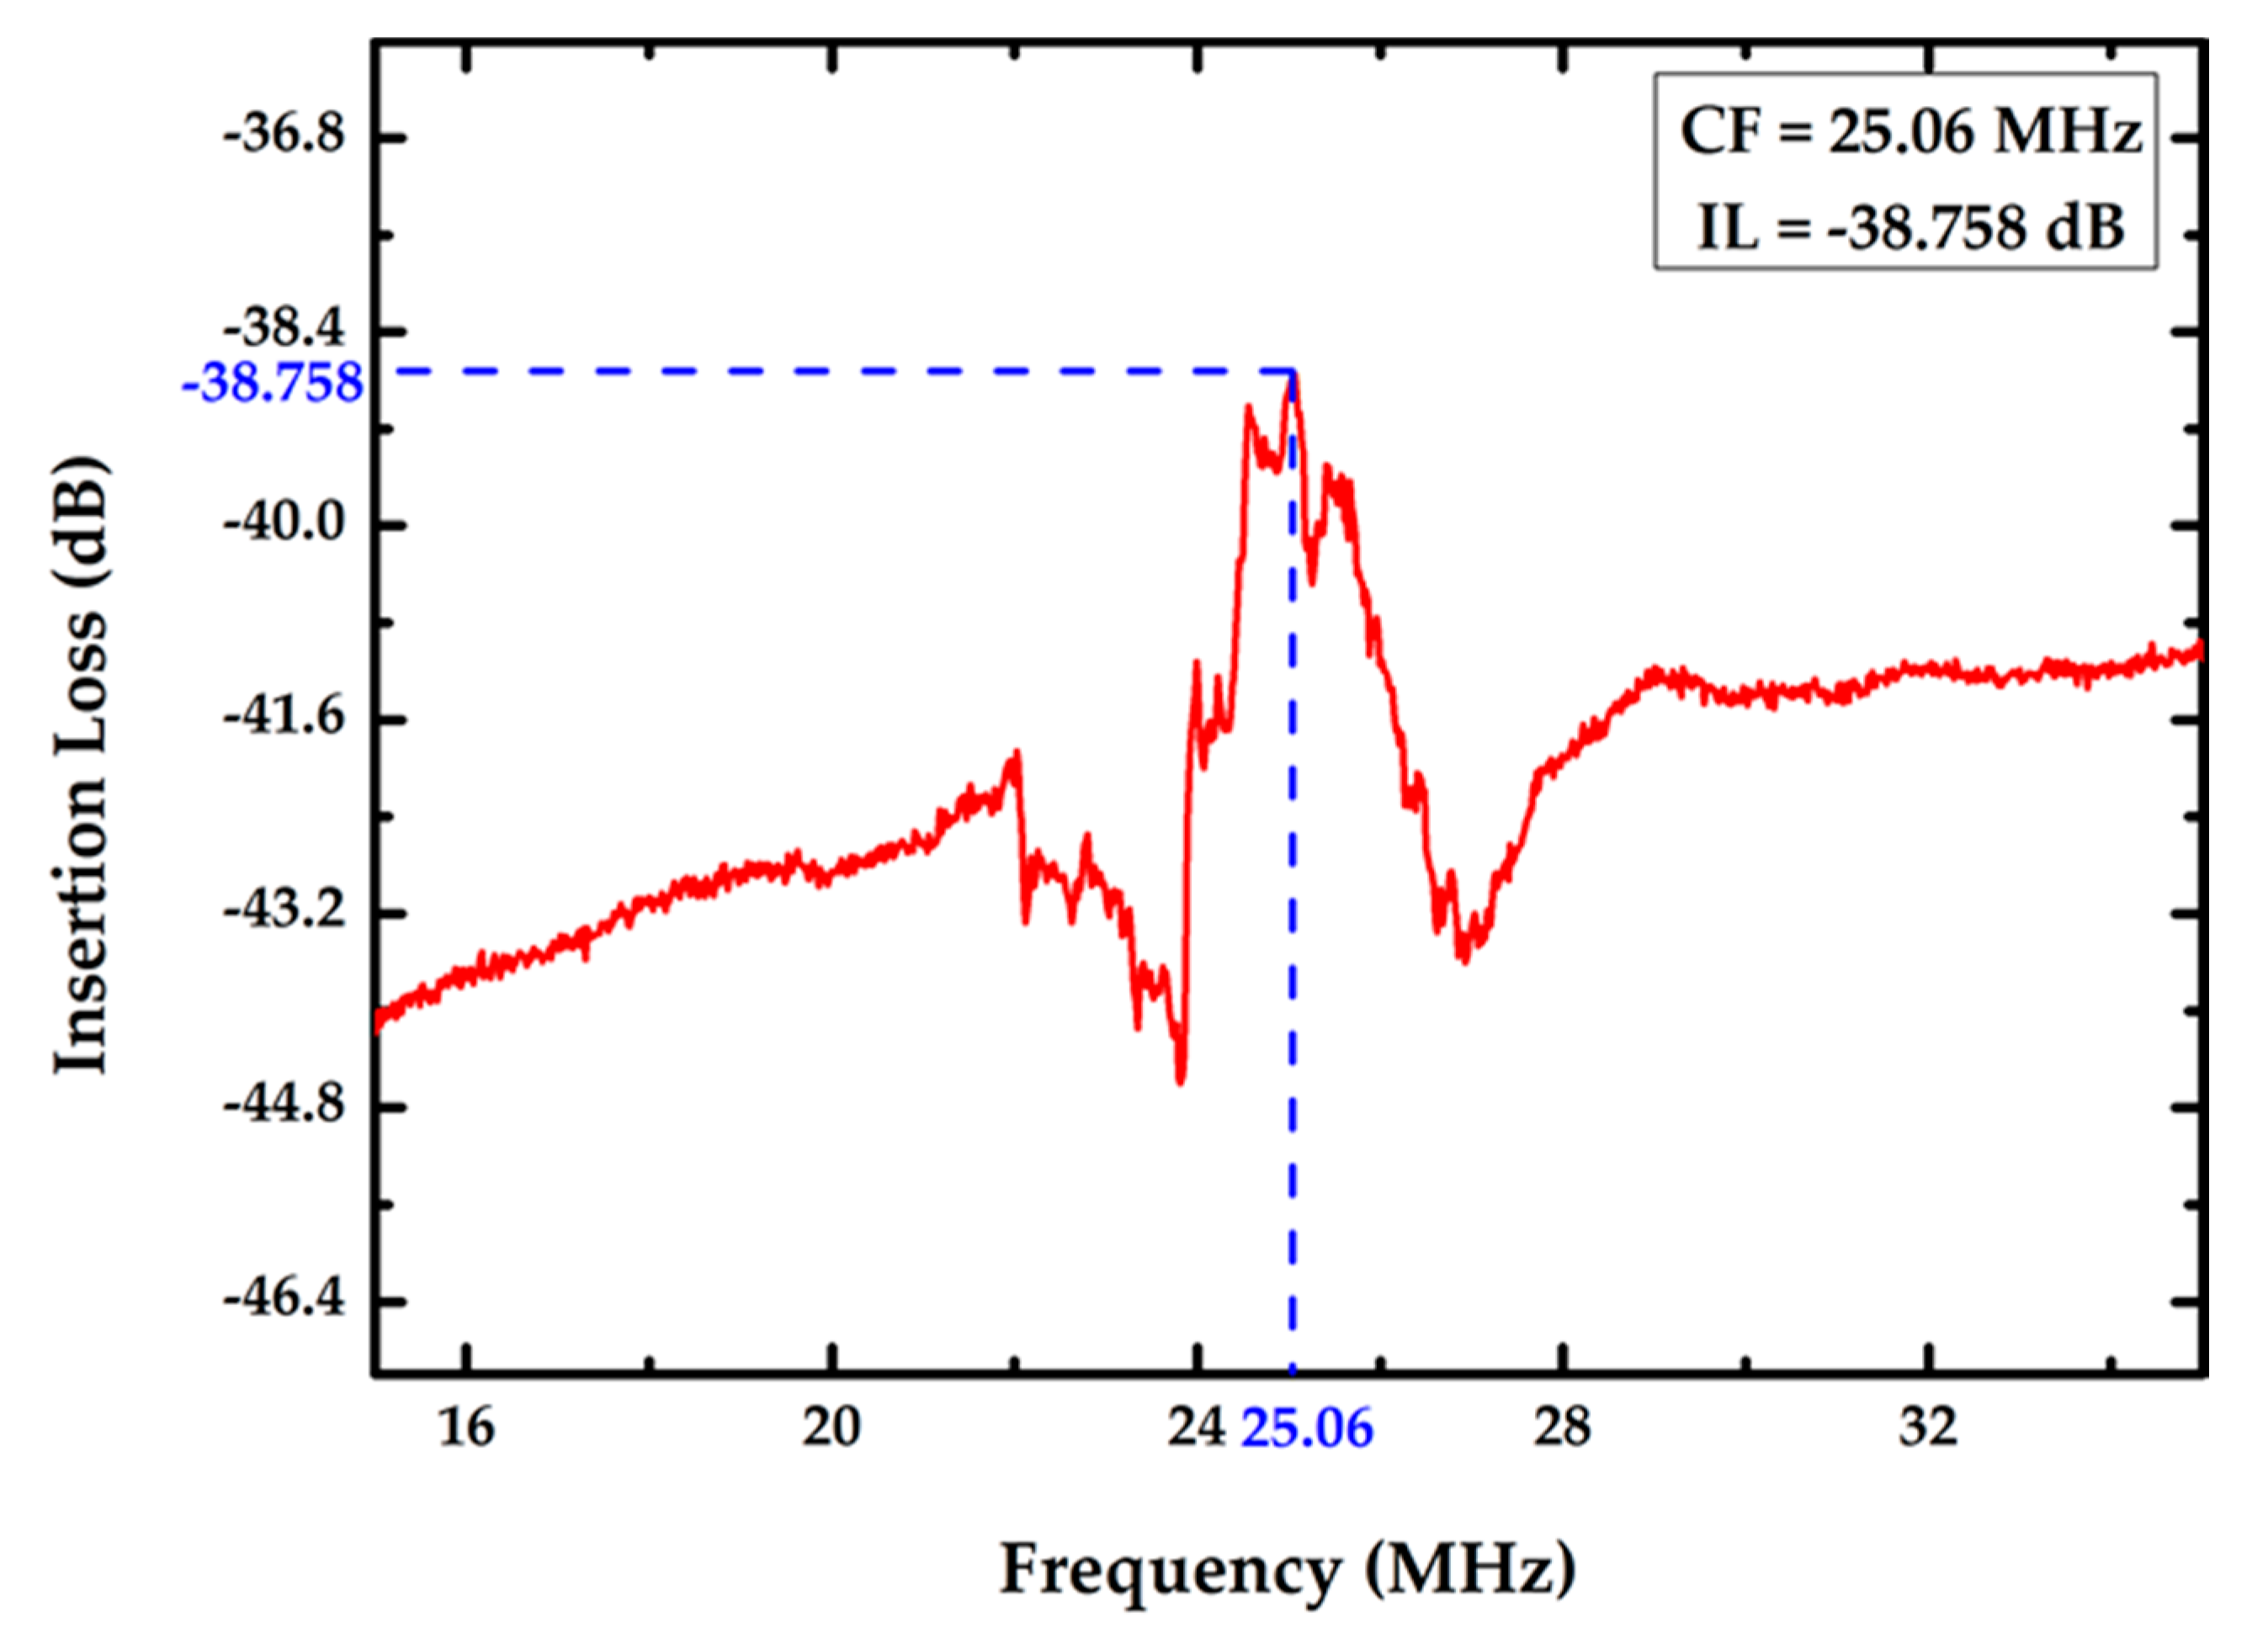
Figure 6.
The frequency shifts of the FPW device with five different Al mass loadings.
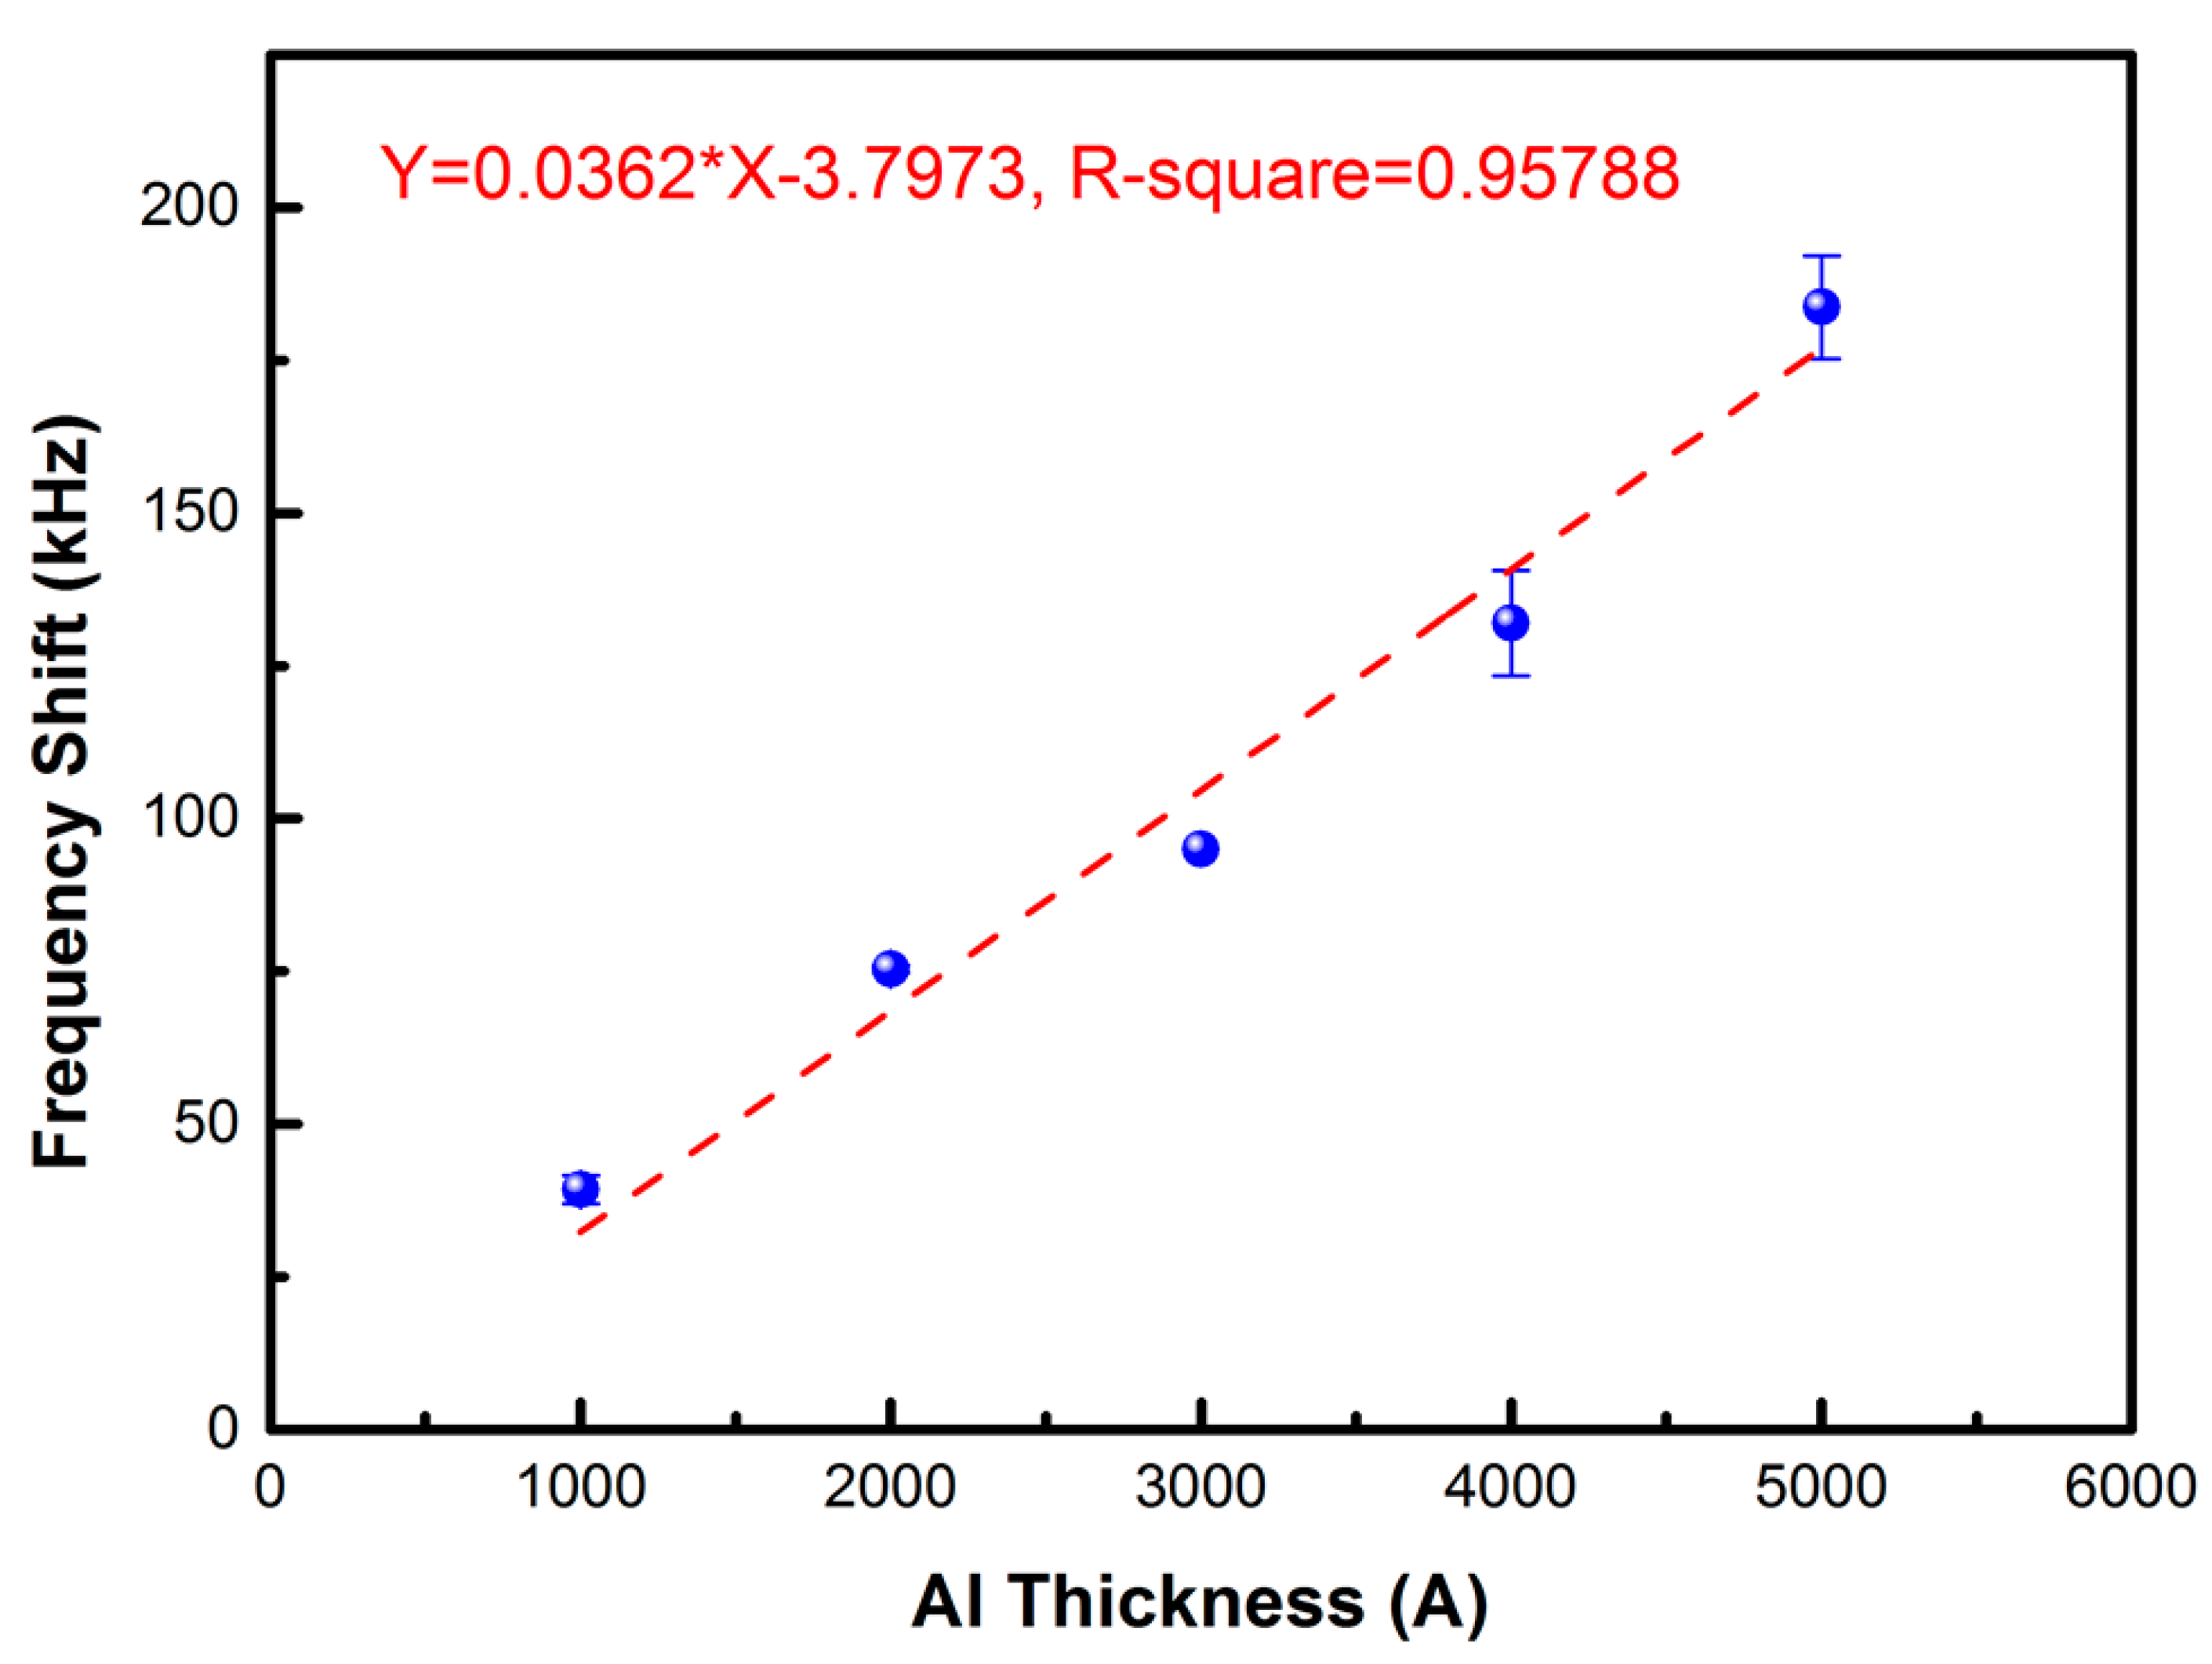
Figure 7.
Photo of the system prototype measurement environment.

Figure 8.
Measurement results of the FPW readout system prototype.
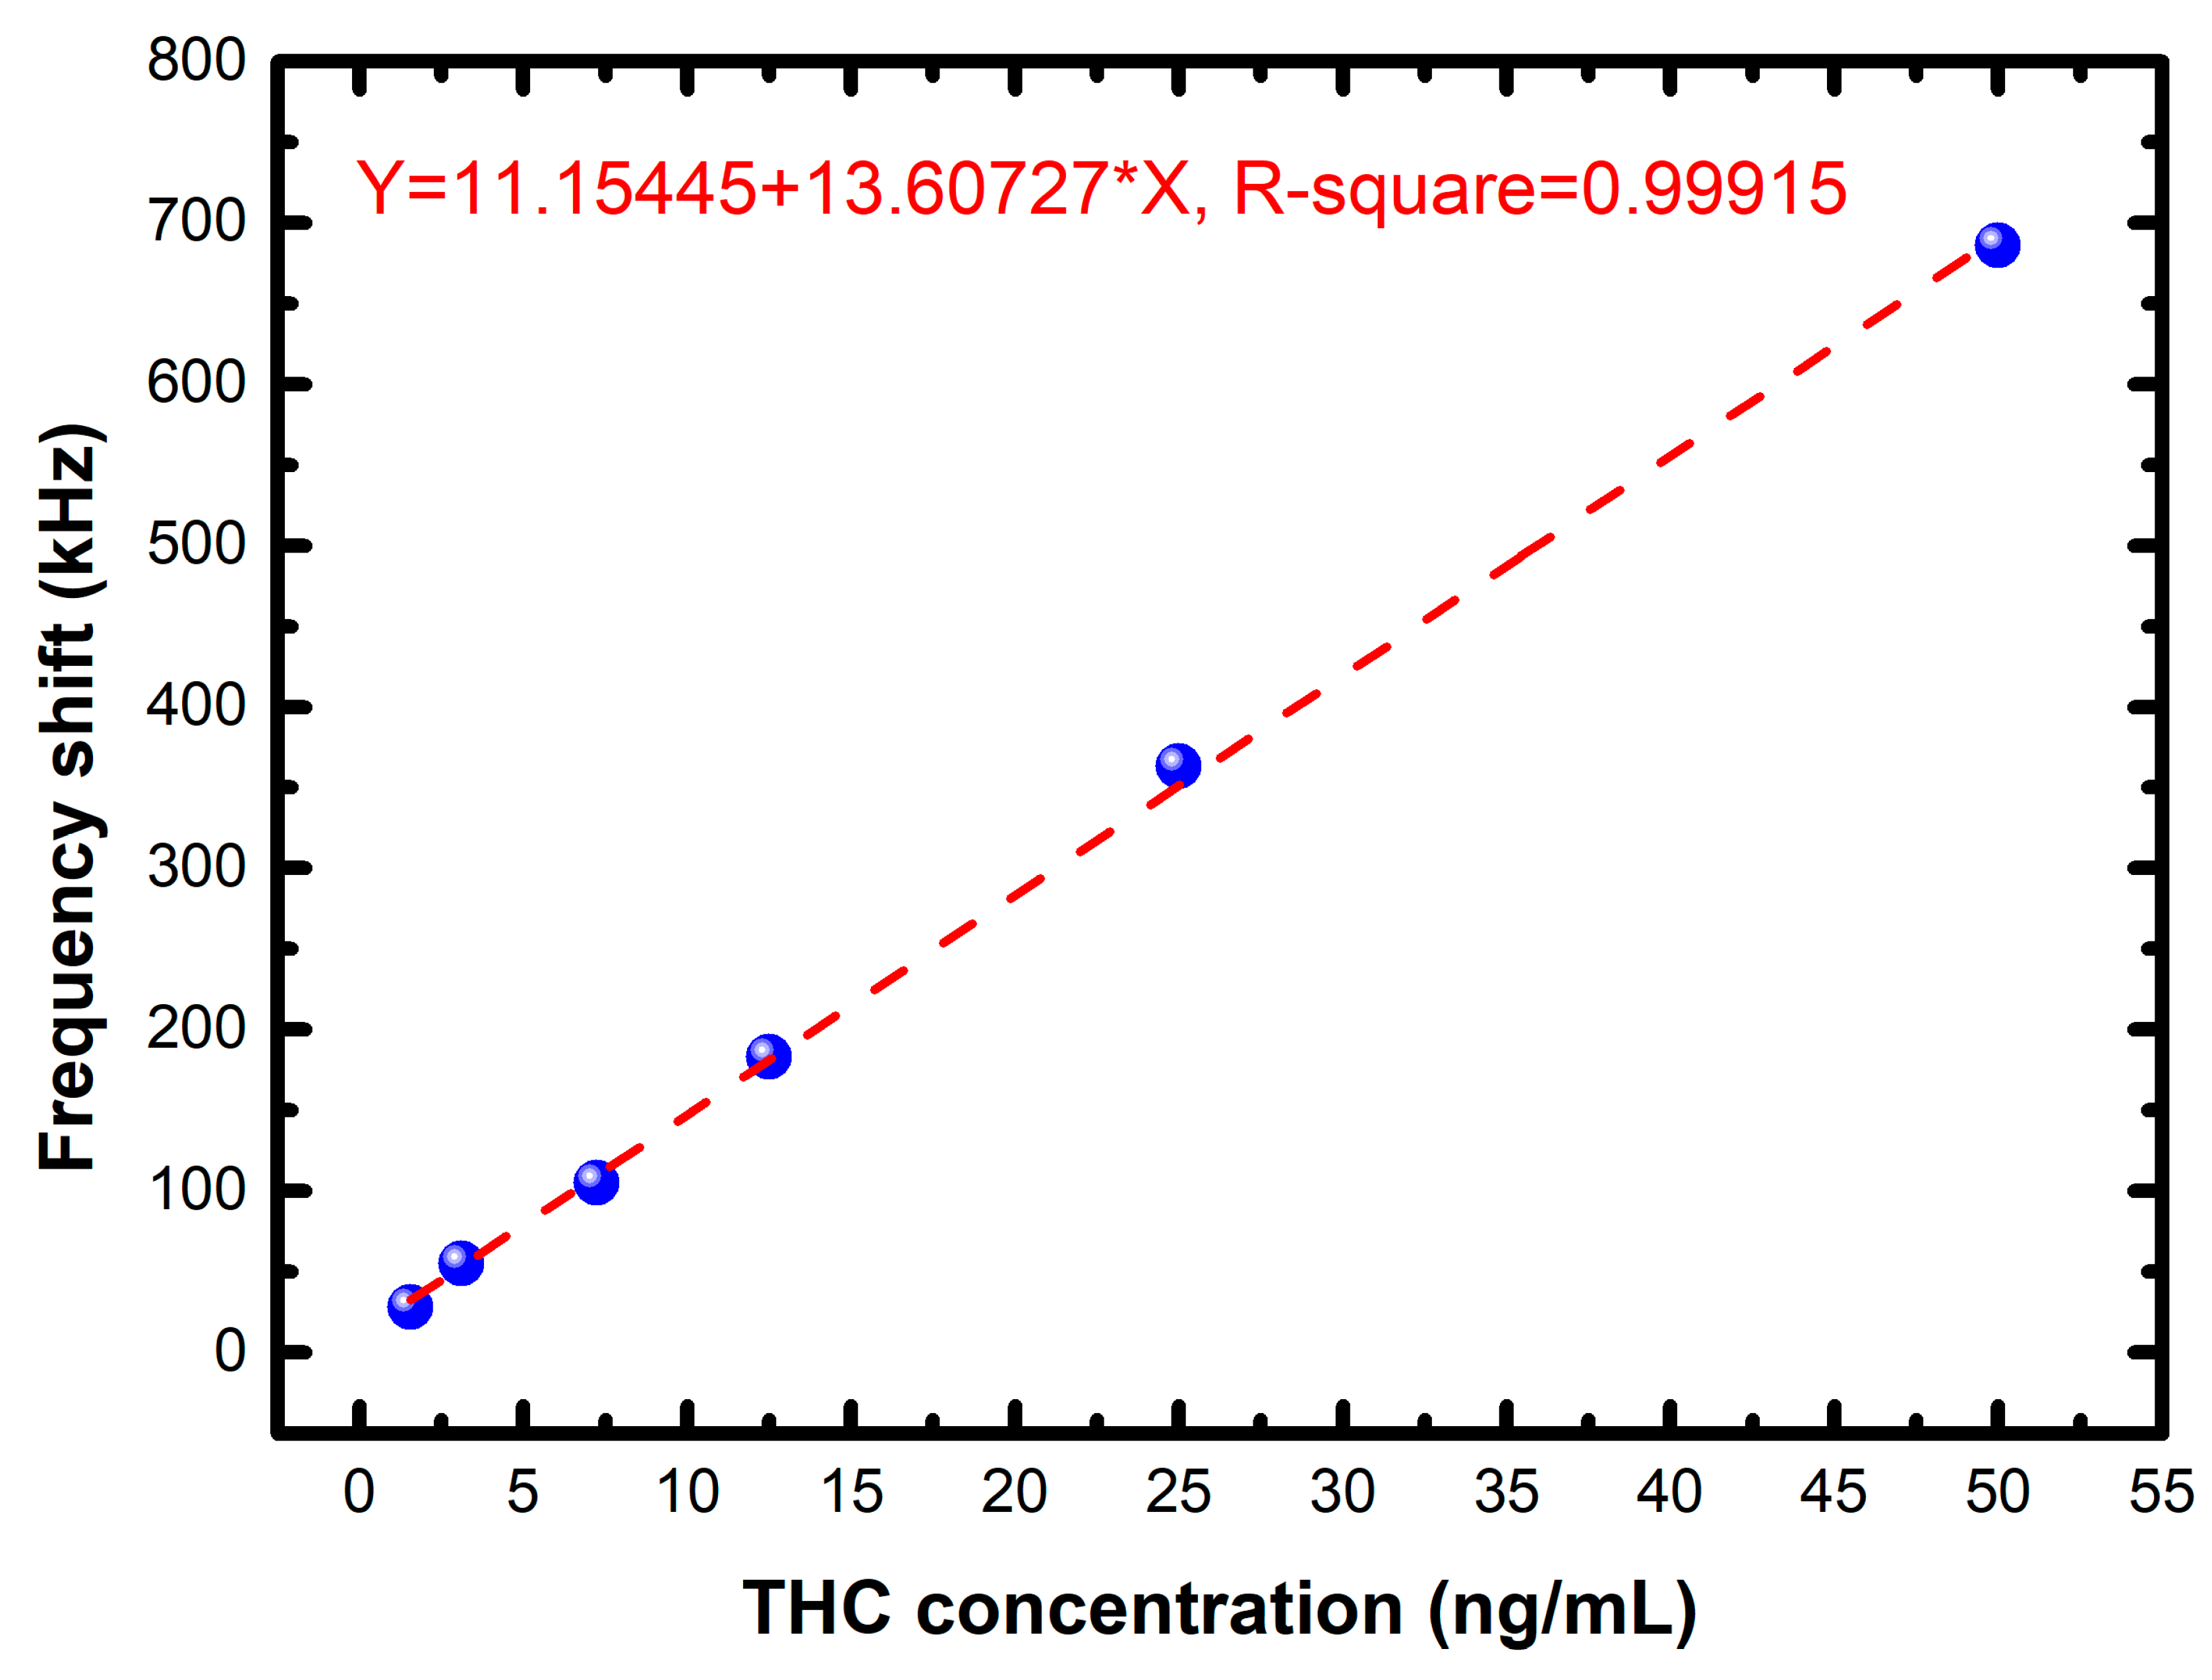
Figure 9.
Measurement results of the THC urine specimens, PSA urine, and negative urine.

Table 1.
Comparison of four main types of acoustic sensors.
| Device | Mass Sensitivity (cm2/g) | Motion at Surface | Wave Velocity (Relative to Liquid) | Operating Frequency (MHz) |
|---|---|---|---|---|
| TSM | 1–10 | Transverse | Fast | 1–10 |
| SAW | 100–200 | Transverse and normal | Fast | 30–300 |
| APM | 20–40 | Transverse | Fast | 25–200 |
| FPW | 100–1000 | Transverse and normal | Slow | 2–20 |
Table 2.
Comparison of this research with the previous works of THC biosensor.
| References | This Work | [26] | [7] | [27] |
|---|---|---|---|---|
| Technology | FPW | ELISA | HPLC | GC/MS |
| Year | 2017 | 2017 | 2015 | 2014 |
| Detection time | <10 min | <2 h | >20 min | >1 h |
| Limit of detection | 1.5625 ng/mL | 0.1 ng/mL | 10 ng/mL | 0.1 ng/mg |
| Linear range | 1.5625–50 ng/mL | 0.05–100 ng/mL | 10–104 ng/mL | 0.16–2.3 ng/mg |
| Testing equipment size | Portable | Non-portable | Massive equipment | Massive equipment |
Table 3.
The frequency shifts of the FPW-based THC biosensors are measured under six concentrations.
Table 3.
The frequency shifts of the FPW-based THC biosensors are measured under six concentrations.
| THC Concentration (ng/mL) | Frequency Shift (kHz) |
|---|---|
| 1.5625 | 28 |
| 3.125 | 55 |
| 7.25 | 105 |
| 12.5 | 183 |
| 25 | 363 |
| 50 | 686 |
© 2017 by the authors. Licensee MDPI, Basel, Switzerland. This article is an open access article distributed under the terms and conditions of the Creative Commons Attribution (CC BY) license (http://creativecommons.org/licenses/by/4.0/).
Share and Cite
MDPI and ACS Style
Lan, J.-W.; Hsieh, C.-H.; Huang, I.-Y.; Lin, Y.-C.; Tsai, T.-Y.; Wang, C.-C. Highly Sensitive FPW-Based Microsystem for Rapid Detection of Tetrahydrocannabinol in Human Urine. Sensors 2017, 17, 2760. https://doi.org/10.3390/s17122760
AMA Style
Lan J-W, Hsieh C-H, Huang I-Y, Lin Y-C, Tsai T-Y, Wang C-C. Highly Sensitive FPW-Based Microsystem for Rapid Detection of Tetrahydrocannabinol in Human Urine. Sensors. 2017; 17(12):2760. https://doi.org/10.3390/s17122760
Chicago/Turabian StyleLan, Je-Wei, Chia-Hsu Hsieh, I-Yu Huang, Yu-Cheng Lin, Tsung-Yi Tsai, and Chua-Chin Wang. 2017. "Highly Sensitive FPW-Based Microsystem for Rapid Detection of Tetrahydrocannabinol in Human Urine" Sensors 17, no. 12: 2760. https://doi.org/10.3390/s17122760
Note that from the first issue of 2016, this journal uses article numbers instead of page numbers. See further details here.