Performance Characterization of an xy-Stage Applied to Micrometric Laser Direct Writing Lithography

Abstract
:1. Introduction
2. Materials and Methods
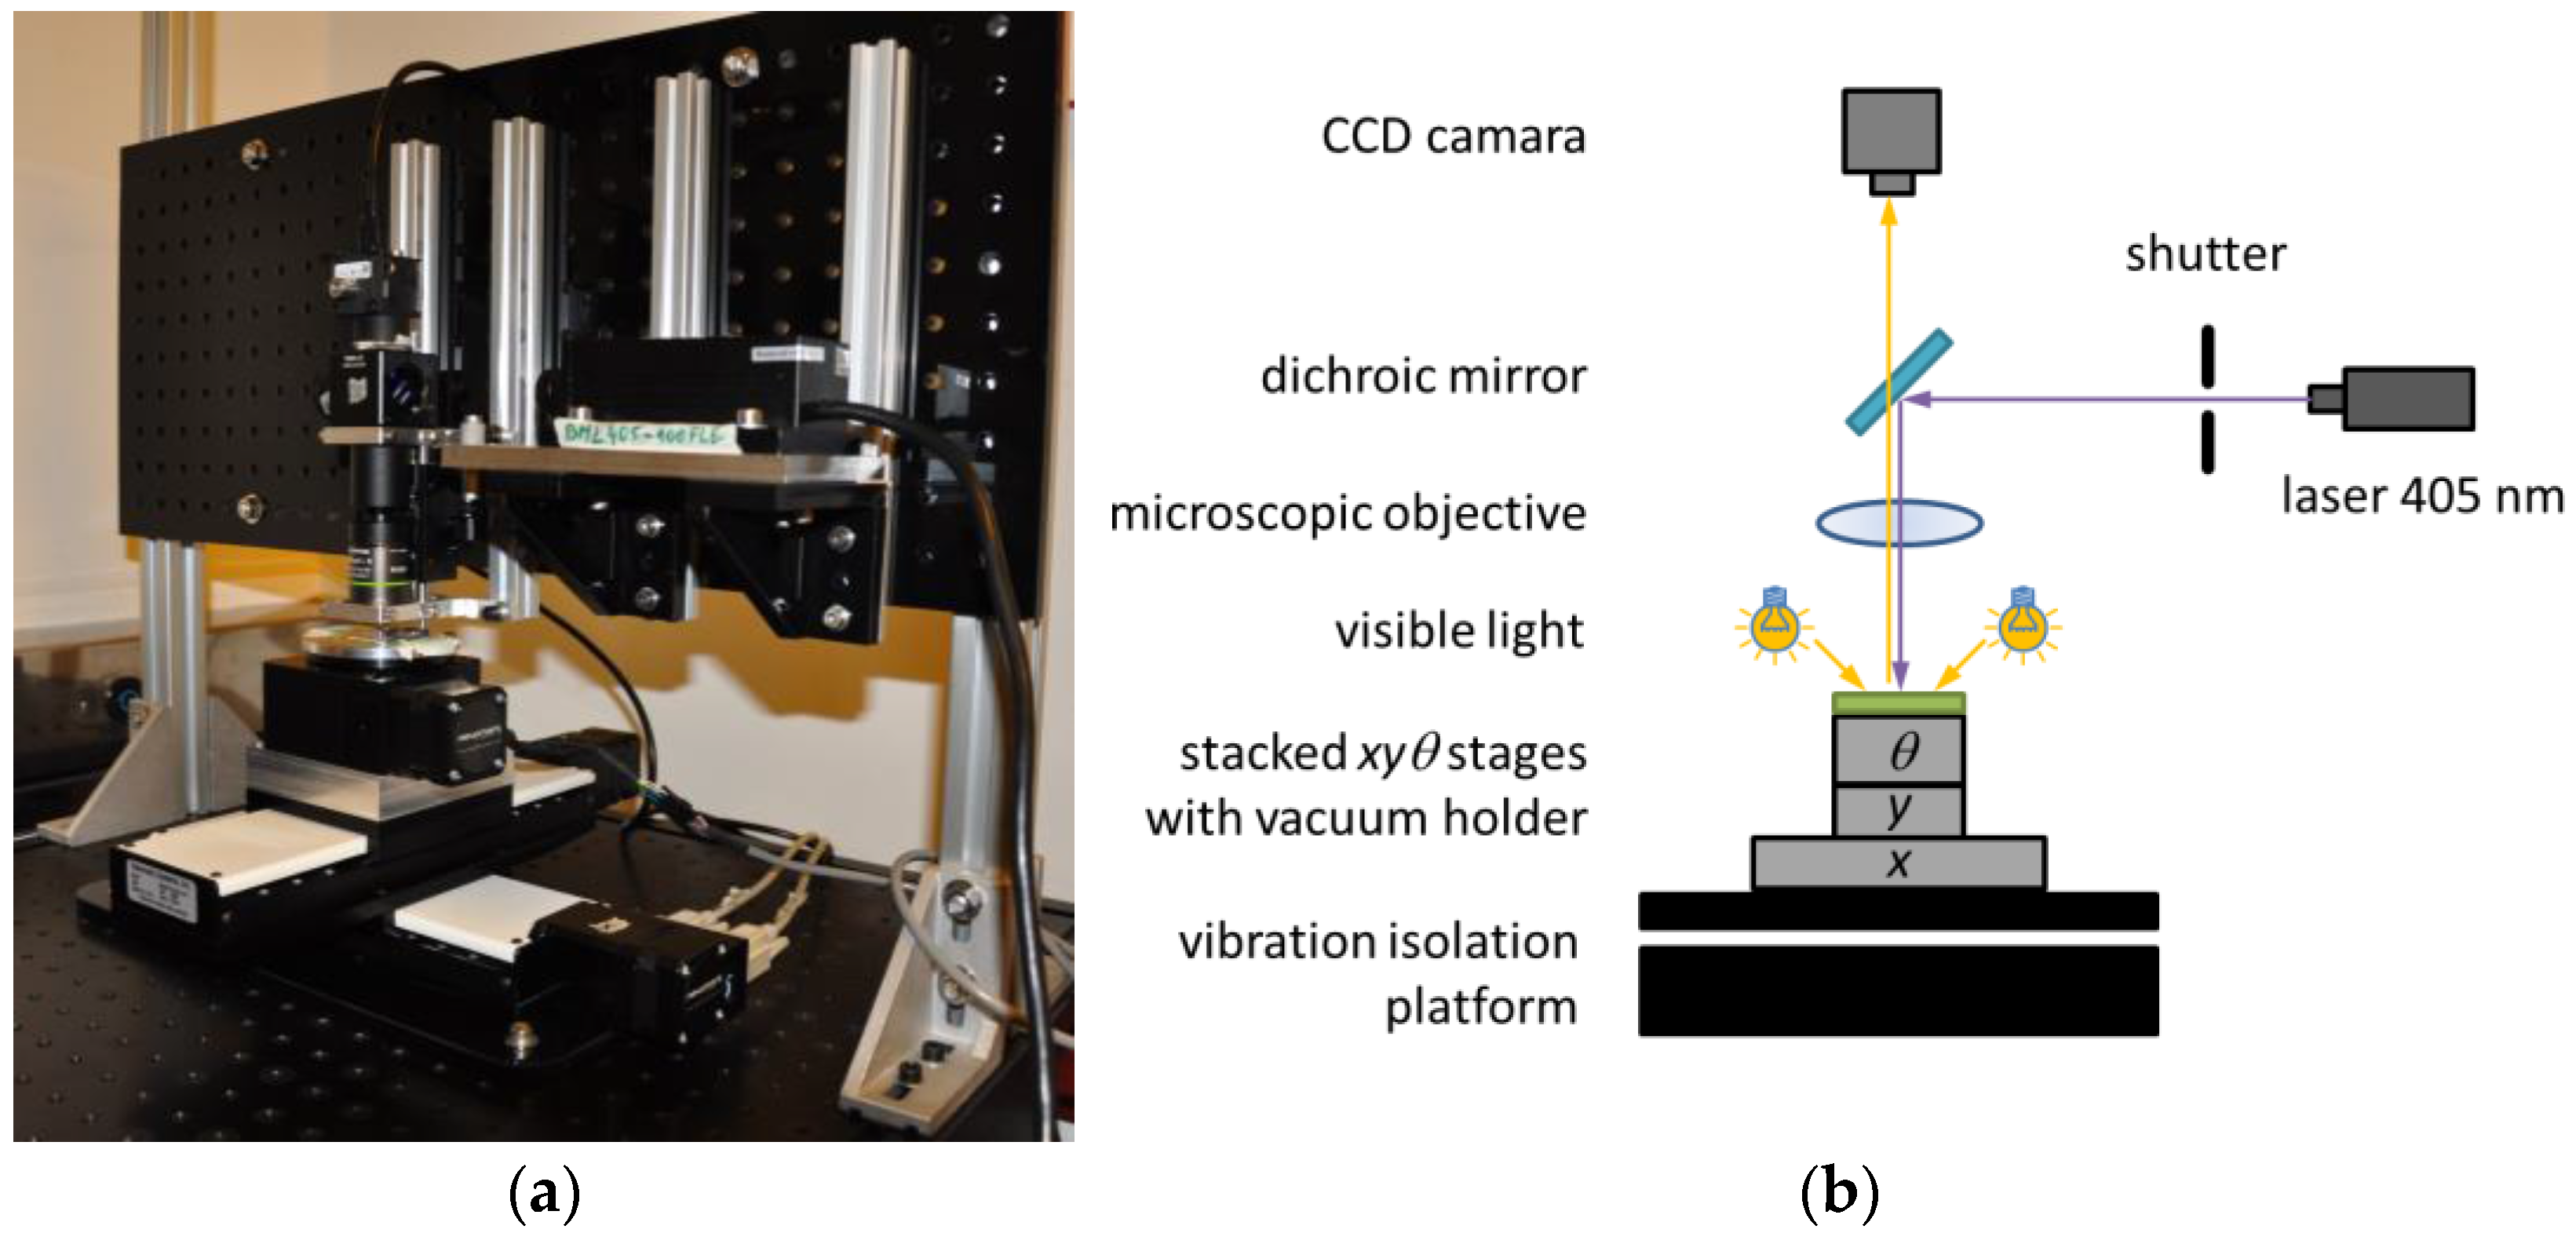
2.1. Presentation of the Laser Direct Writing Machine
2.1.1. Hardware
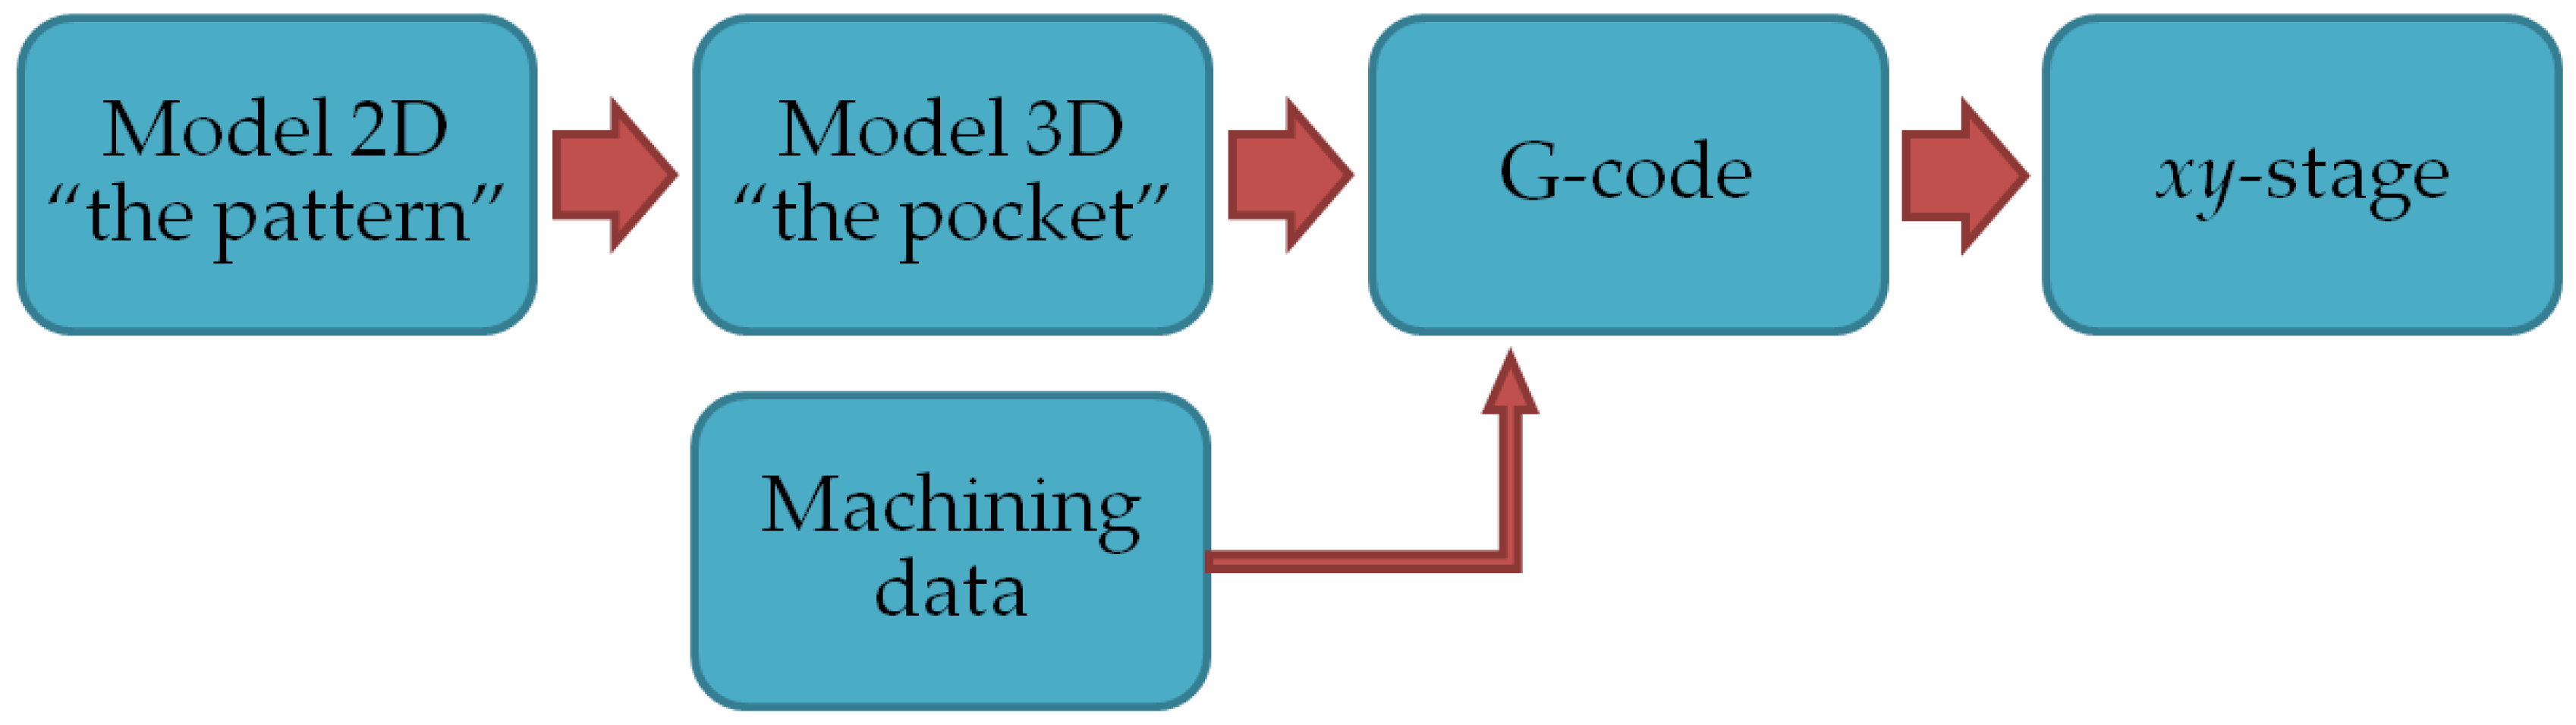
2.1.2. Software
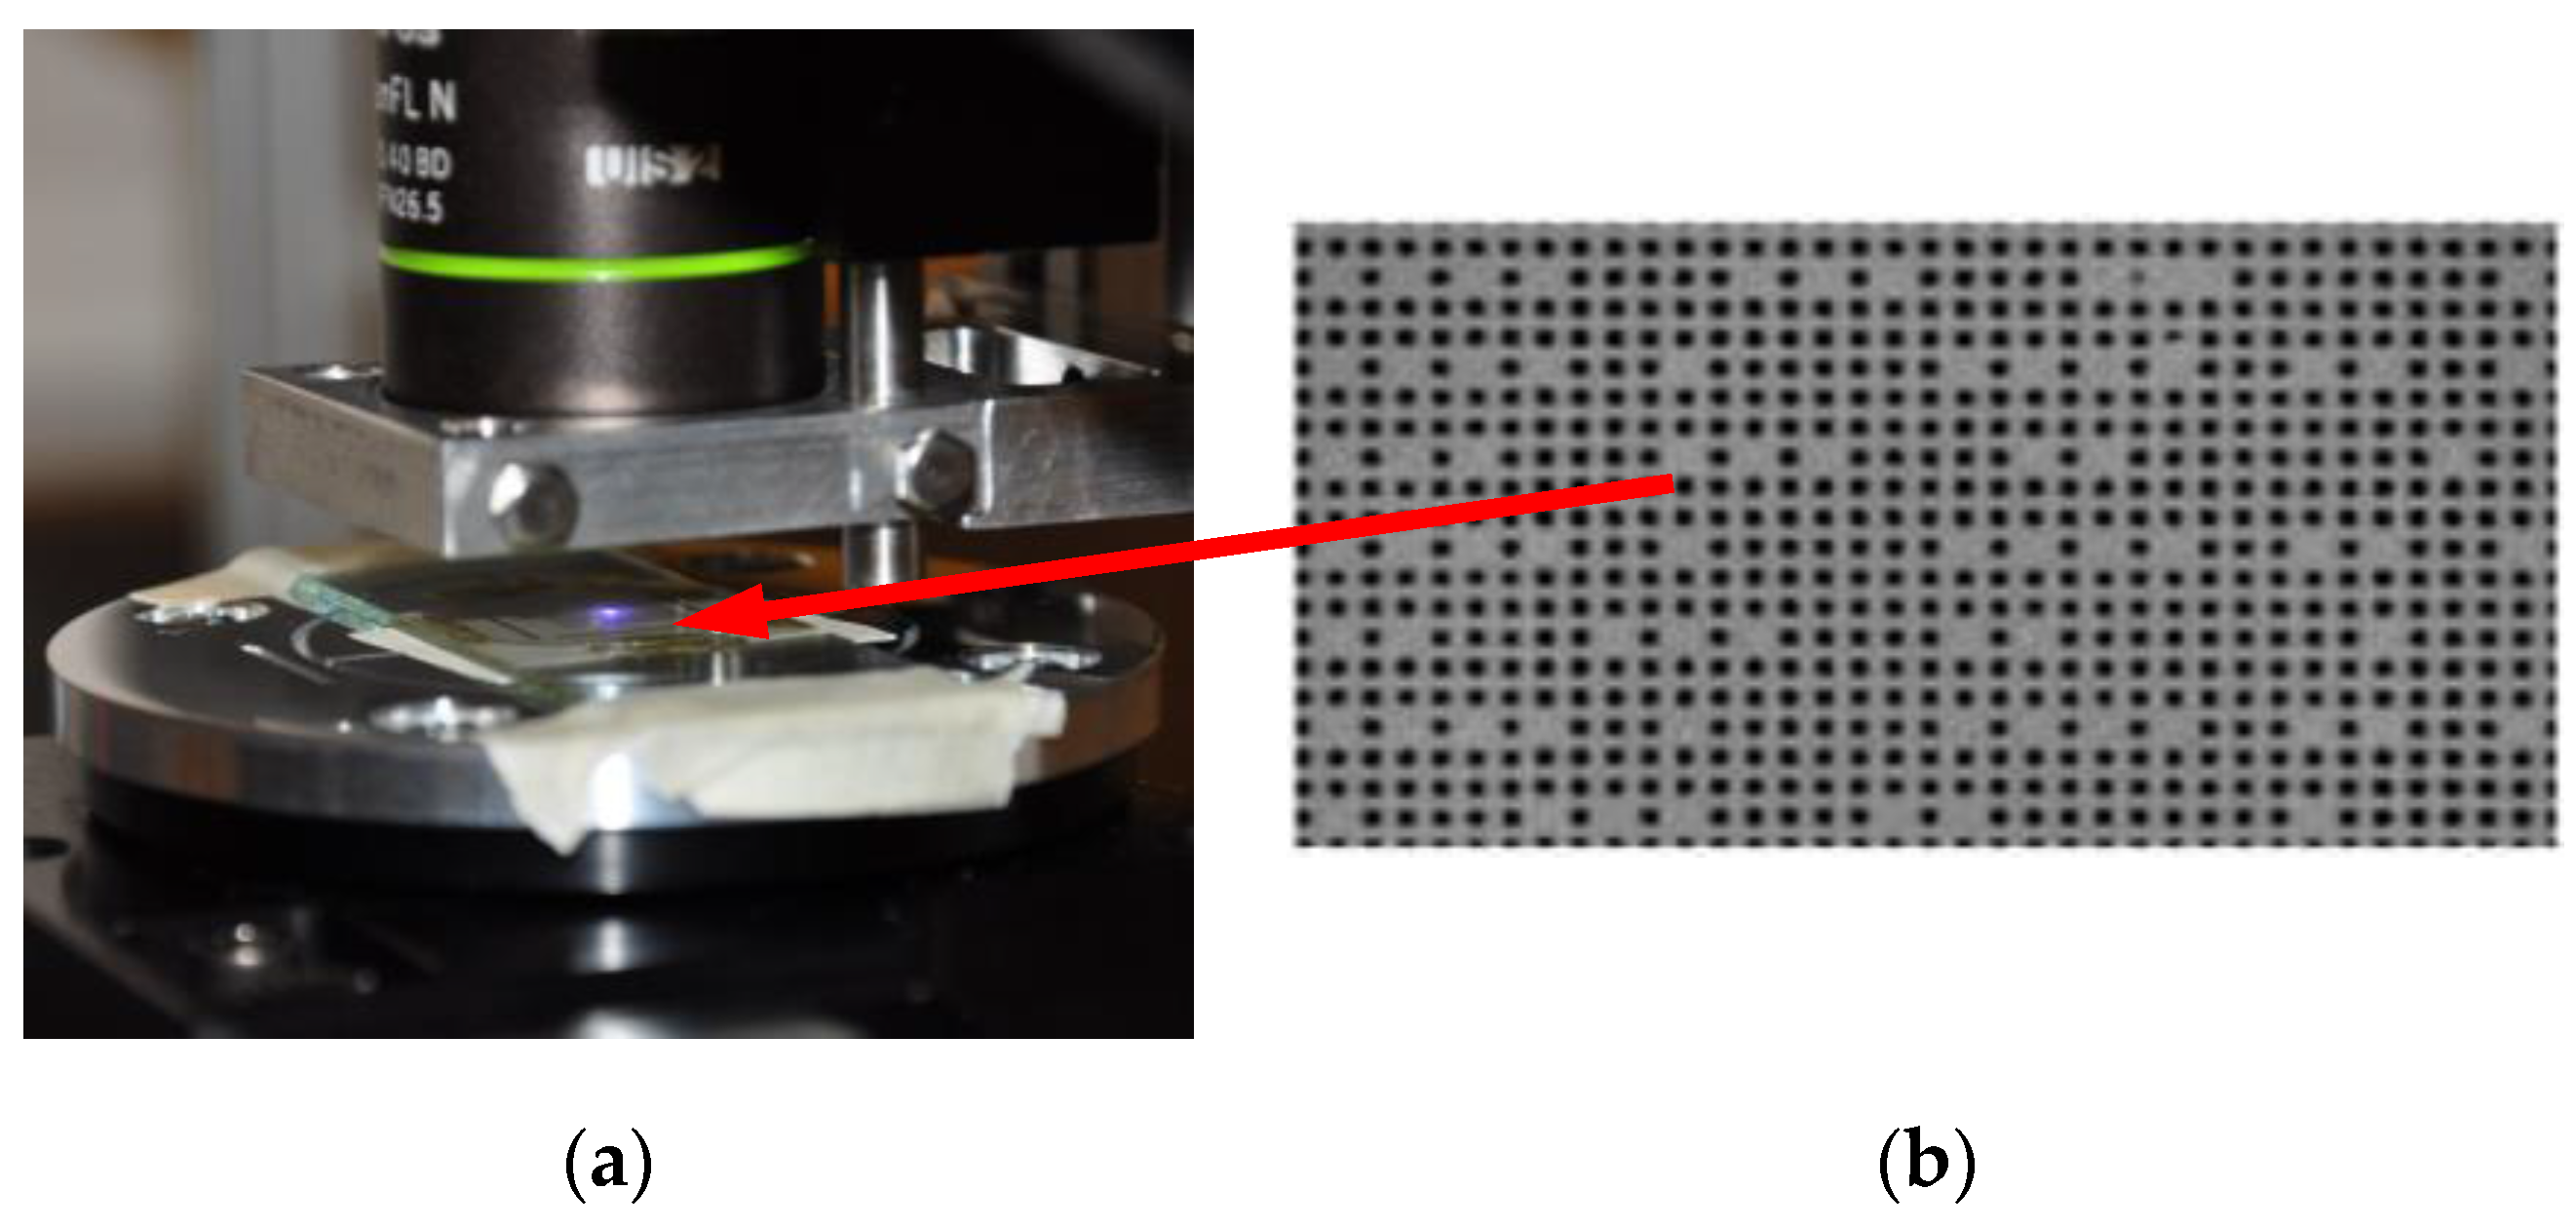
2.2. Fourier-Based Vision Method for Direct Writing Machine Characterization
2.2.1. Pseudo Periodic Pattern (PPP)
2.2.2. Processing of PPP Images
3. Results
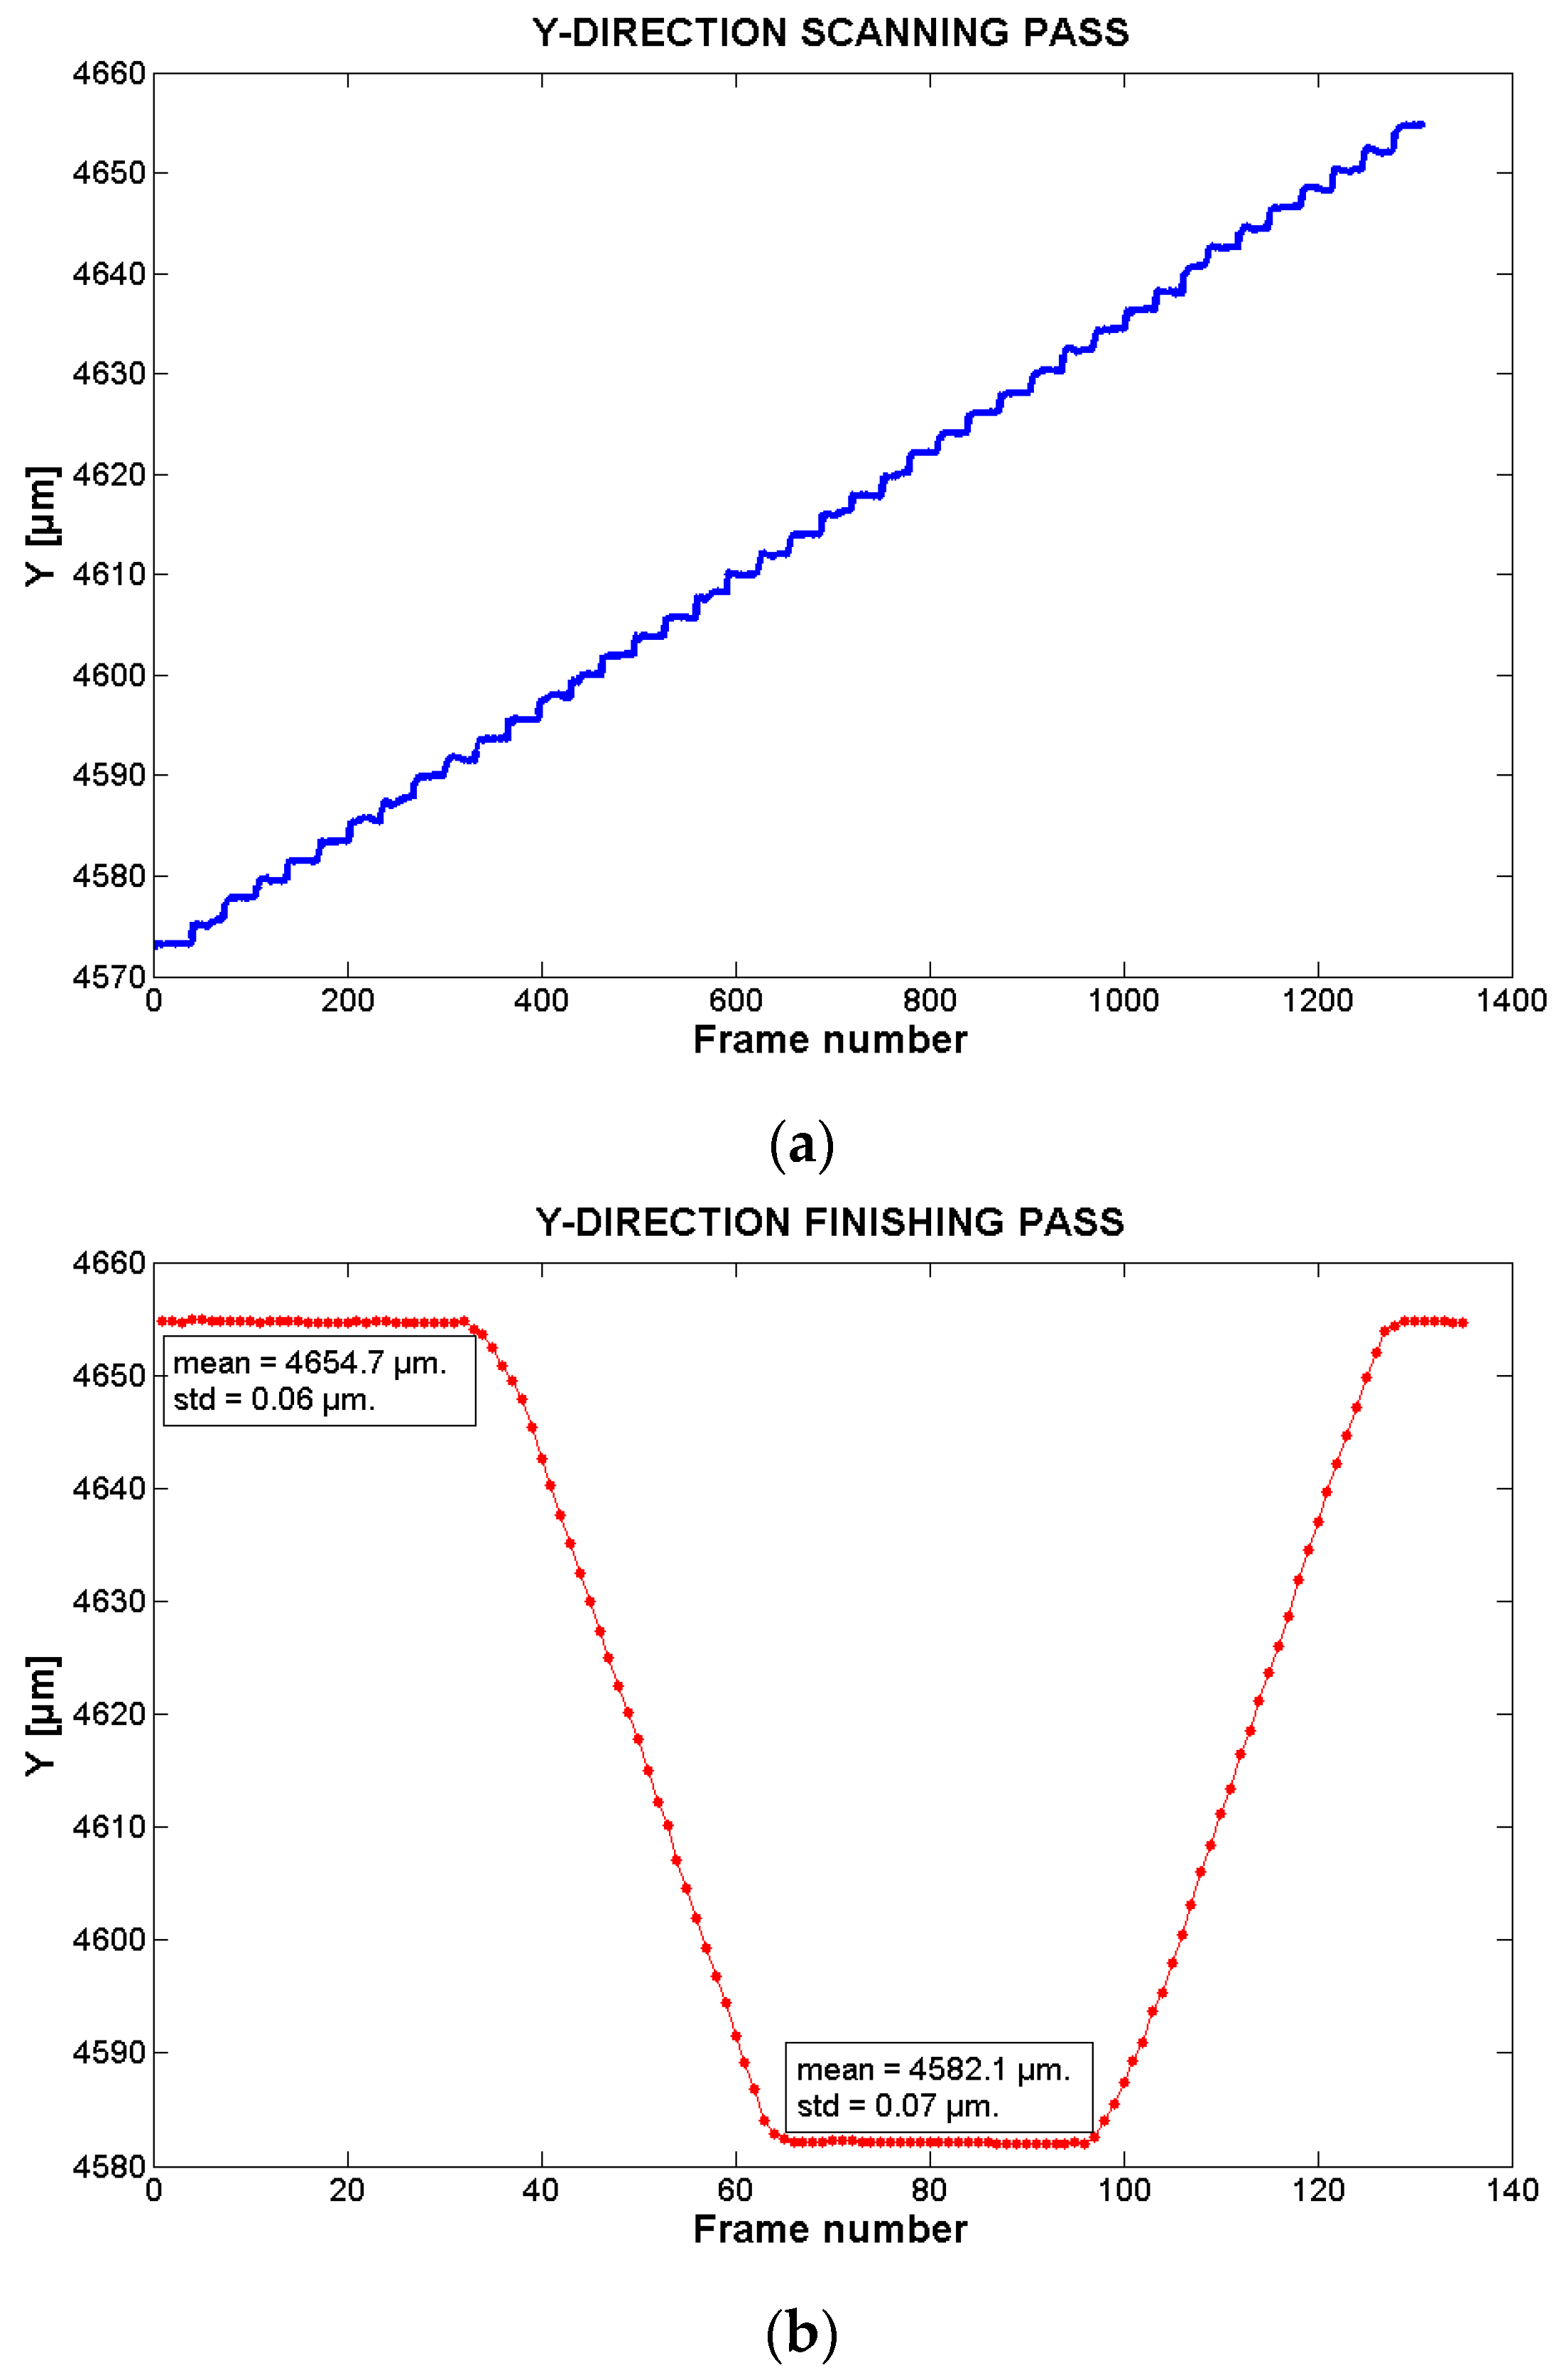
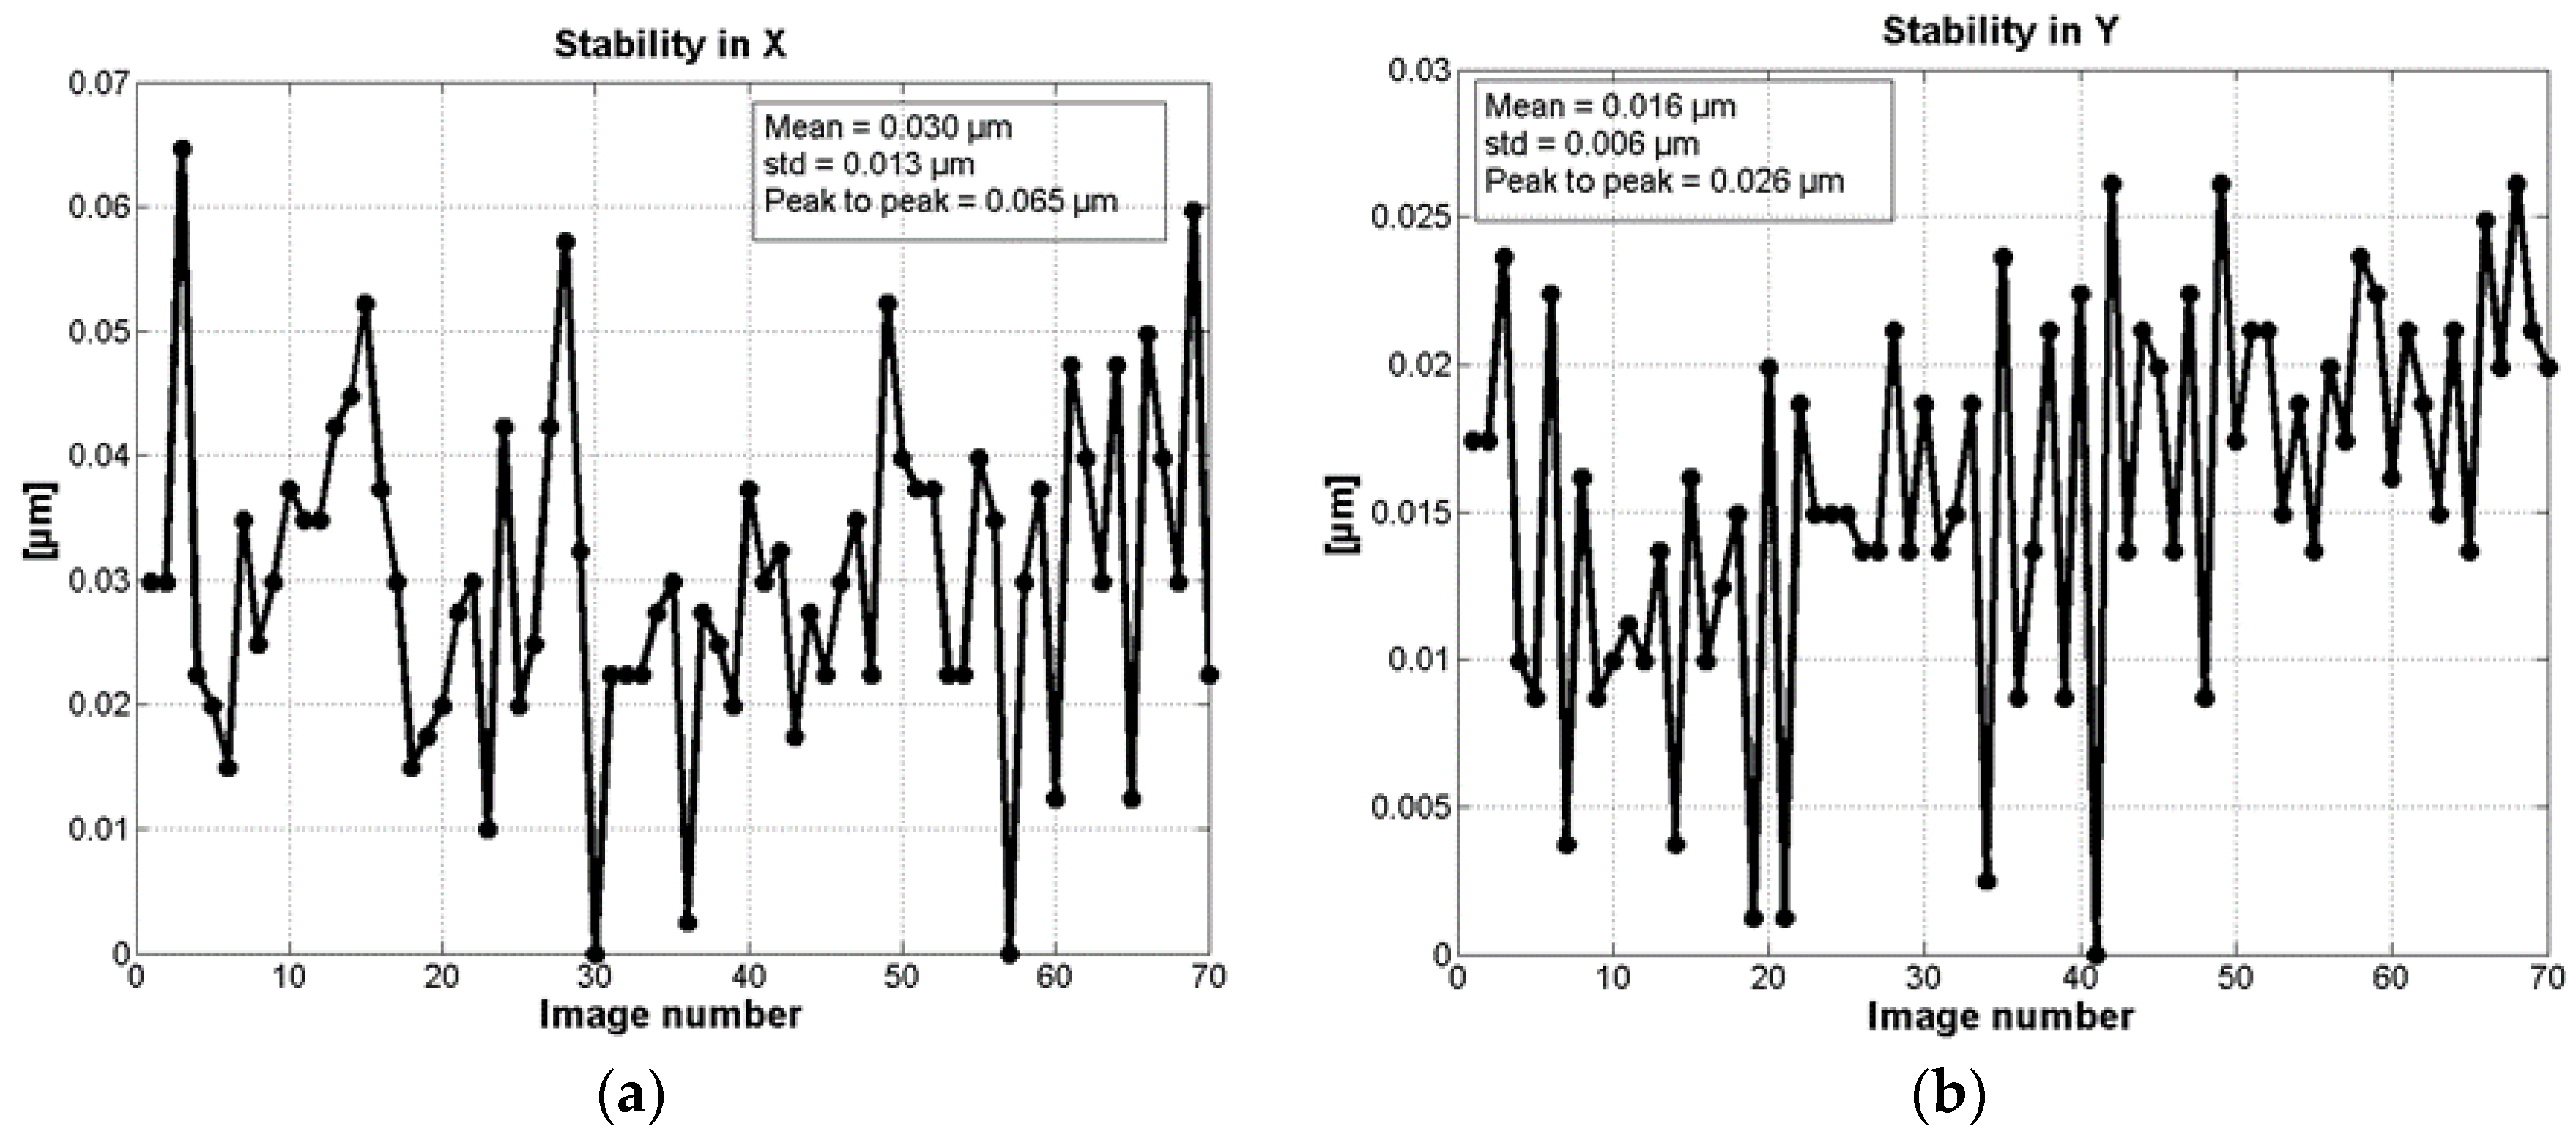
3.1. Vibrations
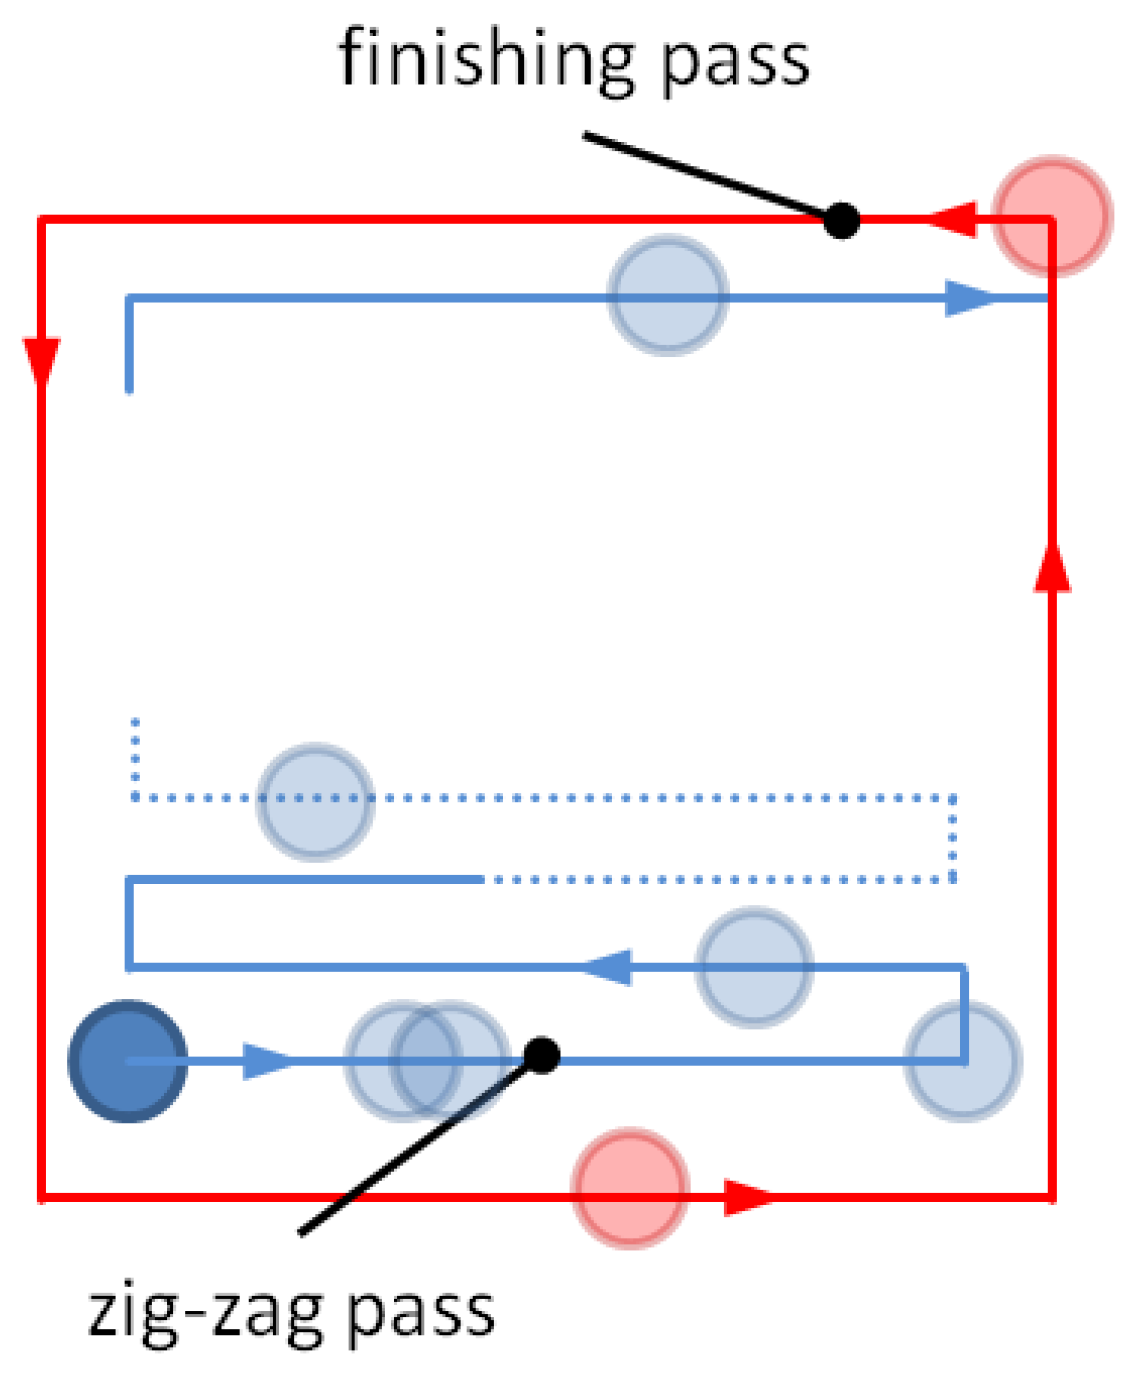
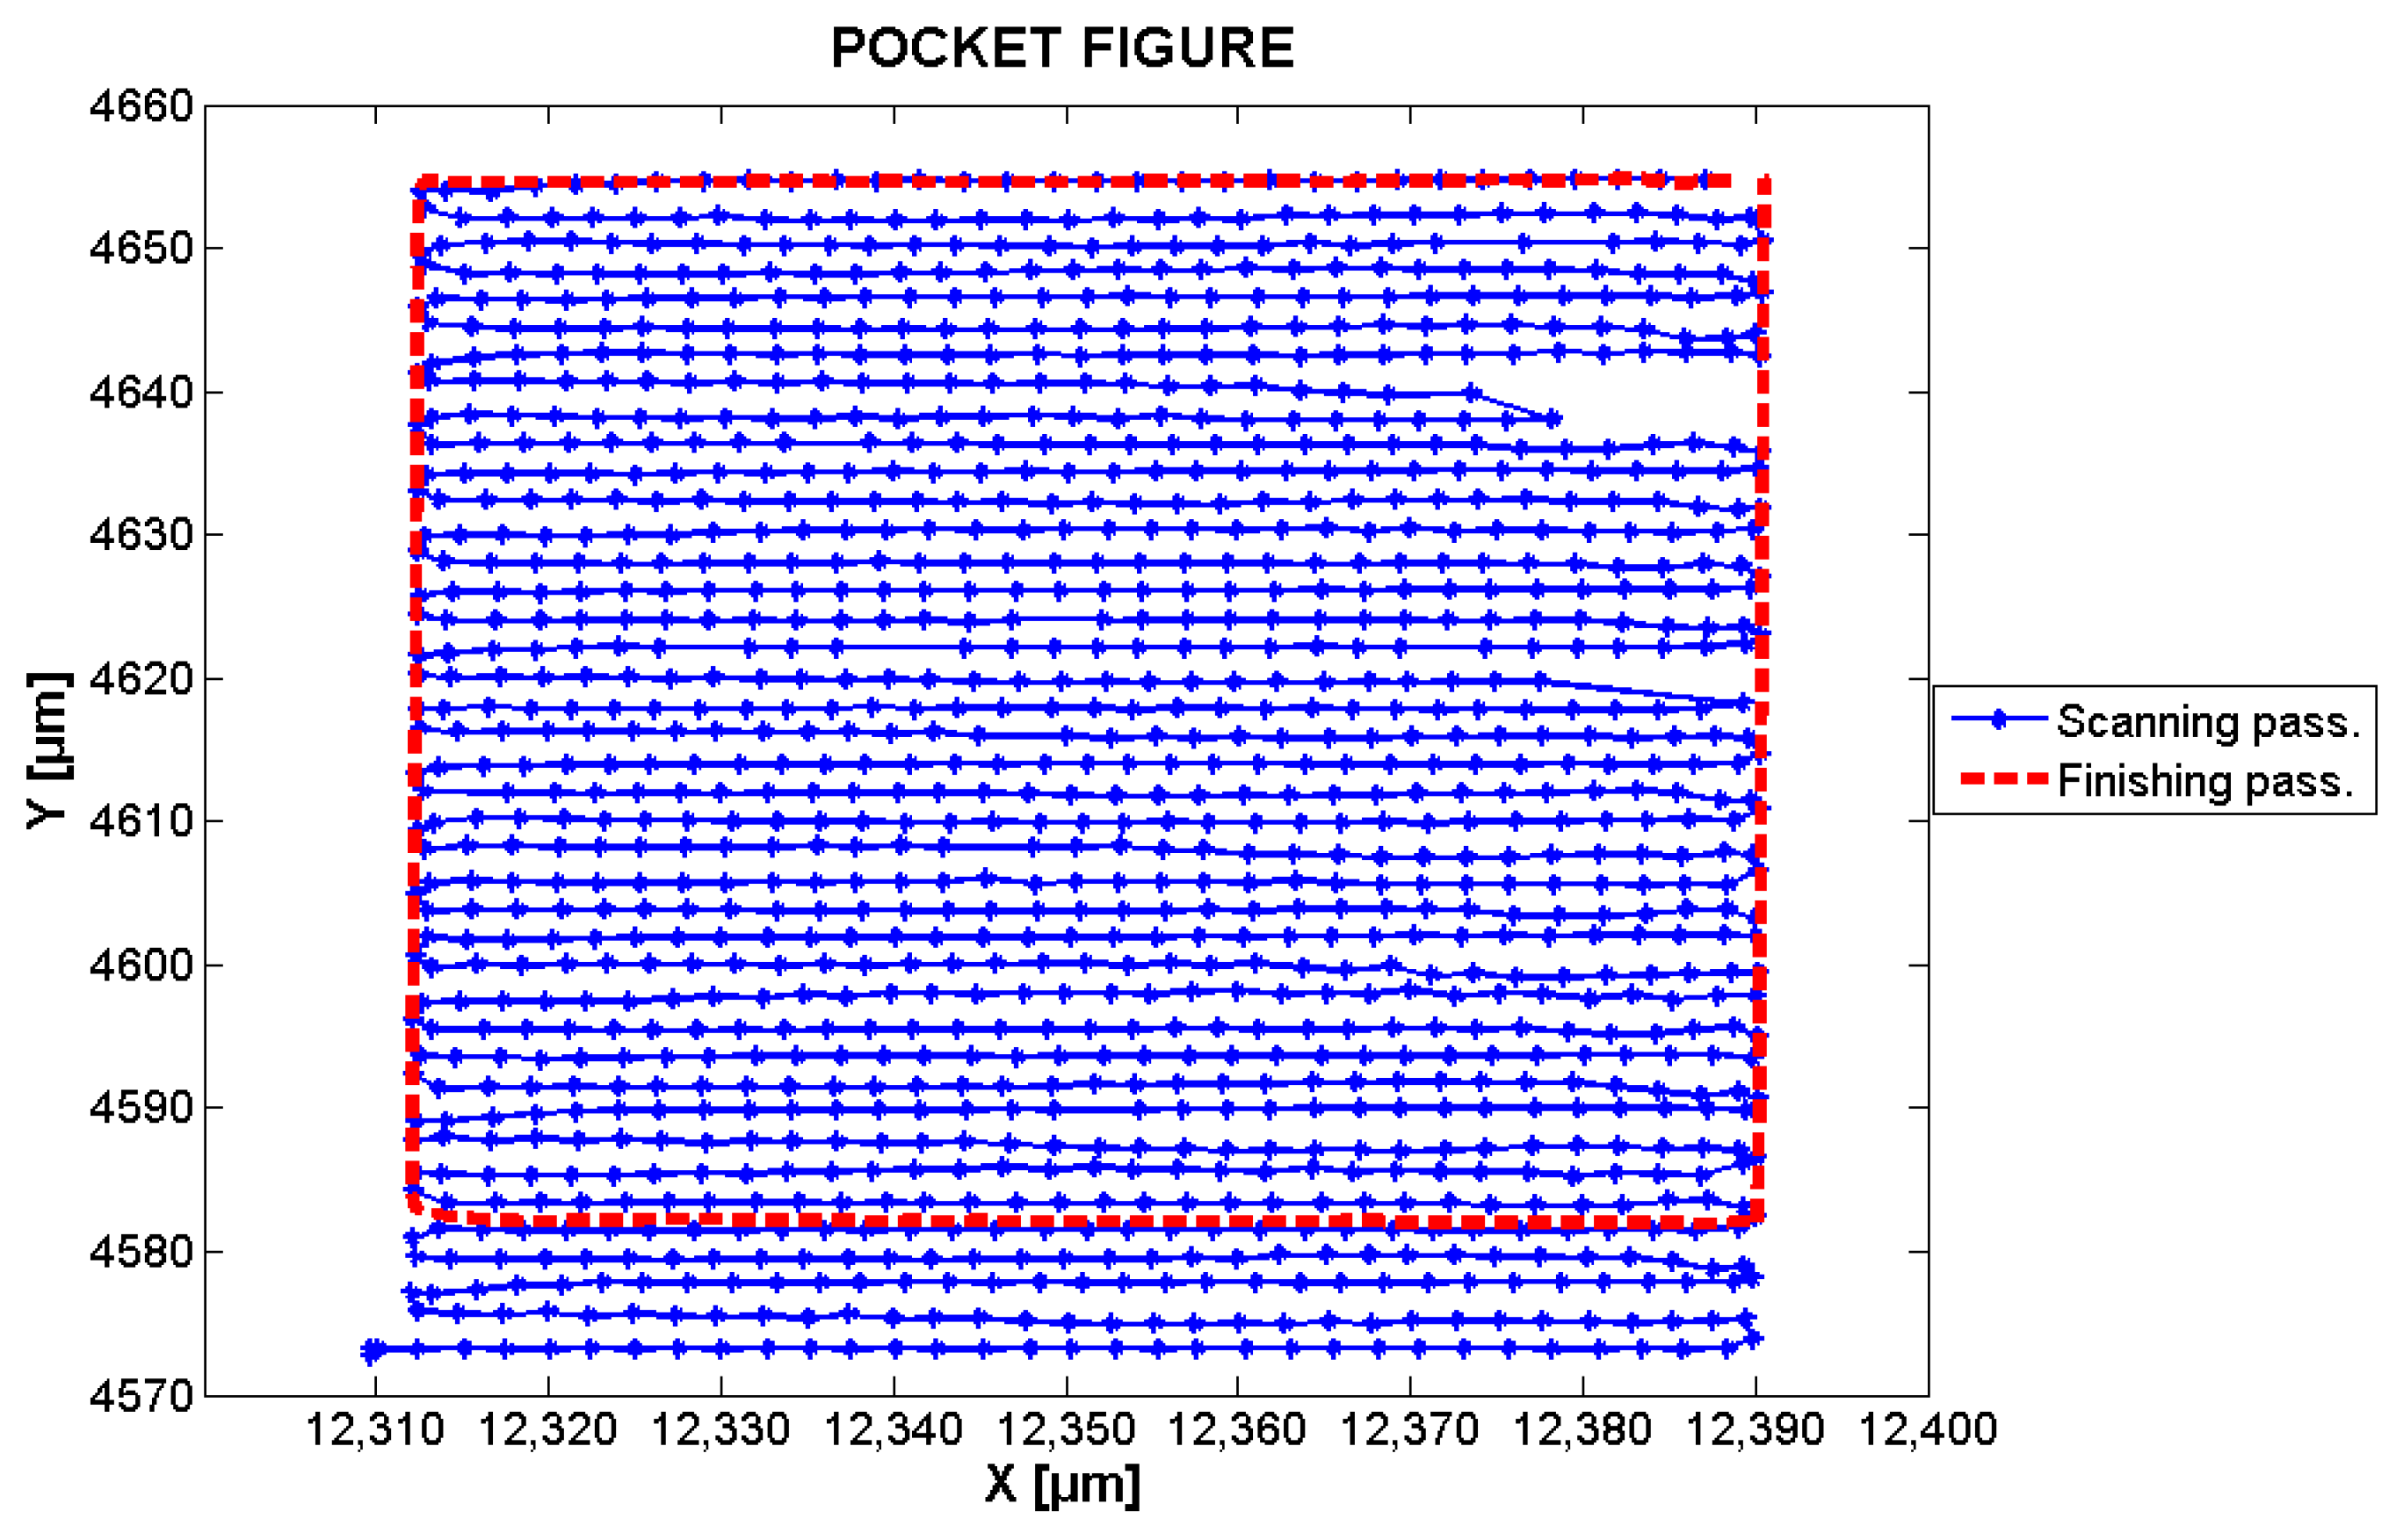
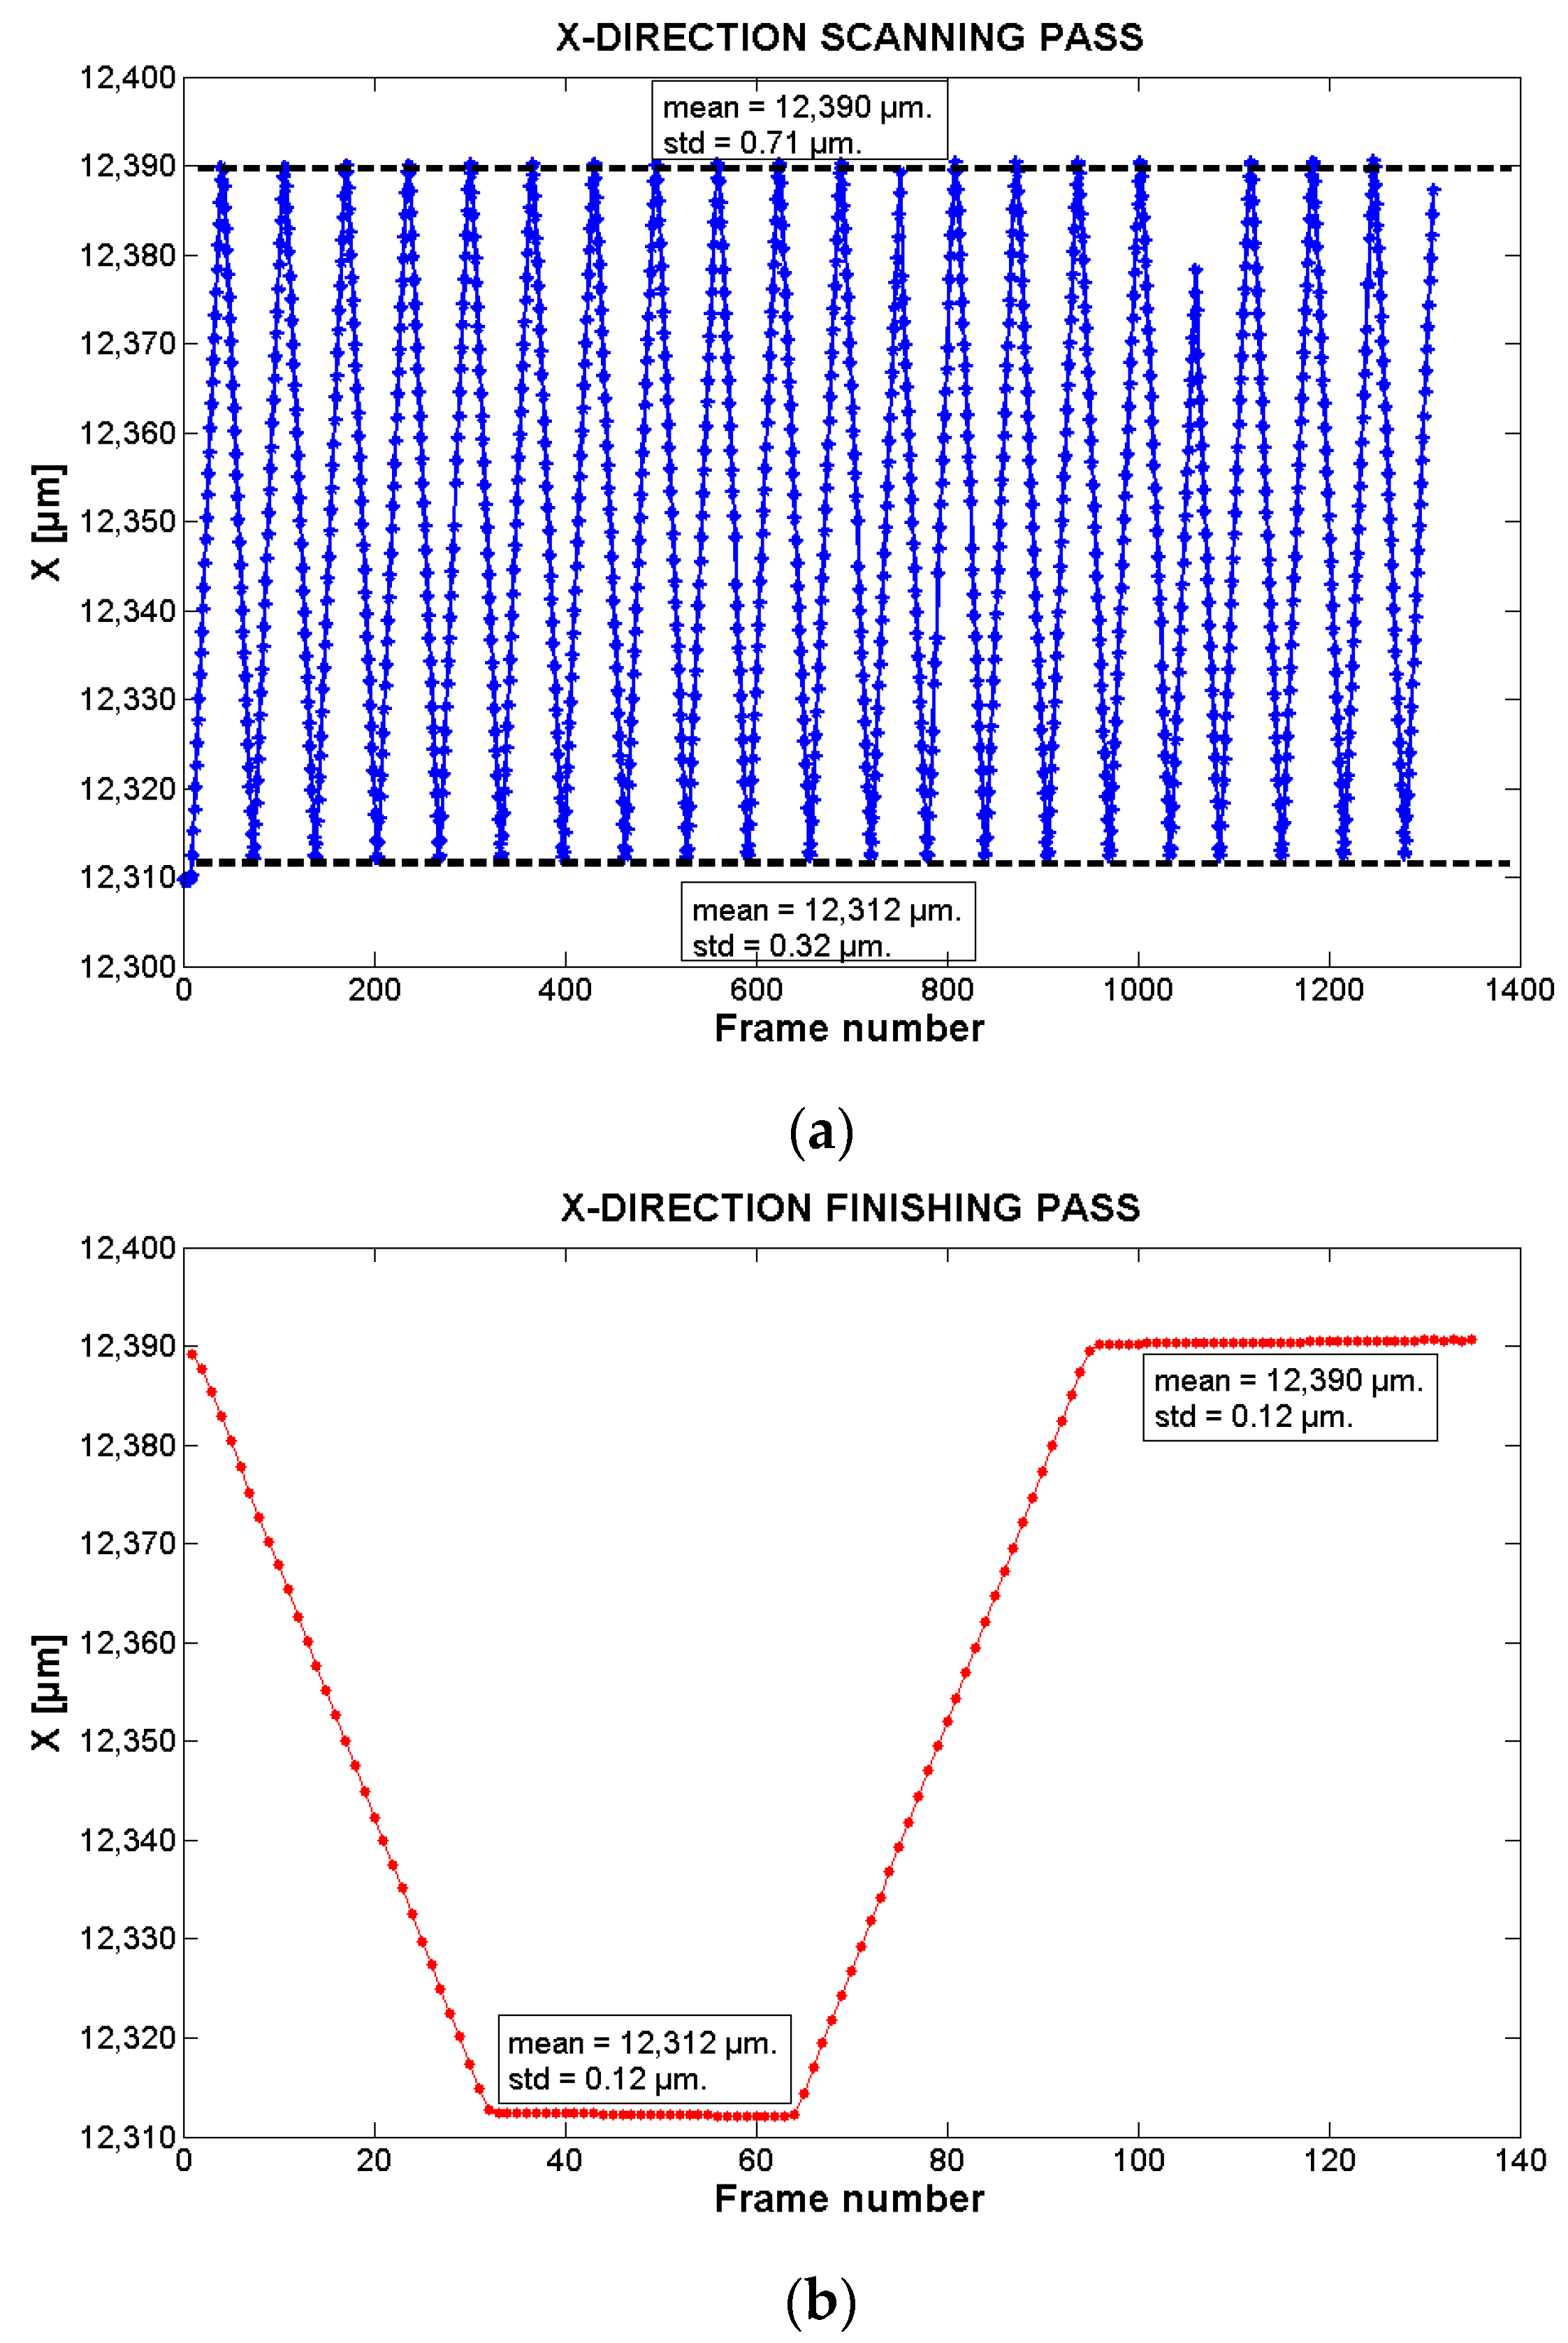
3.2. Path Programming: Pocket Figures and the Effects of the Milling Parameters on the Stage’s Behavior
4. Discussion
5. Conclusions and Future Work
Acknowledgments
Author Contributions
Conflicts of Interest
References
- Rawat, K.; Boolchandani, S. Review Paper on Nano Technology Applications and Concepts. In Proceedings of the National Conference on Innovations in Microelectronics, Signal Processing, and Communication Technology, Jaipur, India, 26–27 February 2016; pp. 61–62.
- Nag, A.; Zia, A.I.; Mukhopadhyay, S.C. Performance enhancement of electronic sensor through mask-less lithography. In Proceedings of the 9th International Conference on Sensing Technology (ICST), Auckland, New Zealand, 8–10 December 2015; pp. 374–379.
- Bat, E.; Lee, J.; Lau, U.Y.; Maynard, H.D. Trehalose glycopolymer resists allow direct writing of protein patterns by electron-beam lithography. Nat. Commun. 2015, 6, 6654. [Google Scholar] [CrossRef] [PubMed]
- Jiang, N. On the spatial resolution limit of direct-write electron beam lithography. Microelectron. Eng. 2017, 168, 41–44. [Google Scholar] [CrossRef]
- Seniutinas, G.; Balčytis, A.; Nishijima, Y.; Nadzeyka, A.; Bauerdick, S.; Juodkazis, S. Ion beam lithography with gold and silicon ions. Appl. Phys. A 2016, 122, 1–6. [Google Scholar] [CrossRef]
- Liu, X.; Carbonell, C.; Braunschweig, A.B. Towards scanning probe lithography-based 4D nanoprinting by advancing surface chemistry, nanopatterning strategies, and characterization protocols. Chem. Soc. Rev. 2016, 45, 6289–6310. [Google Scholar] [CrossRef] [PubMed]
- He, J.; Xu, F.; Cao, Y.; Liu, Y.; Li, D.; Jin, Z. Electrohydrodynamic direct-writing lithography: An alternative maskless technique for microstructure fabrication. Appl. Phys. Lett. 2014, 105, 253109. [Google Scholar] [CrossRef]
- Xu, B.B.; Zhang, Y.L.; Xia, H.; Dong, W.F.; Ding, H.; Sun, H.B. Fabrication and multifunction integration of microfluidic chips by femtosecond laser direct writing. Lab Chip 2013, 13, 1677–1690. [Google Scholar] [CrossRef] [PubMed]
- Do, M.T.; Nguyen, T.T.N.; Li, Q.; Benisty, H.; Ledoux-Rak, I.; Lai, N.D. Submicrometer 3D structures fabrication enabled by one-photon absorption direct laser writing. Opt. Express 2013, 18, 20964–20973. [Google Scholar] [CrossRef] [PubMed]
- Zoubir, A.; Lopez, C.; Richardson, M.; Richardson, K. Femtosecond laser fabrication of tubular waveguides in poly(methyl methacrylate). Opt. Lett. 2004, 29, 1840–1842. [Google Scholar] [CrossRef] [PubMed]
- Rothenbach, C.A.; Gupta, M.C. High resolution, low cost laser lithography using a Blu-ray optical head assembly. Opt. Lasers Eng. 2012, 50, 900–904. [Google Scholar] [CrossRef]
- Greer, A.I.; Della-Rosa, B.; Khokhar, A.Z.; Gadegaard, N. Step-and-Repeat Nanoimprint-, Photo-and Laser Lithography from One Customised CNC Machine. Nanoscale Res. Lett. 2016, 11, 129. [Google Scholar] [CrossRef] [PubMed]
- Tan, N.; Clévy, C.; Laurent, G.J.; Chaillet, N. Compressive Sensing-Based Metrology for Micropositioning Stages Characterization. IEEE Robot. Autom. Lett. 2016, 1, 638–645. [Google Scholar] [CrossRef]
- Lee, H.W.; Liu, C.H. Vision servo motion control and error analysis of a coplanar stage for image alignment motion. Math. Probl. Eng. 2013, 2013, 592312. [Google Scholar] [CrossRef]
- Lin, C.J.; Hsu, H.H.; Cheng, C.H.; Li, Y.C. Design of an Image-Servo Mask Alignment System Using Dual CCDs with an XXY Stage. Appl. Sci. 2016, 6, 42. [Google Scholar] [CrossRef]
- Lin, C.J.; Yu, S.K.; Li, Y.C.; Yang, C.W. Design and control of an optical alignment system using a XXY stage integrated with dual CCDs. Smart Sci. 2014, 2, 160–167. [Google Scholar] [CrossRef]
- Galeano, J.A.; Sandoz, P.; Gaiffe, E.; Launay, S.; Robert, L.; Jacquot, M.; Hirchaud, F.; Prétet, J.-L.; Mougin, C. Position-referenced microscopy for live cell culture monitoring. Biomed. Opt. Express 2011, 2, 1307–1318. [Google Scholar] [CrossRef] [PubMed]
- Galeano-Zea, J.A.; Sandoz, P.; Gaiffe, E.; Prétet, J.L.; Mougin, C. Pseudo-periodic encryption of extended 2-D surfaces for high accurate recovery of any random zone by vision. Int. J. Optomech. 2010, 4, 65–82. [Google Scholar] [CrossRef]
- Guelpa, V.; Laurent, G.J.; Sandoz, P.; Zea, J.G.; Clévy, C. Subpixelic measurement of large 1D displacements: Principle, processing algorithms, performances and software. Sensors 2014, 14, 5056–5073. [Google Scholar] [CrossRef] [PubMed] [Green Version]
- Chen, P.Y.; Jywe, W.Y.; Wang, M.S.; Wu, C.H. Application of blue laser direct-writing equipment for manufacturing of periodic and aperiodic nanostructure patterns. Precis. Eng. 2016, 46, 263–269. [Google Scholar] [CrossRef]
- Liu, Z.; Xu, W.; Hou, Z.; Wu, Z. A Rapid Prototyping Technique for Microfluidics with High Robustness and Flexibility. Micromachines 2016, 7, 201. [Google Scholar] [CrossRef]
- Kim, H.-C. Tool path generation and modification for constant cutting forces in direction parallel milling. Int. J. Adv. Manuf. Technol. 2011, 52, 937–947. [Google Scholar] [CrossRef]
- Romero, P.E.; Dorado, R.; Díaz, F.A.; Rubio, E.M. Influence of pocket geometry and tool path strategy in pocket milling of UNS A96063 alloy. Procedia Eng. 2013, 63, 523–531. [Google Scholar] [CrossRef]
- Takeda, M.; Ina, H.; Kobayashi, S. Fourier-transform method of fringe-pattern analysis for computer-based topography and interferometry. J. Opt. Soc. Am. 1982, 72, 156–160. [Google Scholar] [CrossRef]
- Green, R.J.; Walker, J.G.; Robinsoni, D.W. Investigation of the Fourier-transform method of fringe pattern analysis. Opt. Lasers Eng. 1988, 8, 29–44. [Google Scholar] [CrossRef]
- Galeano, J.; Sandoz, P.; Laurent, G.J.; Lemos, L.L.; Clevy, C. Twin-scale vernier micro-pattern for visual measurement of 1-D in-plane absolute displacements with increased range-to-resolution ratio. Int. J. Optomech. 2013, 7, 222–234. [Google Scholar]
- Galeano, J.A.; Sandoz, P.; Robert, L. Position encryption of extended surfaces for subpixel localization of small-sized fields of observation. In Proceedings of the International Symposium on Optomechatronic Technologies, Istanbul, Turkey, 21–23 September 2009; pp. 22–27.


| Step Number | Mean Value (µm) | STD (µm) | Step Value (µm) |
|---|---|---|---|
| 1 | 4573.22 | 0.02 | 0.00 |
| 2 | 4575.31 | 0.25 | 2.09 |
| 3 | 4577.84 | 0.03 | 2.53 |
| 4 | 4579.59 | 0.11 | 1.76 |
| 5 | 4581.48 | 0.03 | 1.89 |
| 6 | 4583.43 | 0.09 | 1.95 |
| 7 | 4585.55 | 0.17 | 2.12 |
| 8 | 4587.48 | 0.30 | 1.93 |
| 9 | 4589.94 | 0.06 | 2.45 |
| 10 | 4591.65 | 0.16 | 1.71 |
| 11 | 4593.63 | 0.07 | 1.98 |
| 12 | 4595.53 | 0.10 | 1.90 |
| 13 | 4597.90 | 0.20 | 2.37 |
| 14 | 4599.85 | 0.33 | 1.94 |
| 15 | 4601.95 | 0.10 | 2.10 |
| 16 | 4603.81 | 0.13 | 1.86 |
| 17 | 4605.72 | 0.10 | 1.92 |
| 18 | 4608.02 | 0.32 | 2.30 |
| 19 | 4610.02 | 0.09 | 2.00 |
| 20 | 4612.00 | 0.10 | 1.98 |
| 21 | 4614.00 | 0.02 | 2.00 |
| 22 | 4616.10 | 0.19 | 2.10 |
| 23 | 4617.86 | 0.06 | 1.76 |
| 24 | 4619.90 | 0.15 | 2.04 |
| 25 | 4622.16 | 0.02 | 2.26 |
| 26 | 4624.08 | 0.04 | 1.91 |
| 27 | 4626.12 | 0.06 | 2.04 |
| 28 | 4628.05 | 0.09 | 1.93 |
| 29 | 4630.25 | 0.16 | 2.20 |
| 30 | 4632.39 | 0.10 | 2.13 |
| 31 | 4634.39 | 0.08 | 2.01 |
| 32 | 4636.35 | 0.12 | 1.95 |
| 33 | 4638.13 | 0.12 | 1.79 |
| 34 | 4640.65 | 0.11 | 2.51 |
| 35 | 4642.59 | 0.09 | 1.94 |
| 36 | 4644.47 | 0.10 | 1.88 |
| 37 | 4646.56 | 0.09 | 2.08 |
| 38 | 4648.41 | 0.15 | 1.86 |
| 39 | 4650.27 | 0.13 | 1.85 |
| 40 | 4652.25 | 0.39 | 1.98 |
| 41 | 4654.73 | 0.04 | 2.48 |
© 2017 by the authors. Licensee MDPI, Basel, Switzerland. This article is an open access article distributed under the terms and conditions of the Creative Commons Attribution (CC BY) license ( http://creativecommons.org/licenses/by/4.0/).
Share and Cite
Jaramillo, J.; Zarzycki, A.; Galeano, J.; Sandoz, P. Performance Characterization of an xy-Stage Applied to Micrometric Laser Direct Writing Lithography. Sensors 2017, 17, 278. https://doi.org/10.3390/s17020278
Jaramillo J, Zarzycki A, Galeano J, Sandoz P. Performance Characterization of an xy-Stage Applied to Micrometric Laser Direct Writing Lithography. Sensors. 2017; 17(2):278. https://doi.org/10.3390/s17020278
Chicago/Turabian StyleJaramillo, Juan, Artur Zarzycki, July Galeano, and Patrick Sandoz. 2017. "Performance Characterization of an xy-Stage Applied to Micrometric Laser Direct Writing Lithography" Sensors 17, no. 2: 278. https://doi.org/10.3390/s17020278