
Measurement of the Length of Installed Rock Bolt Based on Stress Wave Reflection by Using a Giant Magnetostrictive (GMS) Actuator and a PZT Sensor


Abstract
:1. Introduction
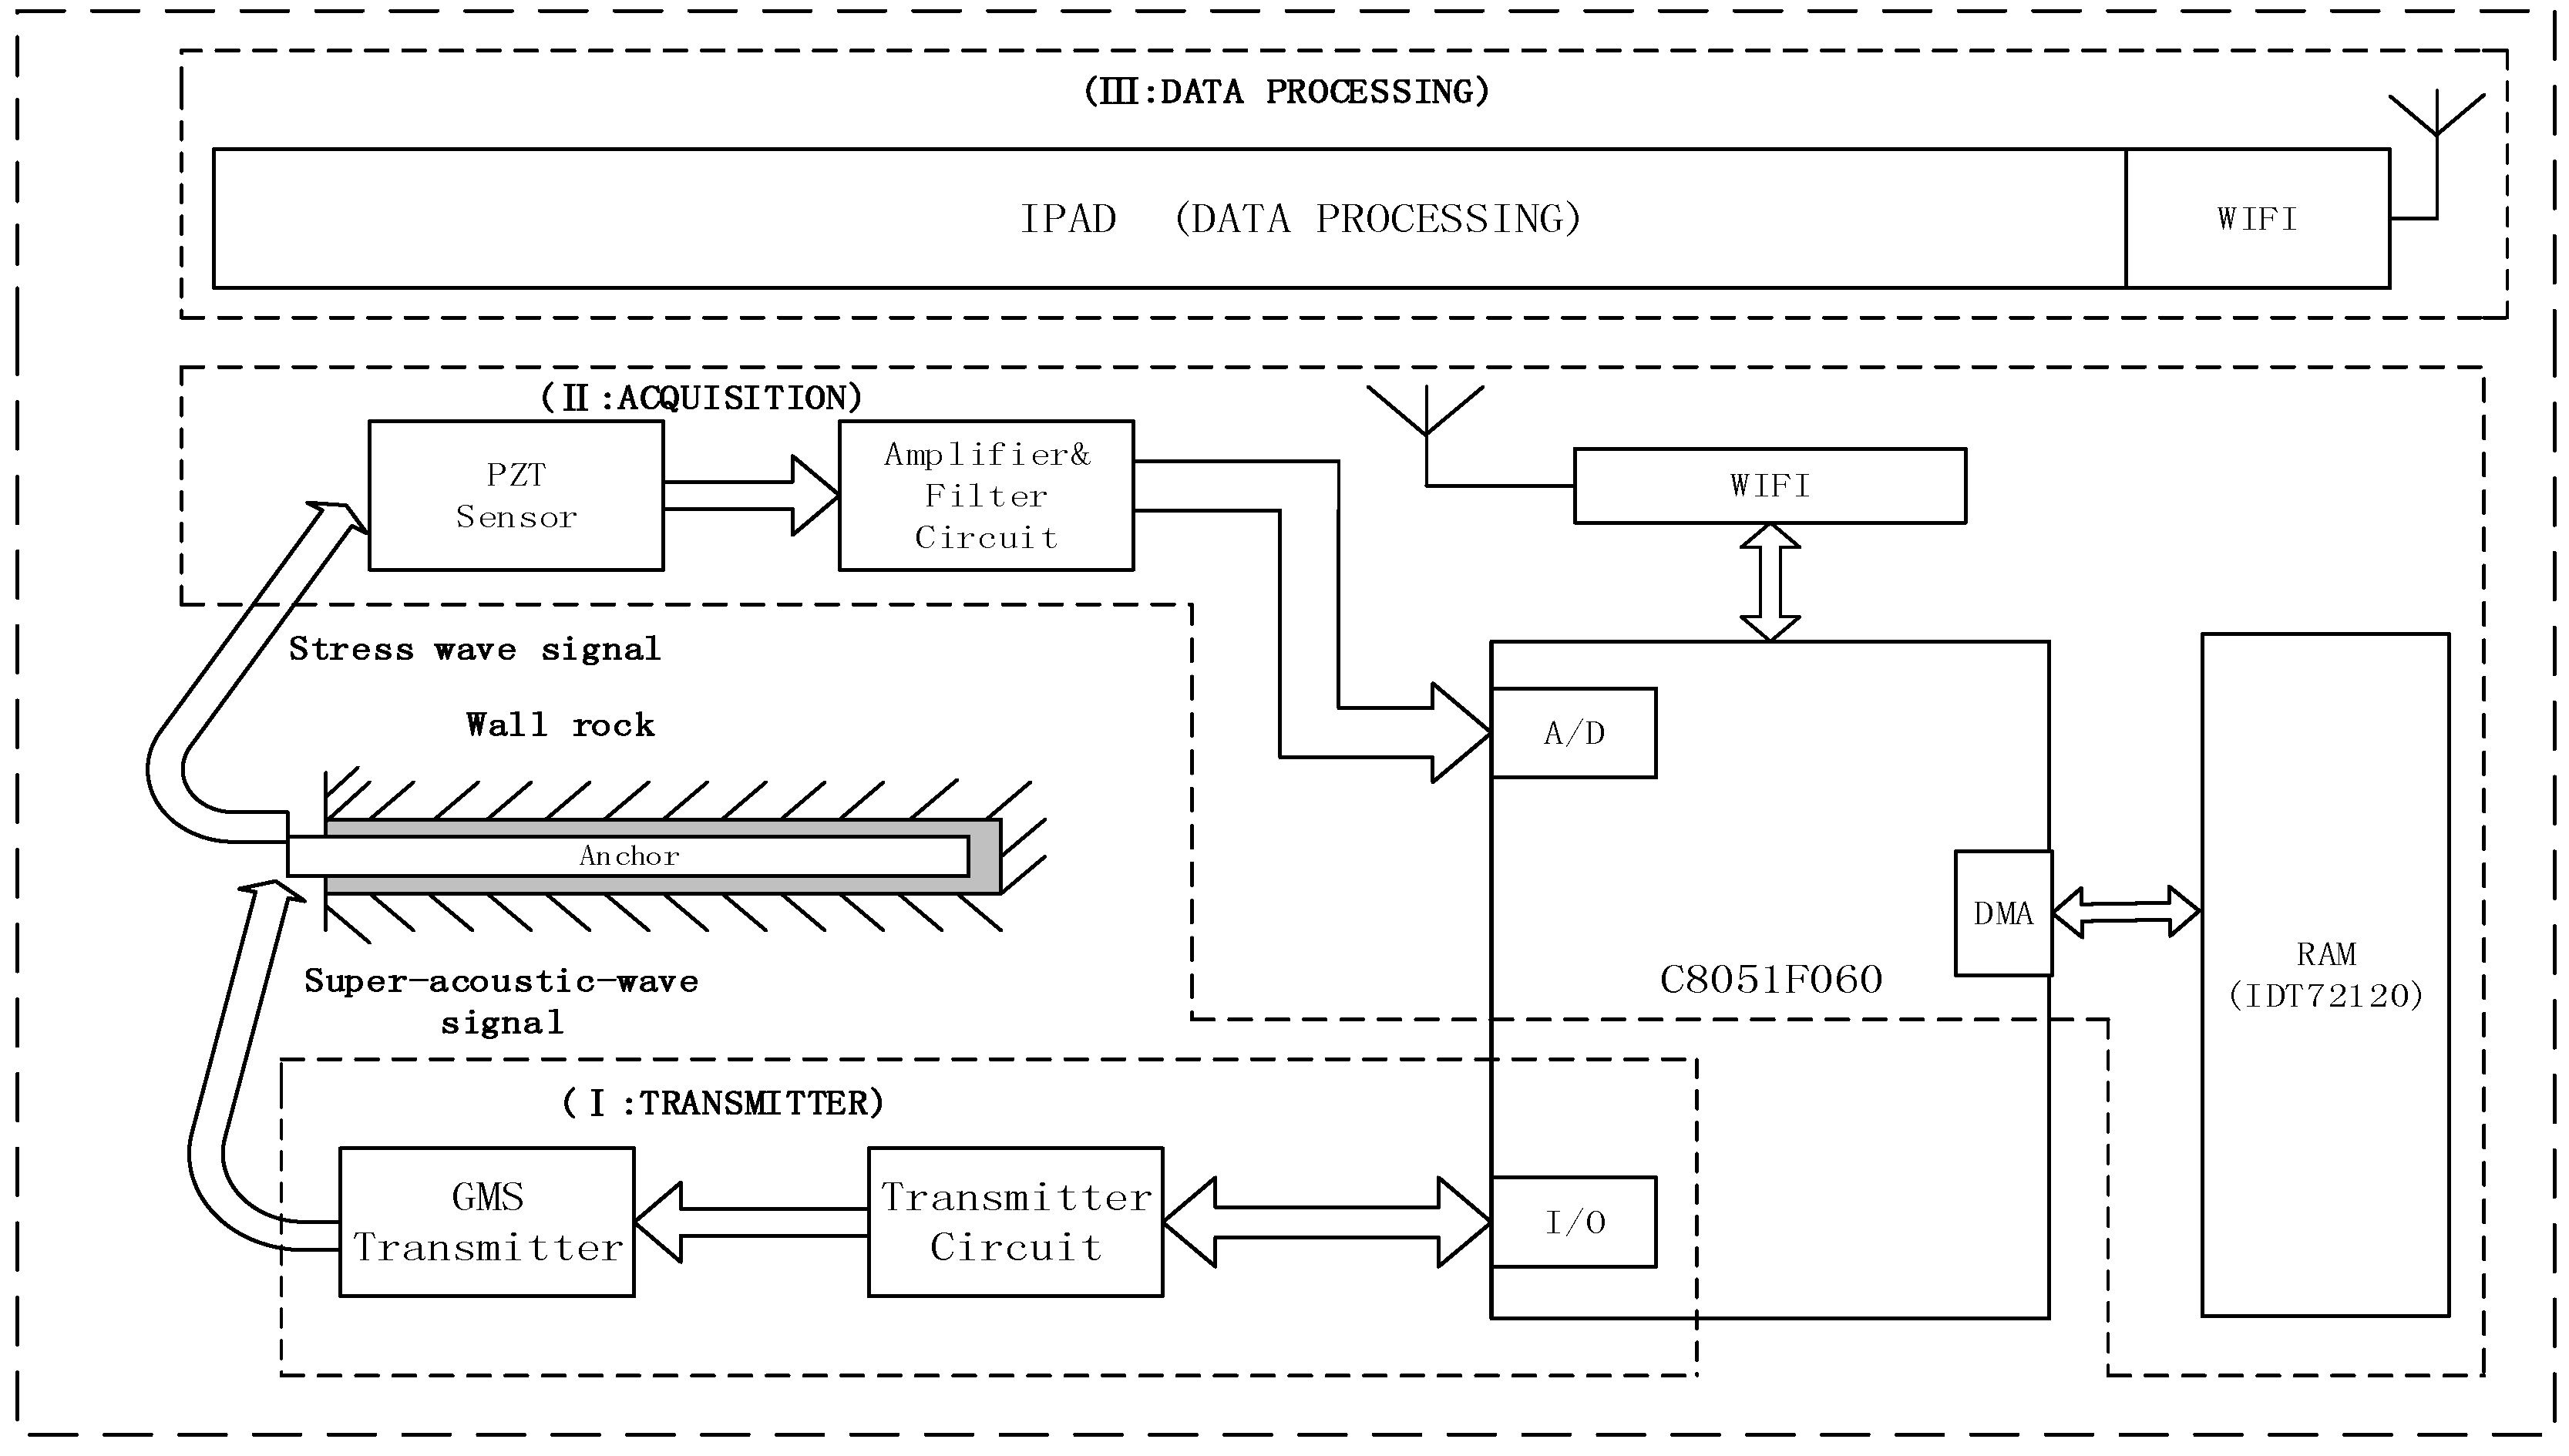
2. Proposed Instrumentation and Method
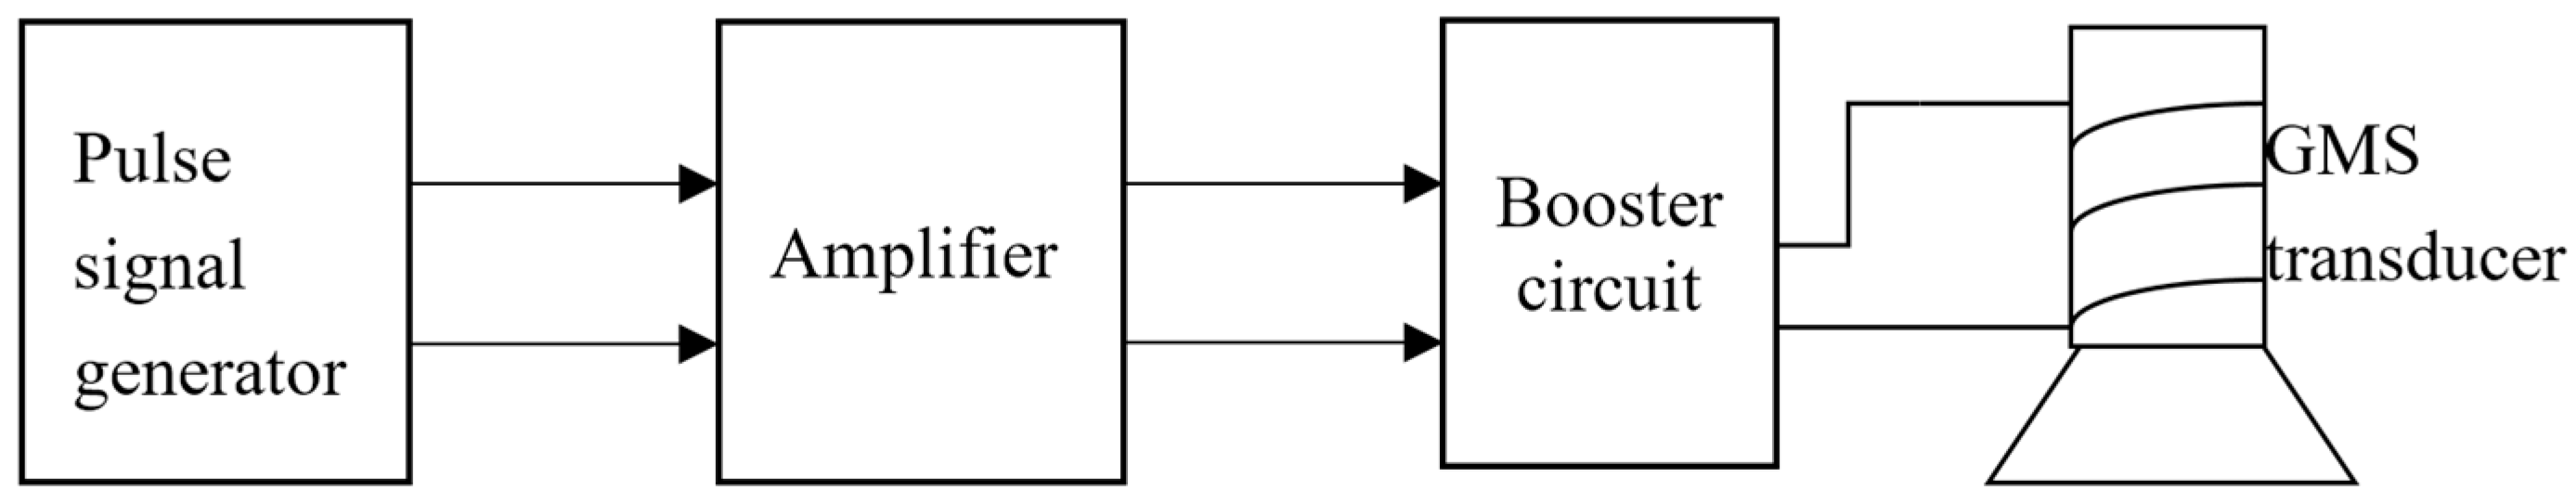
2.1. Measurement System Setup
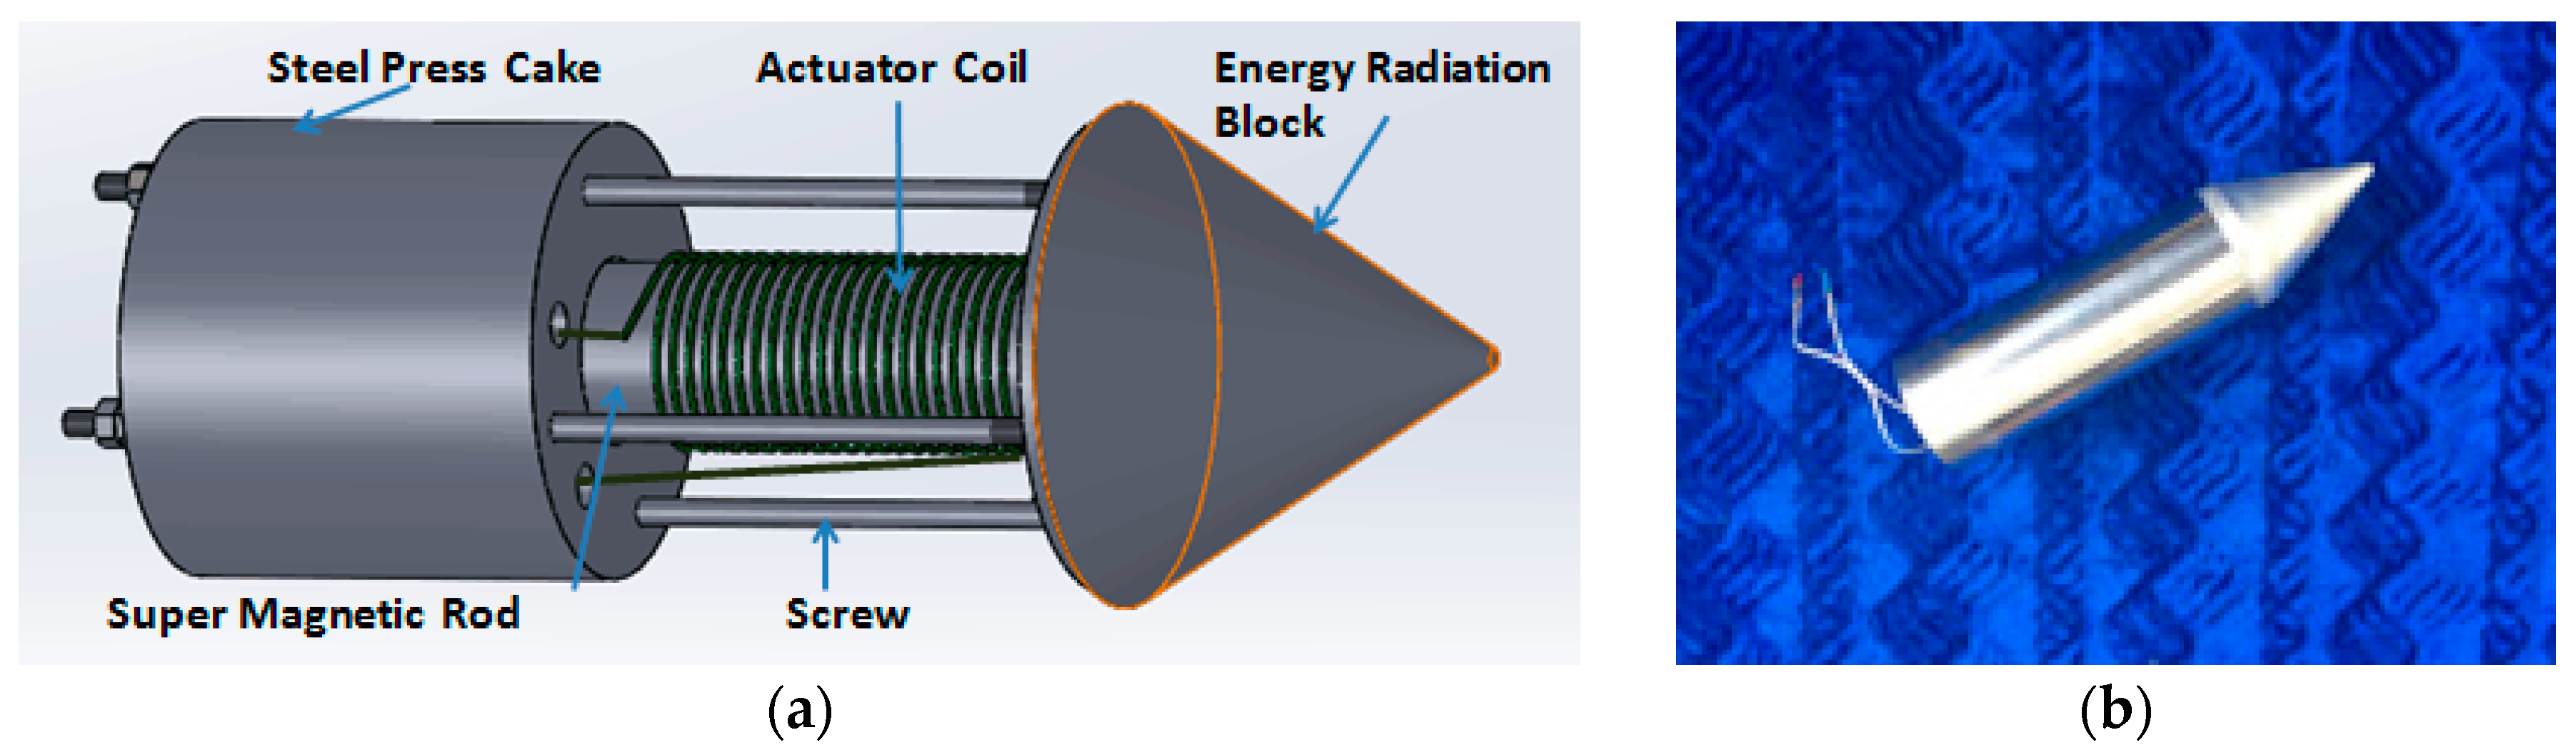
2.2. Principle of GMS Transducer
2.3. Algorithm for Rock Bolt Length Information Extraction
3. Experimental Verification
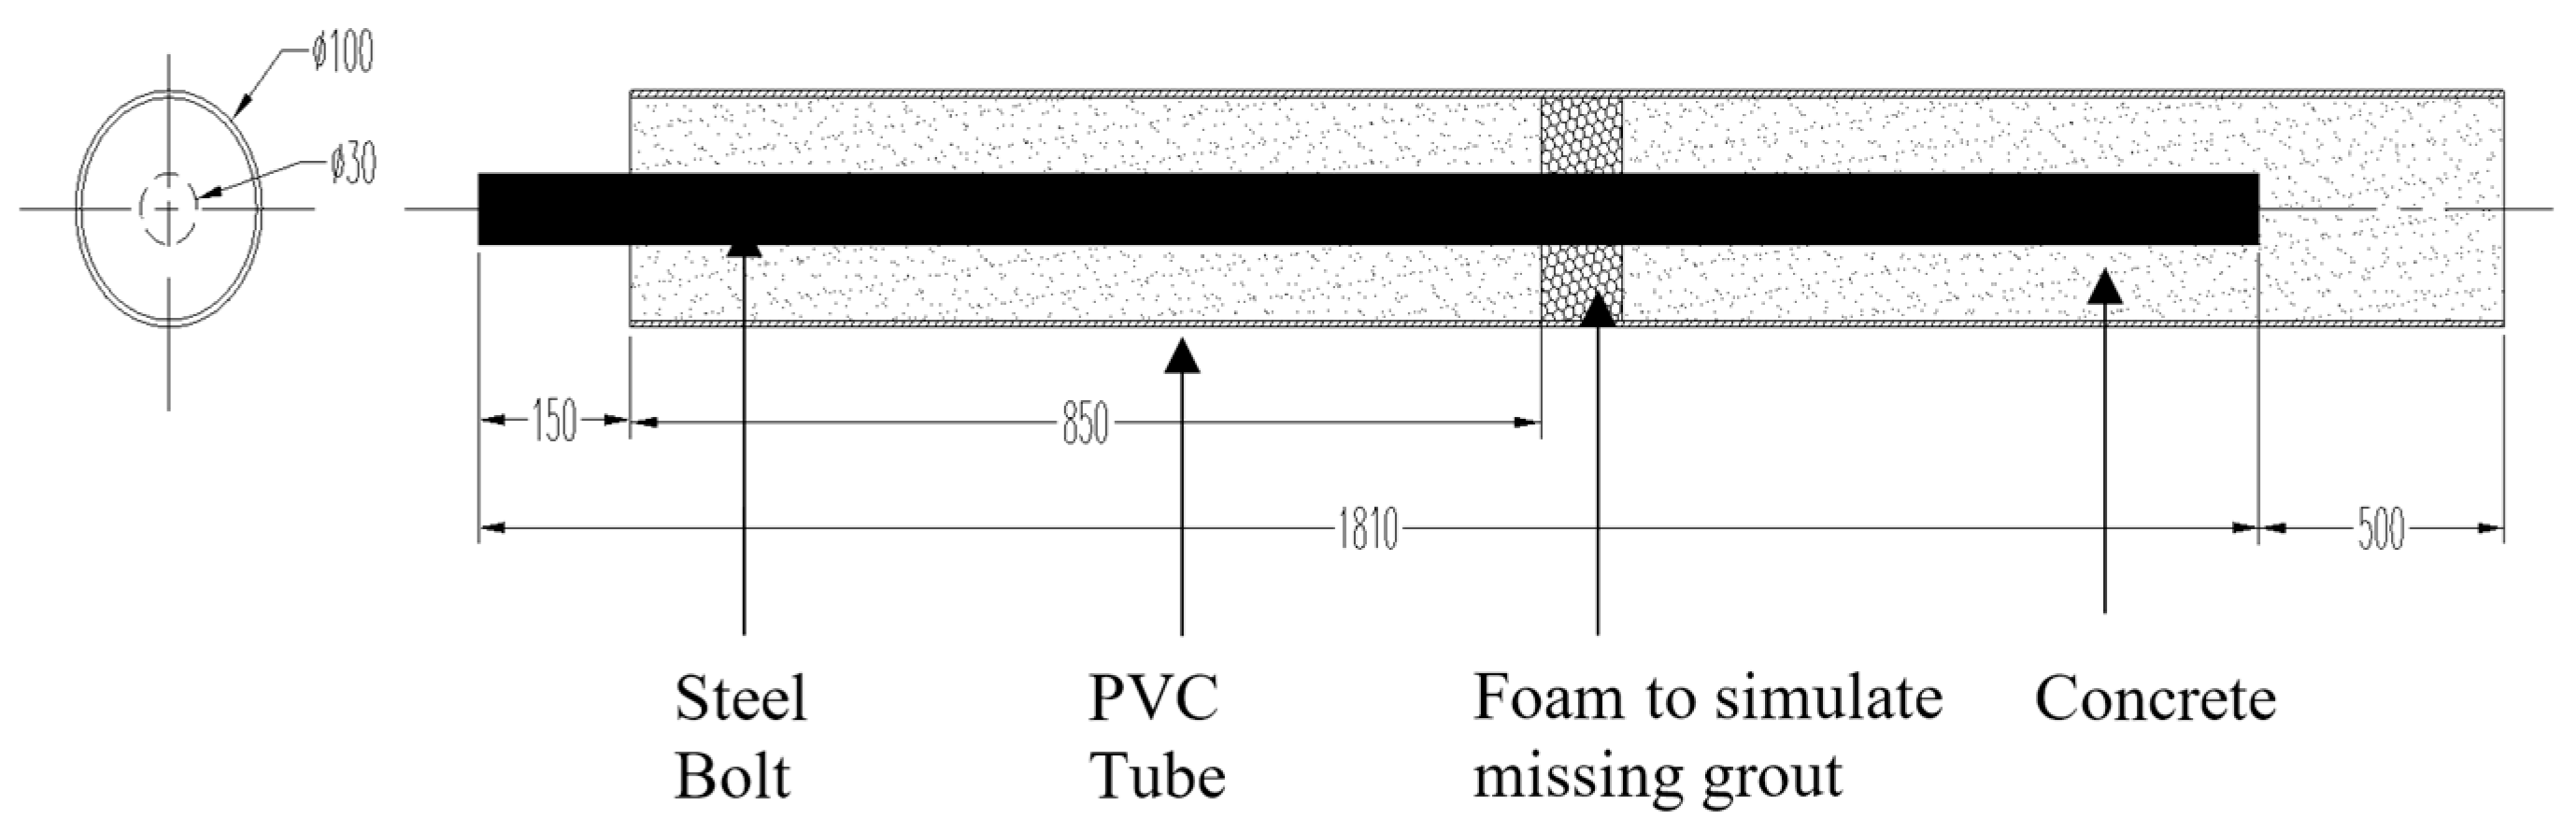
3.1. Specimen Fabrication
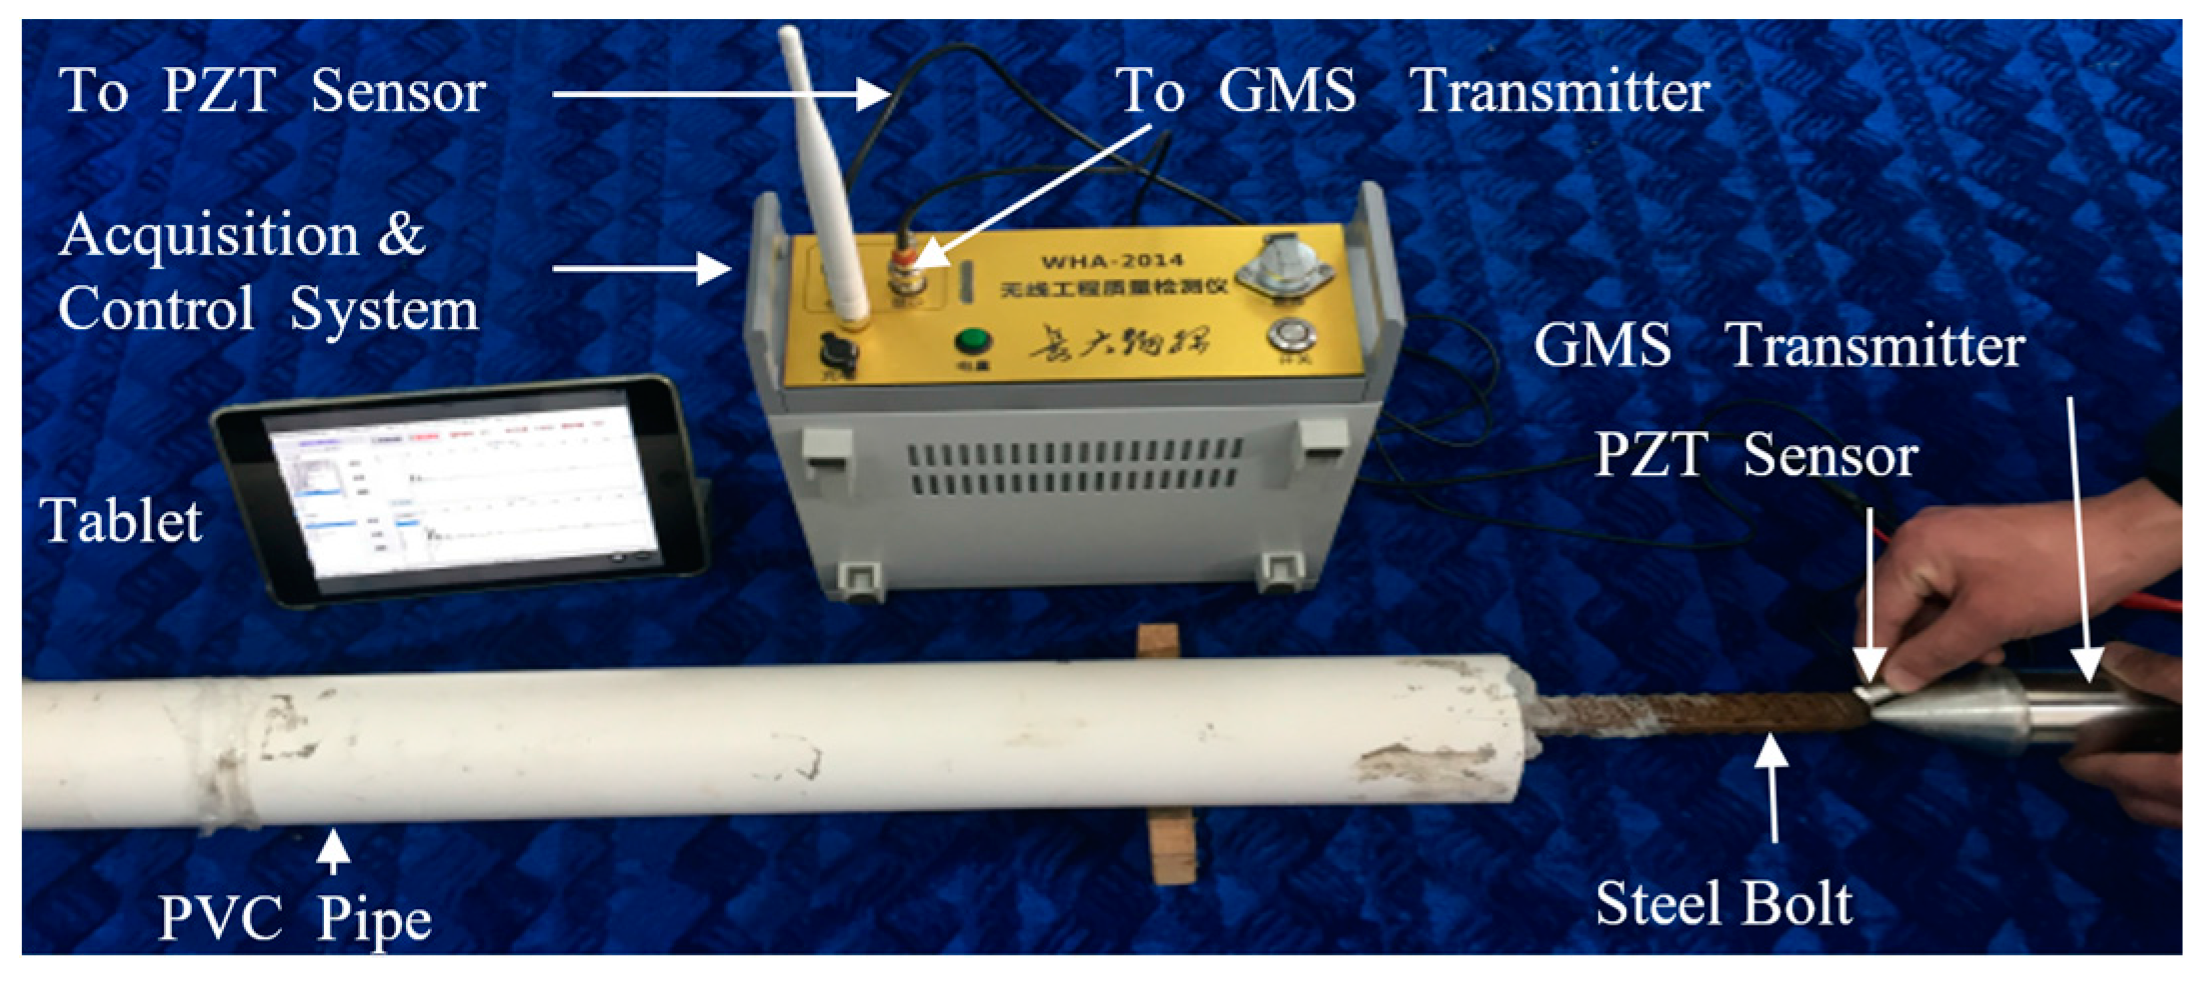
3.2. Instrumentation and Experimental Setup
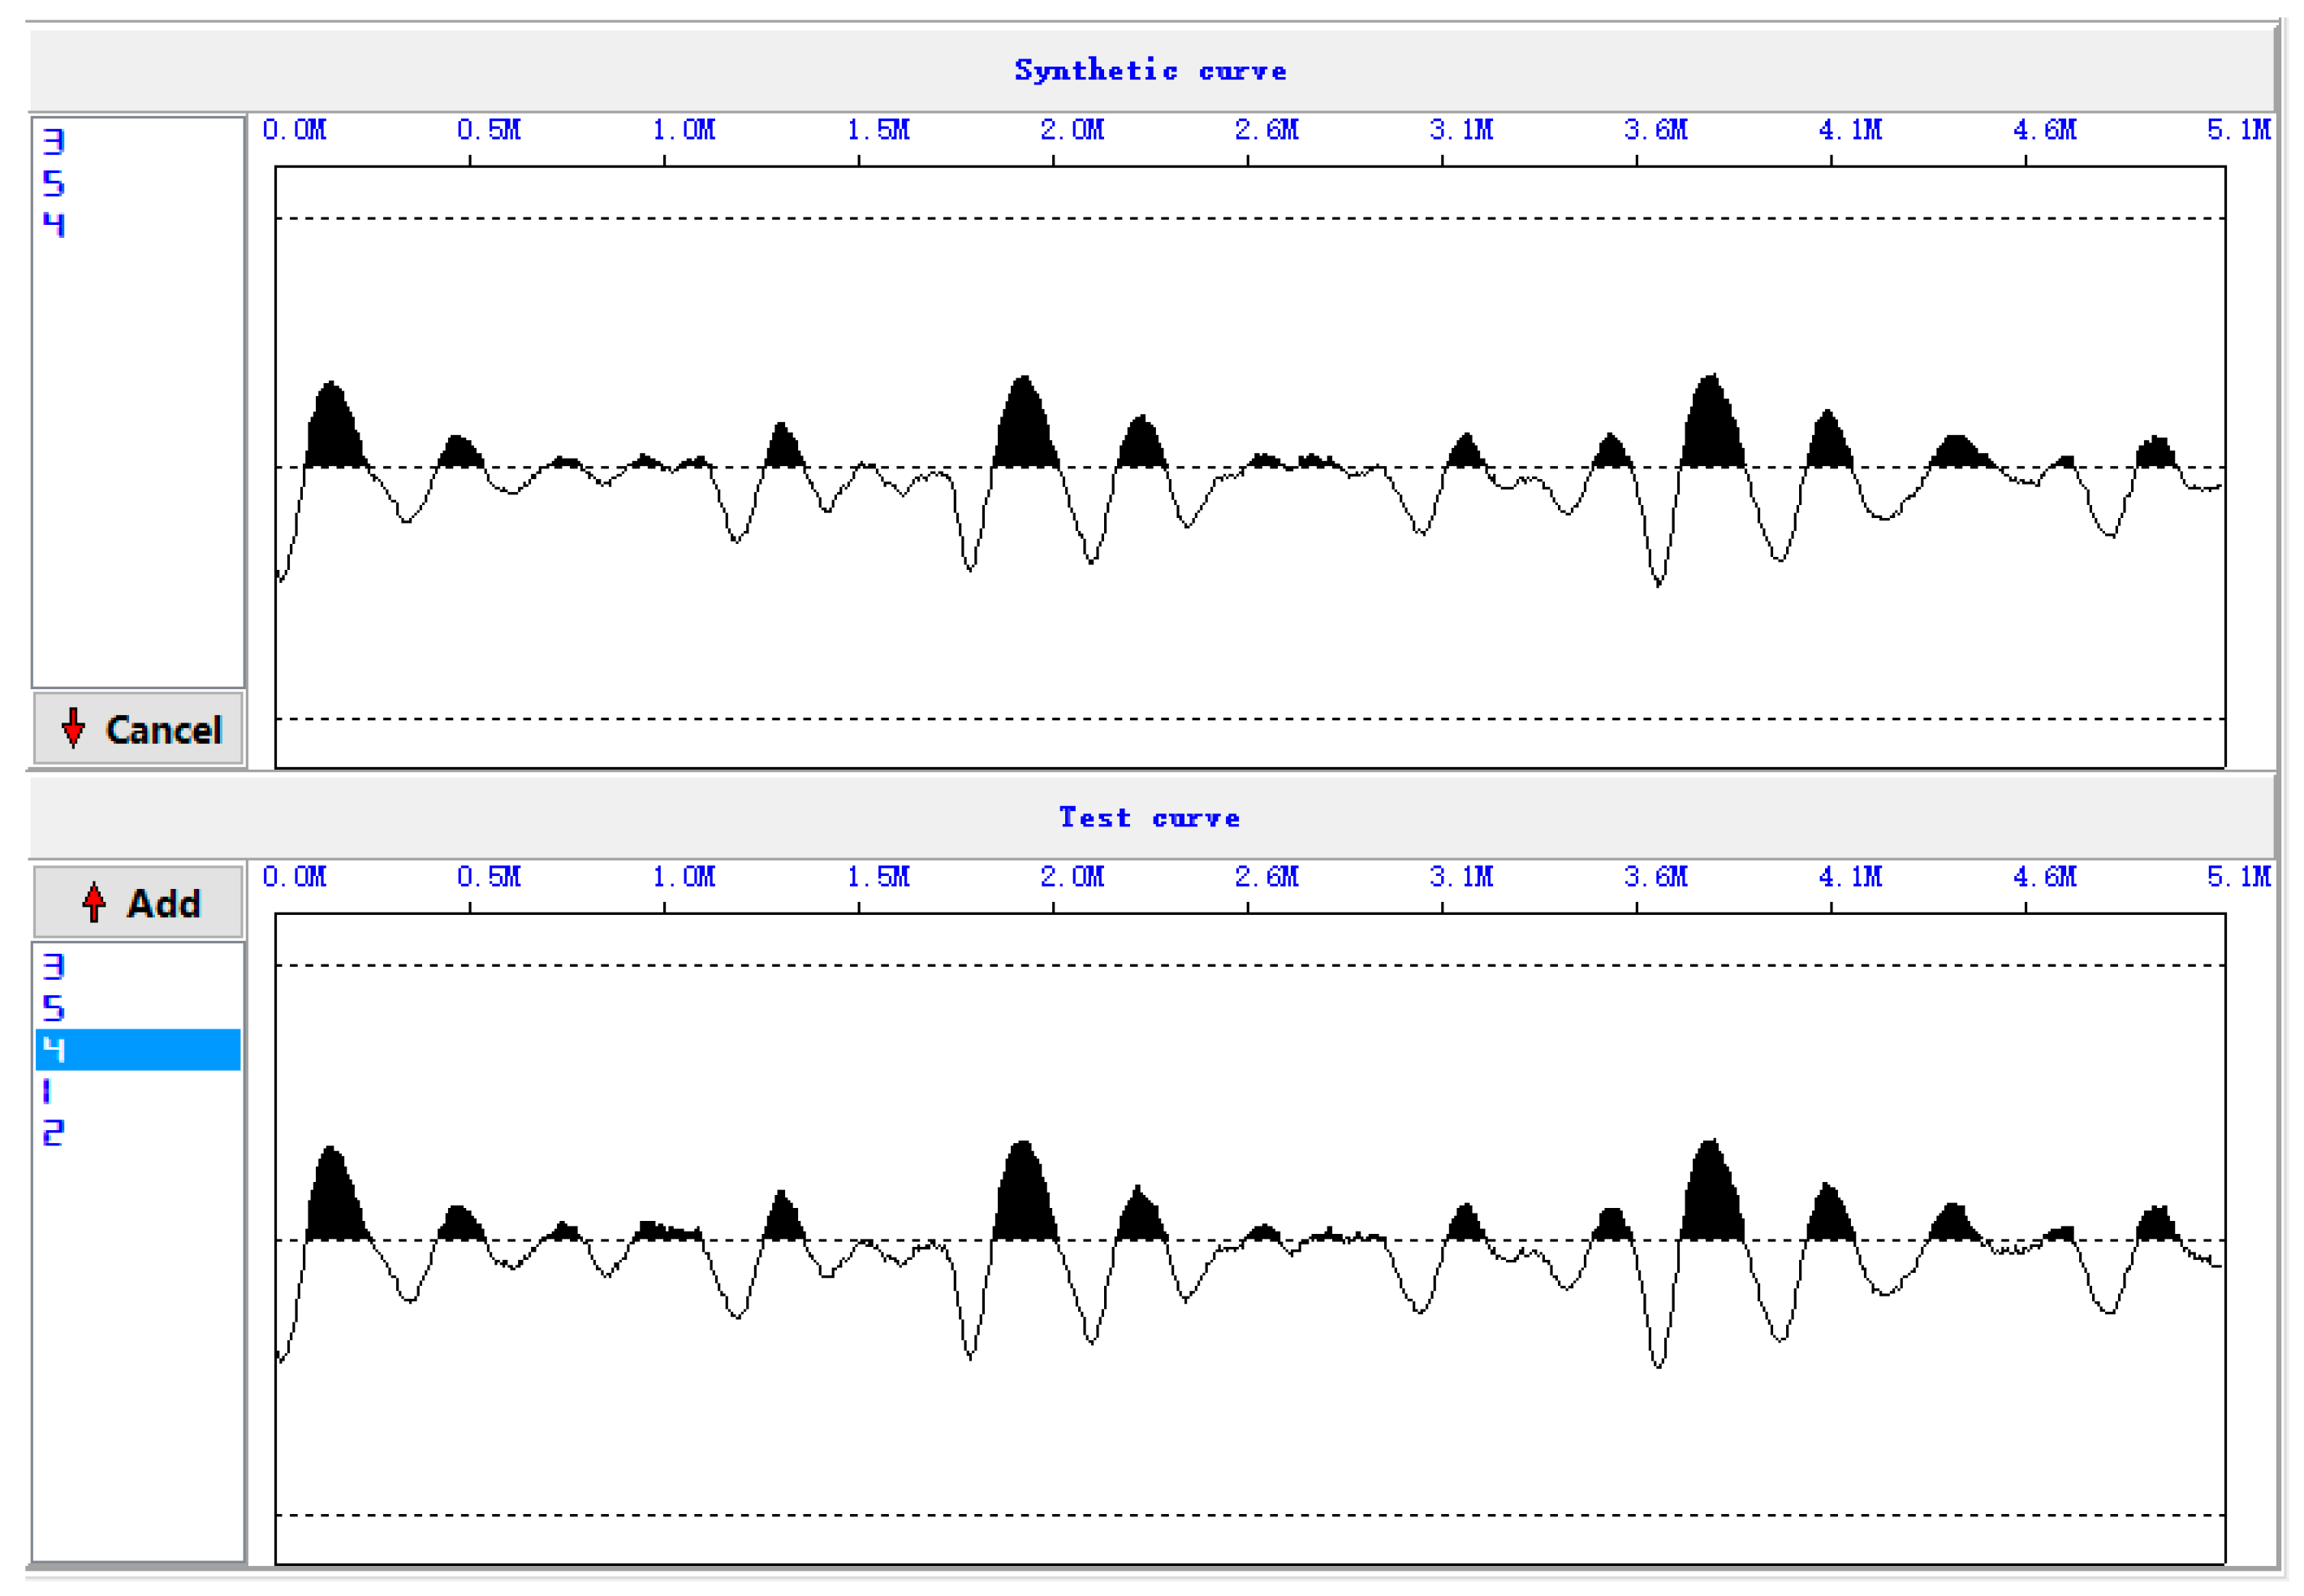
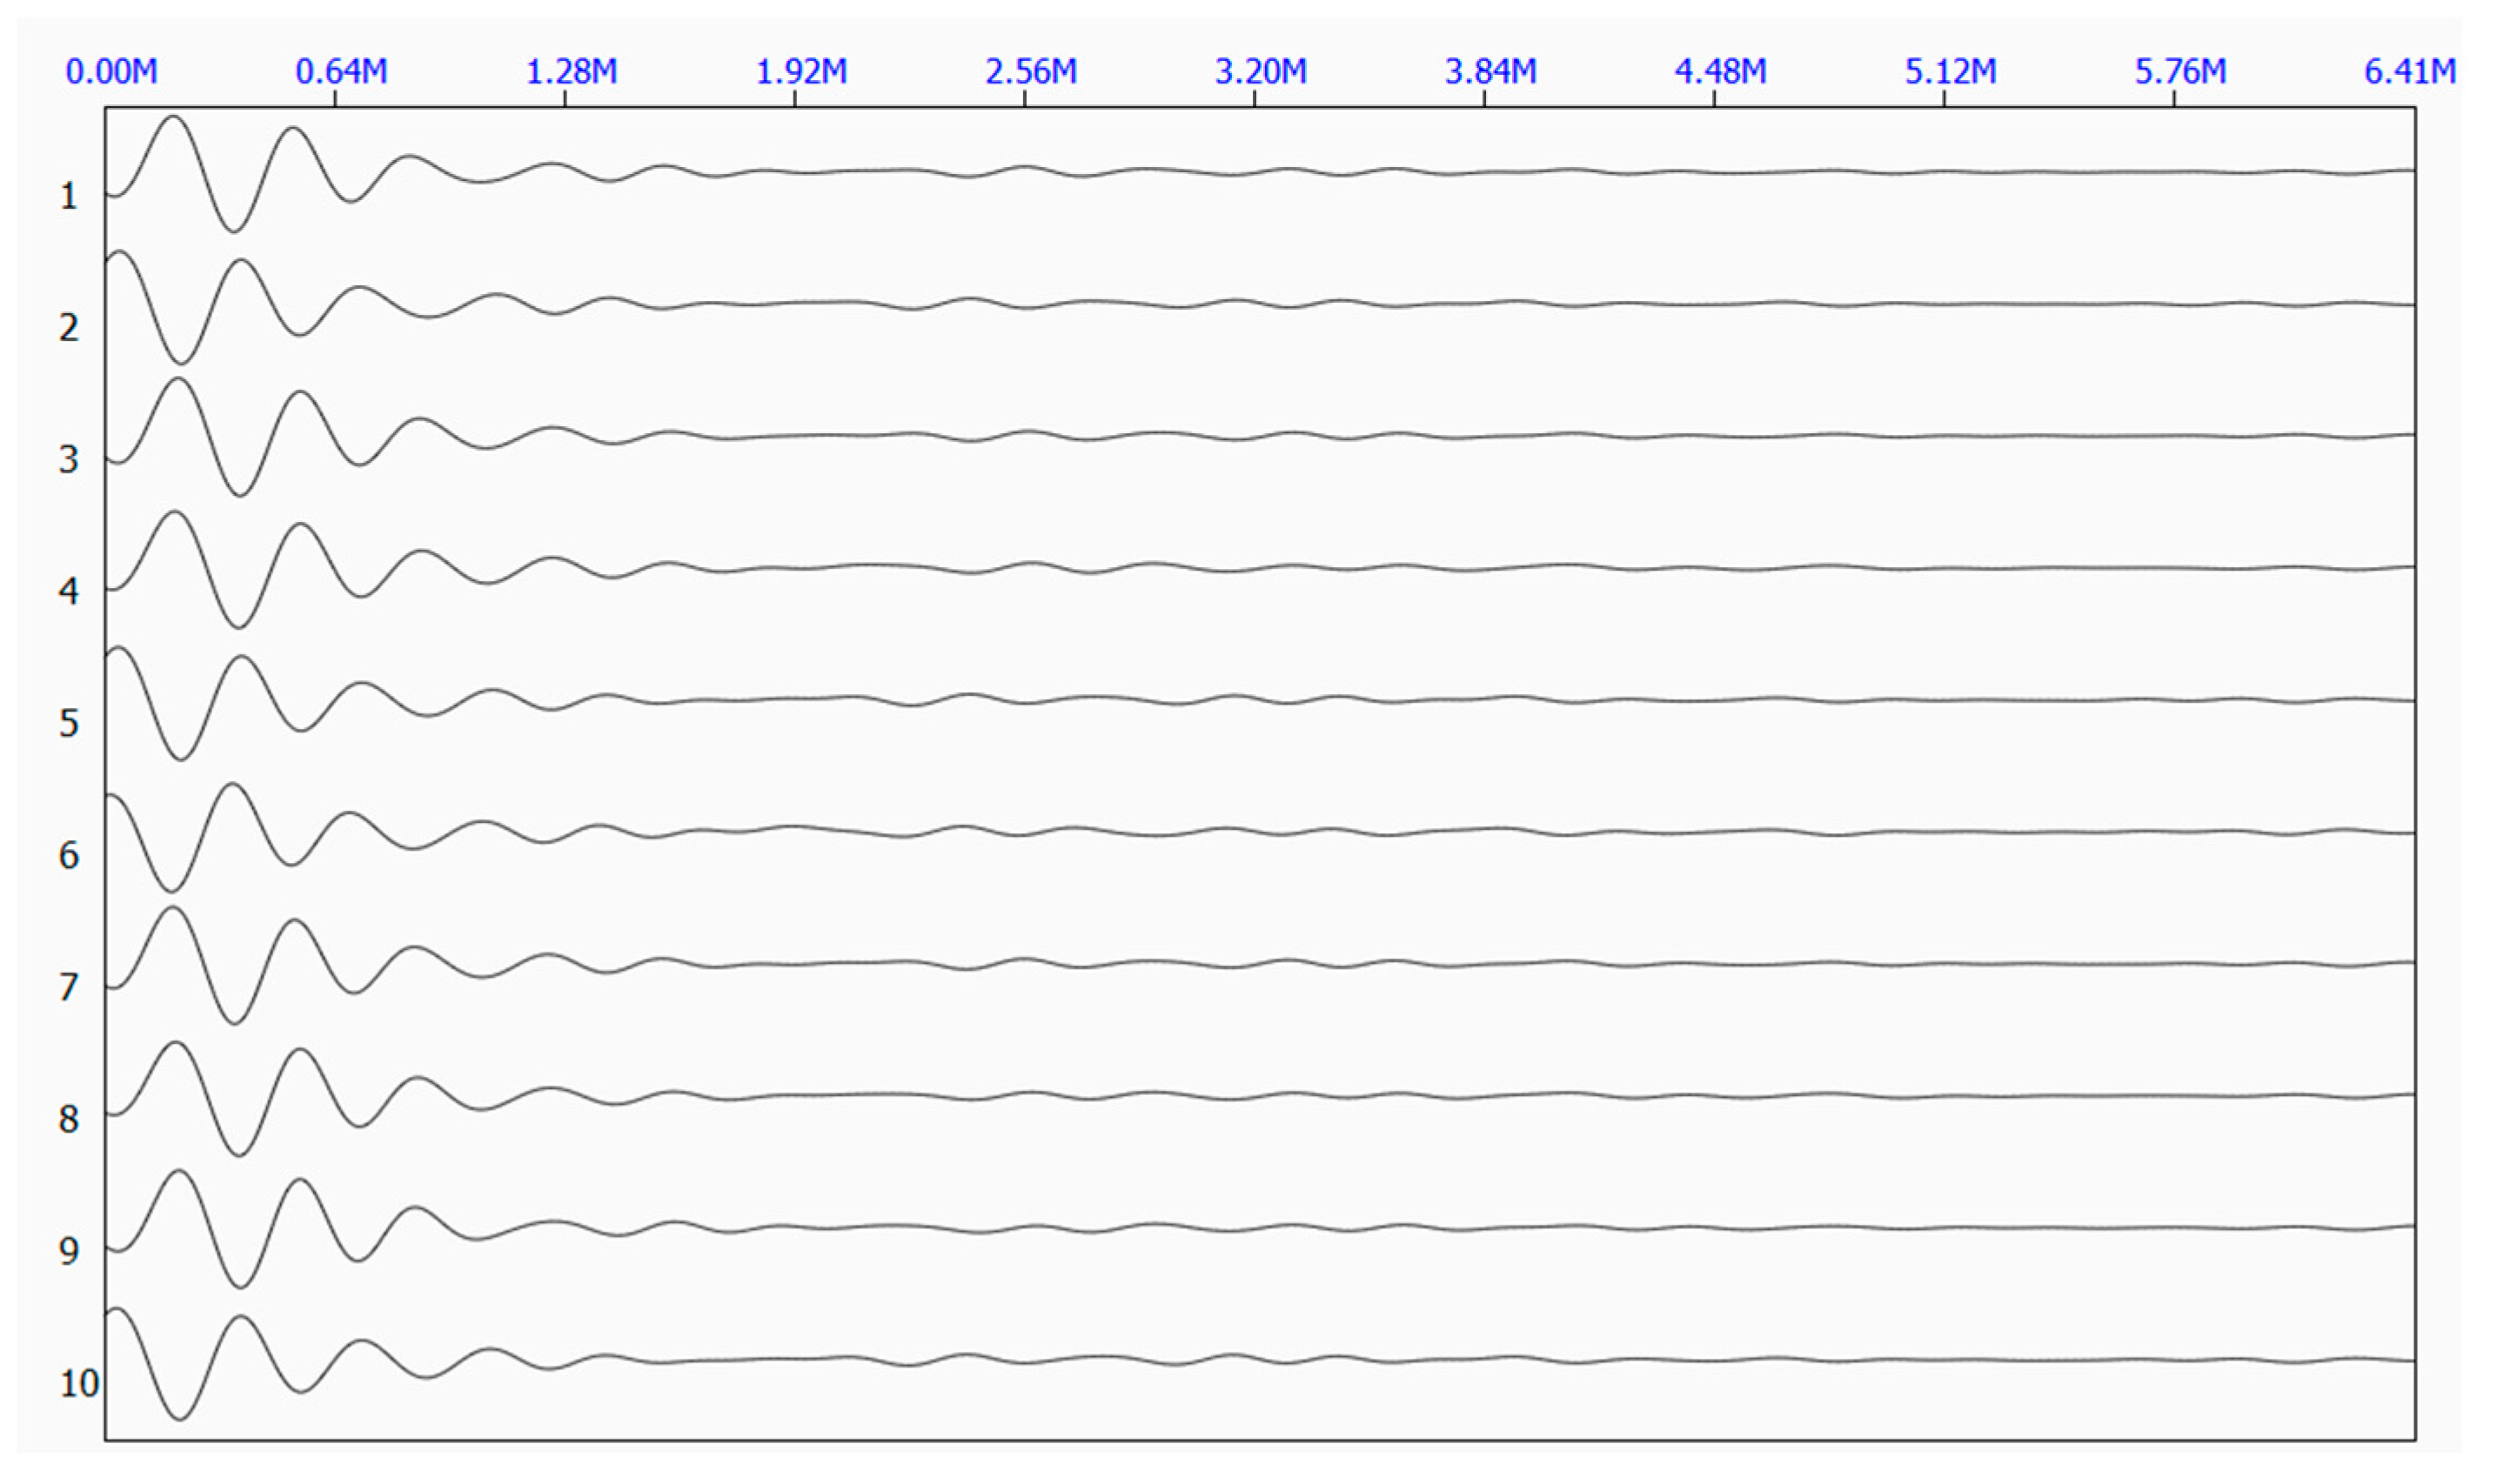
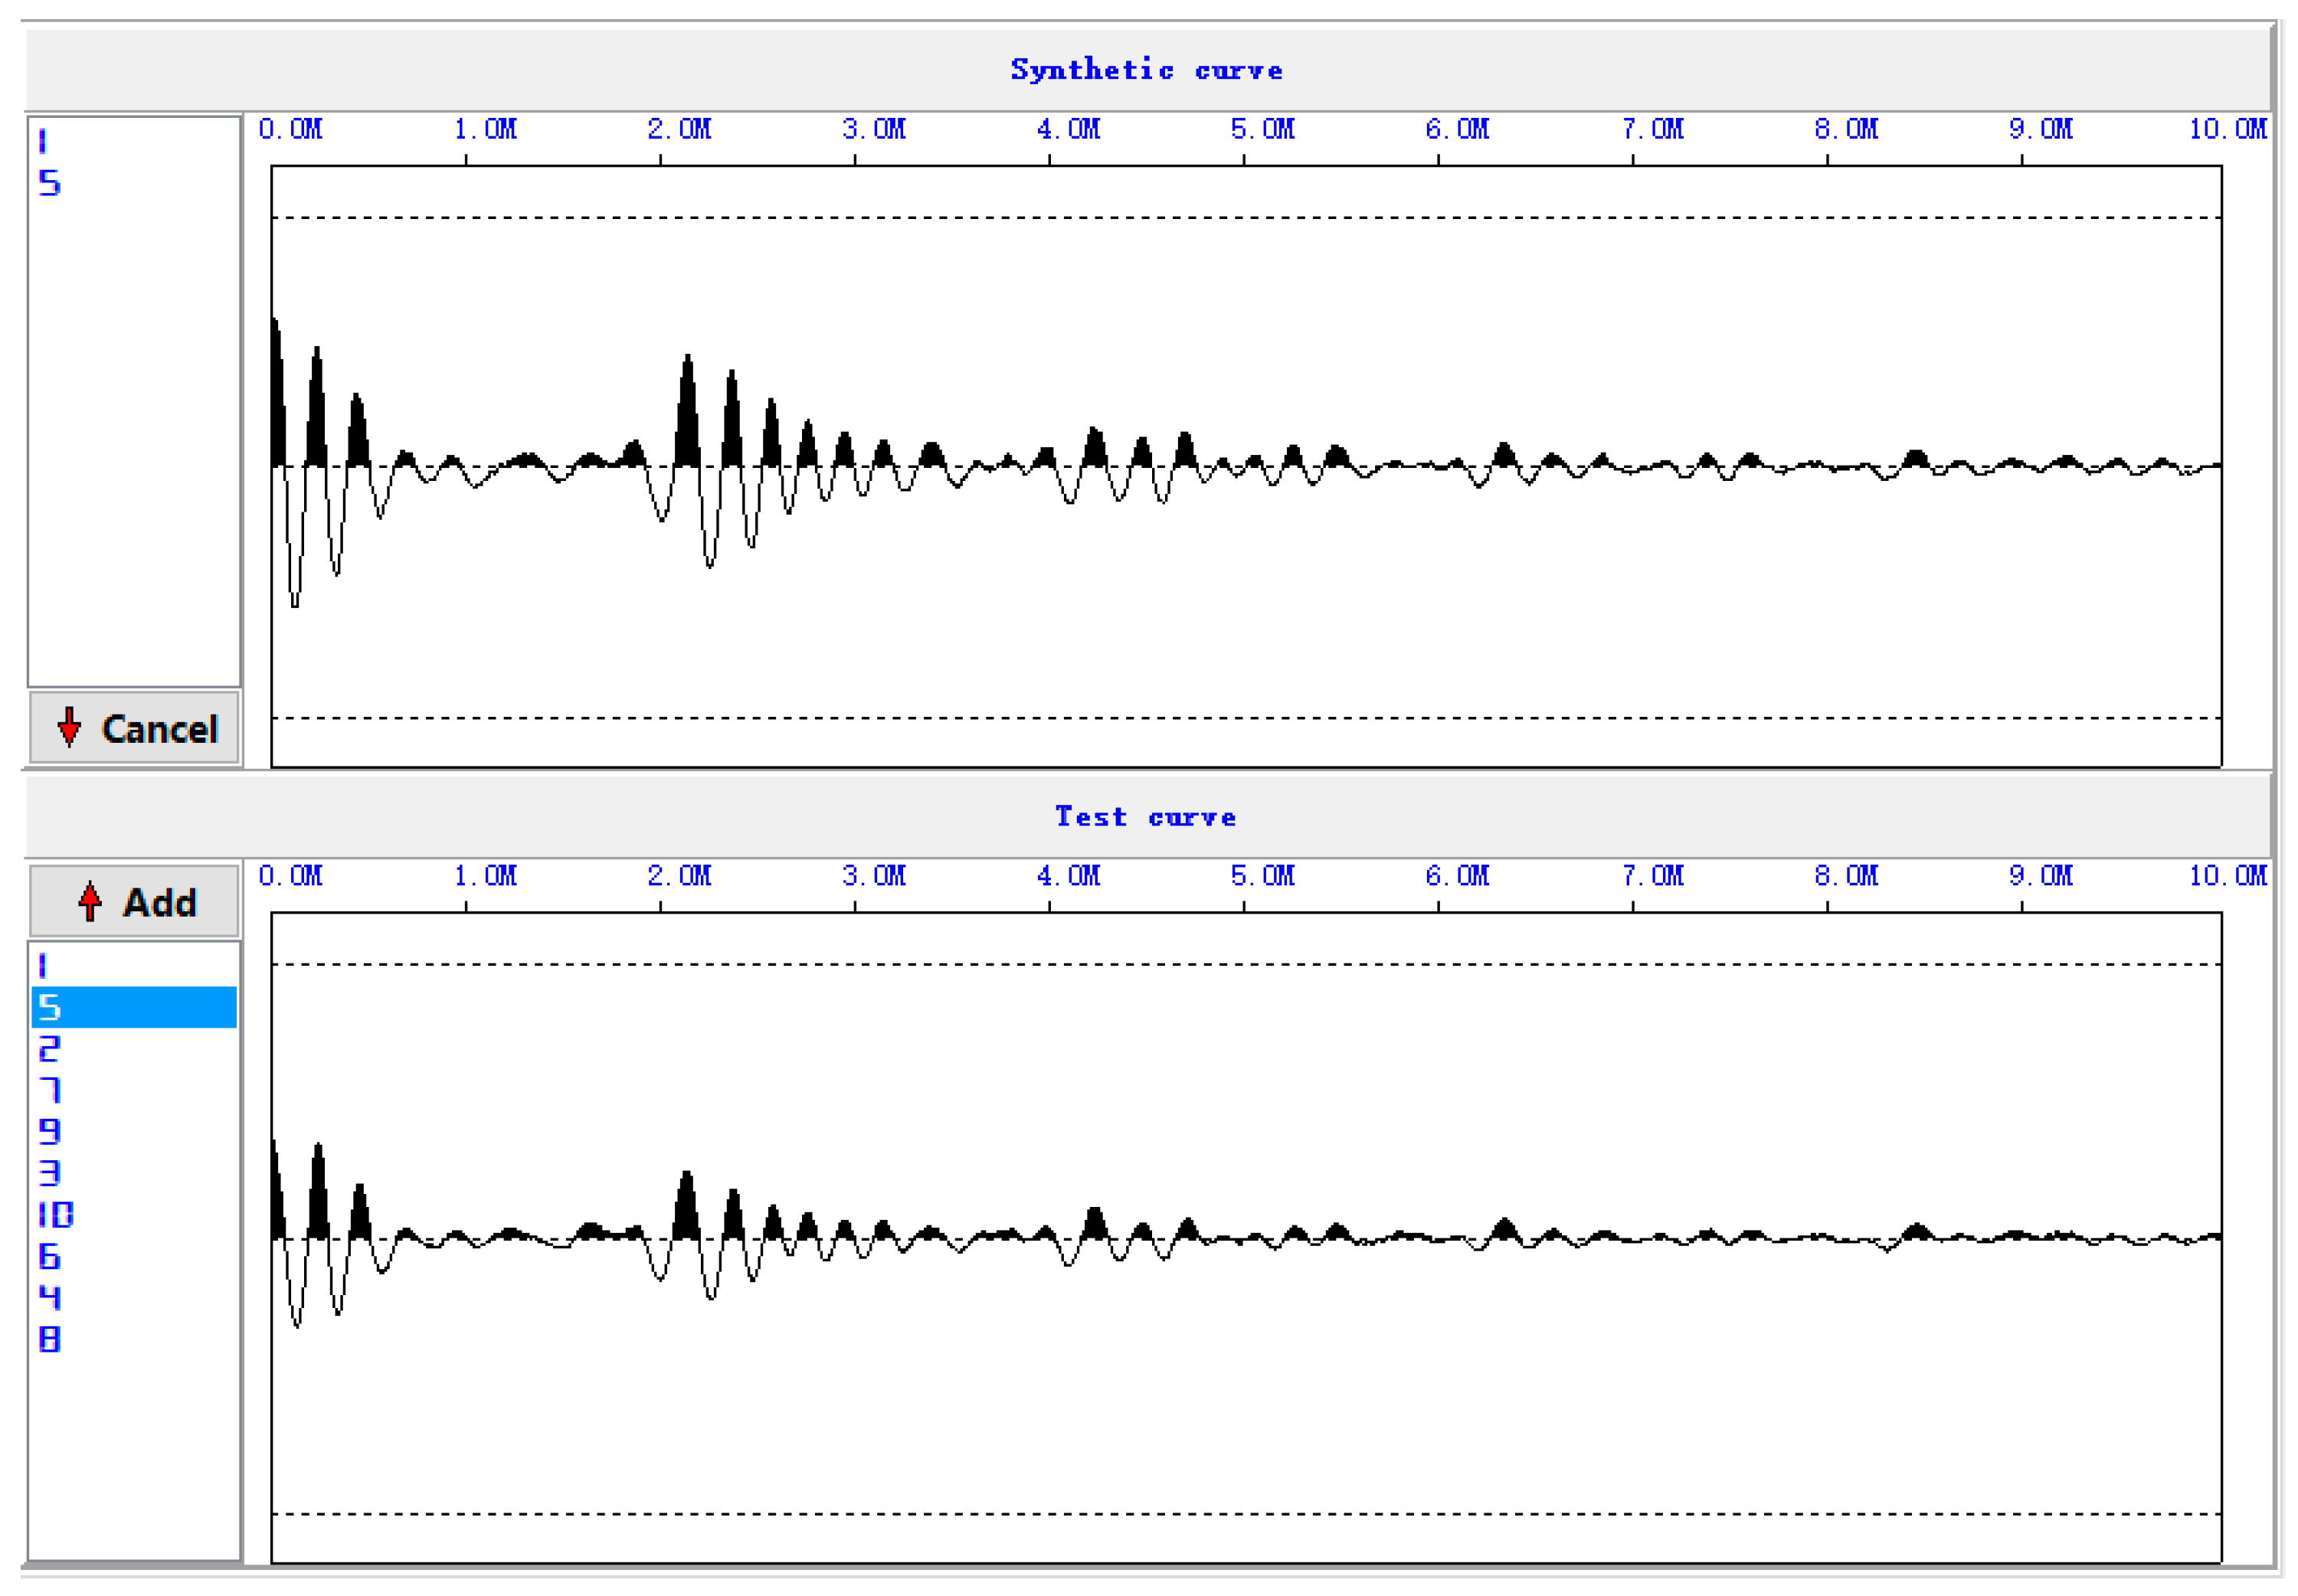
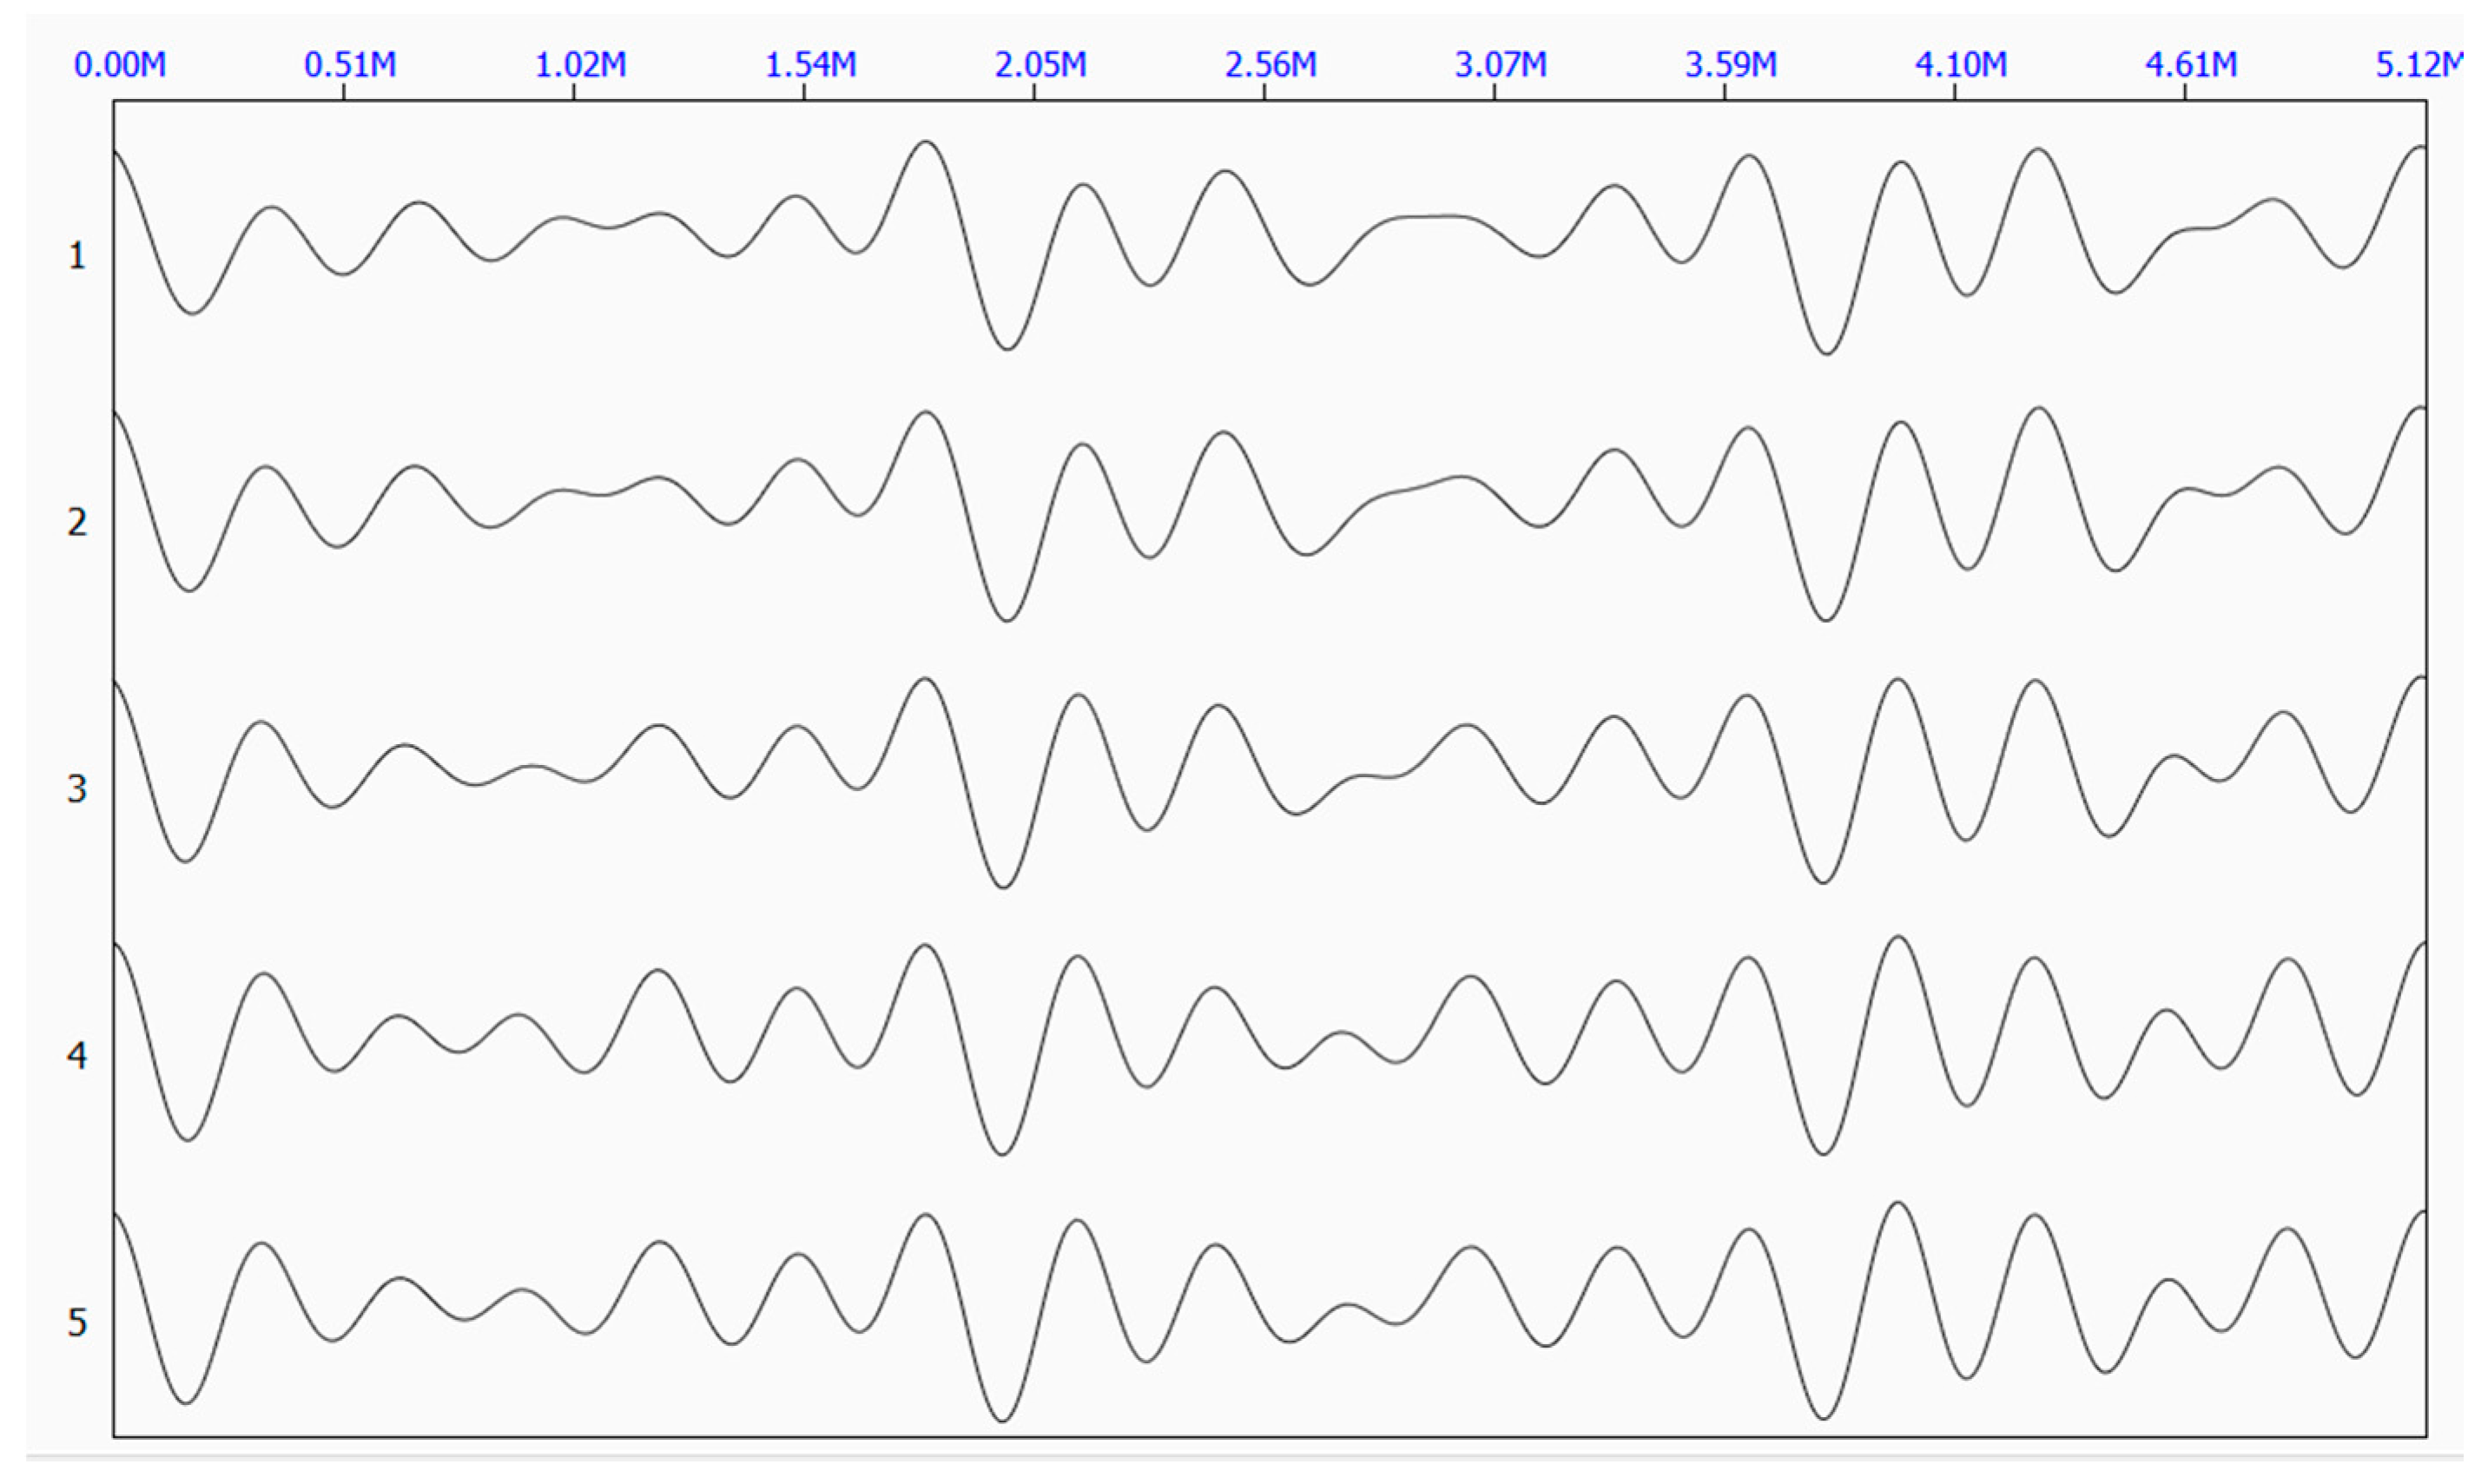
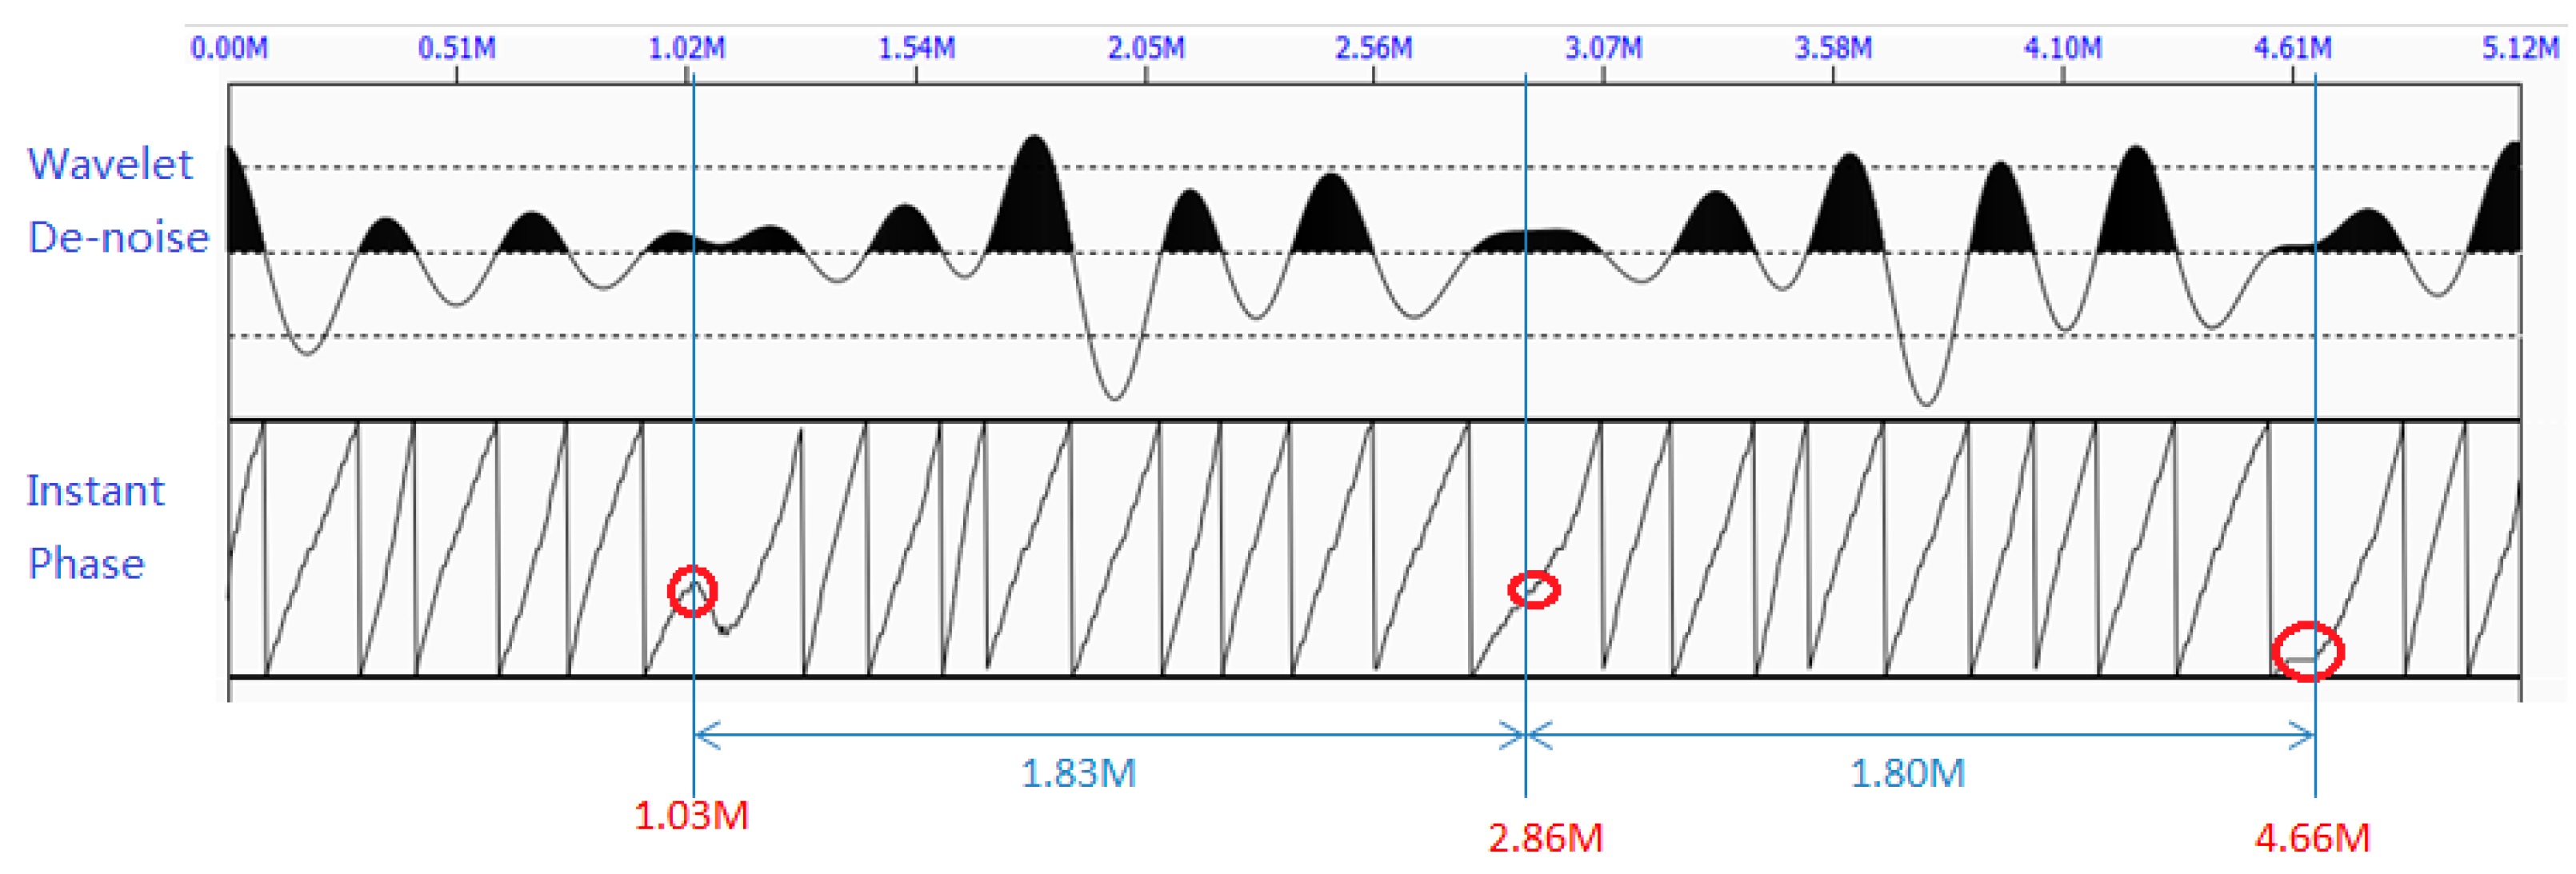
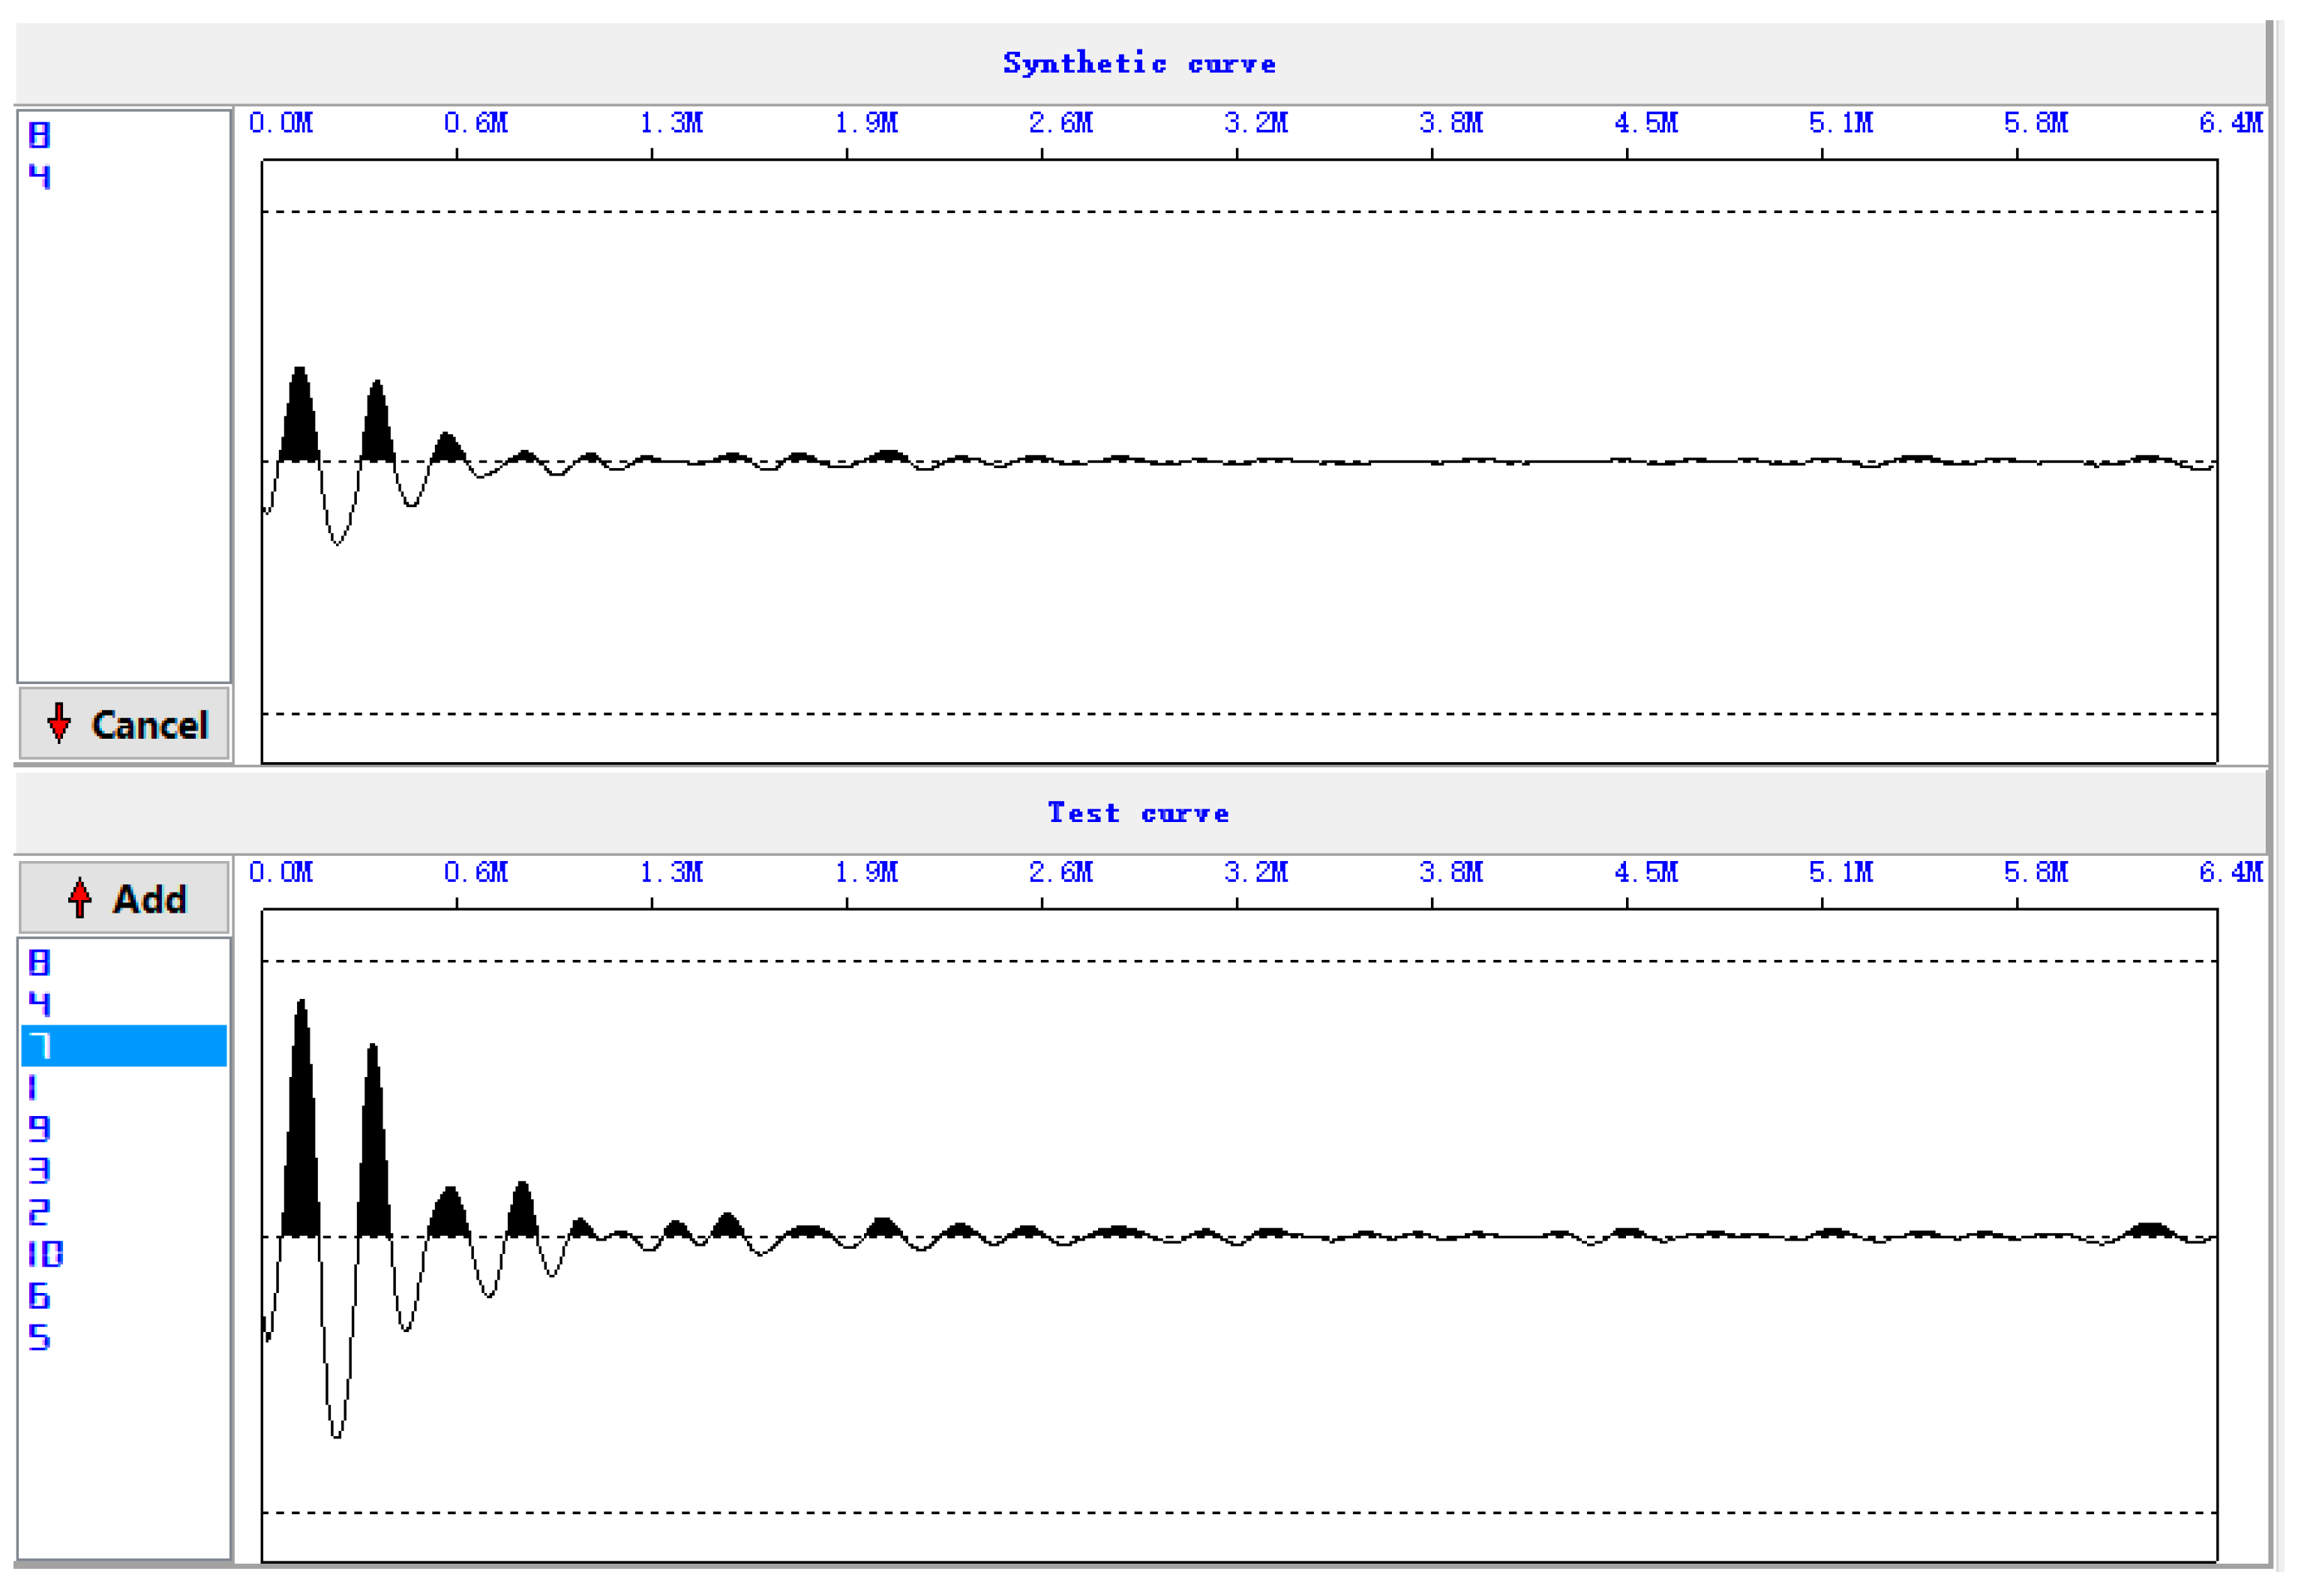
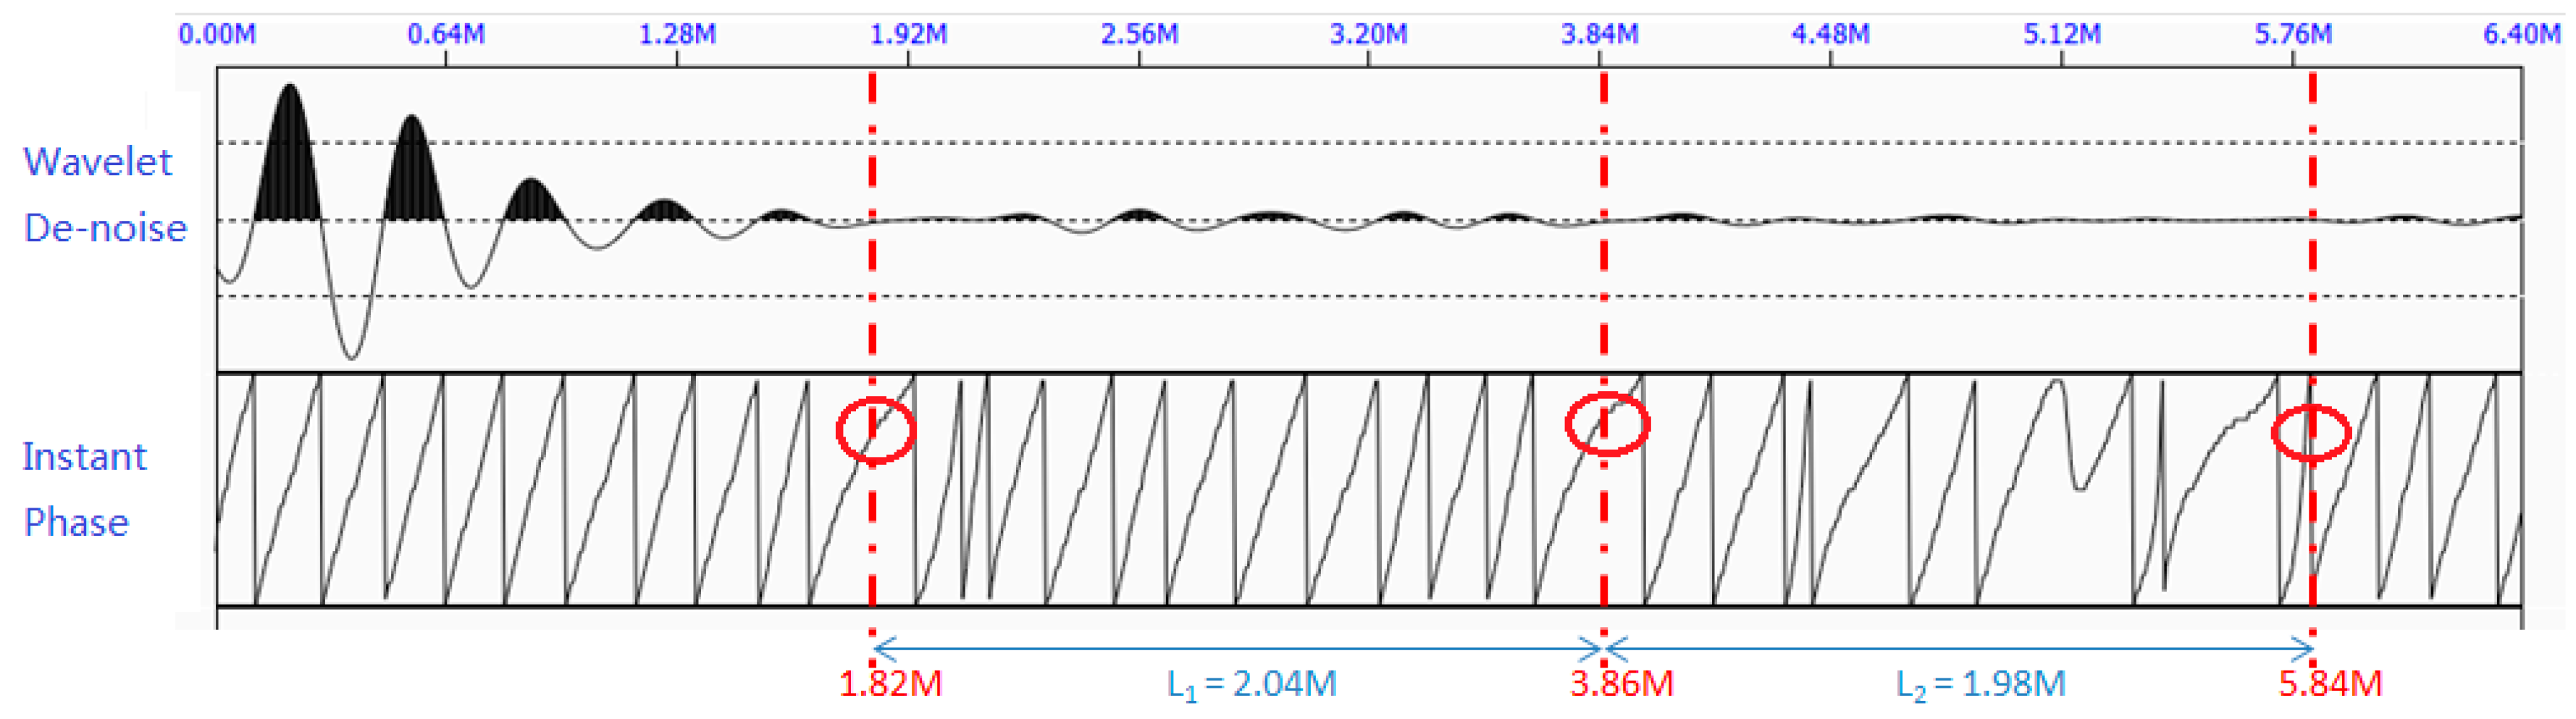
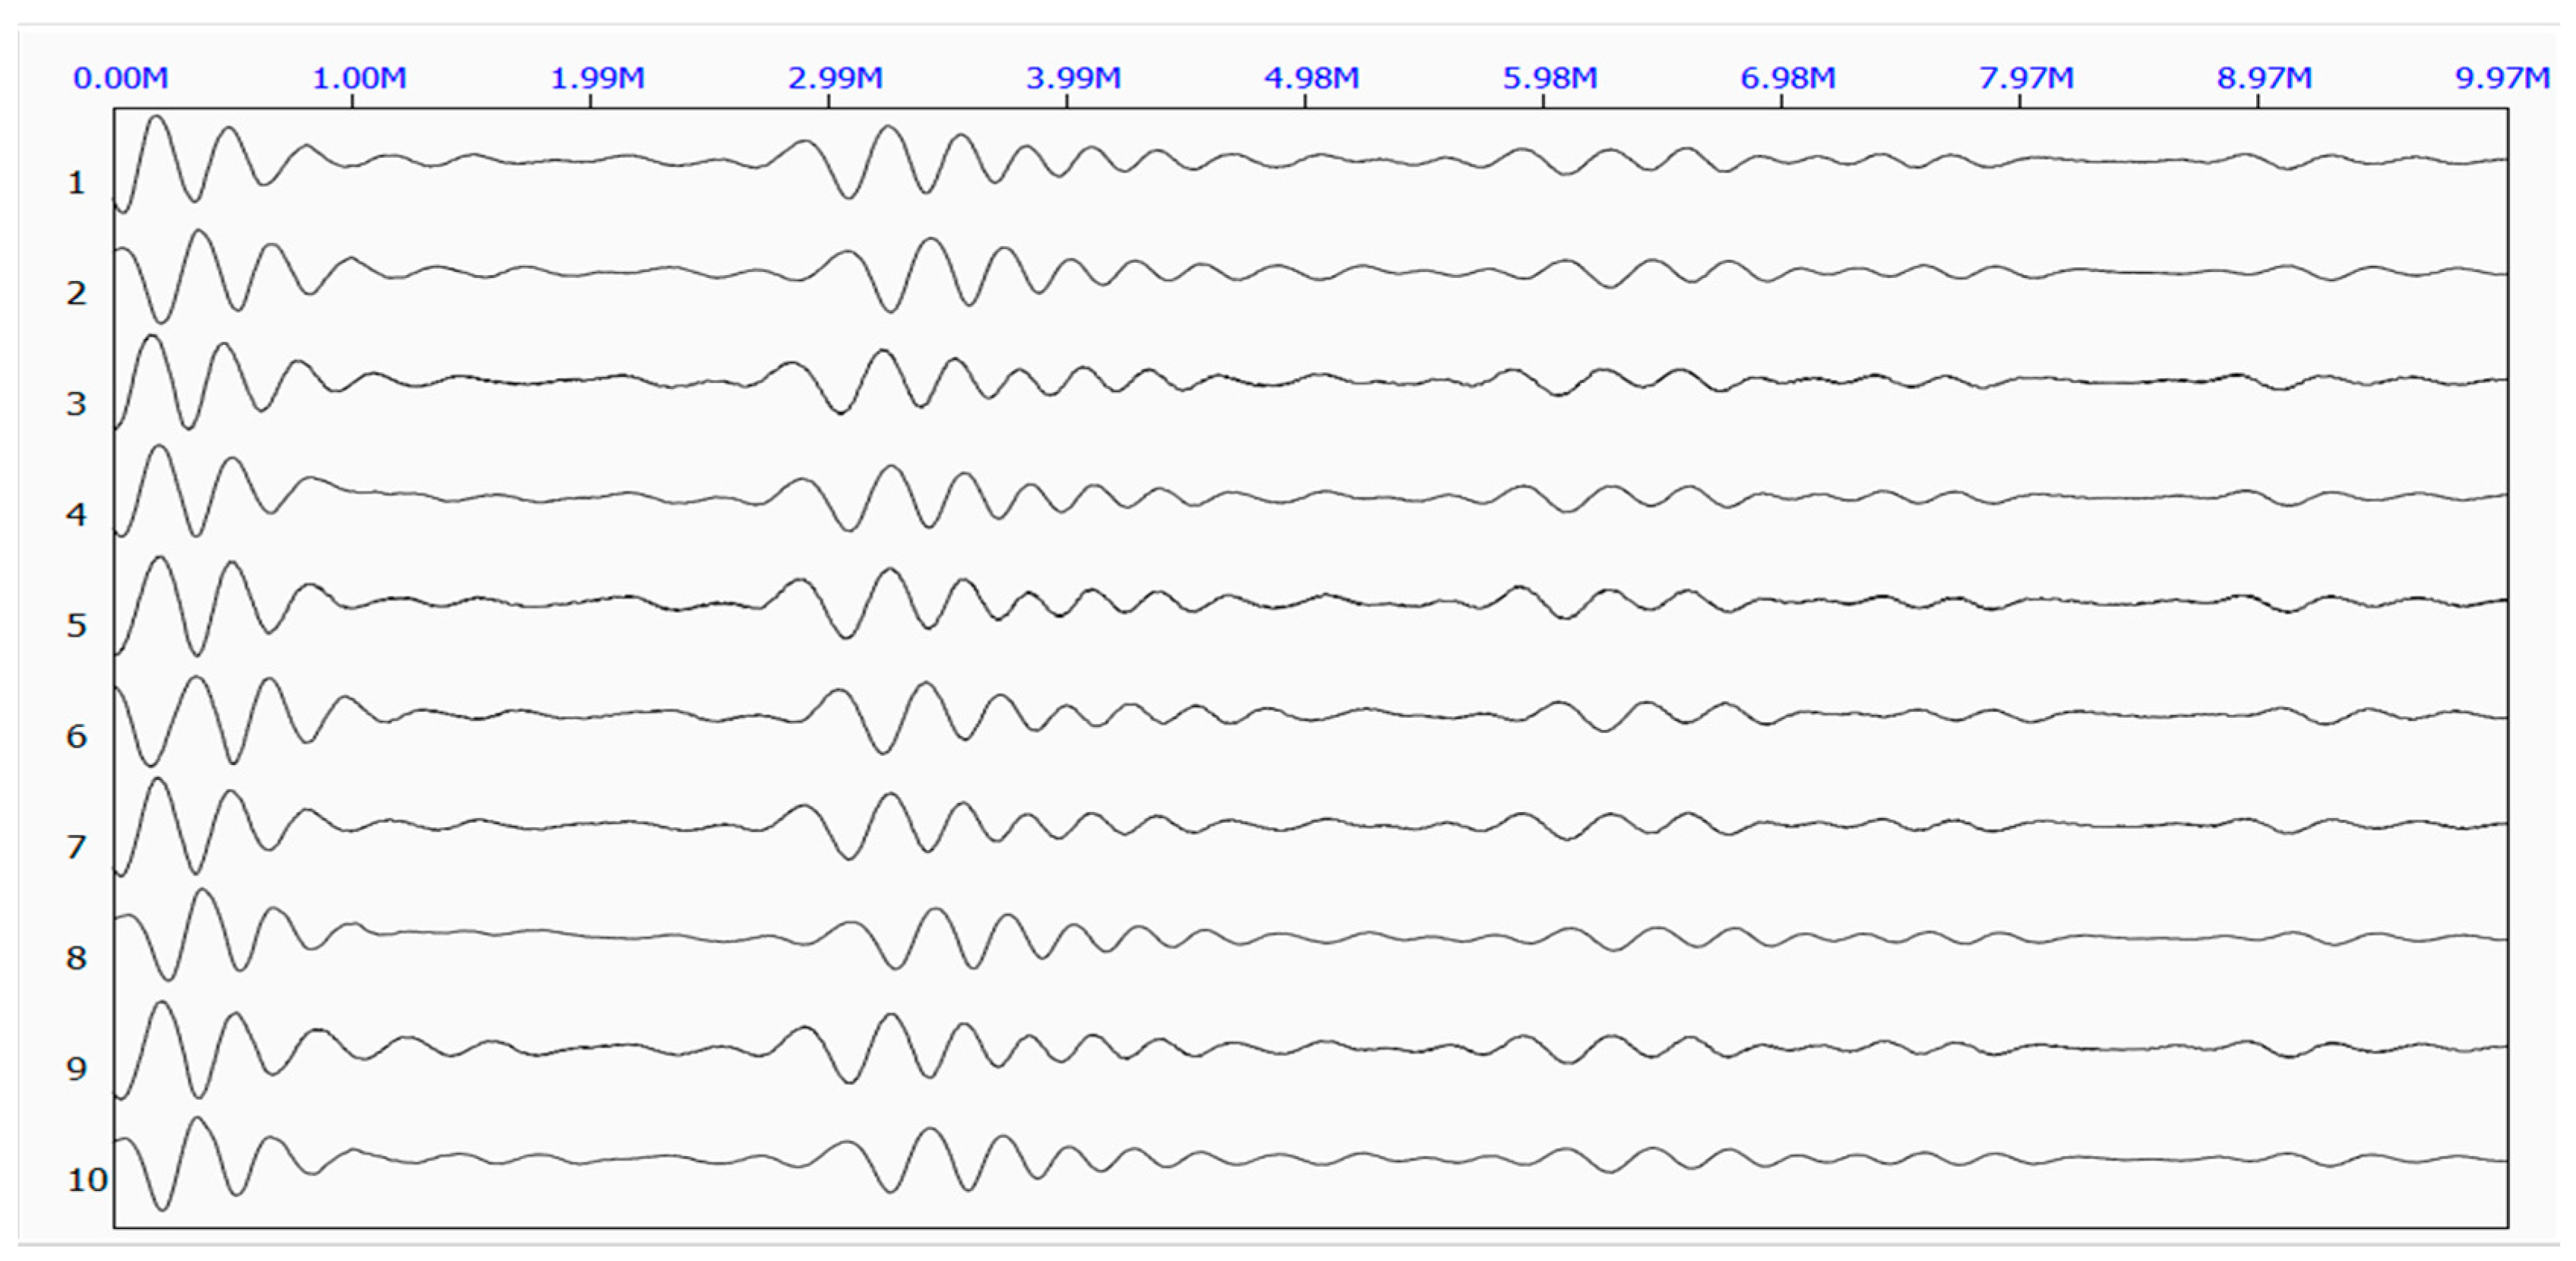
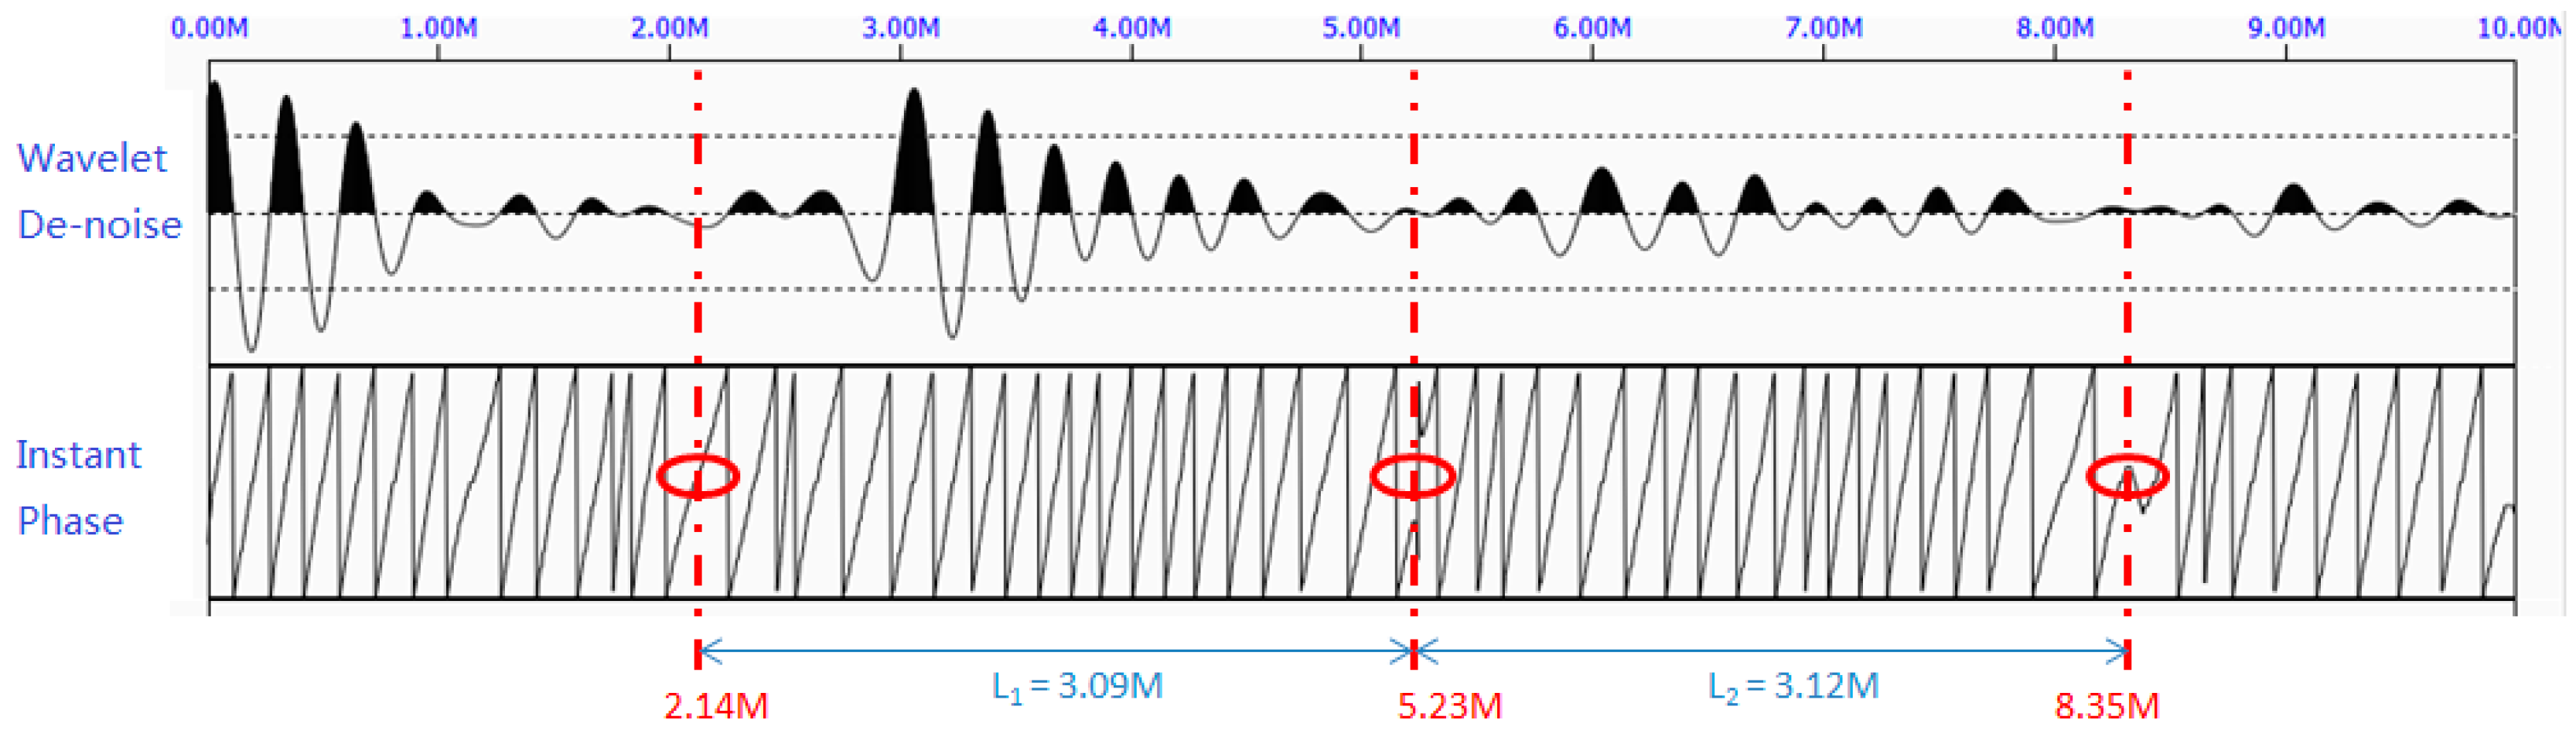
3.3. Data Analysis and Information Extraction
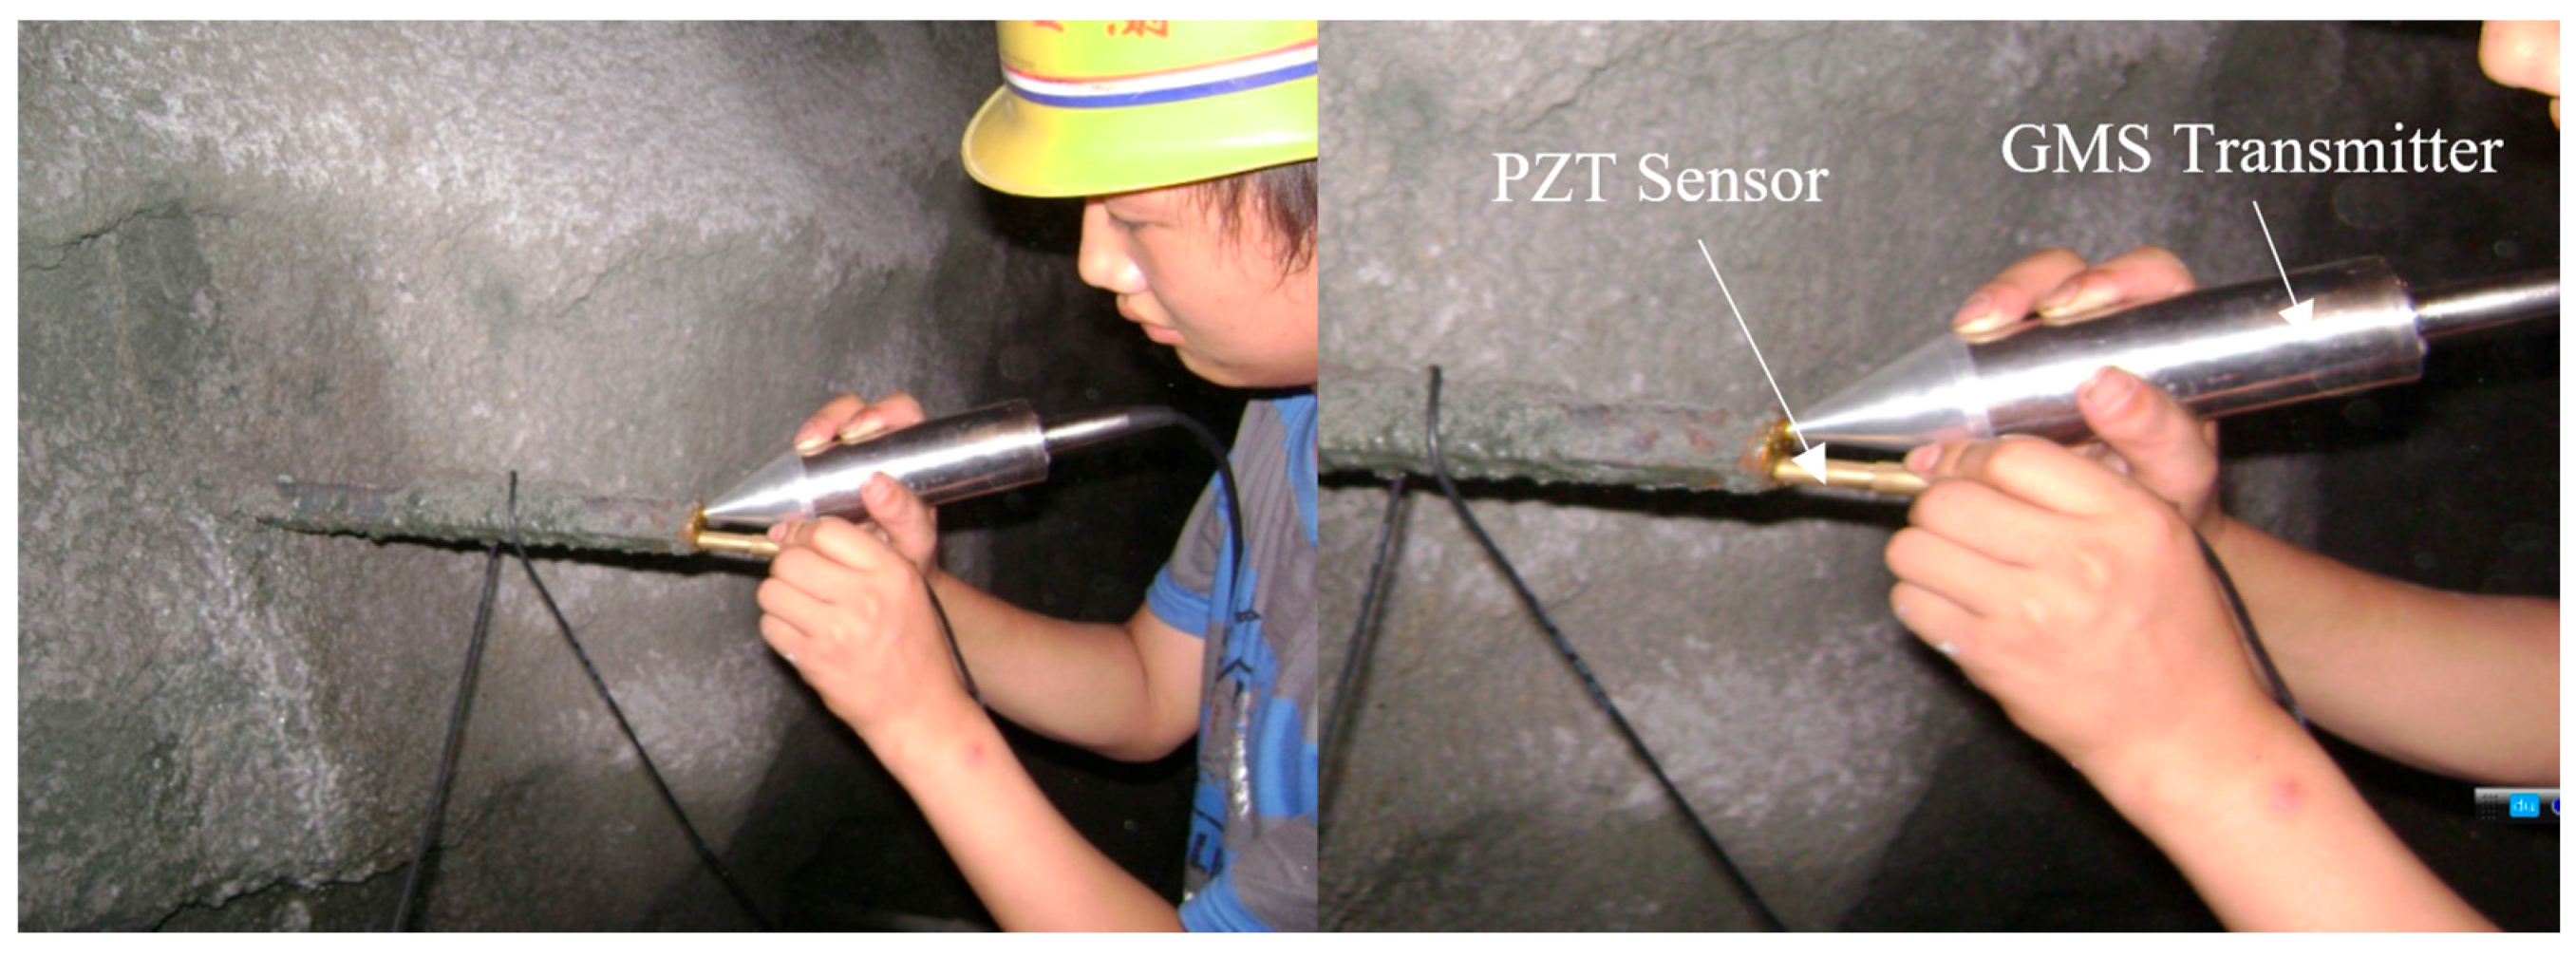
4. Field Tests
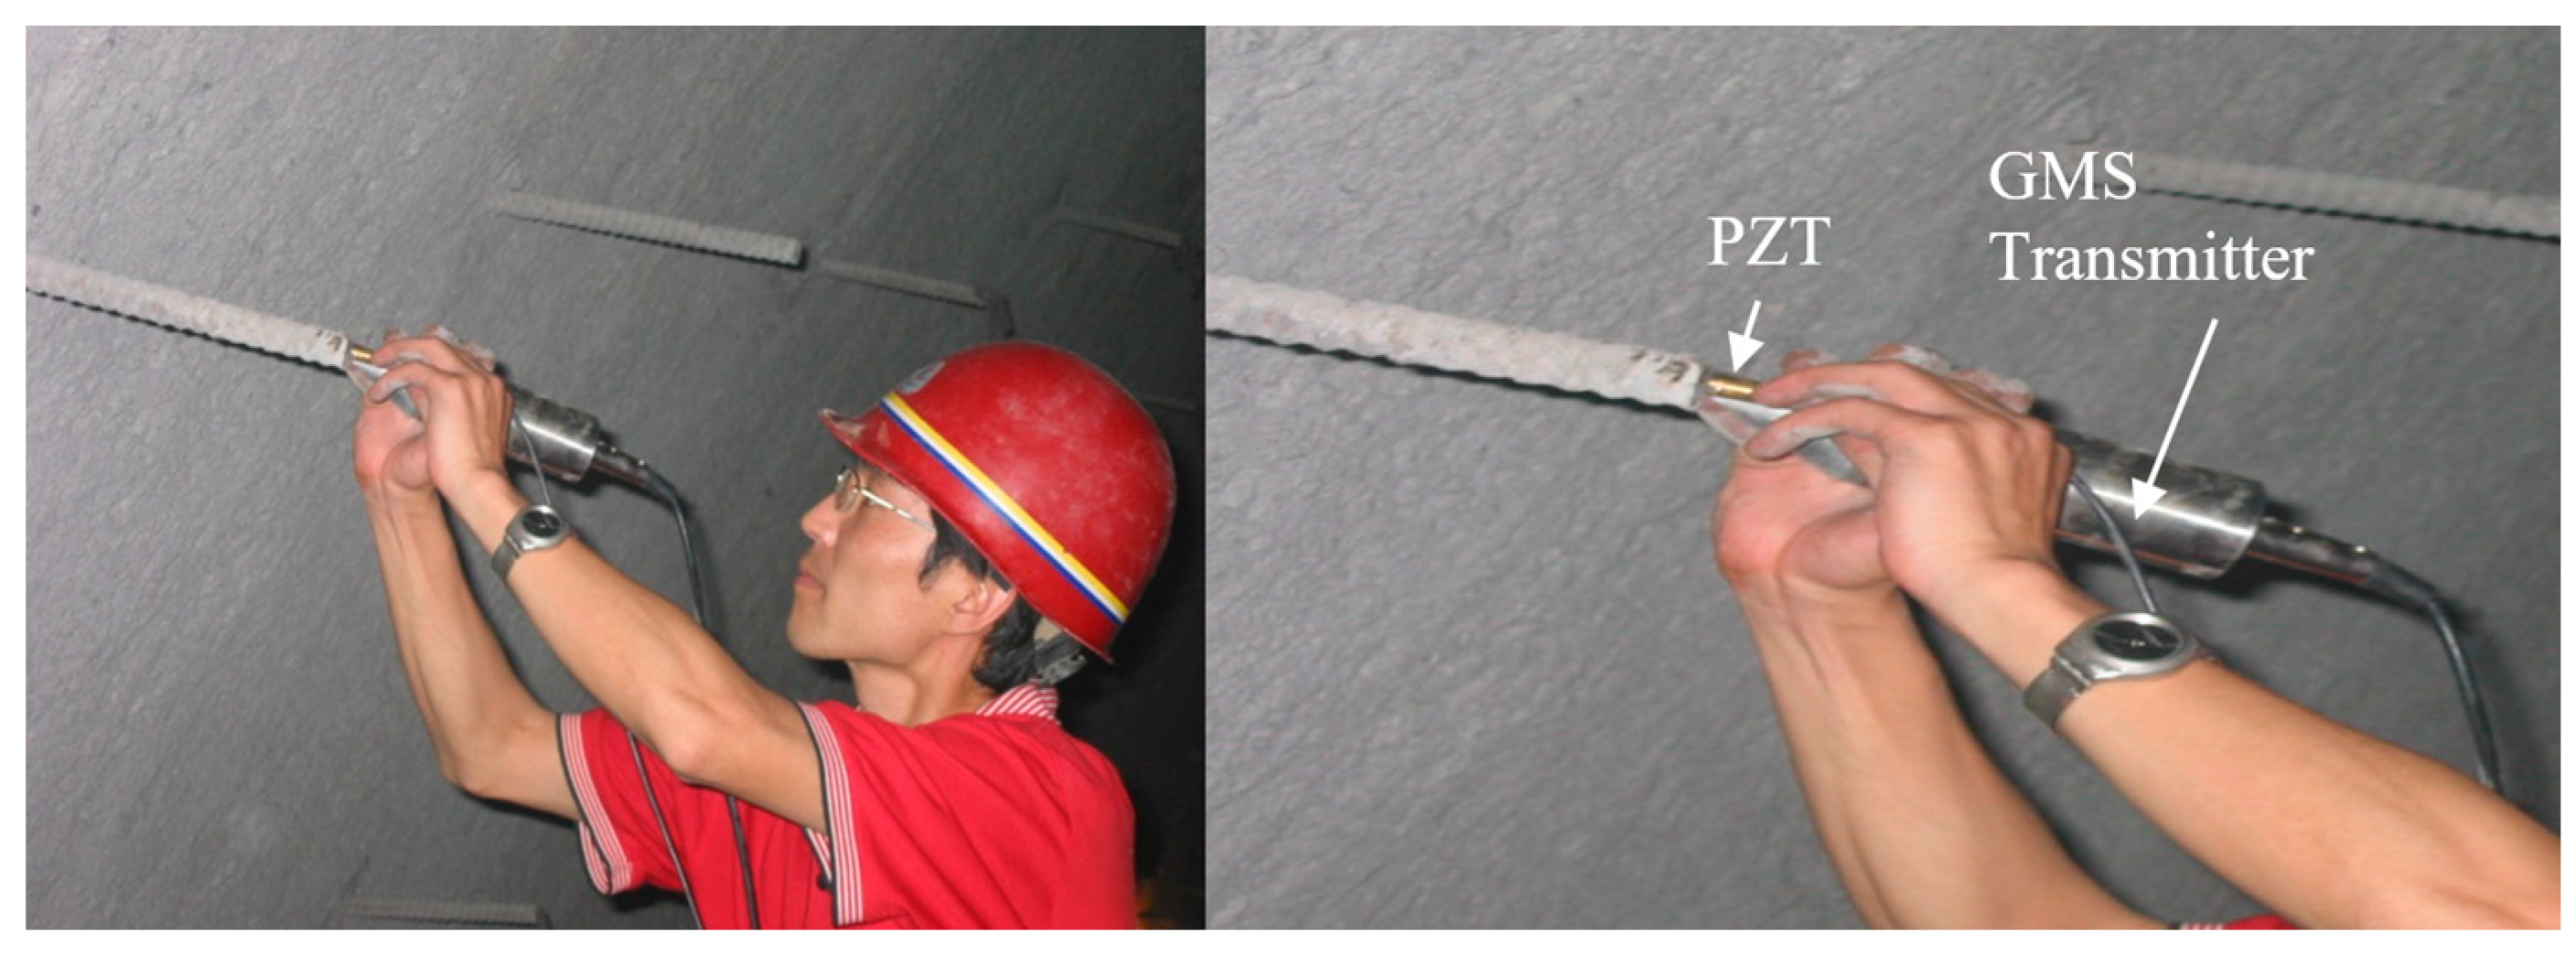
4.1. Site 1
4.2. Site 2
5. Conclusions
Acknowledgments
Author Contributions
Conflicts of Interest
References
- Beard, M.; Lowe, M. Non-destructive testing of rock bolts using guided ultrasonic waves. Int. J. Rock Mech. Min. Sci. 2003, 40, 527–536. [Google Scholar] [CrossRef]
- Madenga, V.; Zou, D.; Zhang, C. Effects of curing time and frequency on ultrasonic wave velocity in grouted rock bolts. J. Appl. Geophys. 2006, 59, 79–87. [Google Scholar] [CrossRef]
- Zou, D.; Cui, Y.; Madenga, V.; Zhang, C. Effects of frequency and grouted length on the behavior of guided ultrasonic waves in rock bolts. Int. J. Rock Mech. Min. Sci. 2007, 44, 813–819. [Google Scholar] [CrossRef]
- Lee, J.; Kim, H.; Lee, I.; Han, S.; Lee, Y. Rock Bolt Integrity Evaluation in Tunnelling Using Ultrasonic NDT Techniques. In Underground Space–The 4th Dimension of Metropolises, Three Volume Set+ CD-ROM: Proceedings of the World Tunnel Congress 2007 and 33rd ITA/AITES Annual General Assembly, Prague, May 2007; CRC Press: Boca Raton, FL, USA, 2007; p. 321. [Google Scholar]
- Han, S.-I.; Lee, I.-M.; Lee, Y.-J.; Lee, J.-S. Evaluation of rock bolt integrity using guided ultrasonic waves. Geotechn. Test. J. 2009, 32, 1. [Google Scholar]
- Zou, D.S.; Cheng, J.; Yue, R.; Sun, X. Grout quality and its impact on guided ultrasonic waves in grouted rock bolts. J. Appl. Geophys. 2010, 72, 102–106. [Google Scholar] [CrossRef]
- Zou, D.; Cui, Y. A new approach for field instrumentation in grouted rock bolt monitoring using guided ultrasonic waves. J. Appl. Geophys. 2011, 75, 506–512. [Google Scholar] [CrossRef]
- Cui, Y.; Zou, D. Assessing the effects of insufficient rebar and missing grout in grouted rock bolts using guided ultrasonic waves. J. Appl. Geophys. 2012, 79, 64–70. [Google Scholar] [CrossRef]
- Lee, I.-M.; Han, S.-I.; Kim, H.-J.; Yu, J.-D.; Min, B.-K.; Lee, J.-S. Evaluation of rock bolt integrity using fourier and wavelet transforms. Tunn. Undergr. Space Technol. 2012, 28, 304–314. [Google Scholar] [CrossRef]
- Yu, J.-D.; Bae, M.-H.; Lee, I.-M.; Lee, J.-S. Nongrouted ratio evaluation of rock bolts by reflection of guided ultrasonic waves. J. Geotechn. Geoenviron. Eng. 2012, 139, 298–307. [Google Scholar] [CrossRef]
- Wang, C.; He, W.; Ning, J.; Zhang, C. Propagation properties of guided wave in the anchorage structure of rock bolts. J. Appl. Geophys. 2009, 69, 131–139. [Google Scholar] [CrossRef]
- Bao, X.K.; Li, Y. Application of Stress Wave Reflection Method in Nondestructive Testing of Bolt; Advanced Materials Research; Trans Tech Publication: Stafa-Zurich, Switzerland, 2012; pp. 2229–2233. [Google Scholar]
- Sun, B.; Zheng, X.T.; Zeng, S. Signal Feature Analysis of Excited Stress Waves in Bolts Embed in Different Anchor Medium; Advanced Materials Research; Trans Tech Publ: Stafa-Zurich, Switzerland, 2013; pp. 393–396. [Google Scholar]
- Sun, X.-Y.; Wang, Z.-Y.; Kang, F.-N.; Li, W.-F. Method of Rock Bolts Parameters Detection Based on Harmonic Wavelet Packet Transform. In Proceedings of the 2015 International Conference on Machine Learning and Cybernetics (ICMLC), Guangzhou, China, 12–15 July 2015; pp. 678–683.
- Starkey, A.; Ivanovic, A.; Neilson, R.D.; Rodger, A.A. Using a lumped parameter dynamic model of a rock bolt to produce training data for a neural network for diagnosis of real data. Meccanica 2003, 38, 133–144. [Google Scholar] [CrossRef]
- Olabi, A.-G.; Grunwald, A. Design and application of magnetostrictive materials. Mater. Des. 2008, 29, 469–483. [Google Scholar] [CrossRef] [Green Version]
- Kwun, H.; Kim, S.Y.; Light, G.M. Magnetostrictive sensor technology for long-range guided wave inspection and monitoring of pipe. NDT Techn. 2011, 10, 6–9. [Google Scholar]
- Tse, P.; Liu, X.; Liu, Z.; Wu, B.; He, C.; Wang, X. An innovative design for using flexible printed coils for magnetostrictive-based longitudinal guided wave sensors in steel strand inspection. Smart Mater. Struct. 2011, 20, 055001. [Google Scholar] [CrossRef]
- Liu, Z.; Zhao, J.; Wu, B.; Zhang, Y.; He, C. Configuration optimization of magnetostrictive transducers for longitudinal guided wave inspection in seven-wire steel strands. NDT E Int. 2010, 43, 484–492. [Google Scholar] [CrossRef]
- Choi, S.; Cho, H.; Lissenden, C.J. Selection of shear horizontal wave transducers for robotic nondestructive inspection in harsh environments. Sensors 2016, 17, 5. [Google Scholar] [CrossRef] [PubMed]
- Xu, J.; Sun, Y.; Zhou, J. Research on the lift-off effect of receiving longitudinal mode guided waves in pipes based on the villari effect. Sensors 2016, 16, 1529. [Google Scholar] [CrossRef] [PubMed]
- Xu, J.; Wu, X.; Kong, D.; Sun, P. A guided wave sensor based on the inverse magnetostrictive effect for distinguishing symmetric from asymmetric features in pipes. Sensors 2015, 15, 5151–5162. [Google Scholar] [CrossRef] [PubMed]
- Xu, J.; Wu, X.; Cheng, C.; Ben, A. A magnetic flux leakage and magnetostrictive guided wave hybrid transducer for detecting bridge cables. Sensors 2012, 12, 518–533. [Google Scholar] [CrossRef] [PubMed]
- Kim, H.J.; Lee, J.S.; Kim, H.W.; Lee, H.S.; Kim, Y.Y. Numerical simulation of guided waves using equivalent source model of magnetostrictive patch transducers. Smart Mater. Struct. 2014, 24, 015006. [Google Scholar]
- Sheykholeslami, M.R.; Hojjat, Y.; Cinquemani, S.; Ghodsi, M.; Karafi, M. An approach to design and fabrication of resonant giant magnetostrictive transducer. Smart Struct. Syst. 2016, 17, 313–325. [Google Scholar] [CrossRef]
- Dai, X.; Wen, Y.; Li, P.; Yang, J.; Li, M. Energy harvesting from mechanical vibrations using multiple magnetostrictive/piezoelectric composite transducers. Sens. Actuators A Phys. 2011, 166, 94–101. [Google Scholar] [CrossRef]
- Liangjun, Z.; Jingtao, W.; Guocheng, L. Application of wavelet transform in integrity testing of piles. Chin. J. Rock Mech. Eng. 2002, 11, 033. [Google Scholar]
- Luo, M.; Wang, J.; Xu, F.; Zhang, H. Real-time analysis system of audio-frequency stress wave. J. Vib. Meas. Diagn. 2012, 32, 292–295. [Google Scholar]
- Mallat, S. A Wavelet Tour of Signal Processing; Academic Press: Cambridge, MA, USA, 1999. [Google Scholar]
- Selesnick, I.W. Hilbert transform pairs of wavelet bases. IEEE Signal Process. Lett. 2001, 8, 170–173. [Google Scholar] [CrossRef]


| Rock Bolt Number | Measured Length (m) | Actual Length (m) | Error (%) | Average Error (%) |
|---|---|---|---|---|
| 1 | 2.01 | 2.00 | 0.5 | 0.8 |
| 2 | 3.05 | 3.10 | 1.6 | |
| 3 | 3.16 | 3.15 | 0.3 | |
| 4 | 2.82 | 2.80 | 0.7 | |
| 5 | 2.92 | 2.95 | 1.0 |
| Rock Bolt Number | Measured Length (m) | Actual Length (m) | Error (%) | Average Error (%) |
|---|---|---|---|---|
| 1 | 2.02 | 2.00 | 1.0 | 1.0 |
| 2 | 1.81 | 1.80 | 0.6 | |
| 3 | 2.77 | 2.80 | 1.0 | |
| 4 | 3.76 | 3.80 | 0.7 | |
| 5 | 3.15 | 3.10 | 1.6 |
© 2017 by the authors. Licensee MDPI, Basel, Switzerland. This article is an open access article distributed under the terms and conditions of the Creative Commons Attribution (CC BY) license ( http://creativecommons.org/licenses/by/4.0/).
Share and Cite
Luo, M.; Li, W.; Wang, B.; Fu, Q.; Song, G. Measurement of the Length of Installed Rock Bolt Based on Stress Wave Reflection by Using a Giant Magnetostrictive (GMS) Actuator and a PZT Sensor. Sensors 2017, 17, 444. https://doi.org/10.3390/s17030444
Luo M, Li W, Wang B, Fu Q, Song G. Measurement of the Length of Installed Rock Bolt Based on Stress Wave Reflection by Using a Giant Magnetostrictive (GMS) Actuator and a PZT Sensor. Sensors. 2017; 17(3):444. https://doi.org/10.3390/s17030444
Chicago/Turabian StyleLuo, Mingzhang, Weijie Li, Bo Wang, Qingqing Fu, and Gangbing Song. 2017. "Measurement of the Length of Installed Rock Bolt Based on Stress Wave Reflection by Using a Giant Magnetostrictive (GMS) Actuator and a PZT Sensor" Sensors 17, no. 3: 444. https://doi.org/10.3390/s17030444