
Use of Wearable Sensors and Biometric Variables in an Artificial Pancreas System

 ,
,
Abstract
:1. Introduction
2. Materials and Methods
2.1. Partial Least Squares (PLS)
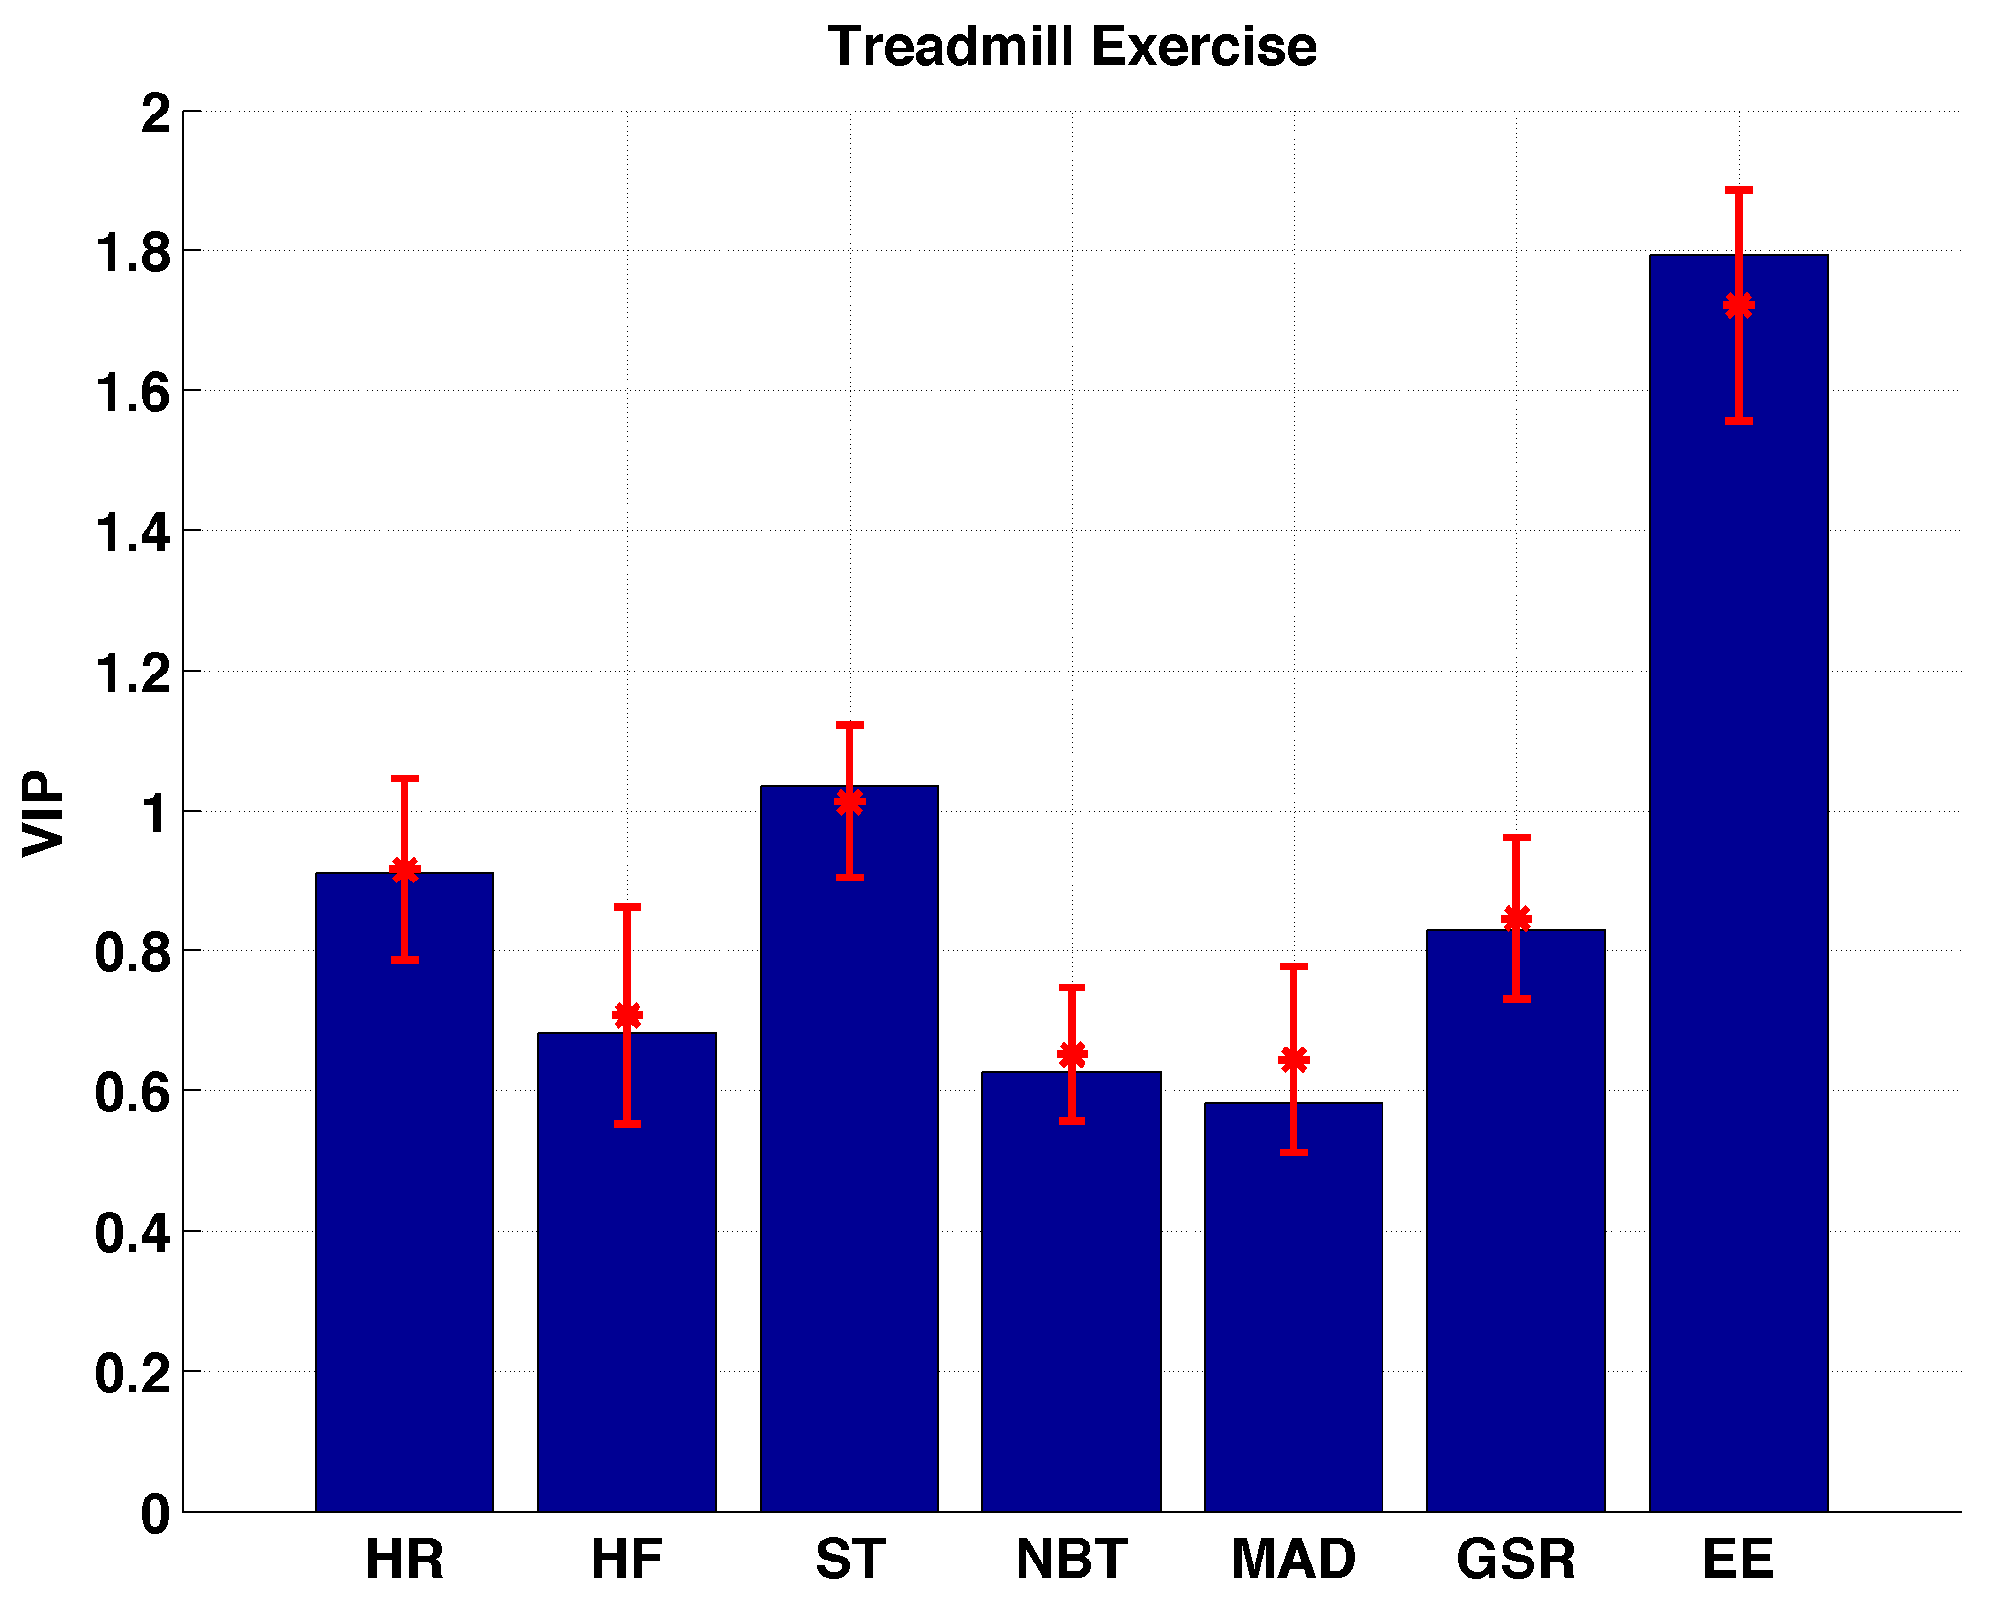
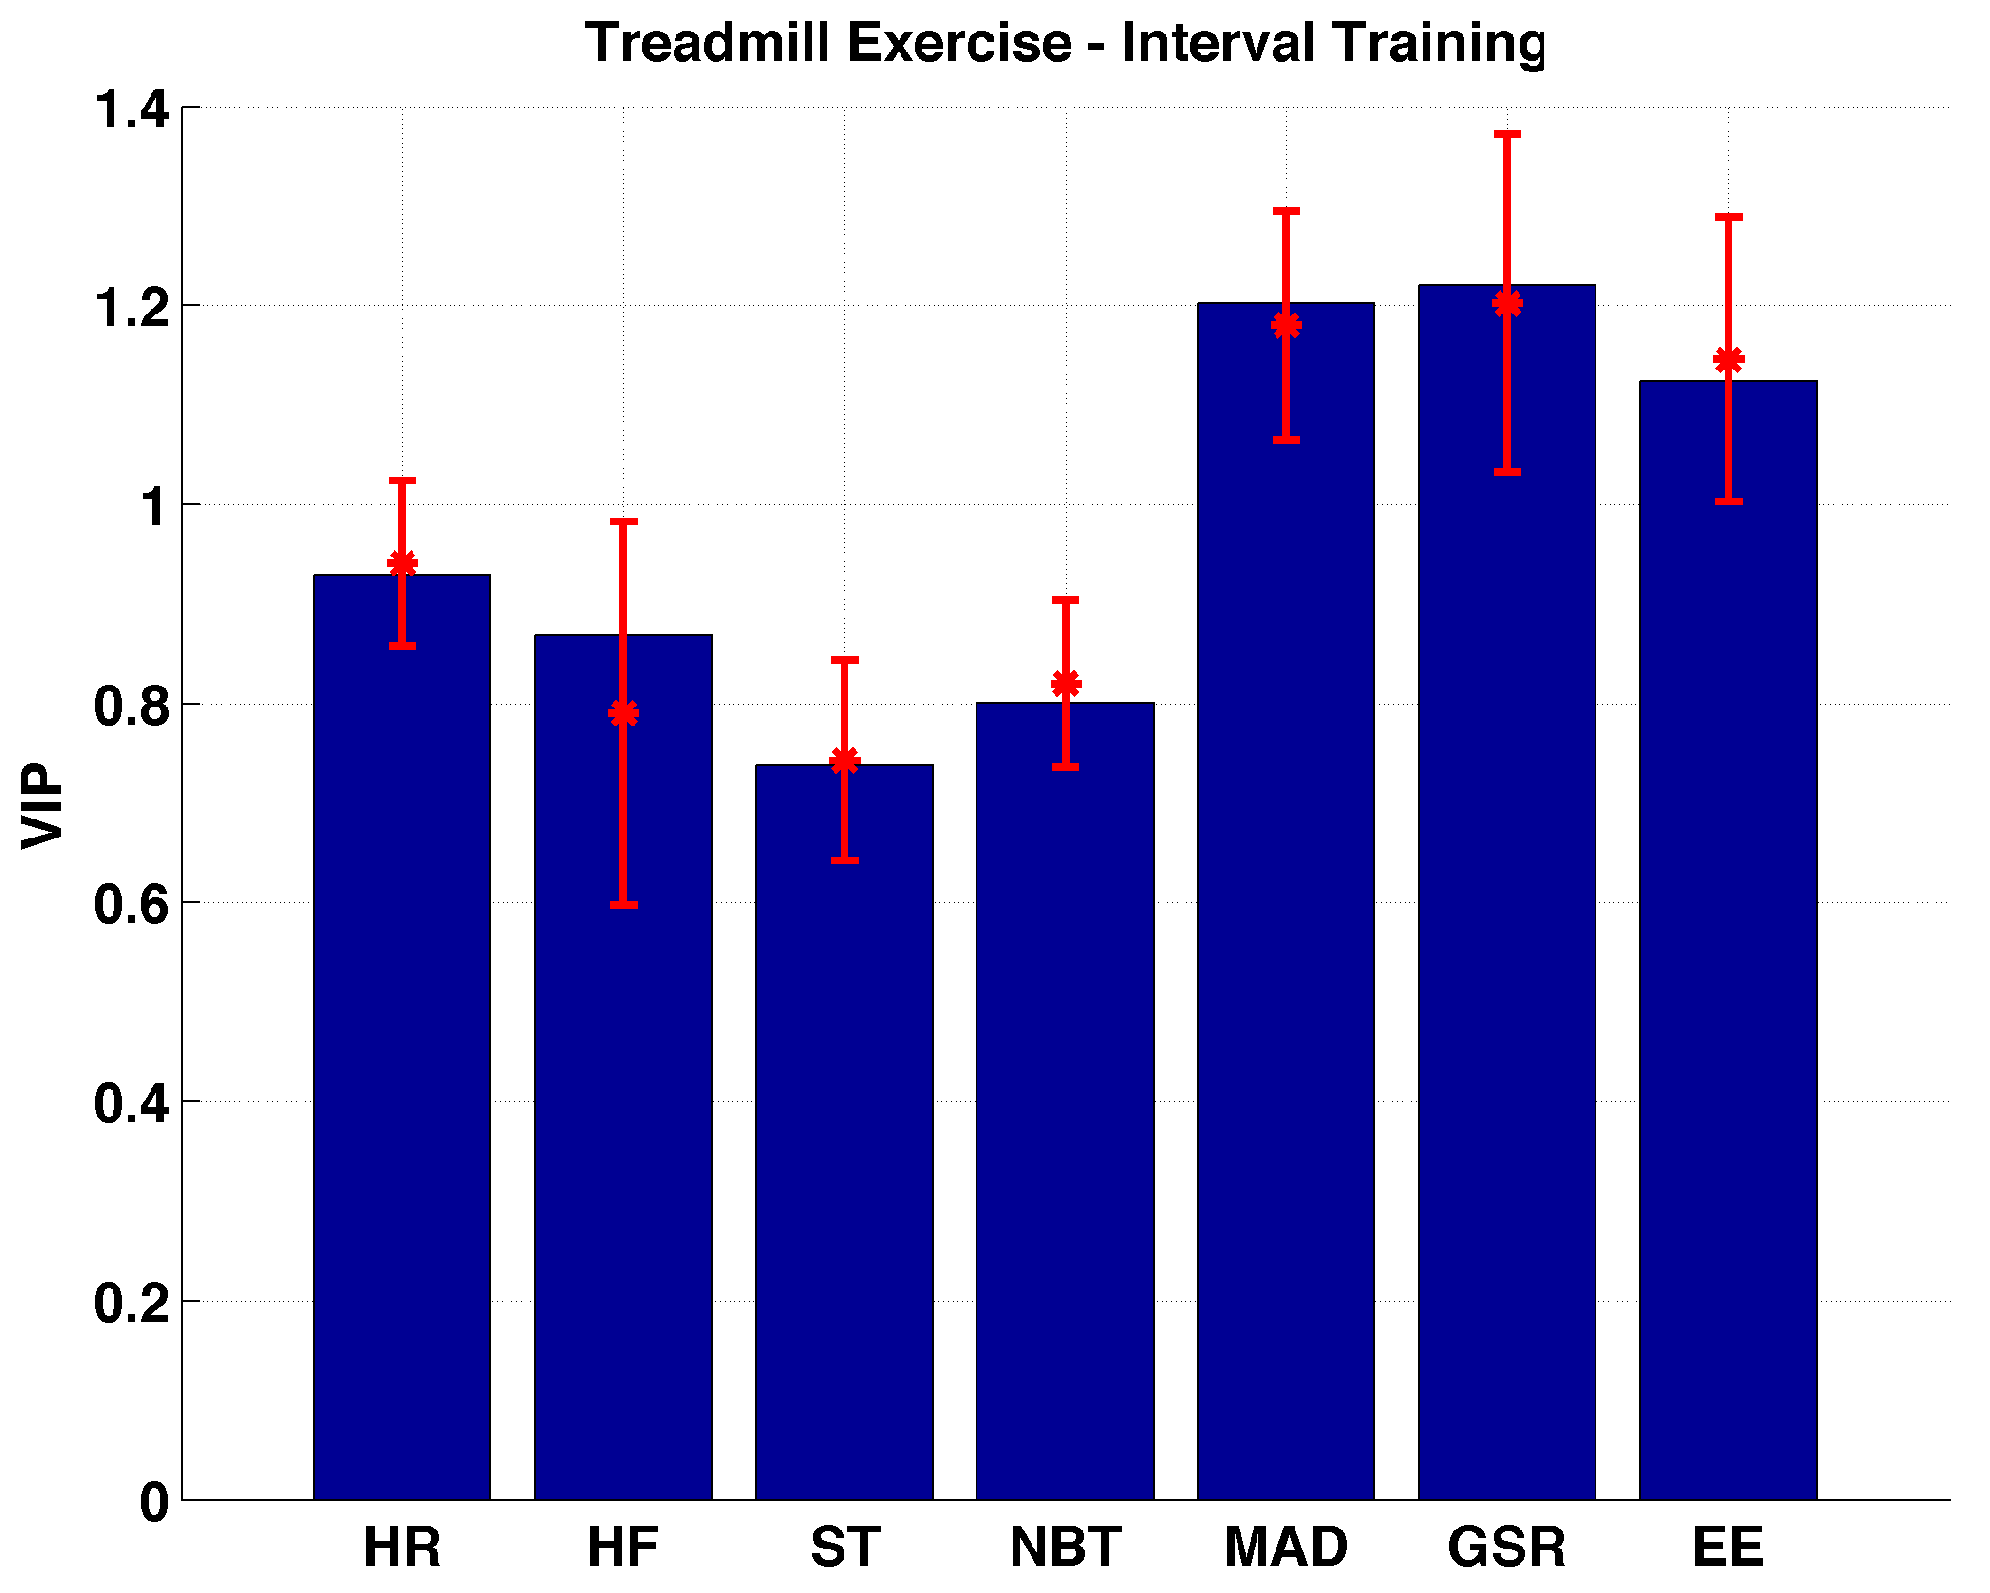
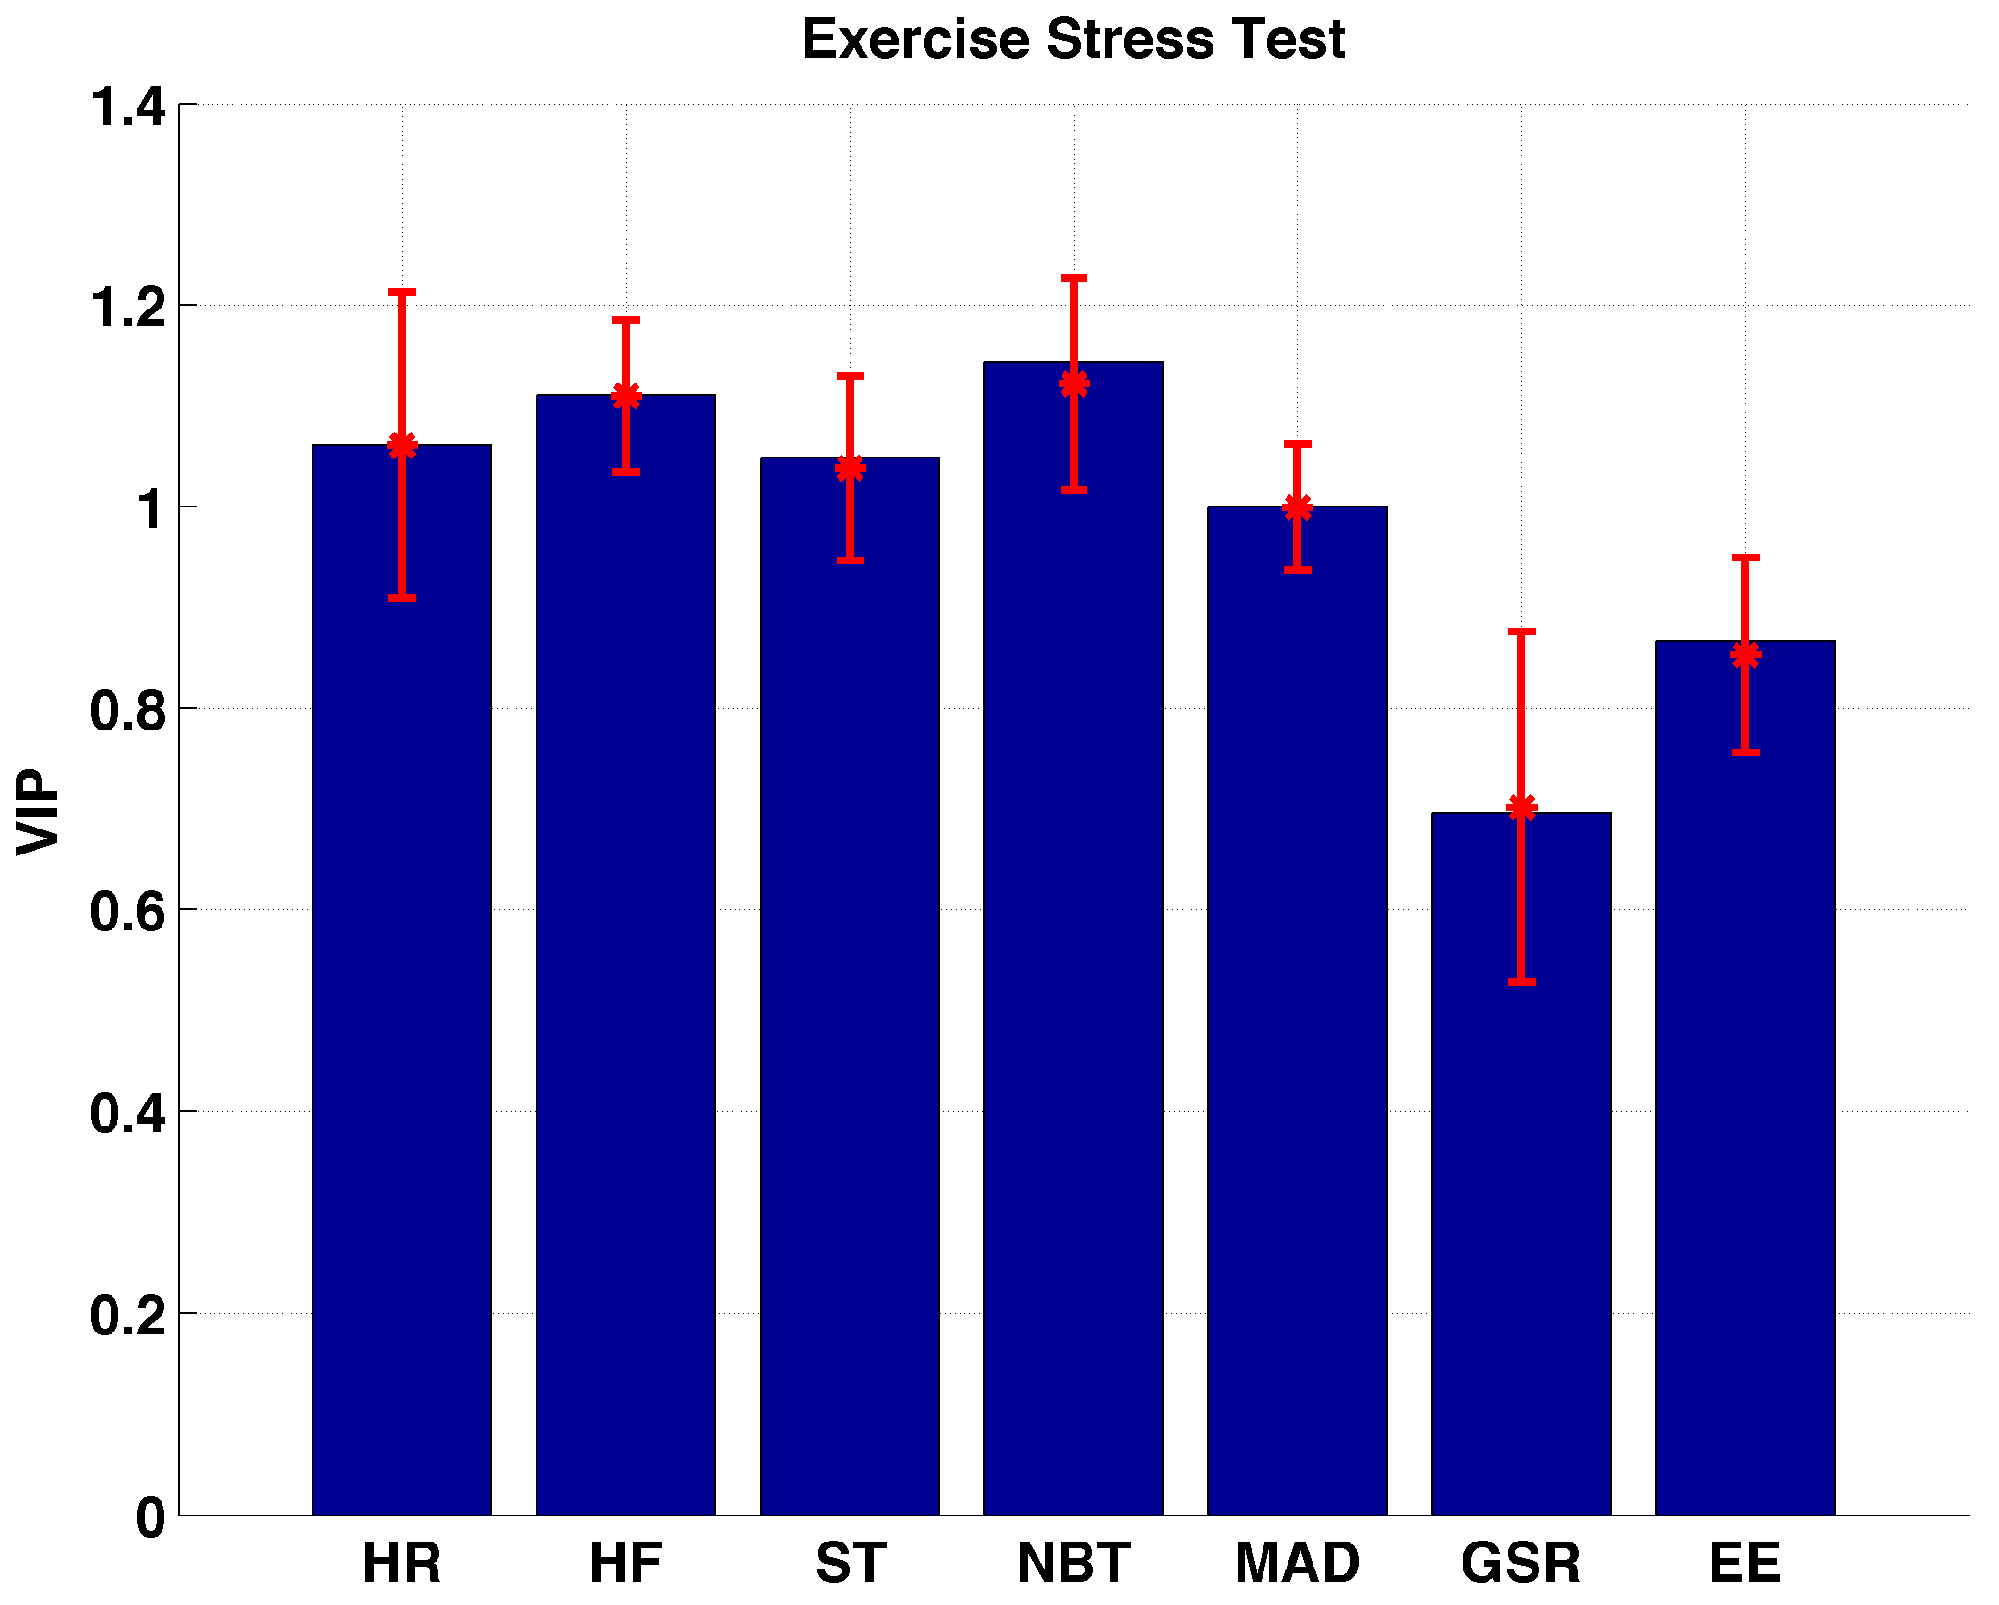
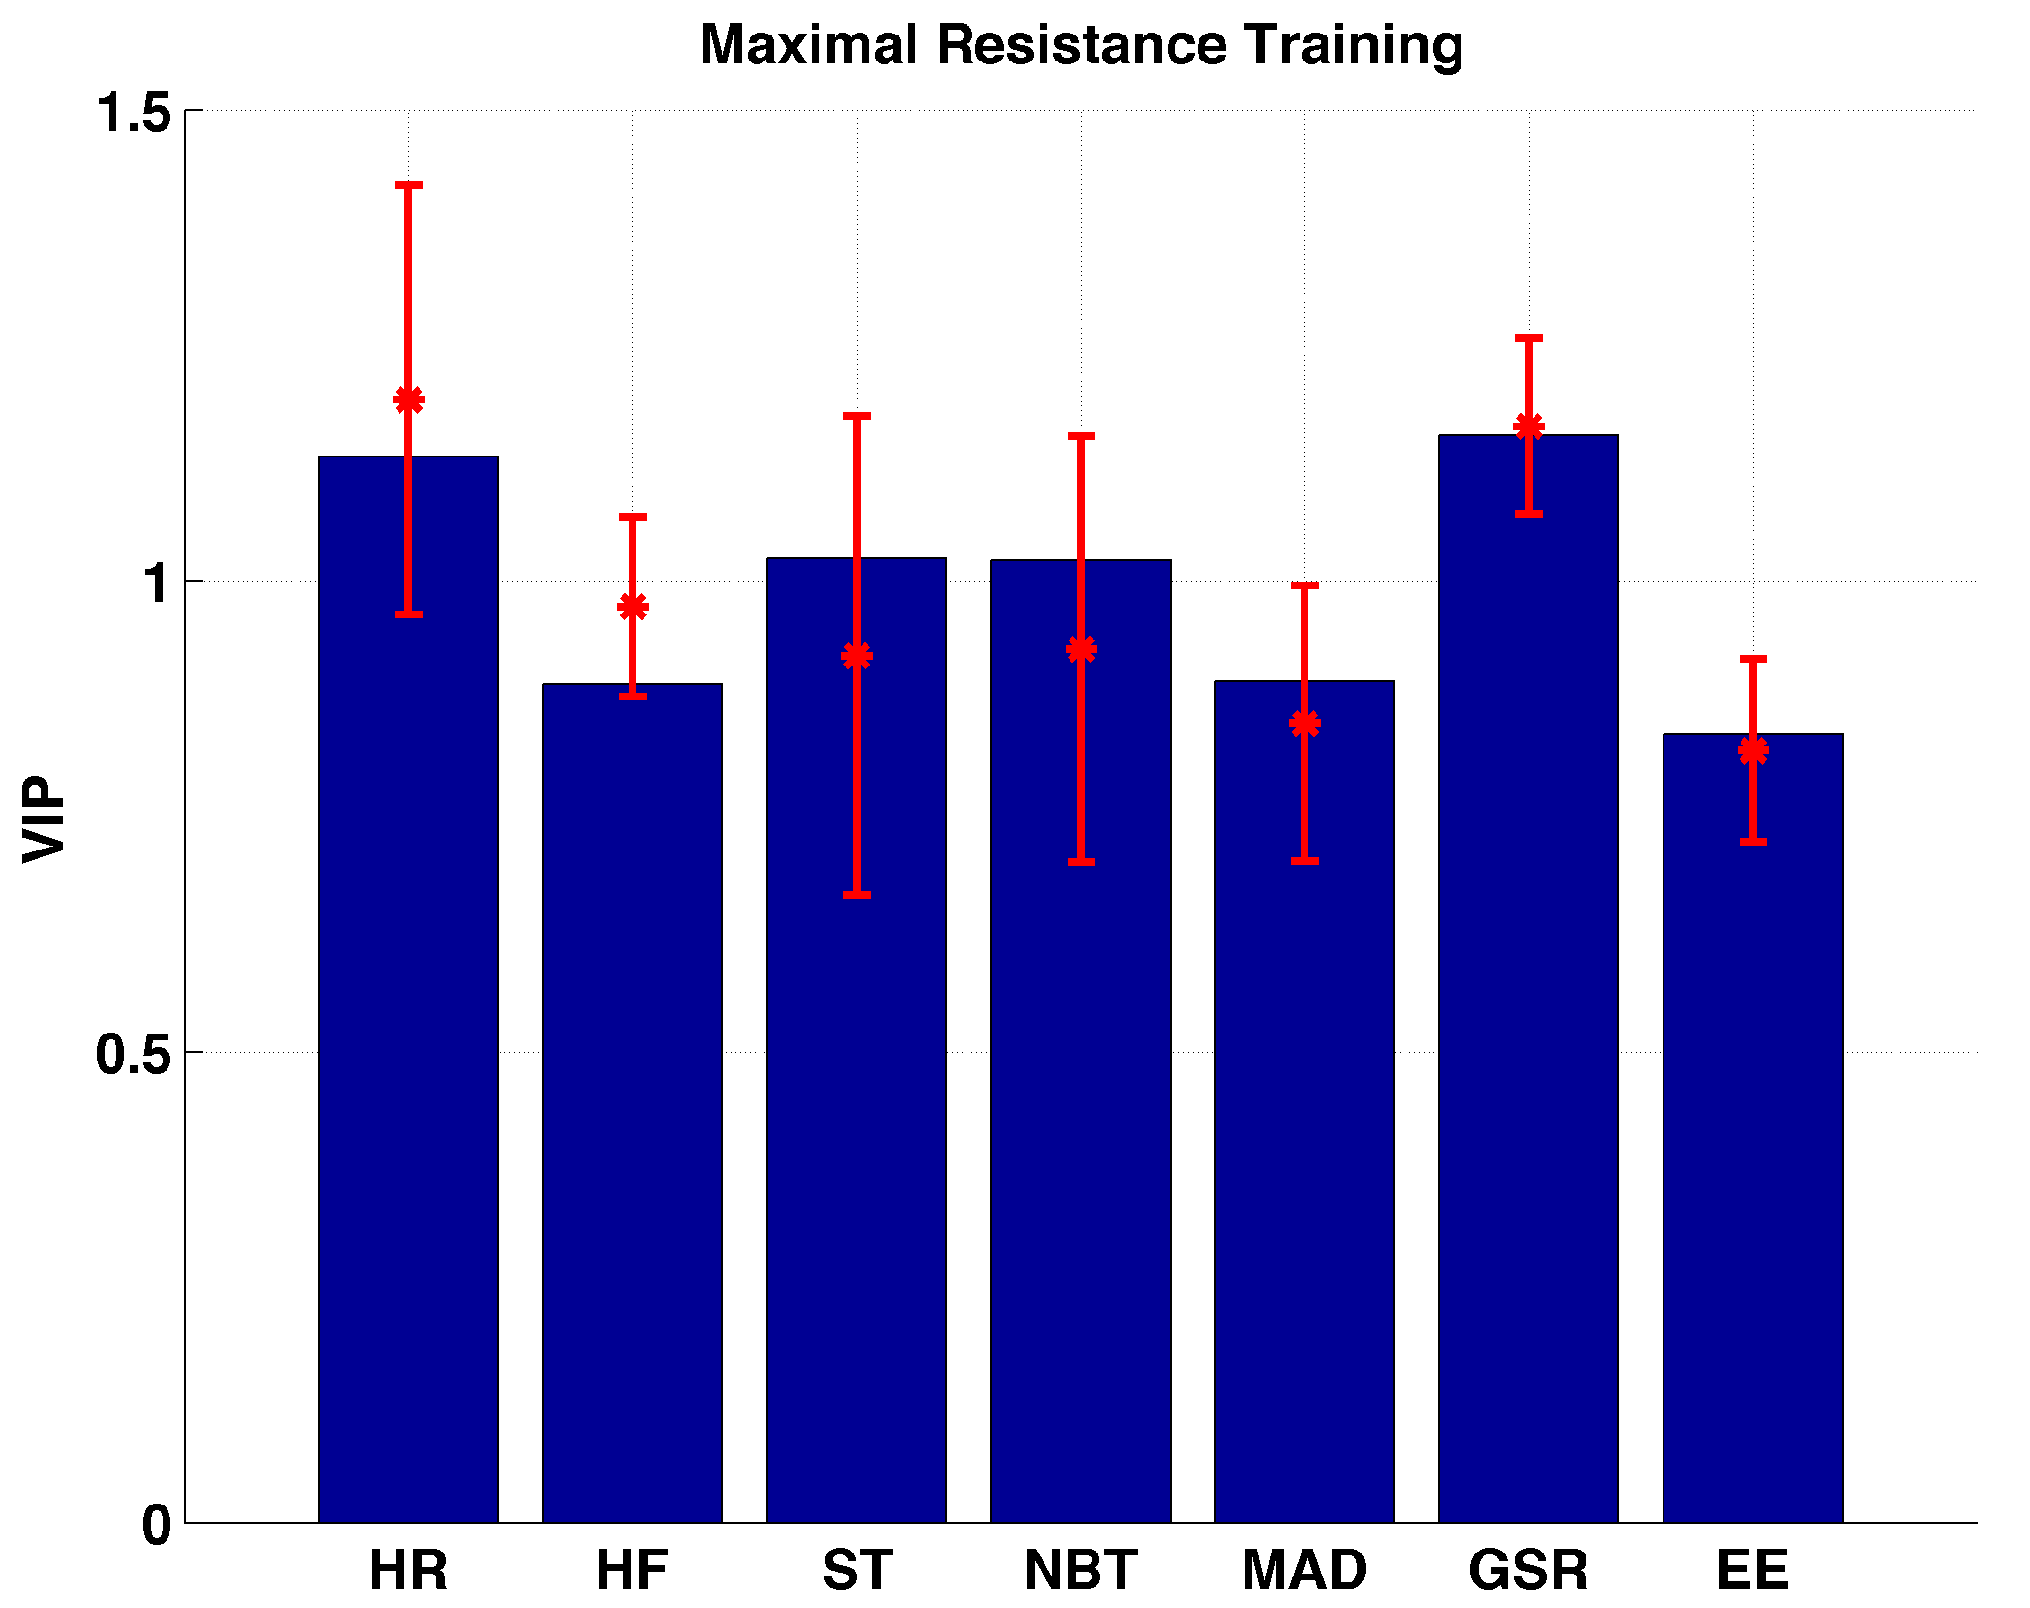
2.2. Variable Importance in Projection (VIP)
2.3. Experimental Setup
2.3.1. Protocol 1
2.3.2. Protocol 2
2.3.3. Aerobic Capacity
2.3.4. Muscular Strength
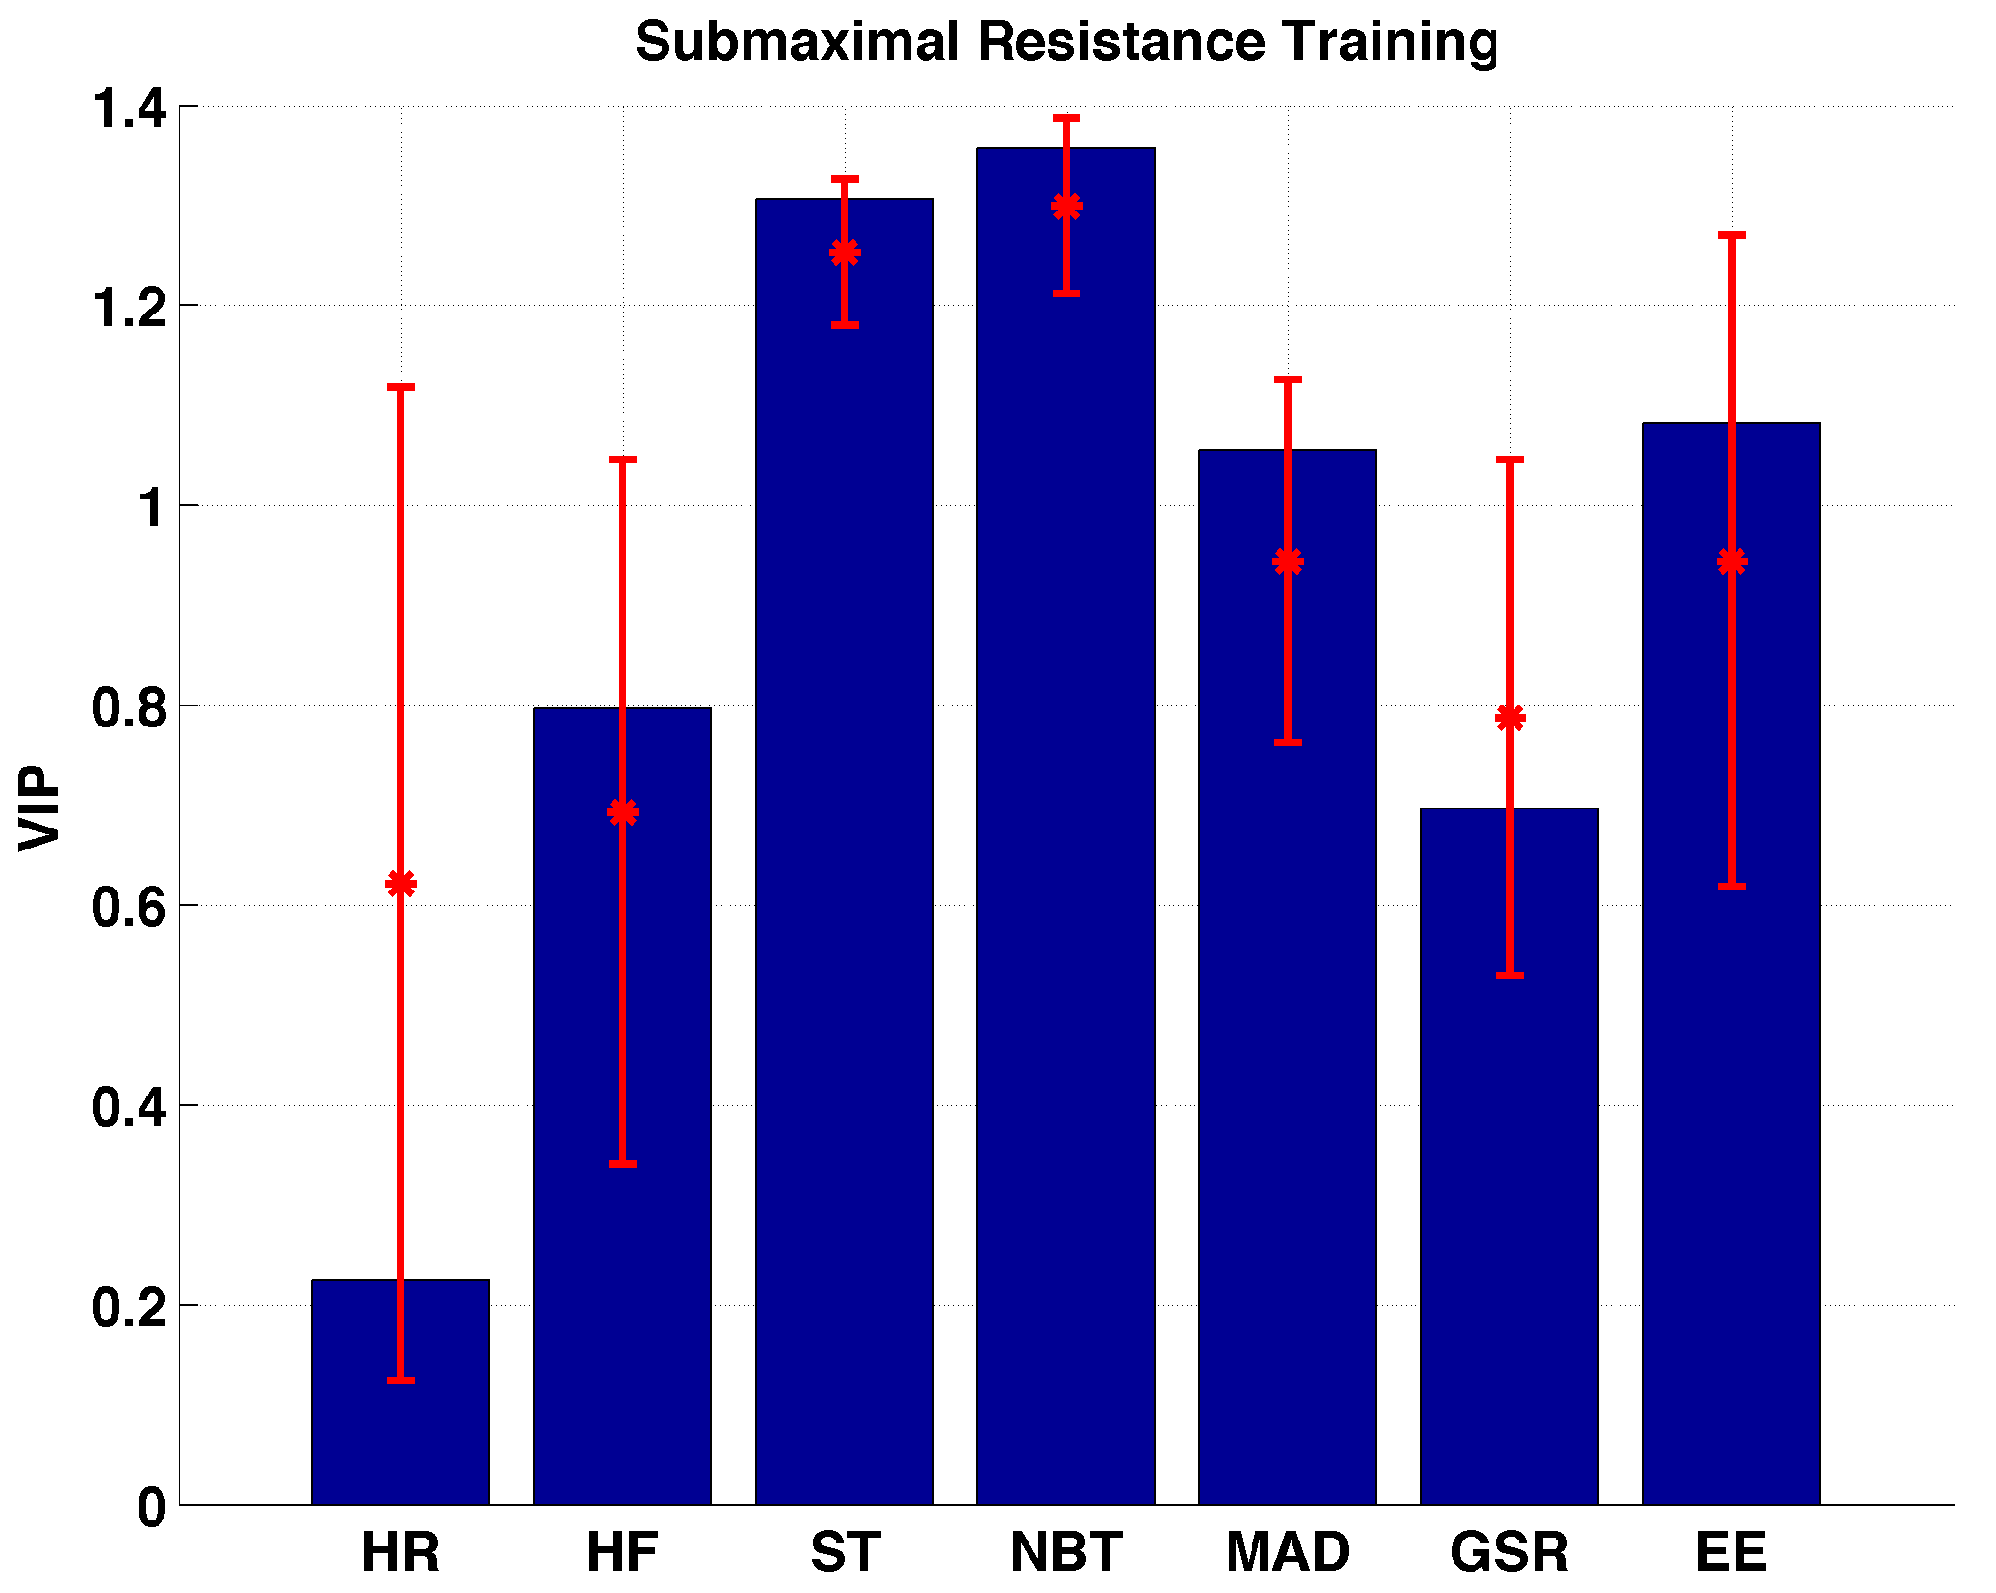
2.3.5. Submaximal Resistance Exercise Bout
2.3.6. Submaximal Aerobic Exercise Bout
3. Results
4. Discussion
5. Conclusions
Acknowledgments
Author Contributions
Conflicts of Interest
References
- Turksoy, K.; Paulino, T.M.; Zaharieva, D.P.; Yavelberg, L.; Jamnik, V.; Riddell, M.C.; Cinar, A. Classification of Physical Activity: Information to Artificial Pancreas Control Systems in Real Time. J. Diabetes Sci. Technol. 2015, 9, 1200–1207. [Google Scholar] [CrossRef] [PubMed]
- Kudva, Y.C.; Carter, R.E.; Cobelli, C.; Basu, R.; Basu, A. Closed-loop artificial pancreas systems: Physiological input to enhance next-generation devices. Diabetes Care 2014, 37, 1184–1190. [Google Scholar] [CrossRef] [PubMed]
- Dasanayake, I.S.; Bevier, W.C.; Castorino, K.; Pinsker, J.E.; Seborg, D.E.; Doyle, F.J., III; Dassau, E. Early Detection of Physical Activity for People With Type 1 Diabetes Mellitus. J. Diabetes Sci. Technol. 2015, 9, 1236–1245. [Google Scholar] [CrossRef] [PubMed]
- Stenerson, M.; Cameron, F.; Wilson, D.M.; Harris, B.; Payne, S.; Bequette, B.W.; Buckingham, B.A. The Impact of Accelerometer and Heart Rate Data on Hypoglycemia Mitigation in Type 1 Diabetes. J. Diabetes Sci. Technol. 2014, 8, 64–69. [Google Scholar] [CrossRef] [PubMed]
- Stenerson, M.; Cameron, F.; Payne, S.R.; Payne, S.L.; Ly, T.T.; Wilson, D.M.; Buckingham, B.A. The impact of accelerometer use in exercise-associated hypoglycemia prevention in type 1 diabetes. J. Diabetes Sci. Technol. 2015, 9, 80–85. [Google Scholar] [CrossRef] [PubMed]
- Breton, M.D.; Brown, S.A.; Karvetski, C.H.; Kollar, L.; Topchyan, K.A.; Anderson, S.M.; Kovatchev, B.P. Adding Heart Rate Signal to a Control-to-Range Artificial Pancreas System Improves the Protection Against Hypoglycemia During Exercise in Type 1 Diabetes. Diabetes Technol. Ther. 2014, 16, 506–511. [Google Scholar] [CrossRef] [PubMed]
- Cichosz, S.L.; Frystyk, J.; Hejlesen, O.K.; Tarnow, L.; Fleischer, J. A novel algorithm for prediction and detection of hypoglycemia based on continuous glucose monitoring and heart rate variability in patients with type 1 diabetes. J. Diabetes Sci. Technol. 2014, 8, 731–737. [Google Scholar] [CrossRef] [PubMed]
- Cichosz, S.L.; Frystyk, J.; Tarnow, L.; Fleischer, J. Combining information of autonomic modulation and CGM measurements enables prediction and improves detection of spontaneous hypoglycemic events. J. Diabetes Sci. Technol. 2015, 9, 132–137. [Google Scholar] [CrossRef] [PubMed]
- Turksoy, K.; Bayrak, E.S.; Quinn, L.; Littlejohn, E.; Cinar, A. Multivariable Adaptive Closed-Loop Control of an Artificial Pancreas without Meal and Activity Announcement. Diabetes Technol. Ther. 2013, 15, 386–400. [Google Scholar] [CrossRef] [PubMed]
- Turksoy, K.; Quinn, L.T.; Littlejohn, E.; Cinar, A. An Integrated Multivariable Artificial Pancreas Control System. J. Diabetes Sci. Technol. 2014, 8, 498–507. [Google Scholar] [CrossRef] [PubMed]
- Ding, S.; Schumacher, M. Sensor Monitoring of Physical Activity to Improve Glucose Management in Diabetic Patients: A Review. Sensors 2016, 16, 589. [Google Scholar] [CrossRef] [PubMed]
- Cinar, A.; Palazoğlu, A.; Kayihan, F. Chemical Process Performance Evaluation; CRC Press: Boca Raton, FL, USA, 2007. [Google Scholar]
- Kemalbay, G.; Korkmazoglu, O.B. Effects of multicollinearity on electricity consumption forecasting using partial least squares regression. Procedia-Soc. Behav. Sci. 2012, 62, 1150–1154. [Google Scholar] [CrossRef]
- Mendes, G.; Aleme, H.G.; Barbeira, P.J.S. Determination of octane numbers in gasoline by distillation curves and partial least squares regression. Fuel 2012, 97, 131–136. [Google Scholar] [CrossRef]
- Land, W.H.; Ford, W.; Park, J.W.; Mathur, R.; Hotchkiss, N.; Heine, J.; Eschrich, S.; Qiao, X.; Yeatman, T. Partial least squares (PLS) applied to medical bioinformatics. Procedia Comput. Sci. 2011, 6, 273–278. [Google Scholar] [CrossRef]
- Tian, D.; Zheng, W.; He, G.; Zheng, Y.; Andersen, M.E.; Tan, H.; Qu, W. Predicting cytotoxicity of complex mixtures in high cancer incidence regions of the Huai River Basin based on GC–MS spectrum with partial least squares regression. Environ. Res. 2015, 137, 391–397. [Google Scholar] [CrossRef] [PubMed]
- Gonder-Frederick, L.A.; Schmidt, K.M.; Vajda, K.A.; Greear, M.L.; Singh, H.; Shepard, J.A.; Cox, D.J. Psychometric properties of the hypoglycemia fear survey-ii for adults with type 1 diabetes. Diabetes Care 2011, 34, 801–806. [Google Scholar] [CrossRef] [PubMed]
- Bradley, C. Diabetes treatment satisfaction questionnaire. Diabetes Care 1999, 22, 530. [Google Scholar] [CrossRef] [PubMed]
- Zigmond, A.S.; Snaith, R.P. The hospital anxiety and depression scale. Acta Psychiatr. Scand. 1983, 67, 361–370. [Google Scholar] [CrossRef] [PubMed]
- Devins, G.M. Using the Illness Intrusiveness Ratings Scale to understand health-related quality of life in chronic disease. J. Psychosom. Res. 2010, 68, 591–602. [Google Scholar] [CrossRef] [PubMed]
- McDonough, J.R.; Bruce, R.A. Maximal exercise testing in assessing cardiovascular function. J. S. C. Med. Assoc. 1969, 65, 25–33. [Google Scholar]
- Karvonen, M.J.; Kentala, E.; Mustala, O. The effects of training on heart rate: A longitudinal study. Ann. Med. Exp. Biol. Fenn. 1957, 35, 307–315. [Google Scholar] [PubMed]
- Efron, B.; Gong, G. A leisurely look at the bootstrap, the jackknife, and cross-validation. Am. Stat. 1983, 37, 36–48. [Google Scholar] [CrossRef]
- Galassetti, P.; Riddell, M.C. Exercise and type 1 diabetes (T1DM). Compr. Physiol. 2013, 3, 1309–1336. [Google Scholar] [PubMed]
- Riddell, M.; Perkins, B.A. Exercise and glucose metabolism in persons with diabetes mellitus: Perspectives on the role for continuous glucose monitoring. J. Diabetes Sci. Technol. 2009, 3, 914–923. [Google Scholar] [CrossRef] [PubMed]
- Breton, M.; Farret, A.; Bruttomesso, D.; Anderson, S.; Magni, L.; Patek, S.; Dalla Man, C.; Place, J.; Demartini, S.; Del Favero, S.; et al. Fully Integrated Artificial Pancreas in Type 1 Diabetes Modular Closed-Loop Glucose Control Maintains Near Normoglycemia. Diabetes 2012, 61, 2230–2237. [Google Scholar] [CrossRef] [PubMed]
- Sherr, J.L.; Cengiz, E.; Palerm, C.C.; Clark, B.; Kurtz, N.; Roy, A.; Carria, L.; Cantwell, M.; Tamborlane, W.V.; Weinzimer, S.A. Reduced hypoglycemia and increased time in target using closed-loop insulin delivery during nights with or without antecedent afternoon exercise in type 1 diabetes. Diabetes Care 2013, 36, 2909–2914. [Google Scholar] [CrossRef] [PubMed]
- Luijf, Y.M.; DeVries, J.H.; Zwinderman, K.; Leelarathna, L.; Nodale, M.; Caldwell, K.; Kumareswaran, K.; Elleri, D.; Allen, J.M.; Wilinska, M.E.; et al. Day and night closed-loop control in adults with type 1 diabetes: A comparison of two closed-loop algorithms driving continuous subcutaneous insulin infusion versus patient self-management. Diabetes Care 2013, 36, 3882–3887. [Google Scholar] [CrossRef] [PubMed]
- Nimri, R.; Danne, T.; Kordonouri, O.; Atlas, E.; Bratina, N.; Biester, T.; Avbelj, M.; Miller, S.; Muller, I.; Phillip, M.; et al. The ‘Glucositter’ overnight automated closed loop system for type 1 diabetes: A randomized crossover trial. Pediatr. Diabetes 2013, 14, 159–167. [Google Scholar] [PubMed]
- Elleri, D.; Allen, J.M.; Kumareswaran, K.; Leelarathna, L.; Nodale, M.; Caldwell, K.; Cheng, P.; Kollman, C.; Haidar, A.; Murphy, H.R.; et al. Closed-Loop Basal Insulin Delivery Over 36 Hours in Adolescents With Type 1 Diabetes: Randomized clinical trial. Diabetes Care 2013, 36, 838–844. [Google Scholar] [CrossRef] [PubMed]
- Russell, S.J.; El-Khatib, F.H.; Sinha, M.; Magyar, K.L.; McKeon, K.; Georgen, L.G.; Balliro, C.; Hillard, M.A.; Nathan, D.M.; Damiano, E.R. Outpatient Glycemic Control with a Bionic Pancreas in Type 1 Diabetes. N. Engl. J. Med. 2014, 371, 313–325. [Google Scholar] [CrossRef] [PubMed]
- El-Khatib, F.H.; Russell, S.J.; Magyar, K.L.; Sinha, M.; McKeon, K.; Nathan, D.M.; Damiano, E.R. Autonomous and continuous adaptation of a bihormonal bionic pancreas in adults and adolescents with type 1 diabetes. J. Clin. Endocrinol. Metab. 2014, 99, 1701–1711. [Google Scholar] [CrossRef] [PubMed]
- Turksoy, K.; Quinn, L.; Littlejohn, E.; Cinar, A. Multivariable Adaptive Identification and Control for Artificial Pancreas Systems. IEEE Trans. Biomed. Eng. 2014, 61, 883–891. [Google Scholar] [CrossRef] [PubMed]
- Colberg, S.R.; Laan, R.; Dassau, E.; Kerr, D. Physical Activity and Type 1 Diabetes Time for a Rewire? J. Diabetes Sci. Technol. 2015, 9, 609–618. [Google Scholar] [CrossRef] [PubMed]
- Bequette, B.W. Challenges and recent progress in the development of a closed-loop artificial pancreas. Annu. Rev. Control 2012, 36, 255–266. [Google Scholar] [CrossRef] [PubMed]
- American Diabetes Association. Physical activity/exercise and diabetes. Diabetes Care 2004, 27, S58–S62. [Google Scholar]
- Riddell, M.C.; Zaharieva, D.P.; Yavelberg, L.; Cinar, A.; Jamnik, V.K. Exercise and the Development of the Artificial Pancreas One of the More Difficult Series of Hurdles. J. Diabetes Sci. Technol. 2015, 9, 1217–1226. [Google Scholar] [CrossRef] [PubMed]
- Riddell, M.C.; Gallen, I.W.; Smart, C.E.; Taplin, C.E.; Adolfsson, P.; Lumb, A.N.; Kowalski, A.; Rabasa-Lhoret, R.; McCrimmon, R.J.; Hume, C.; et al. Exercise management in type 1 diabetes: A consensus statement. Lancet Diabetes Endocrinol. 2017. [Google Scholar] [CrossRef]
- Yardley, J.E.; Kenny, G.P.; Perkins, B.A.; Riddell, M.C.; Balaa, N.; Malcolm, J.; Boulay, P.; Khandwala, F.; Sigal, R.J. Resistance Versus Aerobic Exercise: Acute effects on glycemia in type 1 diabetes. Diabetes Care 2013, 36, 537–542. [Google Scholar] [CrossRef] [PubMed]
- Yardley, J.E.; Kenny, G.P.; Perkins, B.A.; Riddell, M.C.; Malcolm, J.; Boulay, P.; Khandwala, F.; Sigal, R.J. Effects of performing resistance exercise before versus after aerobic exercise on glycemia in type 1 diabetes. Diabetes Care 2012, 35, 669–675. [Google Scholar] [CrossRef] [PubMed]
- Perala, C.H.; Sterling, B.S. Galvanic Skin Response As a Measure of Soldier Stress. Available online: www.dtic.mil/cgi-bin/GetTRDoc?Location=U2&doc=GetTRDoc.pdf&AD=ADA468462 (accessed on 3 March 2017).
- Villarejo, M.V.; Zapirain, B.G.; Zorrilla, A.M. A stress sensor based on Galvanic Skin Response (GSR) controlled by ZigBee. Sensors 2012, 12, 6075–6101. [Google Scholar] [CrossRef] [PubMed]
- Fernandes, A.; Helawar, R.; Lokesh, R.; Tari, T.; Shahapurkar, A.V. Determination of Stress using Blood Pressure and Galvanic Skin Response. In Proceedings of the 2014 International Conference on Communication and Network Technologies (ICCNT), Sivakasi, India, 18–19 December 2014; pp. 165–168.
- Ben Brahim, N.; Place, J.; Renard, E.; Breton, M.D. Identification of Main Factors Explaining Glucose Dynamics During and Immediately After Moderate Exercise in Patients With Type 1 Diabetes. J. Diabetes Sci. Technol. 2015, 9, 1185–1191. [Google Scholar] [CrossRef] [PubMed]


| Variable | n (%) | Mean (SD) |
|---|---|---|
| Age (year) | 24.2 (5.41) | |
| Diabetes Duration (years) | 12.1 (8.24) | |
| HbA1c (%) | 7.8 (1.31) | |
| BMI (kg/m2) | 25.1 (4.34) | |
| Gender | ||
| Male | 12 (46.2) | |
| Female | 14 (53.8) | |
| Race/Ethnicity | ||
| White/non-Hispanic | 24 (92.3) | |
| African American | 2 (7.7) |
| ID | Age (year) | Gender | Race/Ethnicity | BMI (kg/m2) | Years with Diabetes (year) | HbA1c (%) | Types of Exercise Performed |
|---|---|---|---|---|---|---|---|
| 1 | 21.3 | M | W | 20.2 | 21.3 | 7.3 | EST, TE, TE-I; BE; WL |
| 2 | 21.3 | M | W | 21.0 | 12.9 | 7.4 | EST, TE, TE-I; BE; WV |
| 3 | 20.3 | F | W | 23.5 | 10.6 | 11.3 | EST, TE, BE; WV |
| 4 | 23.9 | M | AA | 24.0 | 16.3 | 8.6 | EST, TE, WV |
| 5 | 25.1 | F | W | 20.8 | 5.3 | 6.1 | EST, TE, BE; WV |
| 6 | 28.5 | F | W | 31.2 | 16 | 6.3 | EST, TE, TE-I; BE; WV |
| 7 | 21.8 | F | W | 21.4 | 7 | 8.1 | TE, TE-I; BE; WV |
| 8 | 34.3 | M | W | 23.5 | 31.4 | 8.6 | EST, TE, TE-I; BE |
| 9 | 22.6 | F | W | 27.2 | 11.5 | 8.8 | EST, TE, TE-I; BE |
| 10 | 22.8 | M | W | 31.0 | 10.2 | 6.6 | EST, TE, TE-I; BE |
| 11 | 19.2 | F | W | 24.6 | 7.3 | 9.3 | EST, TE, TE-I; BE |
| 12 | 32.8 | F | W | 38.3 | 29.5 | 7 | EST, TE, TE-I; BE |
| 13 | 24.9 | F | W | 24.0 | 13.7 | 8.2 | EST, TE, TE-I; BE |
| 14 | 20.8 | F | W | 23.6 | 8.8 | 8.7 | EST, TE, TE-I; BE |
| 15 | 19.5 | F | W | 25.7 | 3.3 | 7.2 | EST, TE, TE-I; BE |
| 16 | 19.4 | M | W | 23.3 | 2.5 | 5.1 | EST, TE, TE-I; BE; WV |
| 17 | 34.2 | F | AA | 22.1 | 3.2 | 8.4 | EST, TE, TE-I; BE |
| 18 | 20.7 | F | W | 29.2 | 9.8 | 8.2 | EST, TE, TE-I; BE |
| 19 | 20.2 | M | W | 23.8 | 10.4 | 8.3 | EST, TE, TE-I; BE |
| 20 | 25.3 | M | W | 26.5 | 15.3 | 7.1 | EST, TE, TE-I; BE |
| 21 | 19.5 | M | W | 24.6 | 10 | 9.1 | EST, TE, TE-I; BE; MRT; SRT |
| 22 | 19.2 | M | W | 22.1 | 7.7 | 8.7 | EST, TE, TE-I; BE; MRT |
| 23 | 22.9 | M | W | 21.5 | 6 | 7.4 | EST, TE, TE-I; BE; MRT; SRT |
| 24 | 23.2 | F | W | 23.0 | 10.3 | 7 | EST, TE, TE-I; BE; MRT; SRT |
| 25 | 39.1 | M | W | 33.6 | 31.2 | 7.9 | EST, TE, TE-I; BE; MRT; SRT |
| 26 | 27.5 | F | W | 22.9 | 2.4 | 5.5 | EST, TE, TE-I; BE; MRT; SRT |
| Type of Exercise | Number of Sessions | Median (First, Third Quartiles) (mg/dL/min) |
|---|---|---|
| Treadmill Exercise | 44 | −1.411 (−2.33, −0.721) |
| Treadmill Exercise-Interval | 23 | −1.779 (−3.28, −0.977) |
| Exercise Stress Test | 19 | −0.311 (−1.141, 0.237) |
| Submaximal Resistance | 5 | 0.245 (−0.766, 0.59) |
| Maximal Resistance | 6 | −0.257 (−0.336, −0.093) |
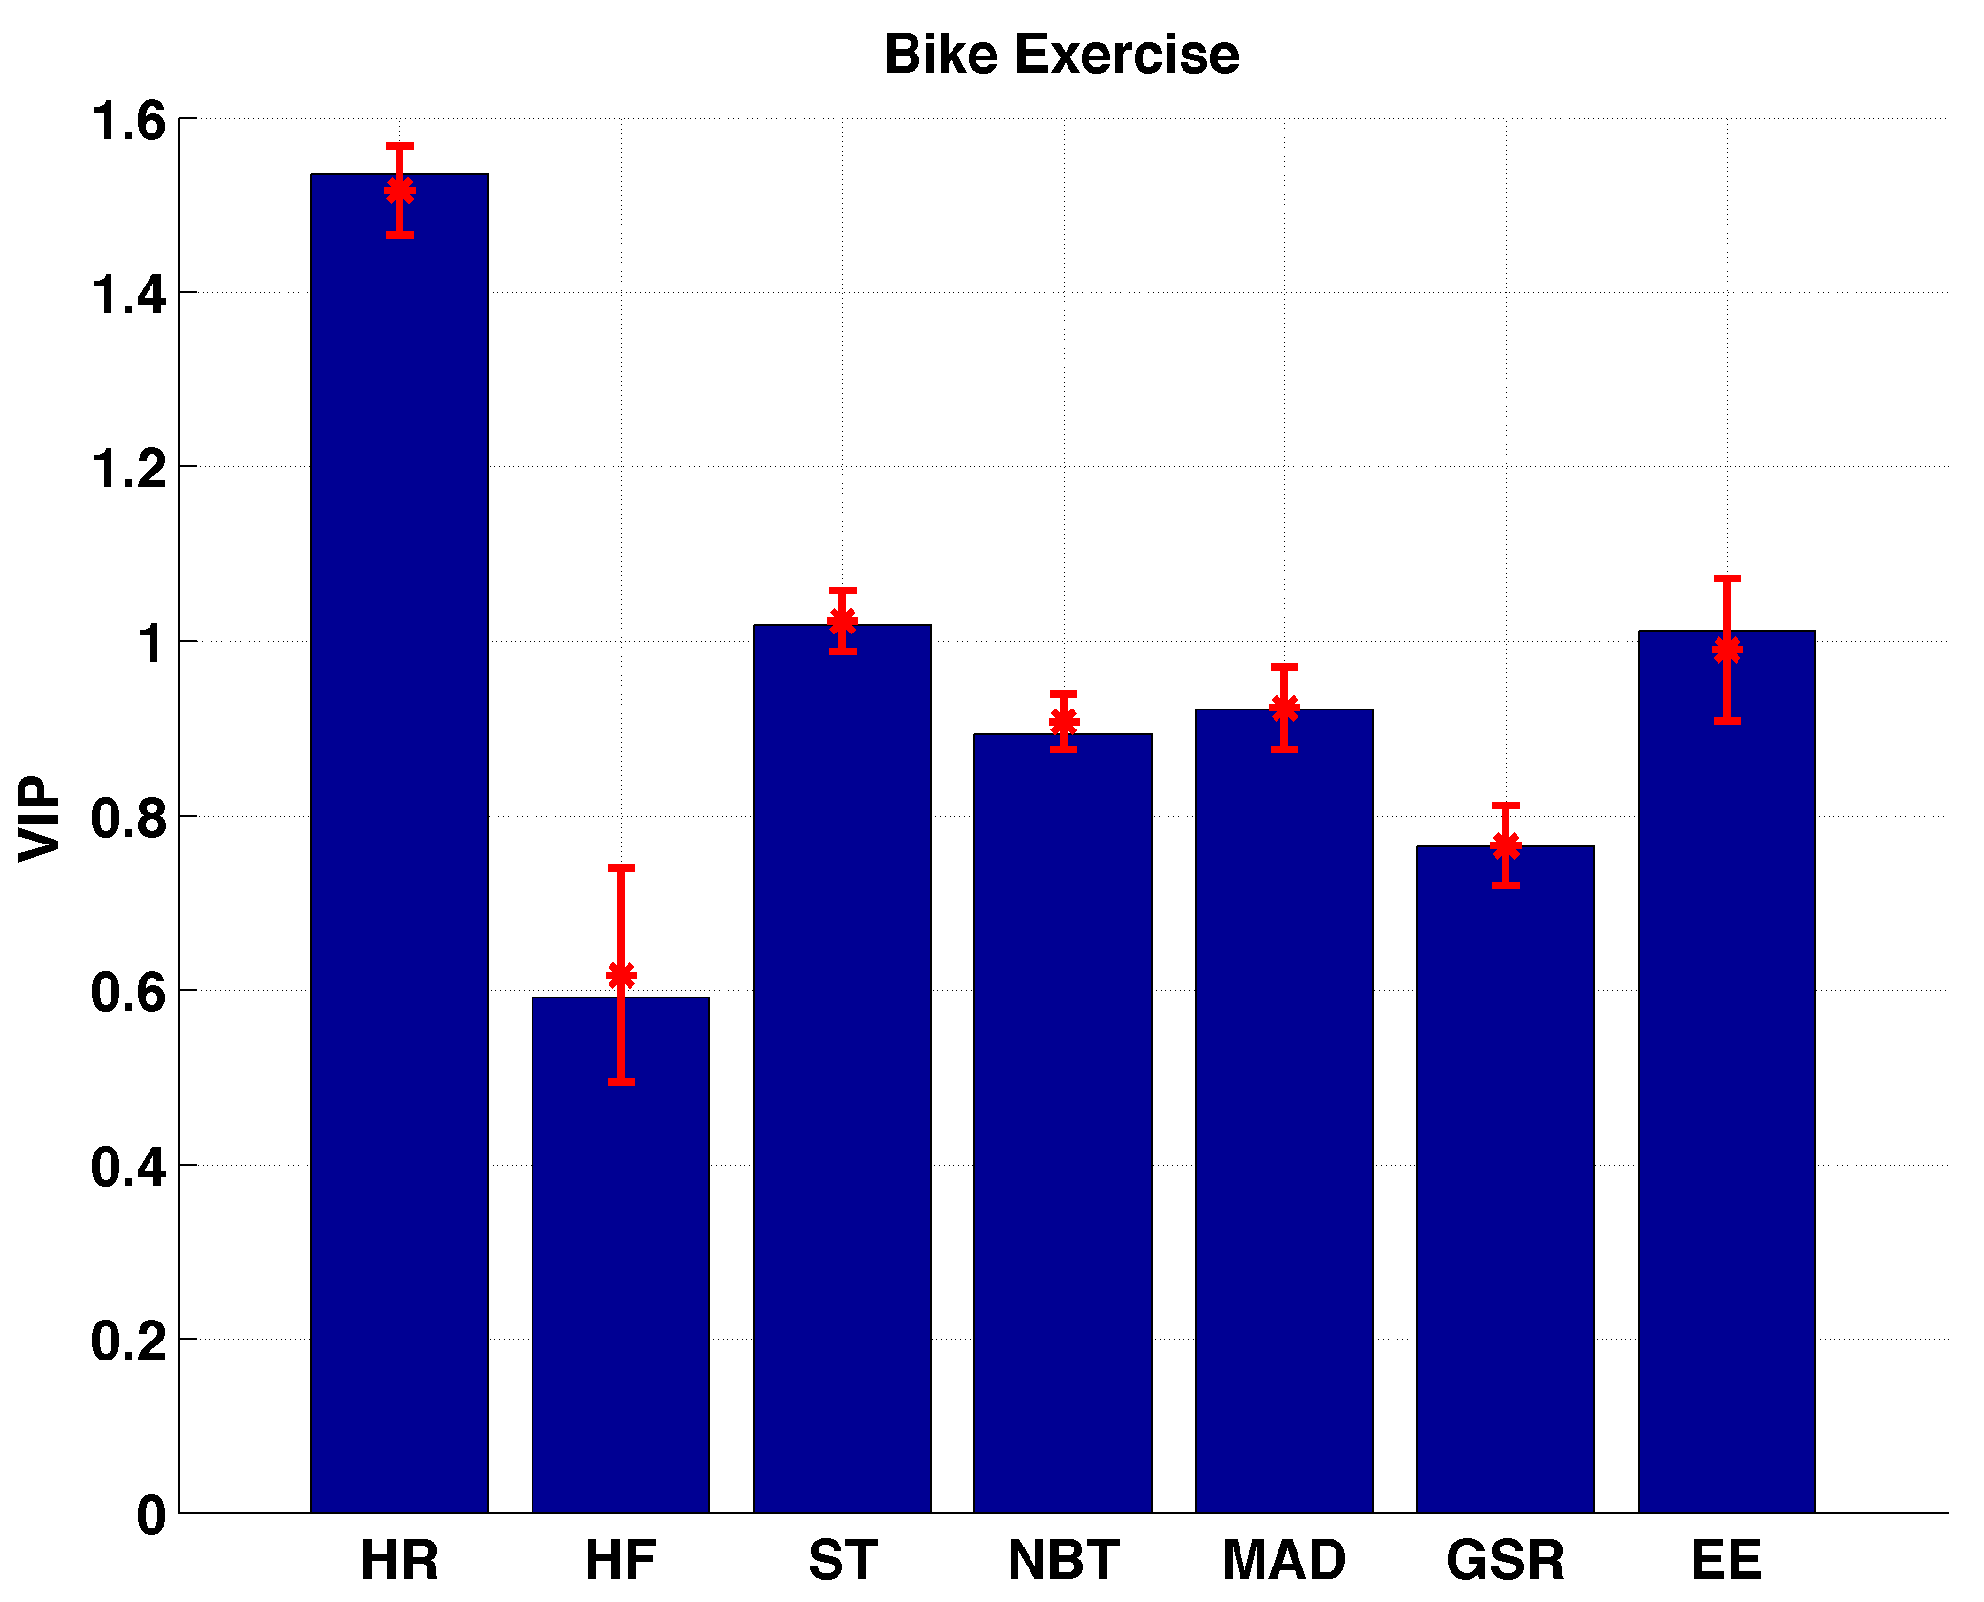
| Bike Exercise | 40 | −1.483 (−2.311, −0.623) |
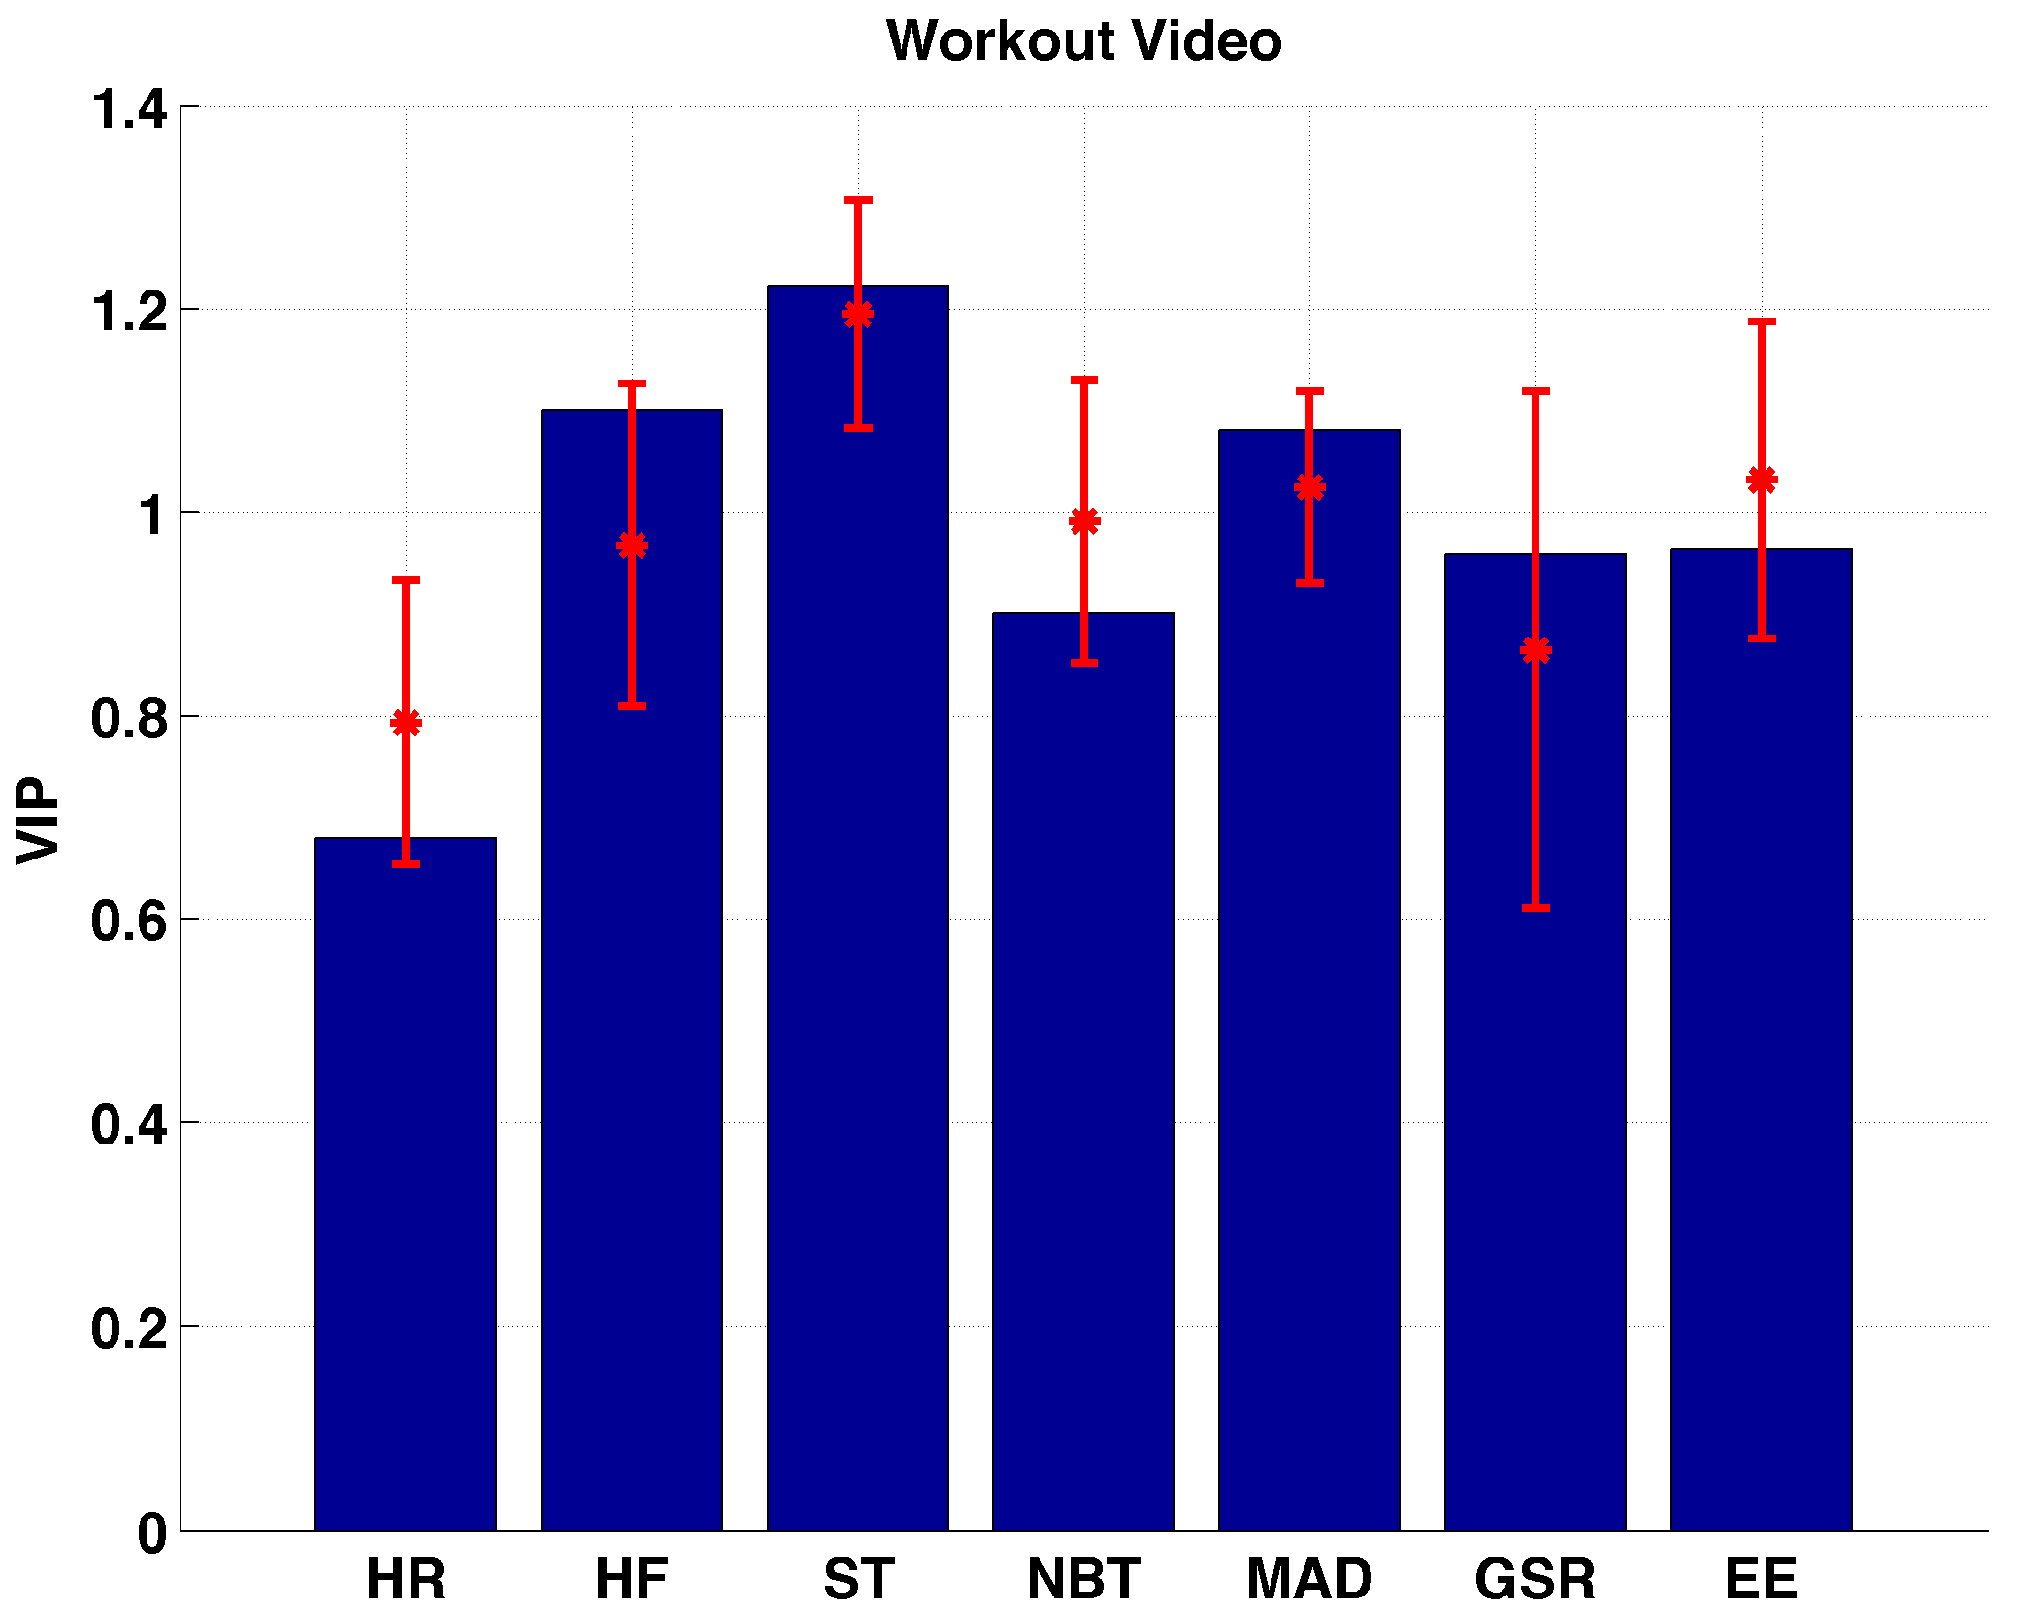
| Workout Video | 12 | −0.41 (−0.878, −0.119) |
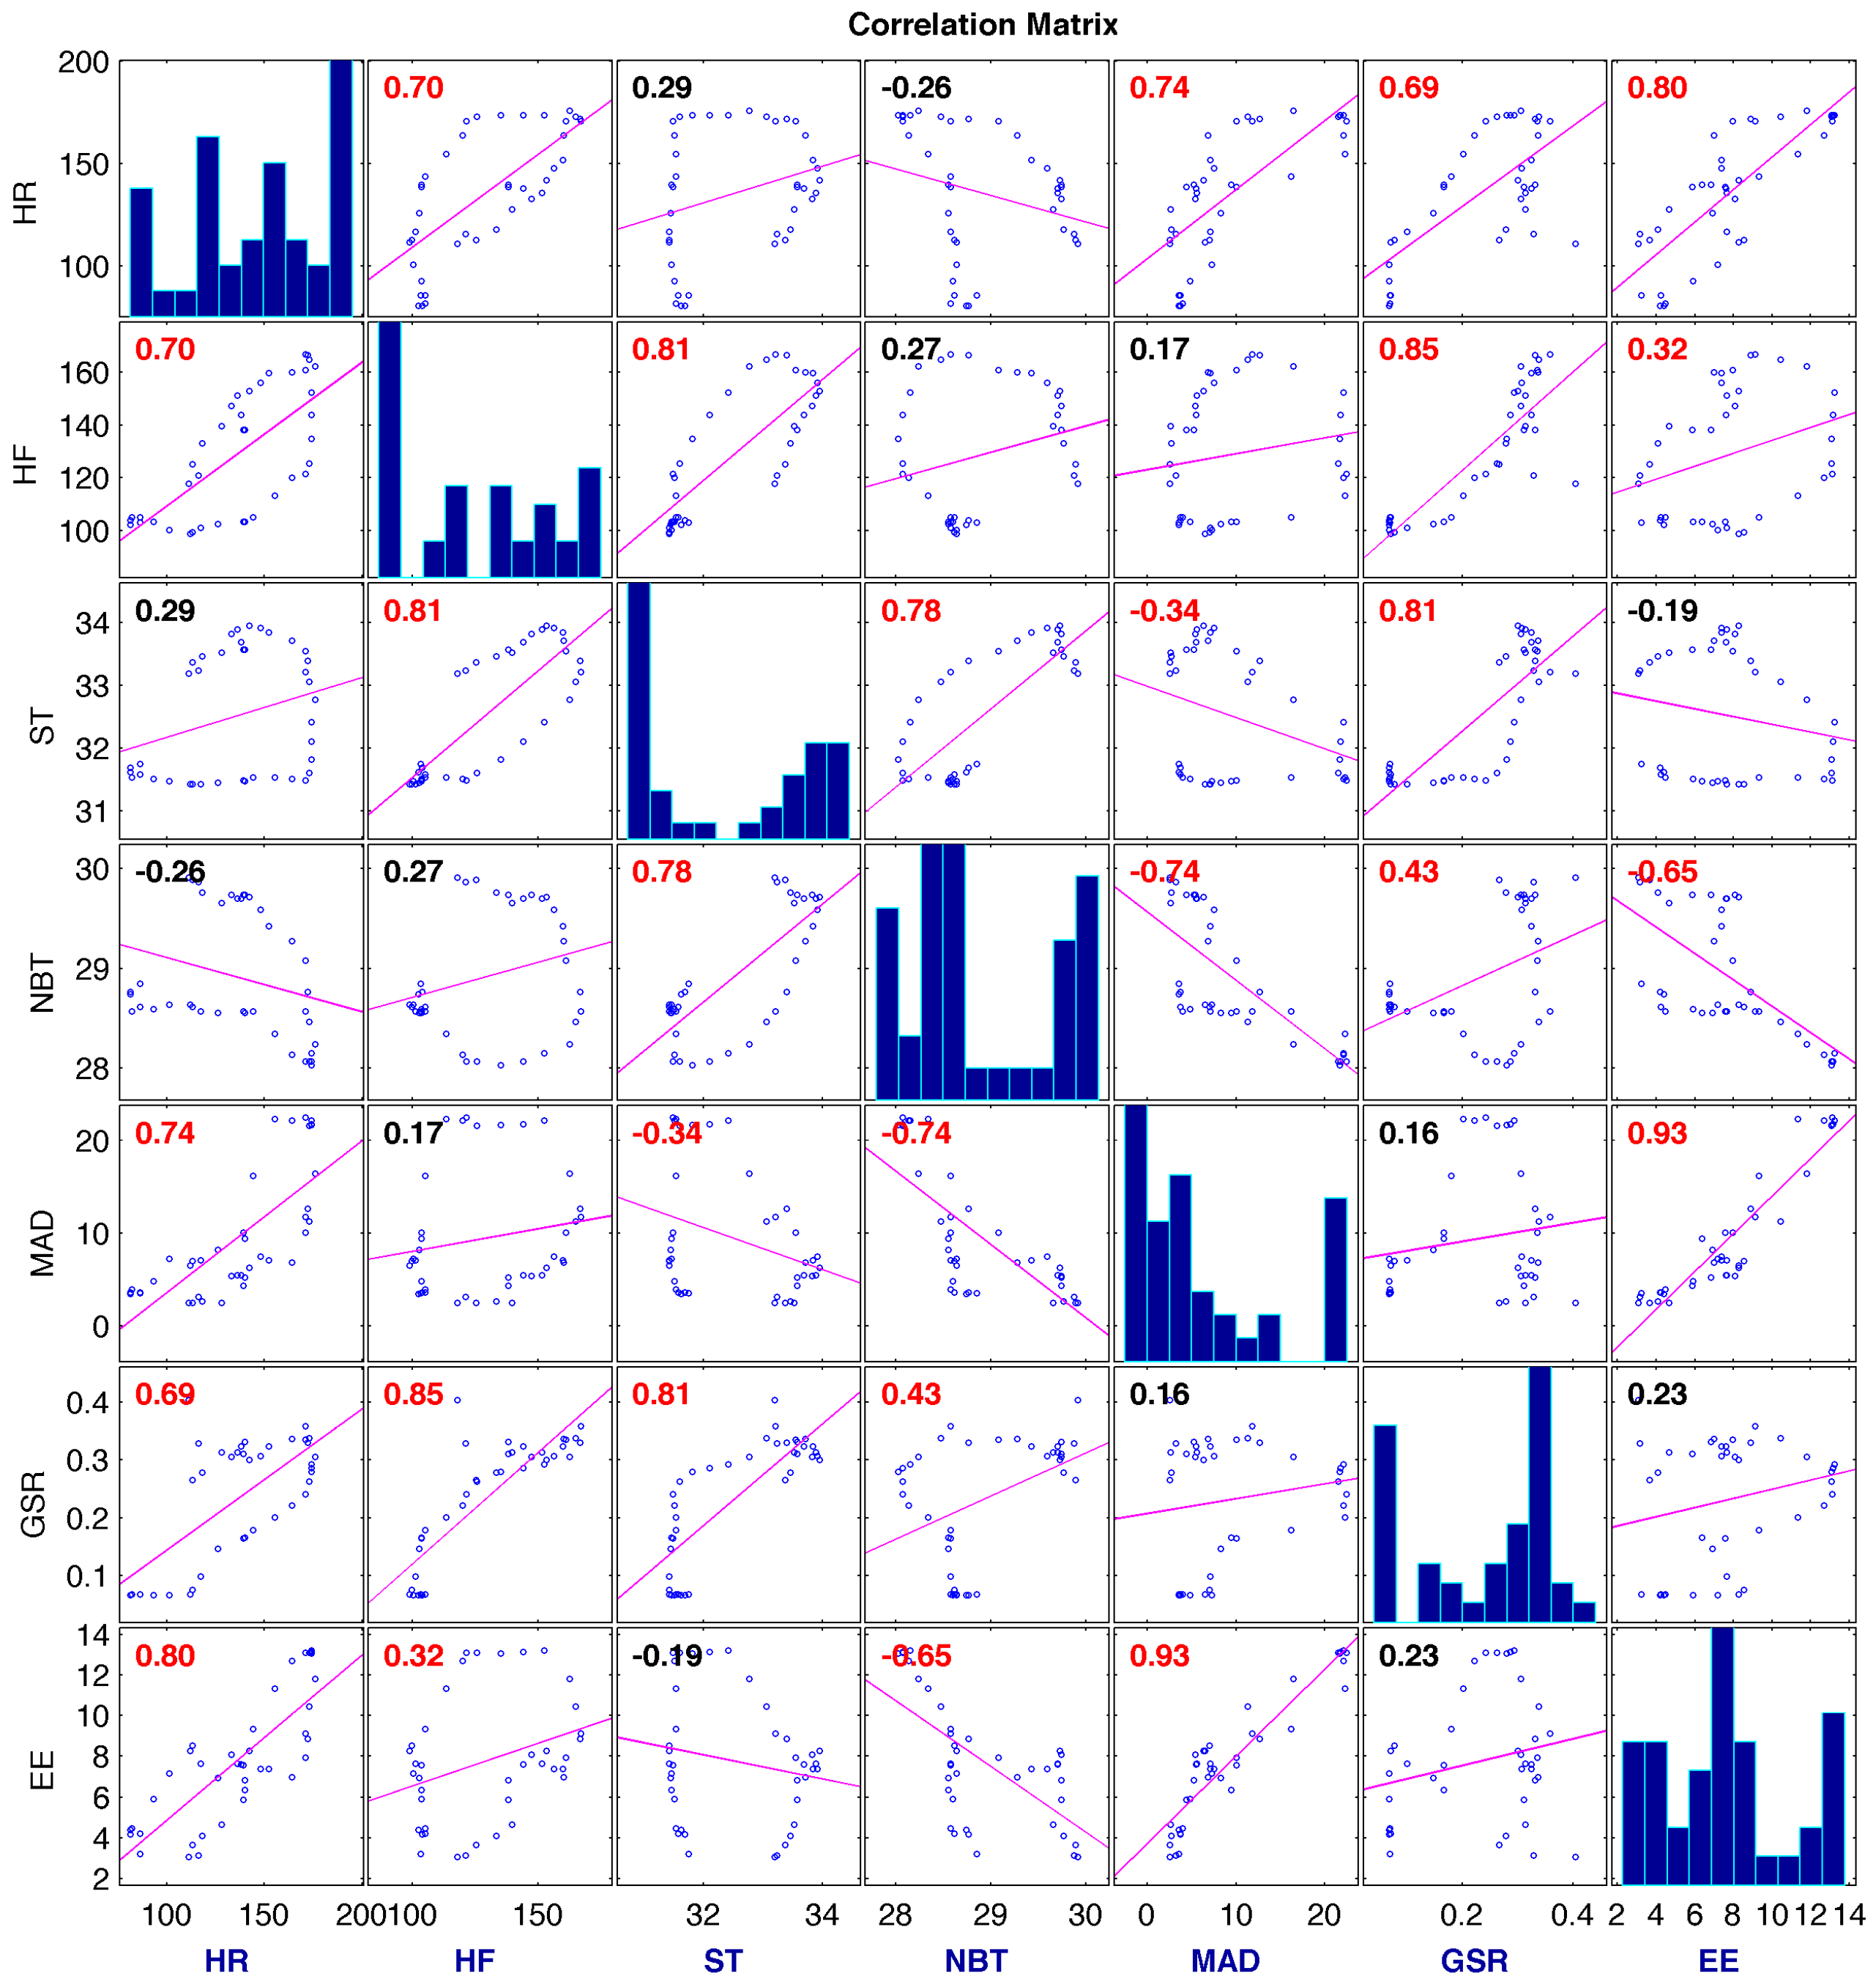
| Type of Exercise | HR | HF | ST | NBT | MAD | GSR | EE |
|---|---|---|---|---|---|---|---|
| TE | 3948 (3470–4757) | 5227 (3684–6092) | 1121 (975–1462) | 1087 (929–1315) | 261 (212–340) | 8 (5–12) | 257 (212–486) |
| TE-I | 3641 (2768–4813) | 4652 (3559–6003) | 1093 (932–1543) | 1008 (915–1351) | 259 (160–379) | 5 (3–9) | 246 (174–361) |
| EST | 2344 (2169–2611) | 4285 (3942–5787) | 1359 (1144–1537) | 1348 (1040–1498) | 111 (84–123) | 8 (5–11) | 154 (129–260) |
| SRT | 4186 (3008–4741) | 7639 (5108–7864) | 1628 (1449–1824) | 1475 (1253–1610) | 123 (100–158) | 11 (7–23) | 182 (131–282) |
| MRT | 13633 (9236–14138) | 19621 (16495–22686) | 4726 (3851–5371) | 4233 (3213–4810) | 273 (230–368) | 34 (20–79) | 482 (327–708) |
| BE | 4443 (3715–5050) | 5067 (4044–6392) | 1427 (1056–1581) | 1313 (1011–1454) | 94 (75–109) | 7 (5–13) | 271 (203–331) |
| WV | 3666 (2617–4381) | 5671 (3857–6654) | 1289 (1116–1375) | 1195 (1091–1308) | 112 (92–193) | 5 (4–9) | 356 (297–613) |
© 2017 by the authors. Licensee MDPI, Basel, Switzerland. This article is an open access article distributed under the terms and conditions of the Creative Commons Attribution (CC BY) license ( http://creativecommons.org/licenses/by/4.0/).
Share and Cite
Turksoy, K.; Monforti, C.; Park, M.; Griffith, G.; Quinn, L.; Cinar, A. Use of Wearable Sensors and Biometric Variables in an Artificial Pancreas System. Sensors 2017, 17, 532. https://doi.org/10.3390/s17030532
Turksoy K, Monforti C, Park M, Griffith G, Quinn L, Cinar A. Use of Wearable Sensors and Biometric Variables in an Artificial Pancreas System. Sensors. 2017; 17(3):532. https://doi.org/10.3390/s17030532
Chicago/Turabian StyleTurksoy, Kamuran, Colleen Monforti, Minsun Park, Garett Griffith, Laurie Quinn, and Ali Cinar. 2017. "Use of Wearable Sensors and Biometric Variables in an Artificial Pancreas System" Sensors 17, no. 3: 532. https://doi.org/10.3390/s17030532