
A Wellness Mobile Application for Smart Health: Pilot Study Design and Results


Abstract
:1. Introduction
2. Literature Review
- the lack of rigorous evidence-based research trials whose results are peer reviewed by independent experts to determine whether the app is safe and effective;
- the lack of long-term and large sample size trials with heterogeneous participants in terms of age, gender, socio-economic status, personally type, and smartphone and social networking experience to assess the safety and efficacy of the app;
- the lack of emphasis on evidence-based and medical professional involvement;
- the requirement that a smartphone is always available during the performance of the activity;
- the lack of evidence-based strategies or established behavior change theories as the basis of the app development;
- the use of smartphone sensors instead of stand-alone sensor devices which have been demonstrated to be more accurate [20];
- the lack of any interoperability with other health and fitness apps and devices;
- the lack of any behavior change techniques integrated into the app (e.g., YouTube videos or Tweets);
- the lack of a user-friendly layout for an easy adoption and use of such technology.
- (i)
- Providing information about the behavior-health link: the app contains a section with information and literature references relating to the correct habits useful for a healthy lifestyle for the prevention of chronic diseases.
- (ii)
- Prompting intention formation: the Wellness App suggests and encourages the user to take actions to support a resolution aimed at changing behavior, such as taking more exercise in the following week.
- (iii)
- Setting graded tasks: the app, by using the reasoning module, plans what the user should do by defining specific behavior changes scheduled with the timing and different effort levels required.
- (iv)
- Providing instruction: telling the user how to perform an activity and/or preparatory activity.
- (v)
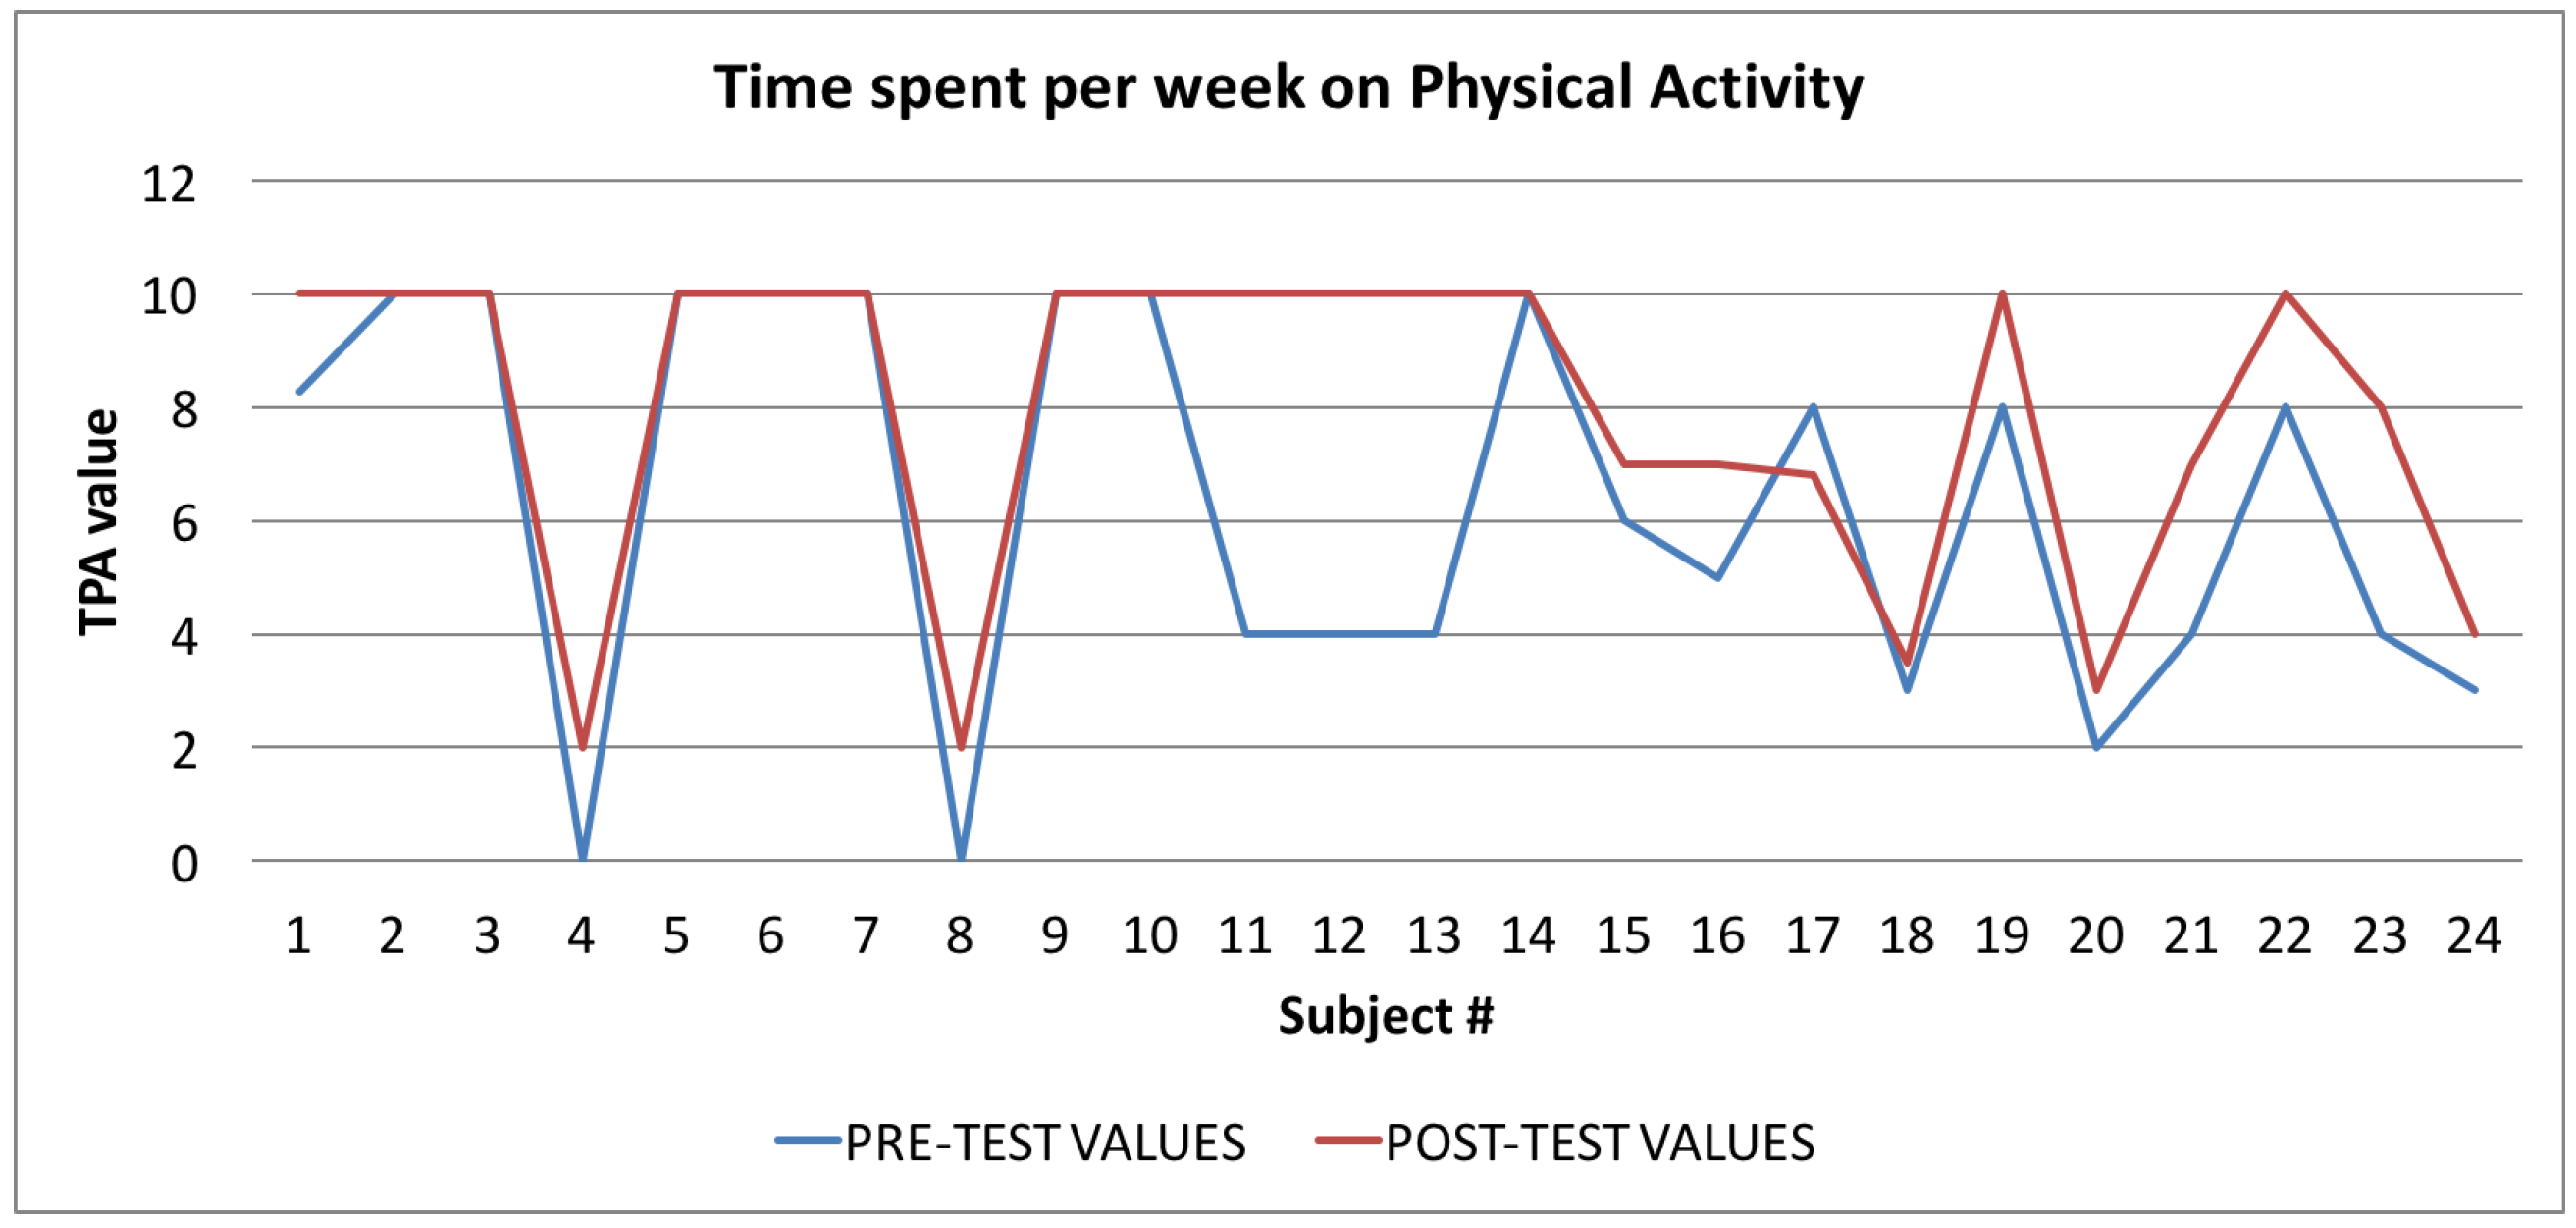
- Prompting specific goal setting: this is directed towards encouraging the user to decide to change a behavior or maintain a behavioral change. This is provided by means of a reasoning module that analyzes the wellness performance indicators and decides which kind of suggestions are necessary to direct the user towards the adoption of correct behaviors. For example, the app could suggest an increase in the time devoted to physical activity if the Time spent per Week on Physical Activity Index is too low in comparison with WHO guidelines.
- (vi)
- Prompting the self-monitoring of behavior: the user is asked to keep a record of specified behavior/s as a method for changing behavior. This facility is guaranteed by providing the app with mechanisms to monitor performance and store all monitored information.
- (vii)
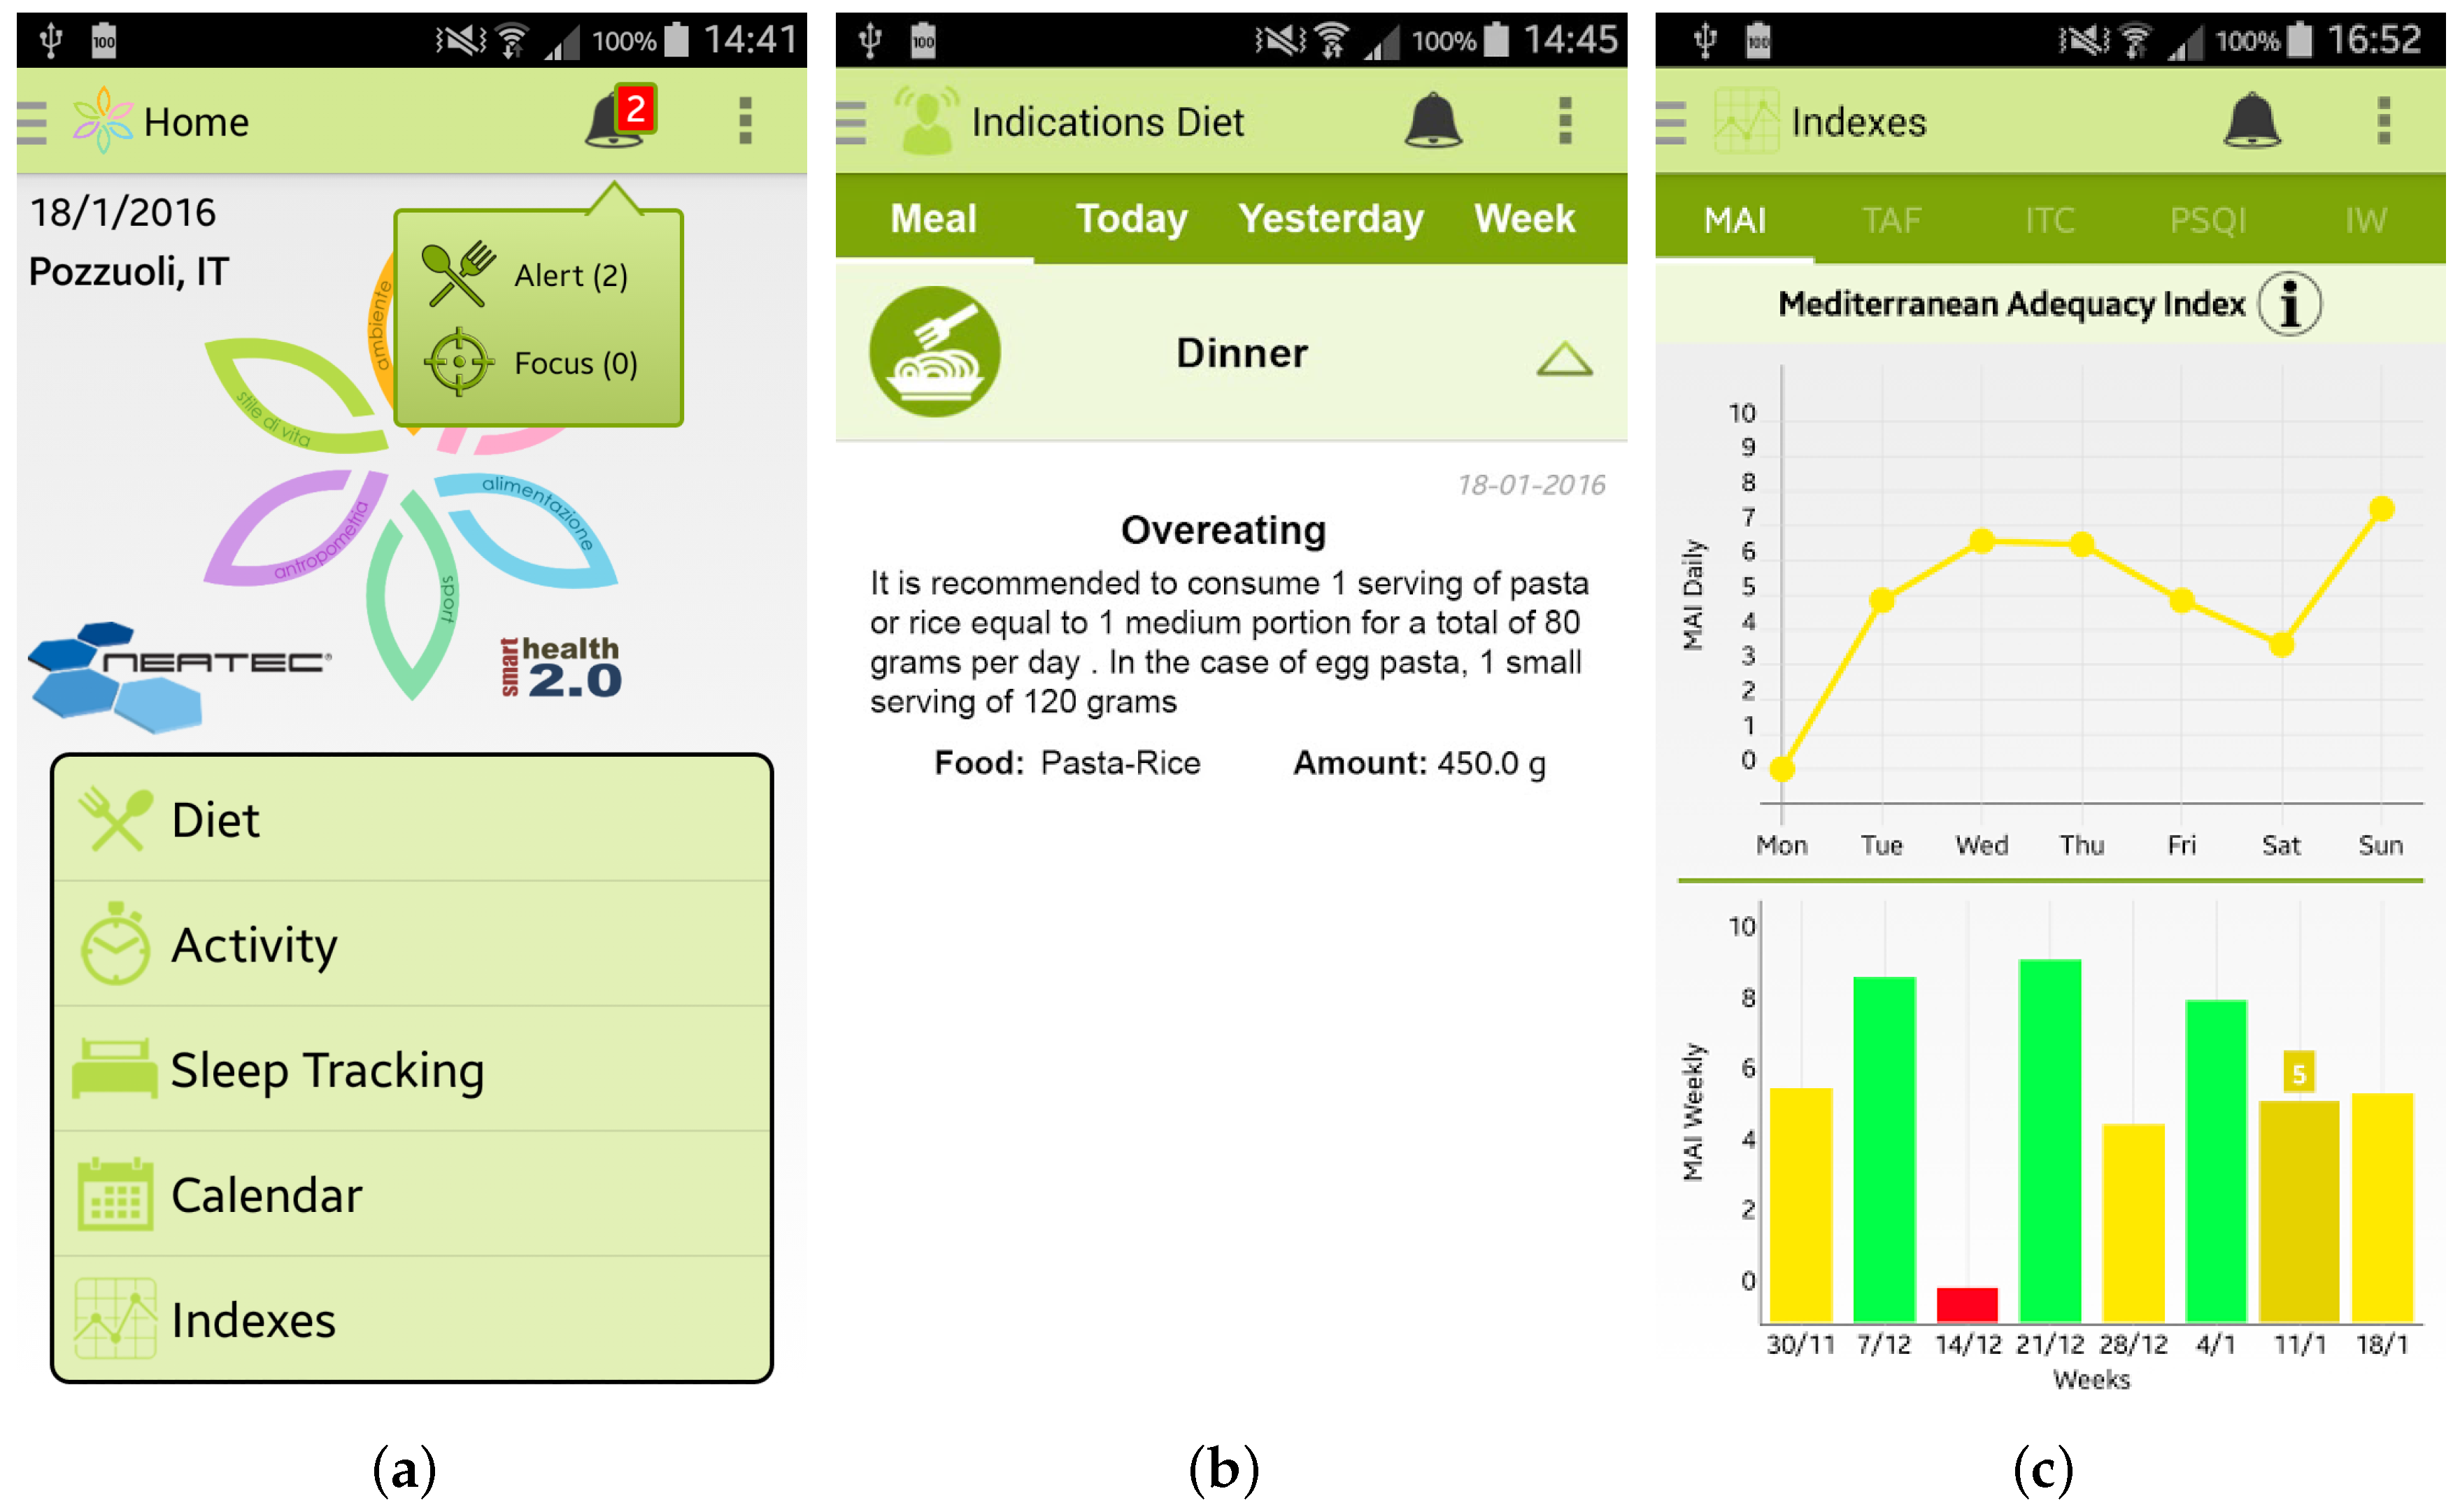
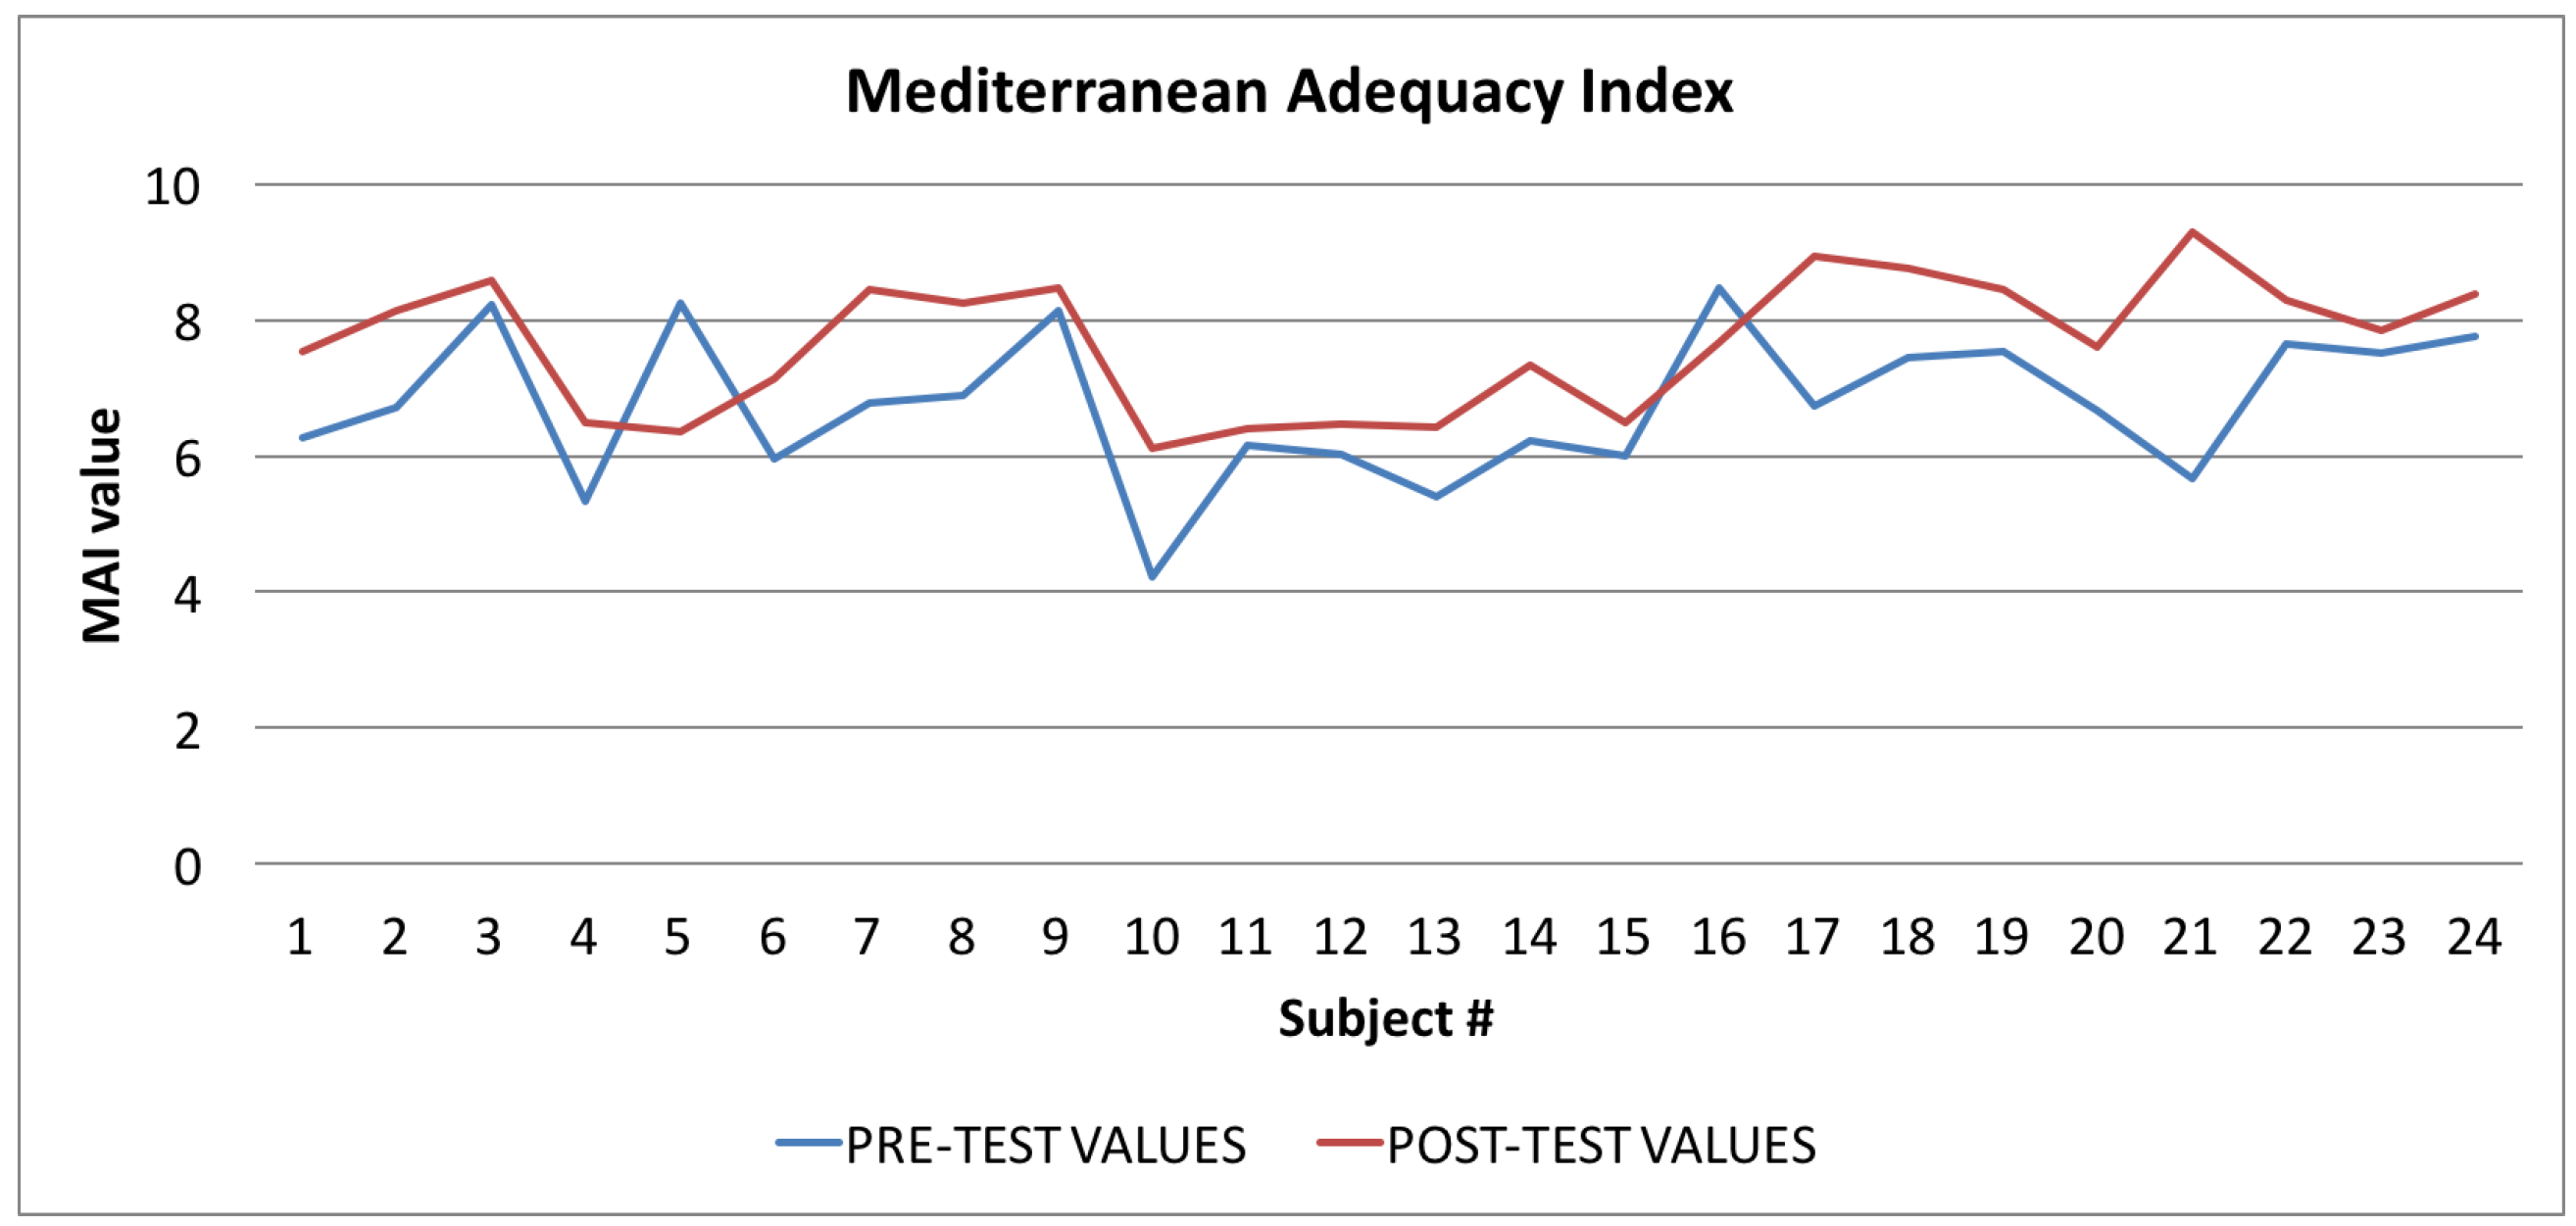
- Providing feedback on performance: the app calculates different performance indicators relating to the monitored user’s wellness and lifestyle data. For example, the proposed Wellness App is able to calculate the Mediterranean Adequacy Index that indicates how close the user’s diet is to the Mediterranean diet that is considered ideal by many researchers and doctors.
- (viii)
- Providing contingent rewards: this involves using praise or rewards for attempts at achieving a behavioral goal. Every time the app detects a good performance index value, it sends a congratulation message to the user in order to reward the performance of a correct behavior. In this way, the app provides a motivational support for the user, so reducing the dropout rate.
- (ix)
- Time management: the app is provided with a mechanism that reminds the user, at specific times, to perform some form of physical activity.
3. The Wellness App
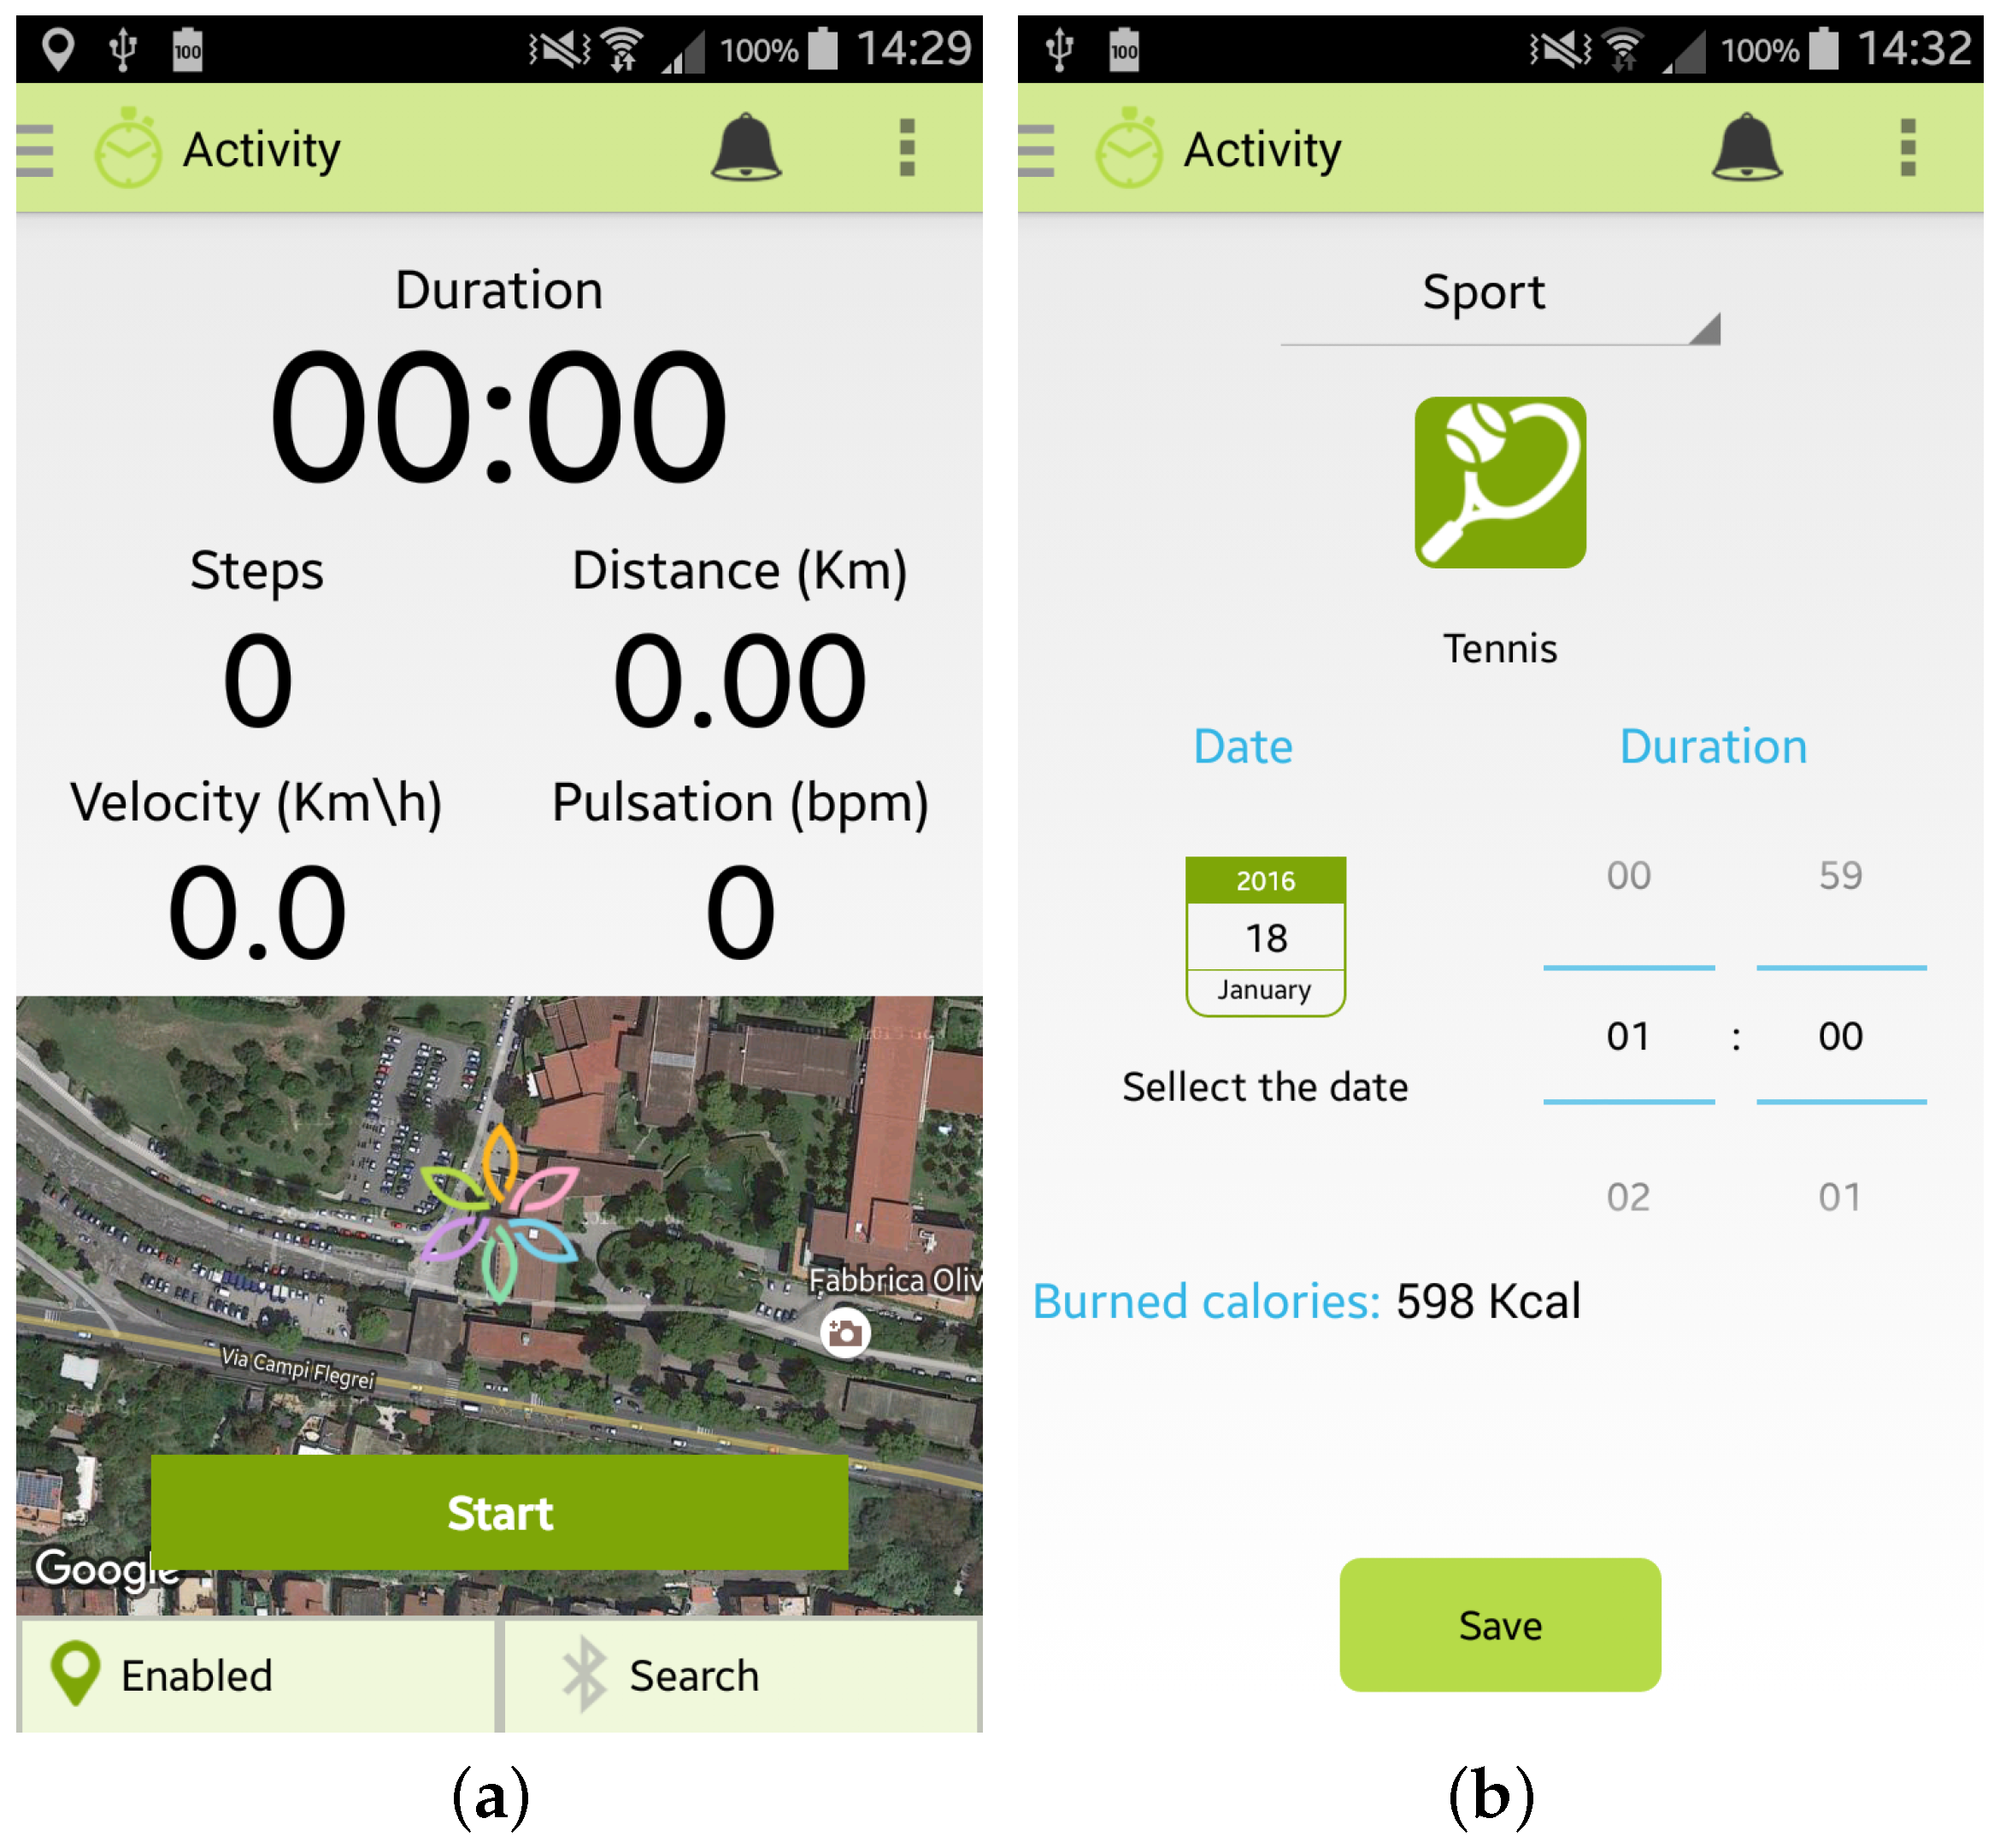
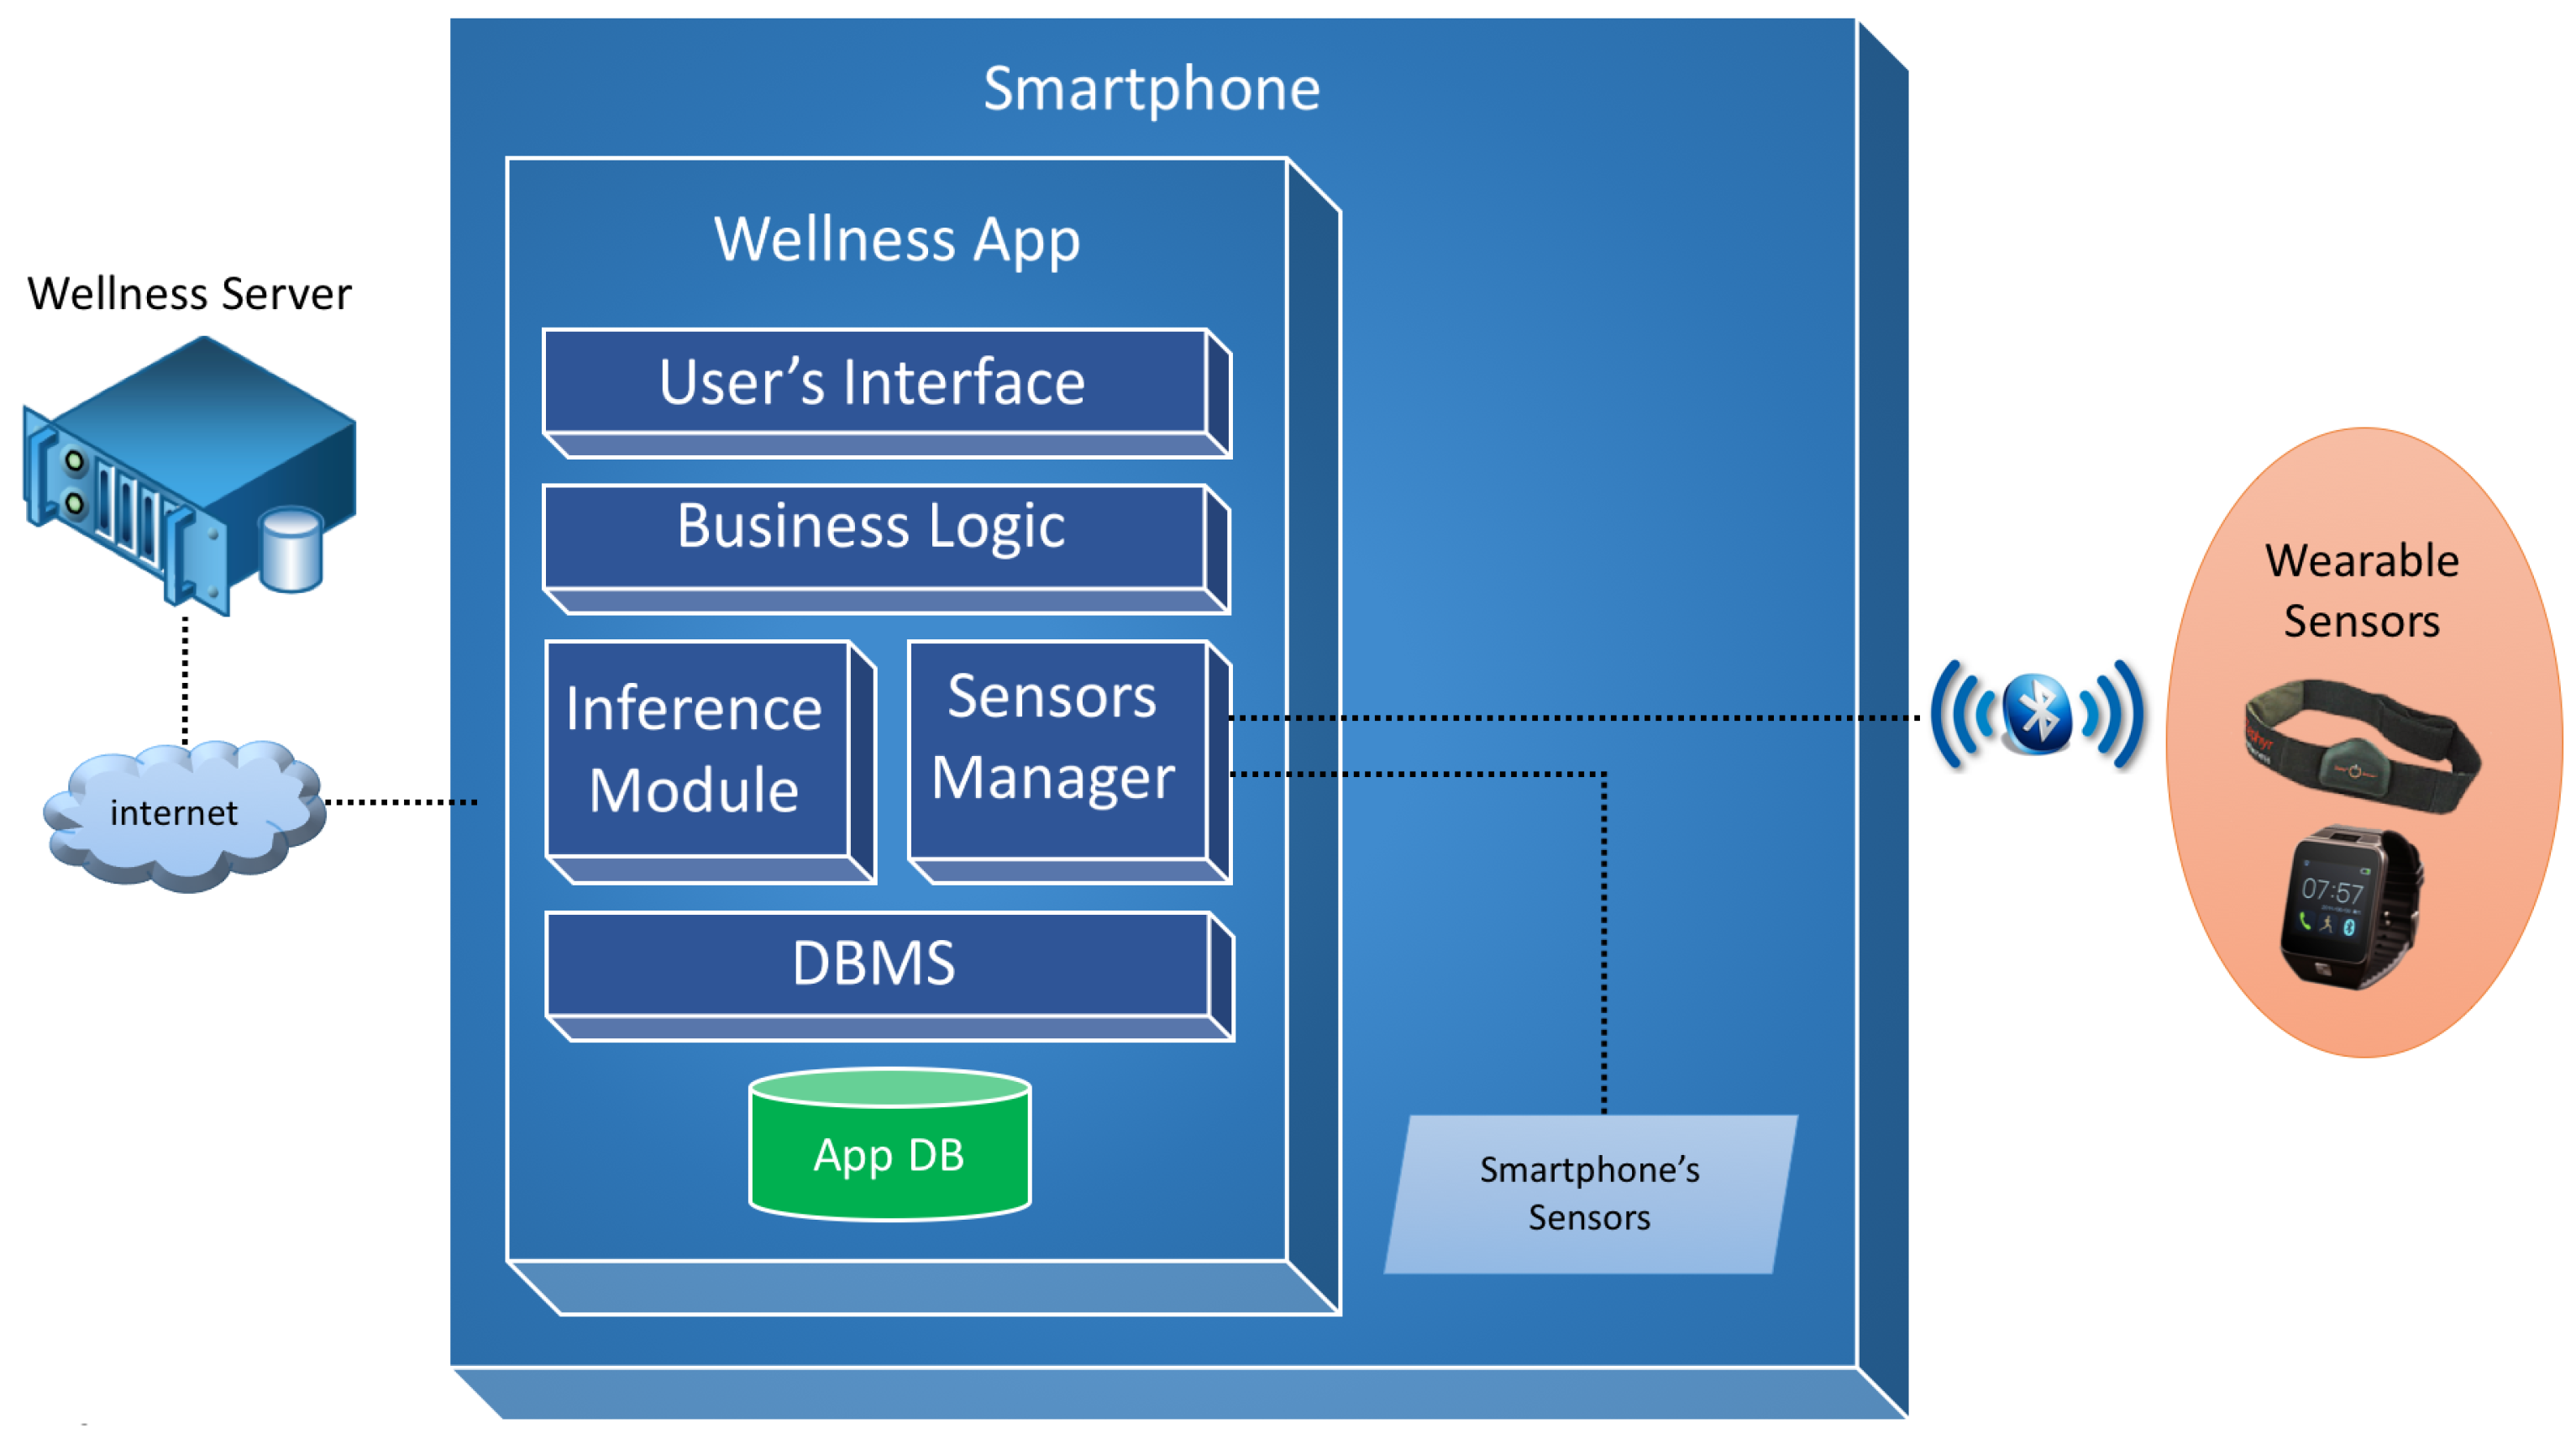
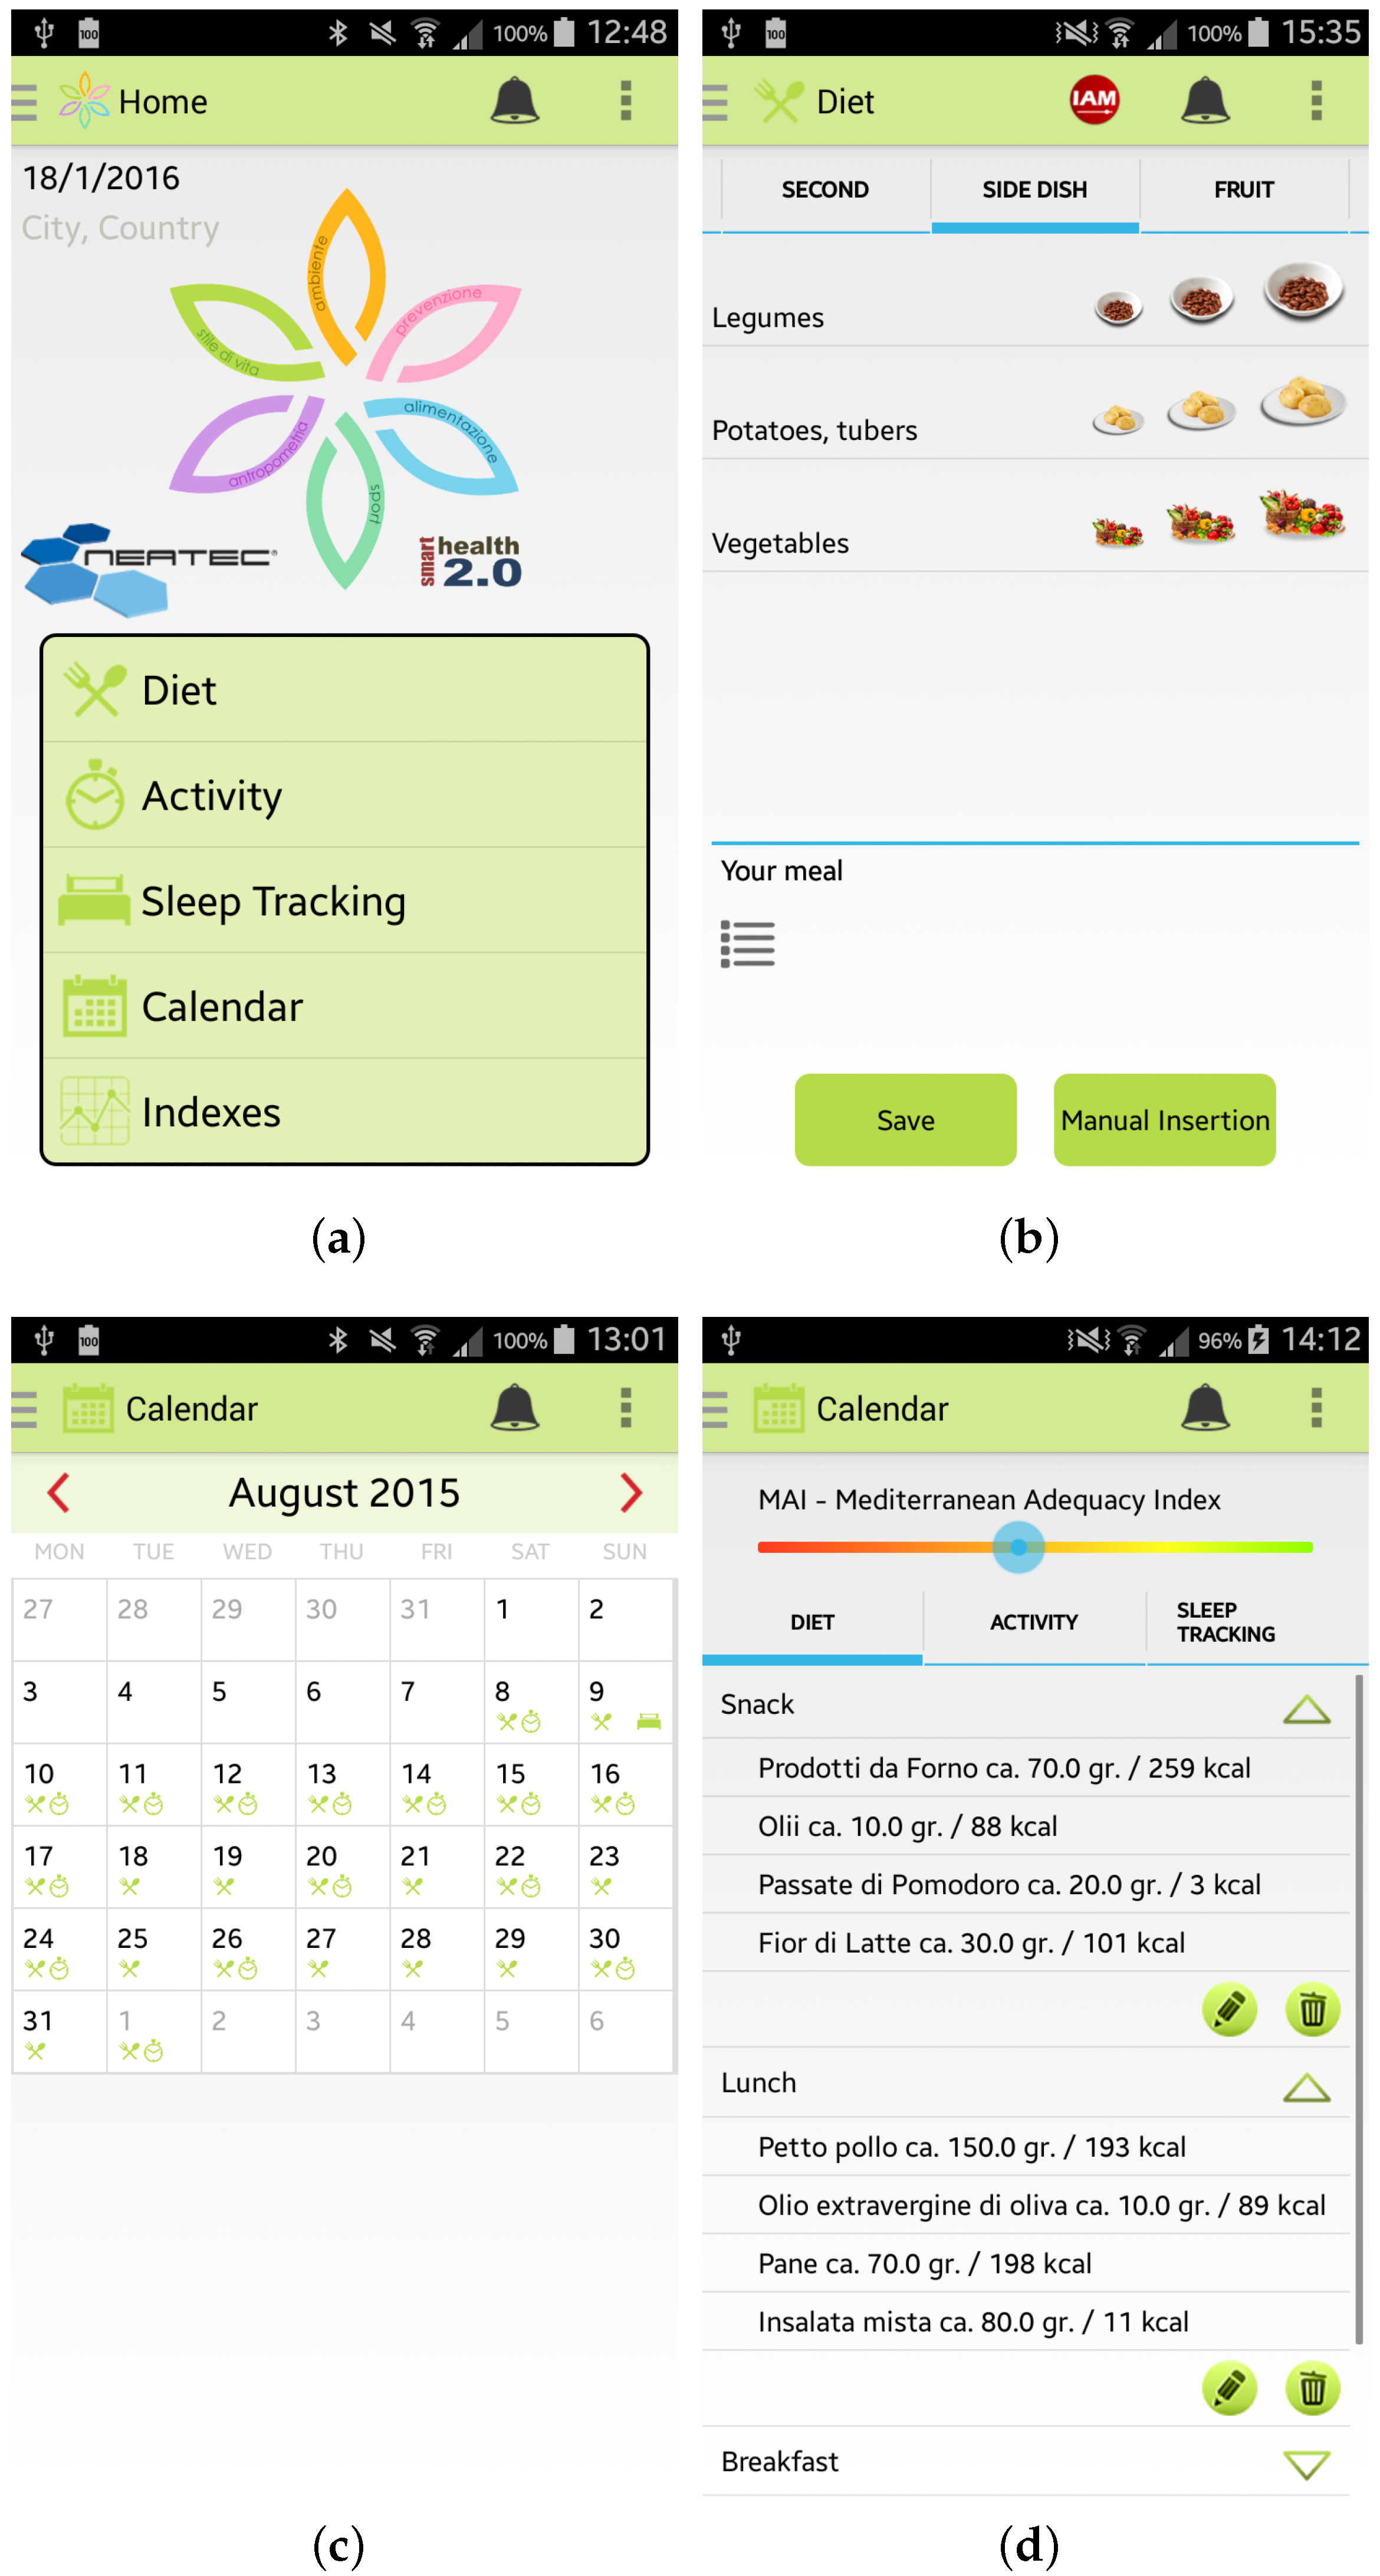
- the “automatic monitoring” of activities that uses the inertial sensors of the smartphone or an external sensor, such as a smart band, connected to the app by a Bluetooth connection. As shown in Figure 4a, the app is able to monitor the number of steps performed, the distance travelled (km), the velocity (Km/h) and the heart rate (bpm) if provided by the sensor. To use this option it is necessary to carry both the smartphone and the sensor during the activity;
- the “manual monitoring” of activities that permits the user to manually select the kind of activity performed, the duration, and the date, as shown in Figure 4b. This option has been devised in order to give the user the possibility of freely performing the activity, without the necessity of carrying her/his smartphone, and then inserting the type and the amount of the activity performed. Some examples of which kinds of activity can be manually inserted in the Wellness App are reported in [10].
4. The Pilot Study Design
- Administrative: where the “Title” and an identification of the study and/or trial, the roles and the responsibilities of the staff involved in the study and details of any financial support are described.
- Introduction: in this section the main objectives of the study, including a set of the relevant and related published studies, the outcomes, both primary and secondary, of the trial process, and the interpretation of the results are described.
- Methods: the protocol also provides the major design elements of the study and/or trial, such as, for example, the phases of the trial and the randomization scheme. Additionally, a description of the study, including the number of the study groups, the size of each study group, if applicable, and the duration and sequence of the trial periods is here detailed.
- Ethics and Dissemination: in this section the ethical approval and any rules and behavioral norms of the participants are specified.
- Appendix: the protocol, if necessary, also provides a section containing documents useful for the trial process, such as the informed consent, the information sheet, and the test for the usability evaluation.
5. Pilot Study Execution
6. Pilot Study Results
- the MAI index, the “Mediterranean Adequacy Index” [32], which measures the type of diet in relation to the Mediterranean diet, considered ideal by many researchers;
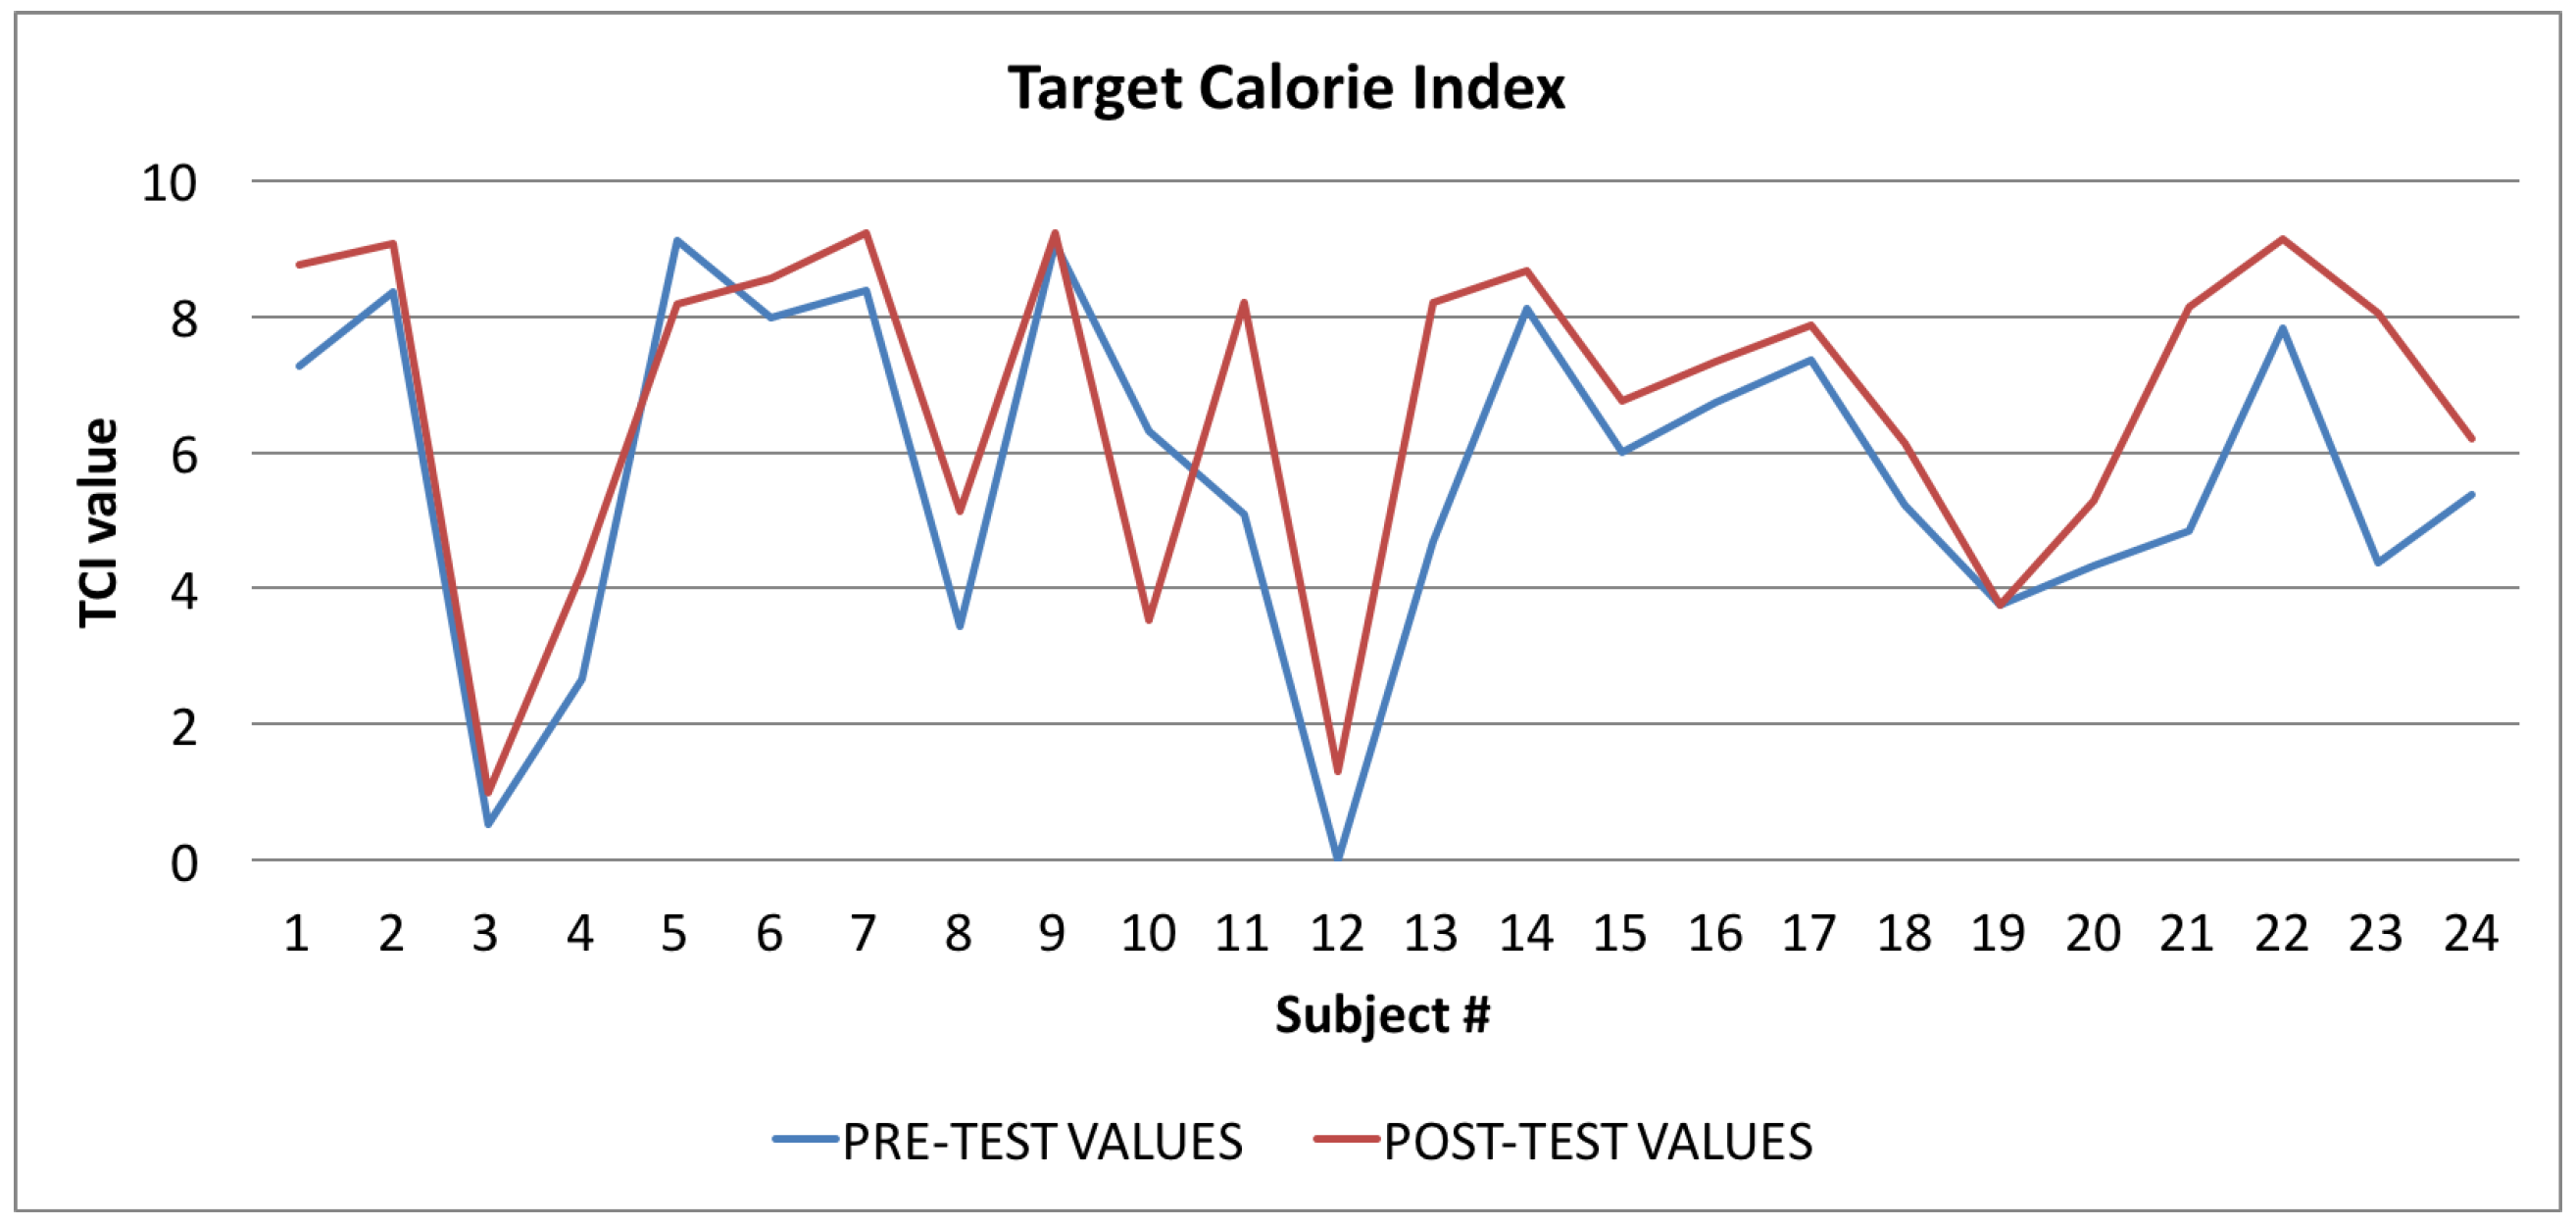
- the TCI index, the “Target Calorie Index” [33], which measures the amount of calories consumed in relation to the optimal value for the individual calculated in accordance with her/his anthropometric data;
- the TPA index, the “Time spent per week on Physical Activity Index” [34], which measures the amount of physical activity in comparison with the WHO guidelines; and
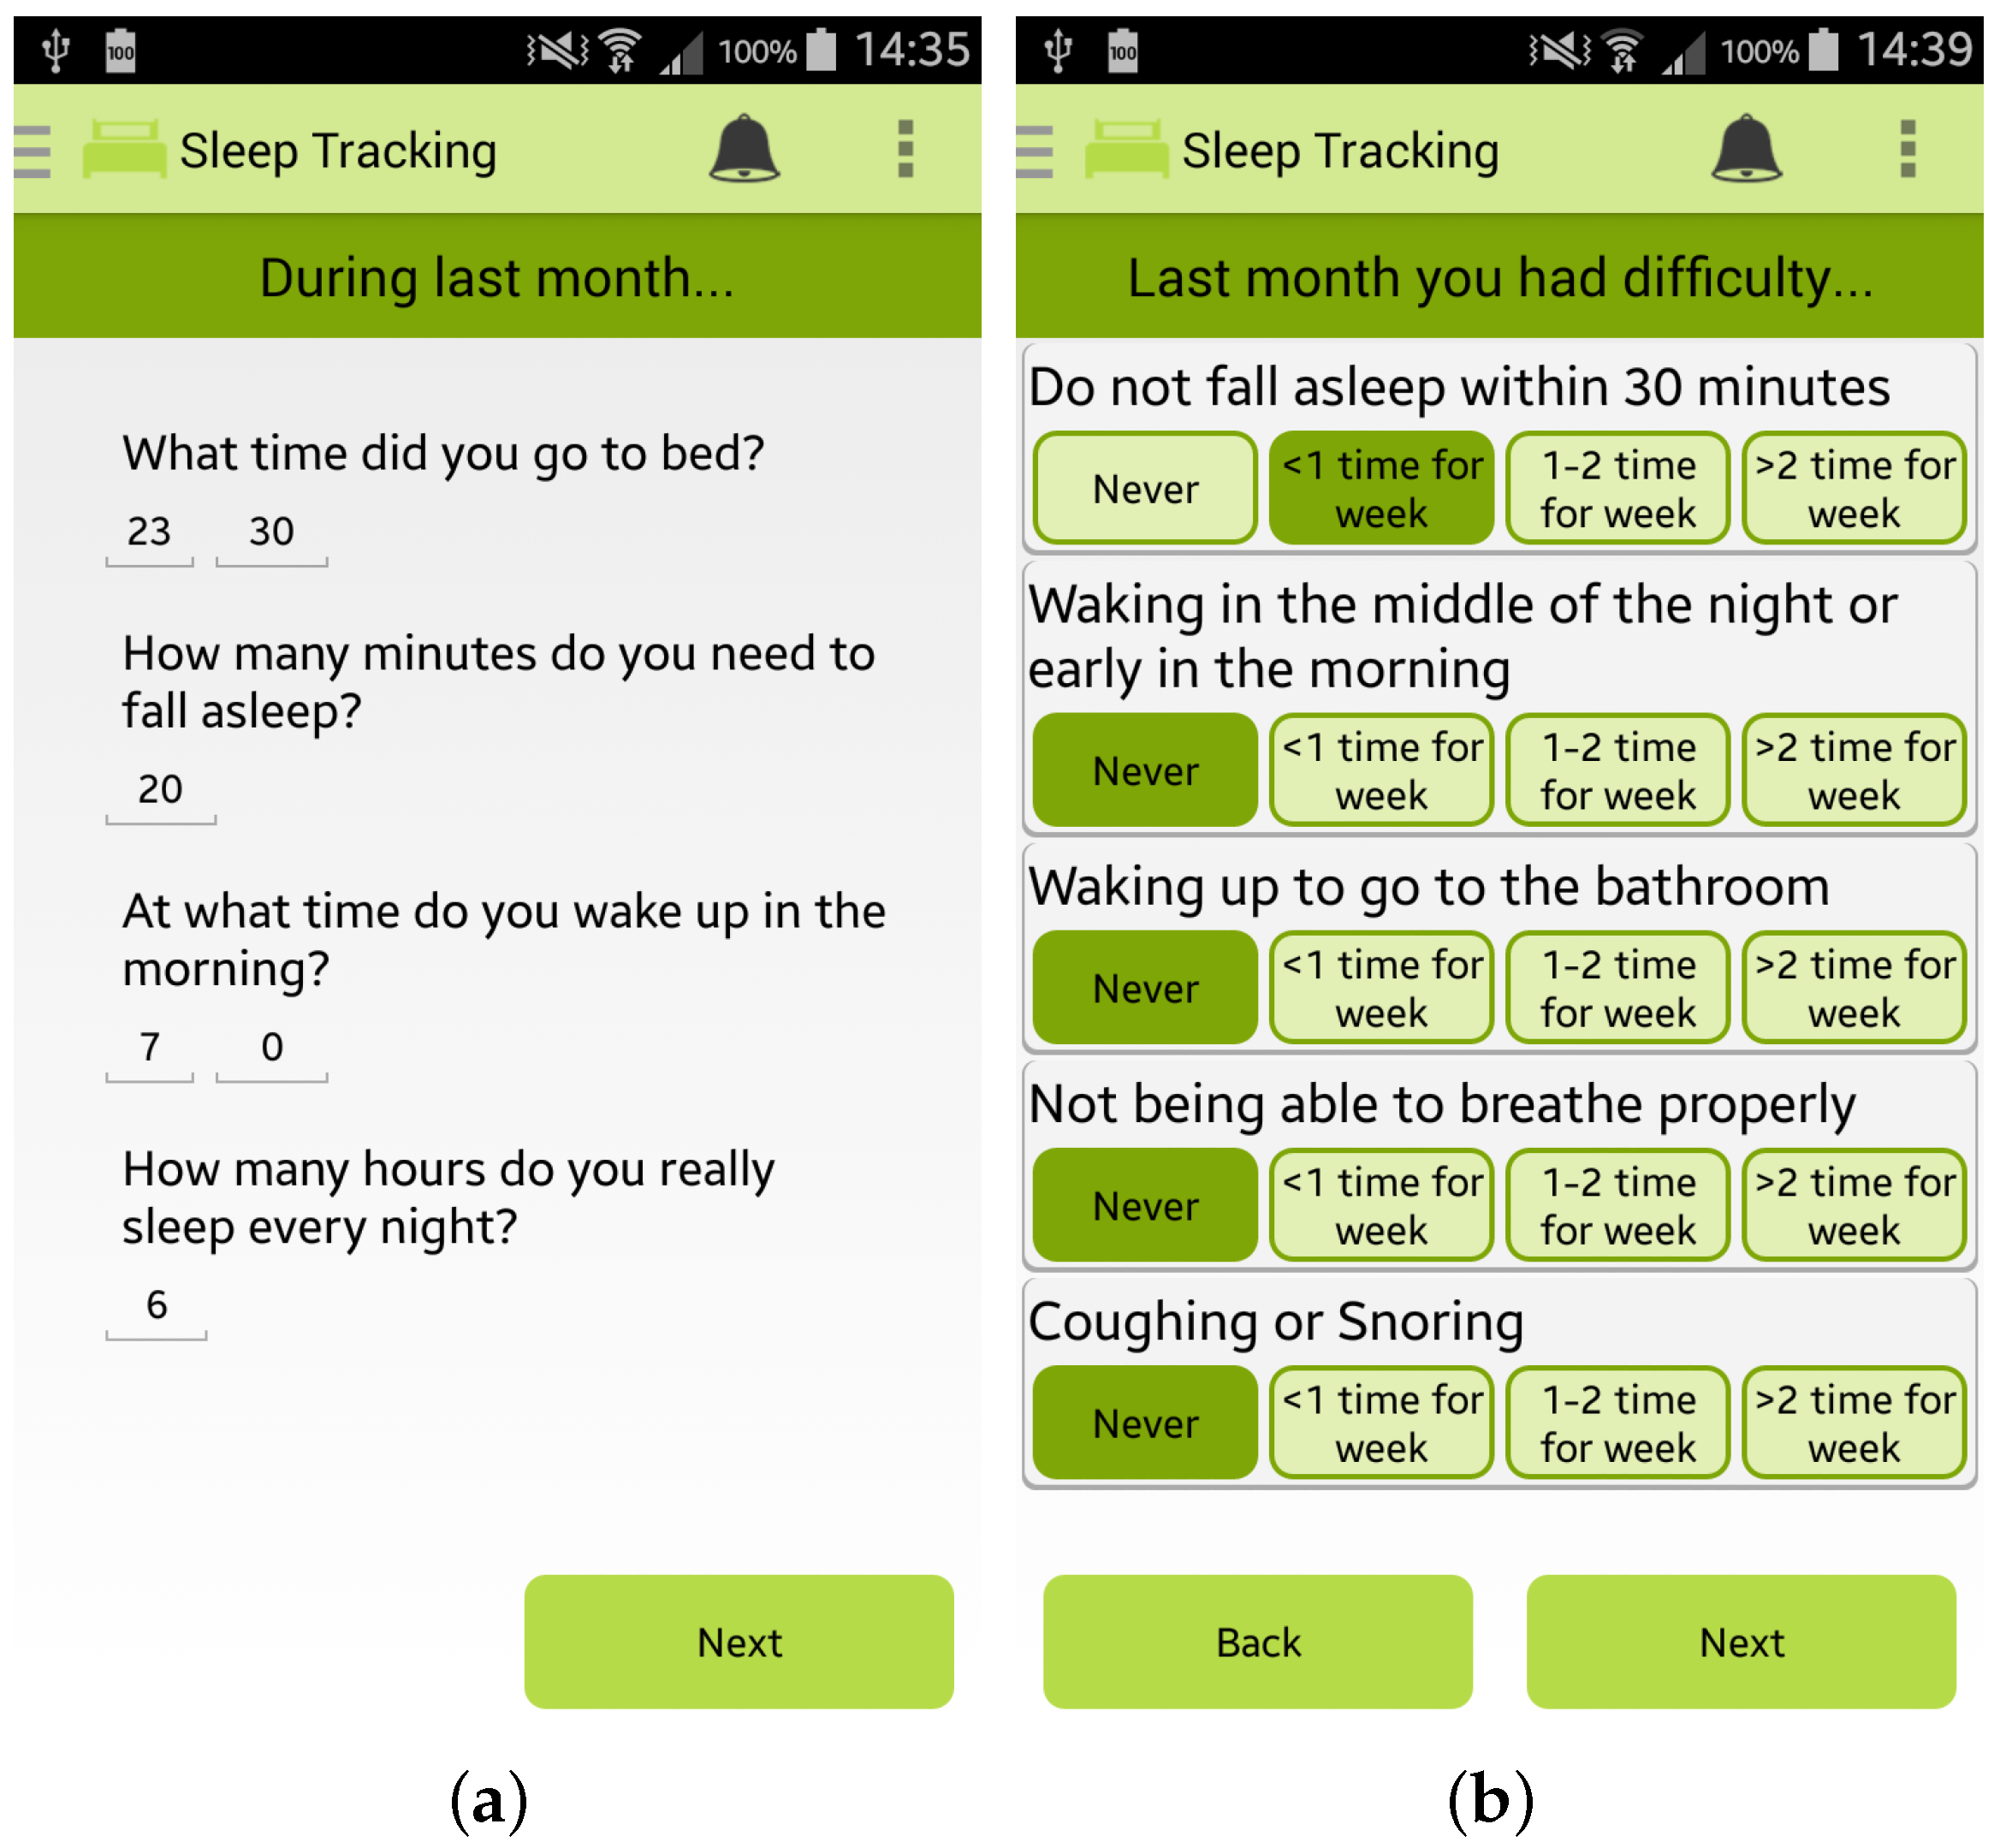
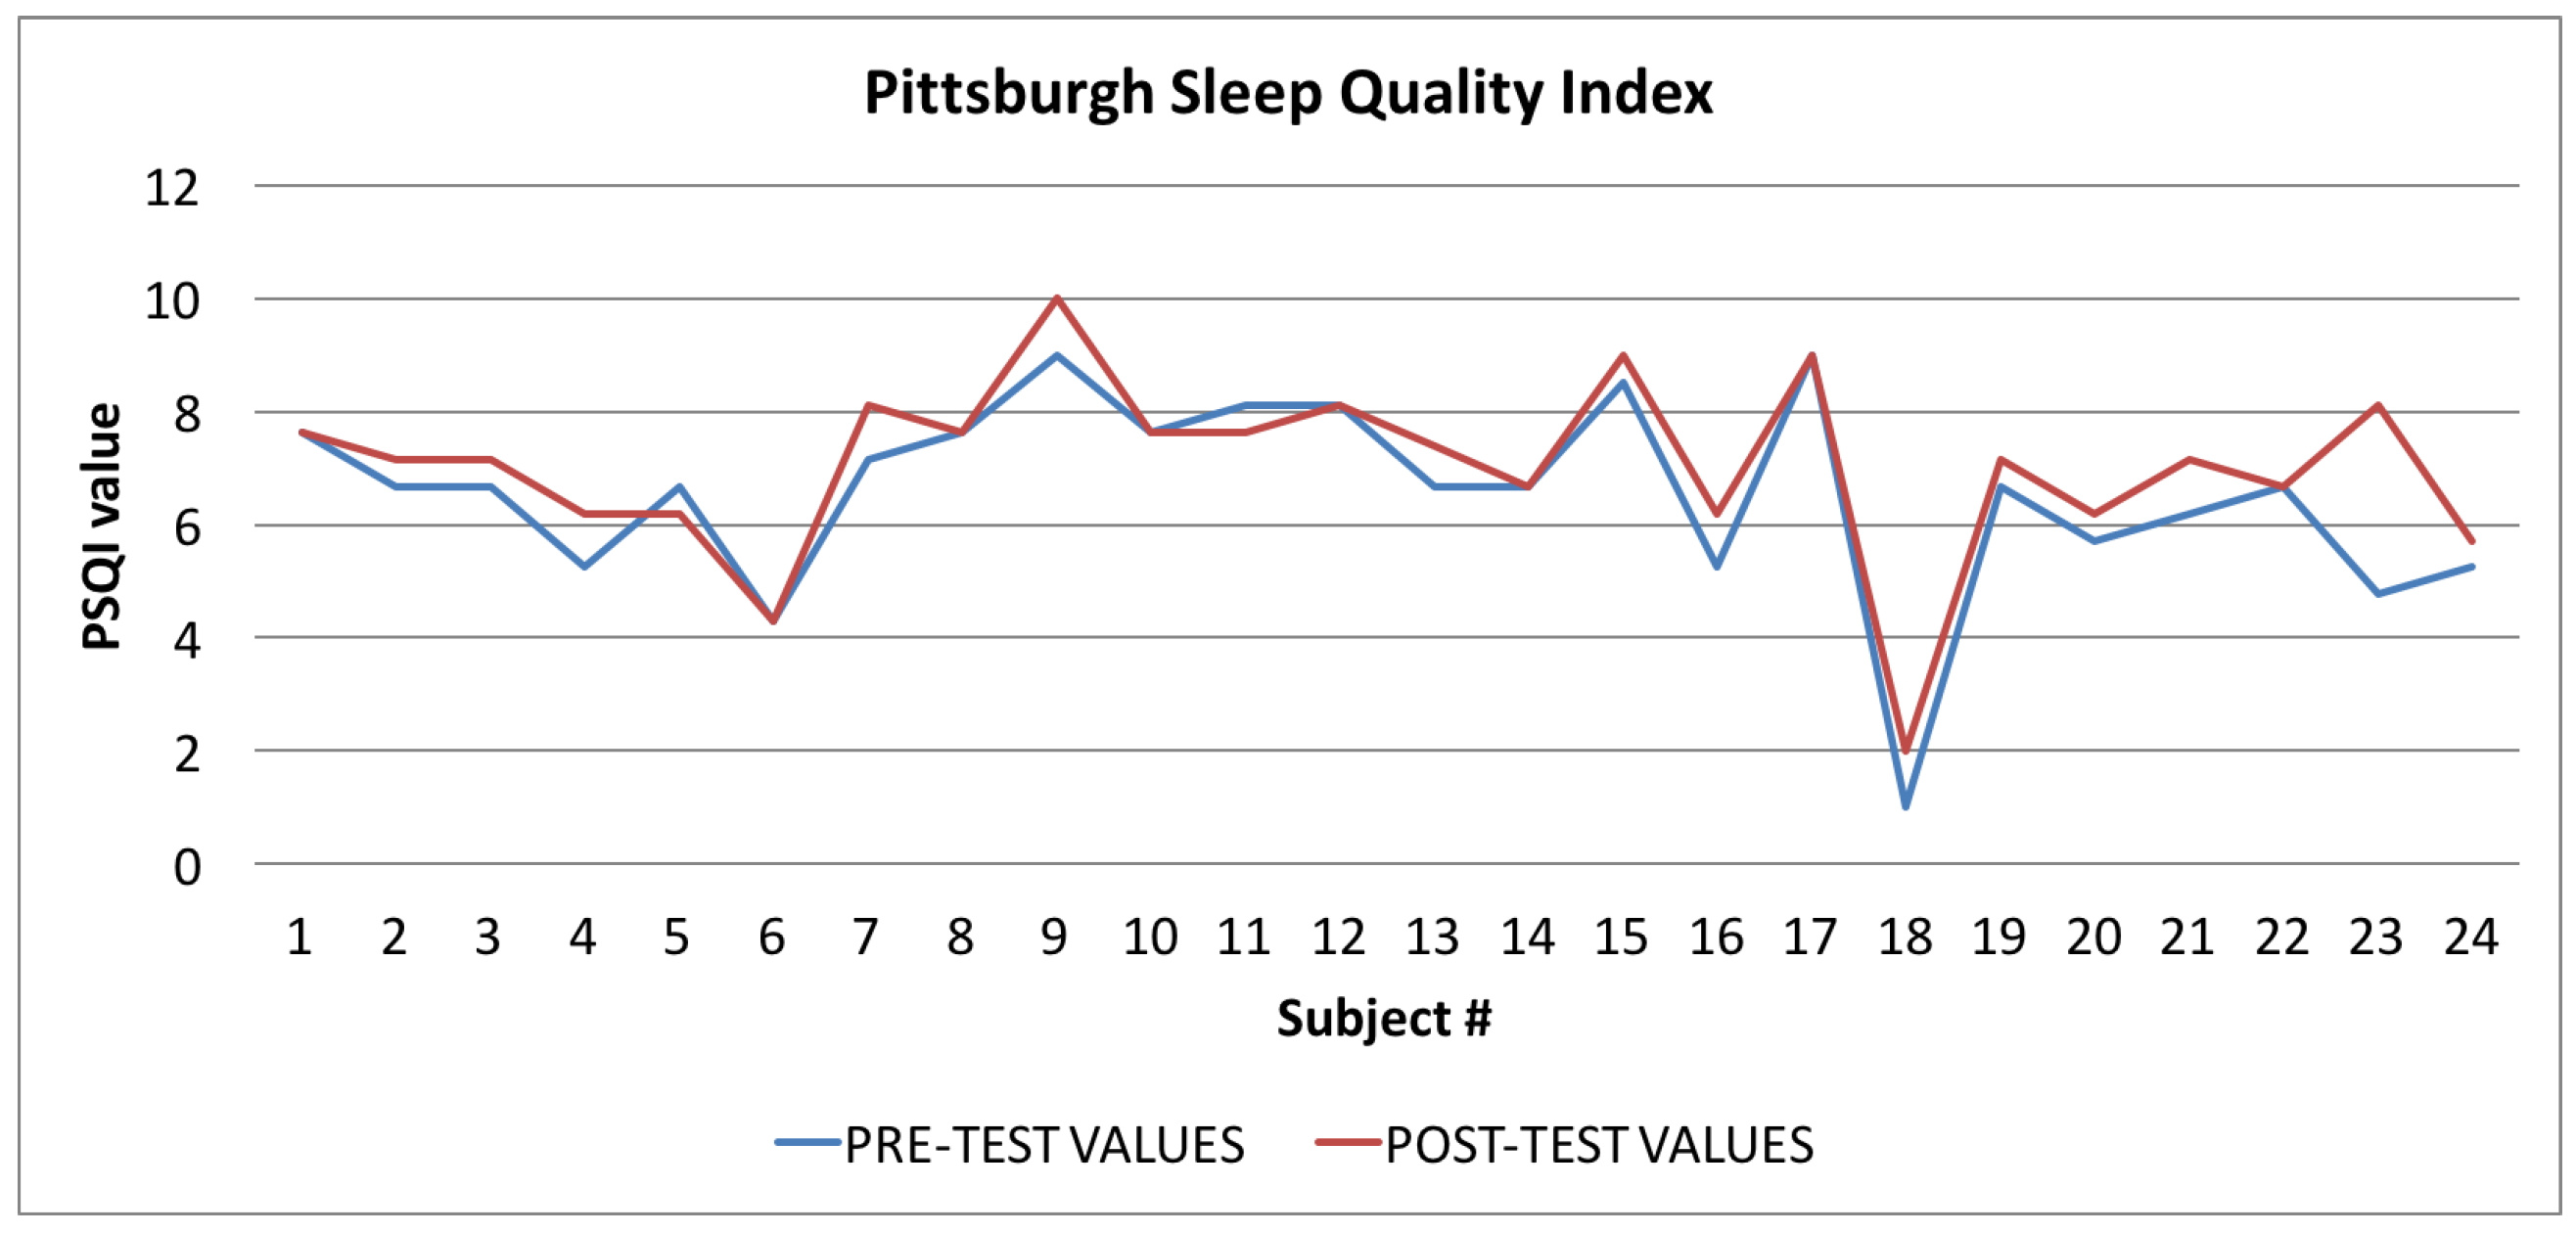
- the PSQI index, the“Pittsburgh Sleep Quality Index” [28], which estimates the quality of sleep.
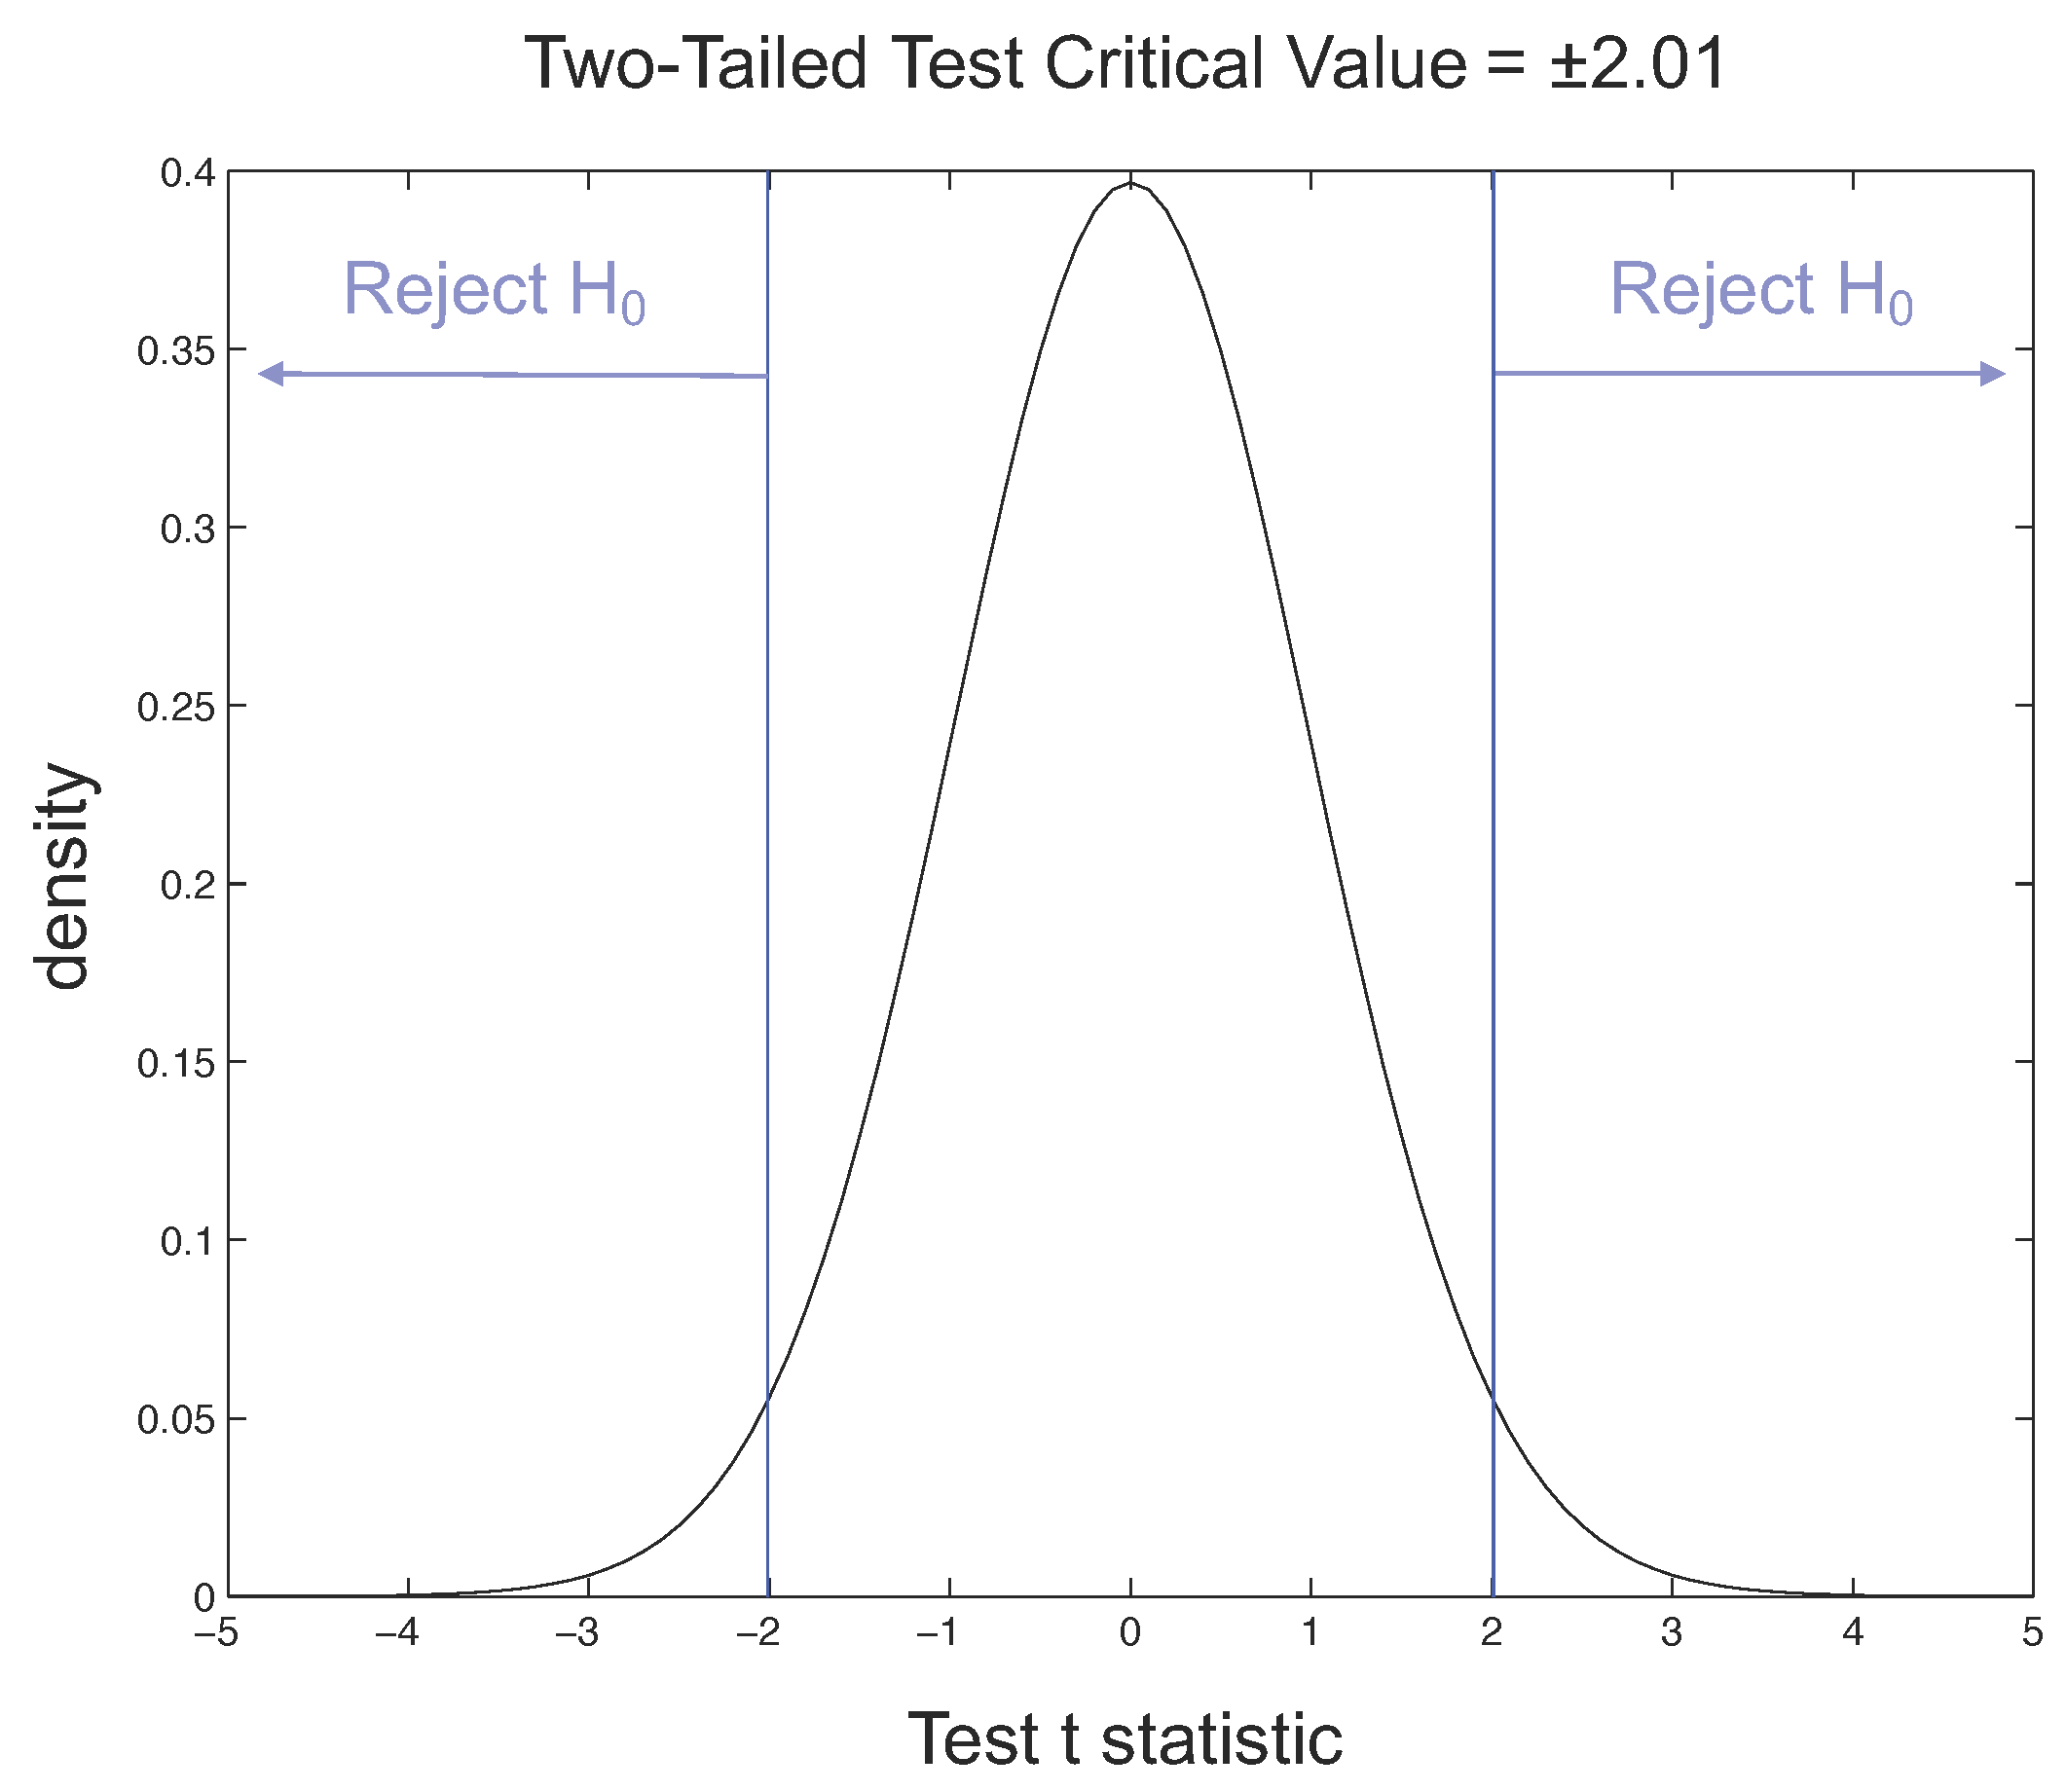
6.1. Index Evaluation: Statistical Analysis
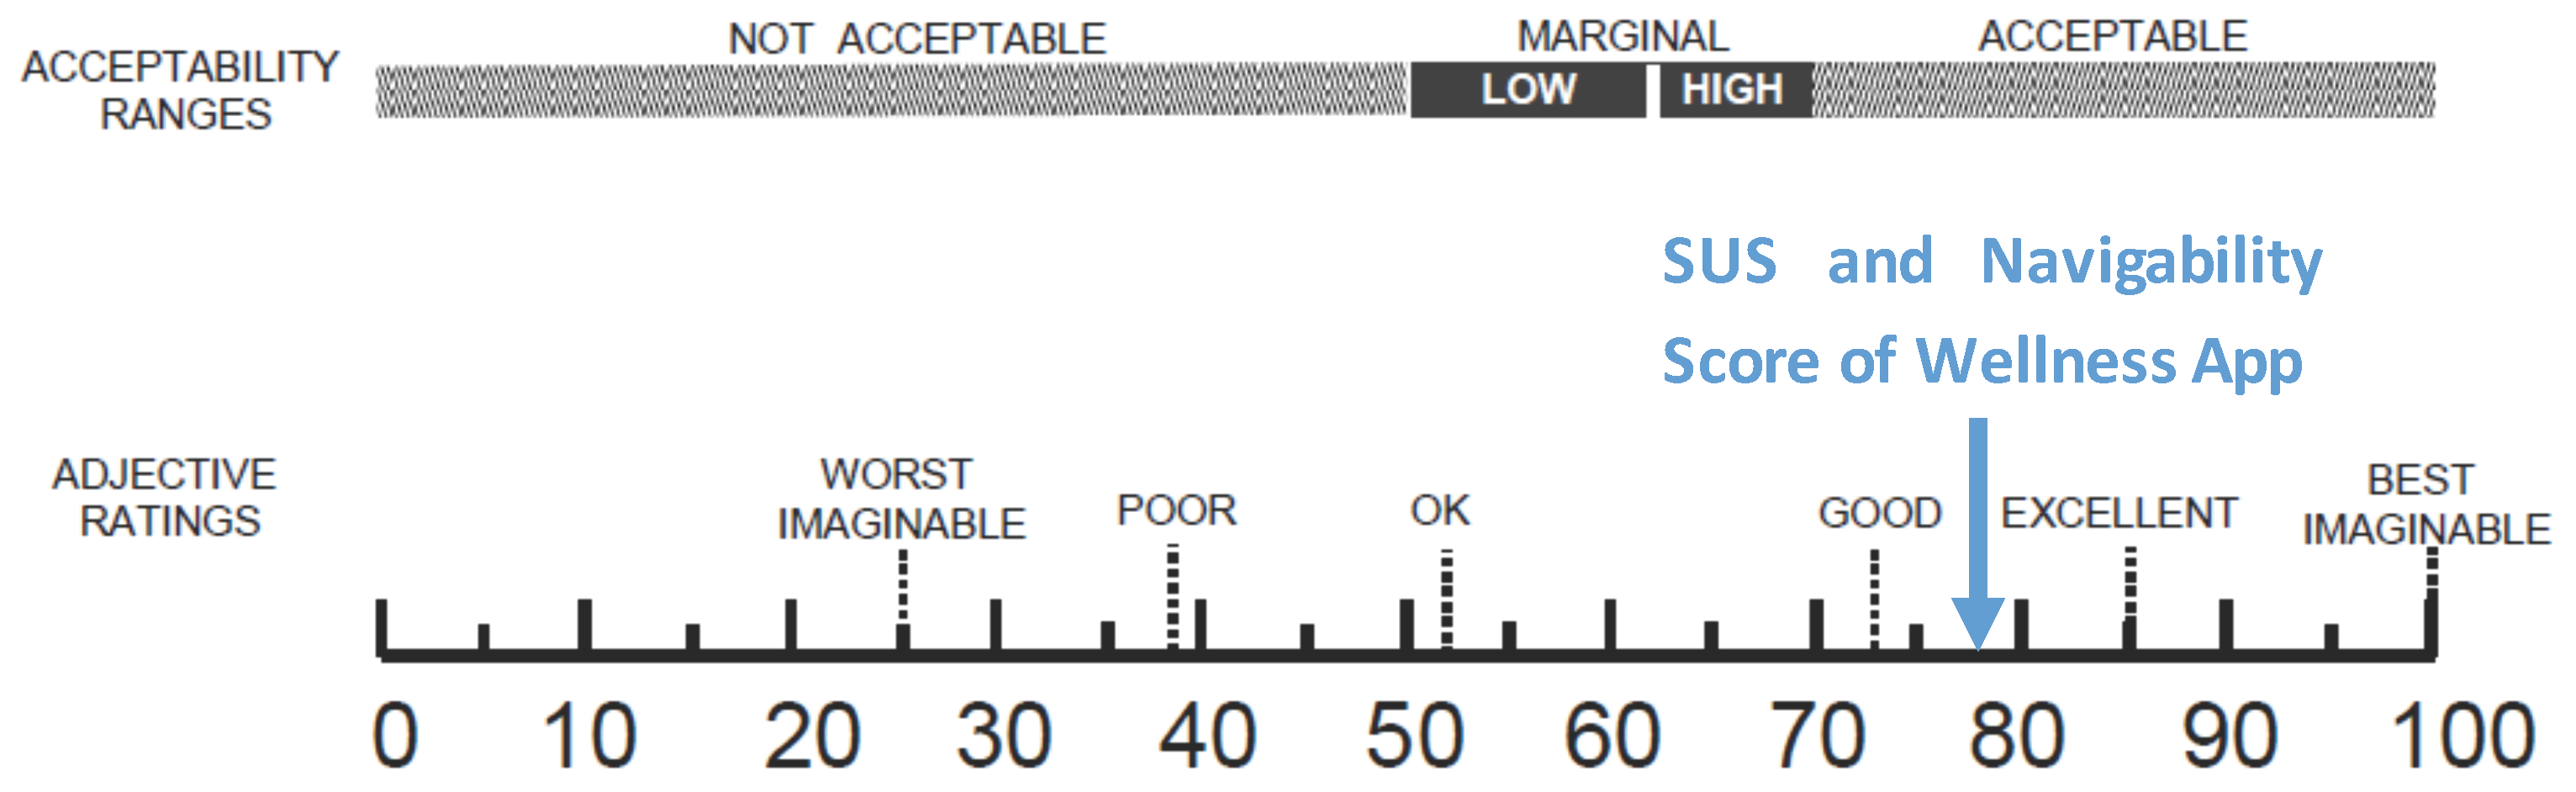
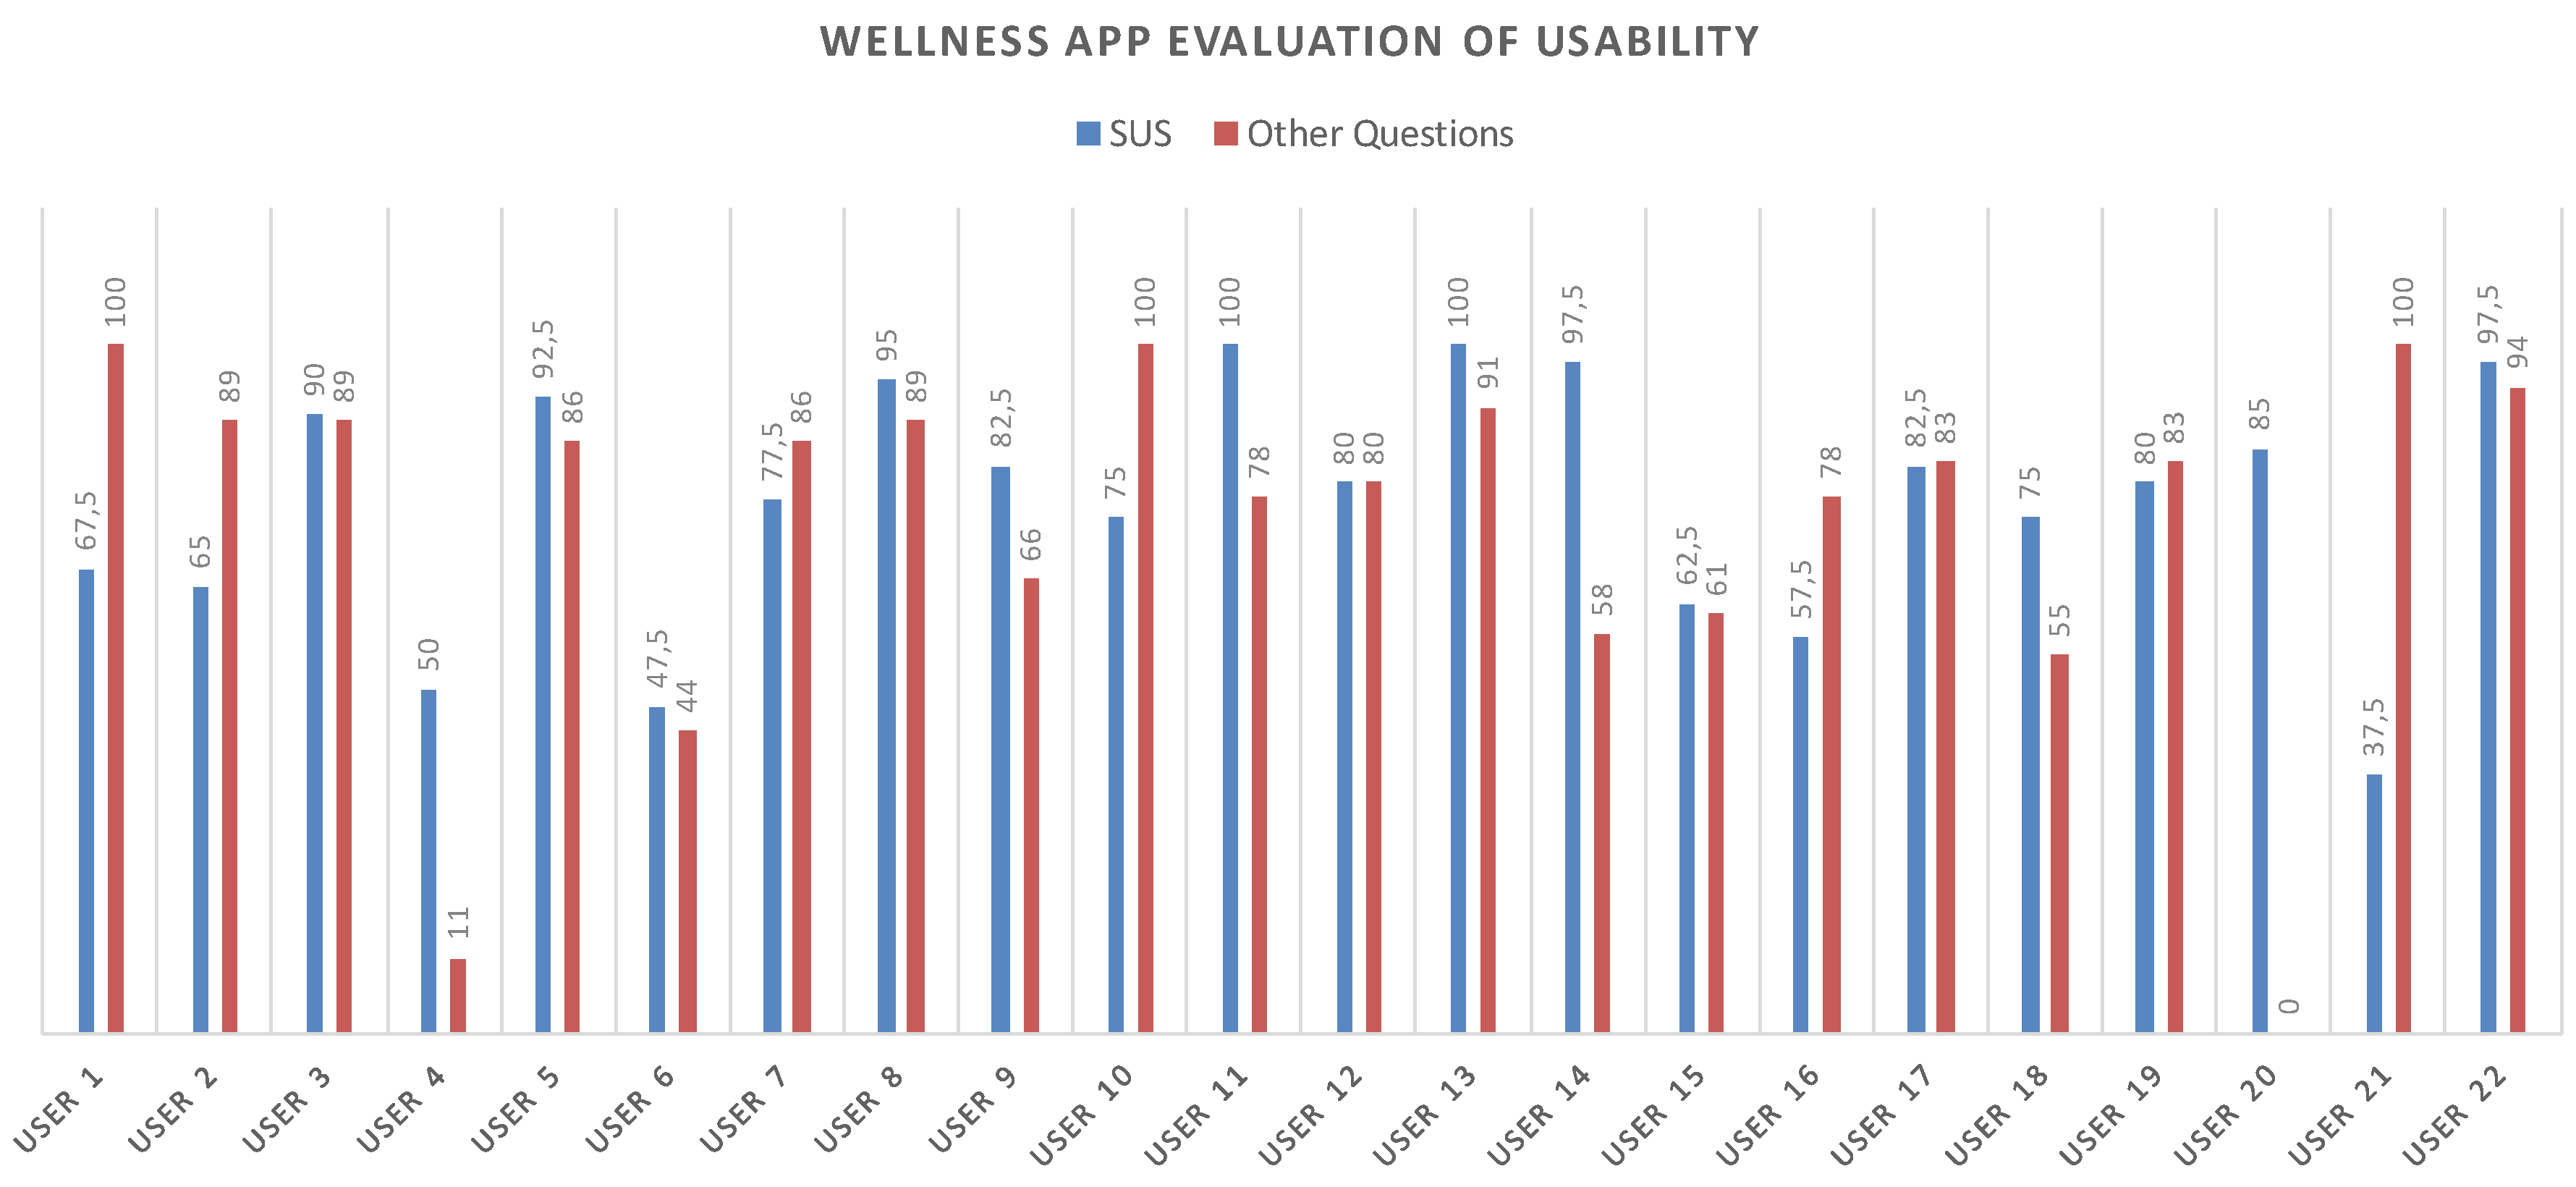
6.2. Usability Results
7. Conclusions
Acknowledgments
Author Contributions
Conflicts of Interest
References
- Jenkins, C.D. Building Better Health: A Handbook of Behavioral Change; Pan American Health Organization: Washington, DC, USA, 2003; Volume 590. [Google Scholar]
- Phillips, A.C.; Der, G.; Carroll, D. Self-reported health, self-reported fitness, and all-cause mortality: Prospective cohort study. Br. J. Health Psychol. 2010, 15, 337–346. [Google Scholar] [CrossRef] [PubMed]
- World Health Organization. Physical Inactivity: A Global Public Health Problem; World Health Organization: Washington, DC, USA, 2014. [Google Scholar]
- World Health Organization. 2008–2013 Action Plan for the Global Strategy for the Prevention and Control of Noncommunicable Diseases: Prevent and Control Cardiovascular Diseases, Cancers, Chronic Respiratory Diseases and Diabetes; World Health Organization: Washington, DC, USA, 2009. [Google Scholar]
- Fortino, G.; Galzarano, S.; Gravina, R.; Li, W. A framework for collaborative computing and multi-sensor data fusion in body sensor networks. Inf. Fusion 2015, 22, 50–70. [Google Scholar] [CrossRef]
- Fortino, G.; Giannantonio, R.; Gravina, R.; Kuryloski, P.; Jafari, R. Enabling effective programming and flexible management of efficient body sensor network applications. IEEE Trans. Hum. Mach. Syst. 2013, 43, 115–133. [Google Scholar] [CrossRef]
- Gravina, R.; Alinia, P.; Ghasemzadeh, H.; Fortino, G. Multi-sensor fusion in body sensor networks: State-of-the-art and research challenges. Inf. Fusion 2017, 35, 68–80. [Google Scholar] [CrossRef]
- Ghasemzadeh, H.; Panuccio, P.; Trovato, S.; Fortino, G.; Jafari, R. Power-aware activity monitoring using distributed wearable sensors. IEEE Trans. Hum. Mach. Syst. 2014, 44, 537–544. [Google Scholar] [CrossRef]
- Smart Health 2.0. 2014. Available online: http://www.smarthealth2.com/ (accessed on 15 March 2017).
- Forastiere, M.; de Pietro, G.; Sannino, G. An mHealth application for a personalized monitoring of one’s own wellness: Design and development. In Innovation in Medicine and Healthcare 2016; Springer: Cham, Switzerland, 2016; pp. 269–278. [Google Scholar]
- Eysenbach, G.; Consort-EHEALTH Group. CONSORT-EHEALTH: Improving and standardizing evaluation reports of Web-based and mobile health interventions. J. Med. Internet Res. 2011, 13, e126. [Google Scholar] [CrossRef] [PubMed]
- Brewer, L.C.; Kaihoi, B.; Zarling, K.K.; Squires, R.W.; Thomas, R.; Kopecky, S. The use of virtual world-based cardiac rehabilitation to encourage healthy lifestyle choices among cardiac patients: Intervention development and pilot study protocol. JMIR Res. Protoc. 2015, 4, e39. [Google Scholar] [CrossRef] [PubMed]
- Metzgar, C.J.; Nickols-Richardson, S.M. Determinants of weight gain prevention in young adult and midlife women: Study design and protocol of a randomized controlled trial. JMIR Res. Protoc. 2015, 4, e36. [Google Scholar] [CrossRef] [PubMed]
- Chan, A.W.; Tetzlaff, J.M.; Gøtzsche, P.C.; Altman, D.G.; Mann, H.; Berlin, J.A.; Dickersin, K.; Hróbjartsson, A.; Schulz, K.F.; Parulekar, W.R.; et al. SPIRIT 2013 explanation and elaboration: guidance for protocols of clinical trials. BMJ 2013, 346, e7586. [Google Scholar] [CrossRef] [PubMed]
- Boulos, M.N.K.; Brewer, A.C.; Karimkhani, C.; Buller, D.B.; Dellavalle, R.P. Mobile medical and health apps: State of the art, concerns, regulatory control and certification. Online J. Public Health Inform. 2014, 5, e229. [Google Scholar]
- Asselin, R.; Ortiz, G.; Pui, J.; Smailagic, A.; Kissling, C. Implementation and evaluation of the personal wellness coach. In Proceedings of the 25th IEEE International Conference on Distributed Computing Systems Workshops, Columbus, OH, USA, 6–10 June 2005; pp. 529–535.
- Consolvo, S.; McDonald, D.W.; Toscos, T.; Chen, M.Y.; Froehlich, J.; Harrison, B.; Klasnja, P.; LaMarca, A.; LeGrand, L.; Libby, R.; et al. Activity sensing in the wild: A field trial of ubifit garden. In Proceedings of the SIGCHI Conference on Human Factors in Computing Systems, Florence, Italy, 5–10 April 2008; pp. 1797–1806.
- Sannino, G.; de Pietro, G. An evolved ehealth monitoring system for a nuclear medicine department. In Proceedings of the Developments in E-systems Engineering (DeSE), Dubai, UAE, 6–8 December 2011; pp. 3–6.
- Higgins, J.P. Smartphone applications for patients’ health and fitness. Am. J. Med. 2016, 129, 11–19. [Google Scholar] [CrossRef] [PubMed]
- Kos, A.; Tomažič, S.; Umek, A. Suitability of smartphone inertial sensors for real-time biofeedback applications. Sensors 2016, 16, 301. [Google Scholar] [CrossRef] [PubMed]
- Abraham, C.; Michie, S. A taxonomy of behavior change techniques used in interventions. Health Psychol. 2008, 27, 379–387. [Google Scholar] [CrossRef] [PubMed] [Green Version]
- Middelweerd, A.; Mollee, J.S.; van der Wal, C.N.; Brug, J.; te Velde, S.J. Apps to promote physical activity among adults: A review and content analysis. Int. J. Behav. Nutr. Phys. Act. 2014, 11, 97. [Google Scholar] [CrossRef] [PubMed]
- Zephyr Techonology. New Zephyr BioPatch Monitoring Device for Human Performance; Zephyr Techonology: Annapolis, MD, USA, 2016. [Google Scholar]
- Sannino, G.; Graziani, A.; de Pietro, G.; Pratola, R. Wellness & LifeStyle Server: A platform for anthropometric and LifeStyle data analysis. In Proceedings of the International Conference on P2P, Parallel, Grid, Cloud and Internet Computing, Asan, Korea, 5–7 November 2016; pp. 337–347.
- Robertson, J.; Robertson, S. Volere. Requir. Specif. Templates 2000, 16, 1–80. [Google Scholar]
- Siri, W.E. The gross composition of the body. Adv. Biol. Med. Phys. 1956, 4, 513. [Google Scholar]
- Alberti-Fidanza, A.; Fidanza, F.; Chiuchiu, M.; Verducci, G.; Fruttini, D. Dietary studies on two rural Italian population groups of the Seven Countries Study. 3. Trend of food and nutrient intake from 1960 to 1991. Eur. J. Clin. Nutr. 1999, 53, 854–860. [Google Scholar] [CrossRef] [PubMed]
- Buysse, D.J.; Reynolds, C.F.; Monk, T.H.; Berman, S.R.; Kupfer, D.J. The Pittsburgh Sleep Quality Index: A new instrument for psychiatric practice and research. Psychiatry Res. 1989, 28, 193–213. [Google Scholar] [CrossRef]
- CN24 TV. Available online: http://www.cn24tv.it/news/116057/controllare-il-proprio-stato-di-salute-con-un-app-nasce-health-2-0.html (accessed on 15 March 2017).
- CrotoneInforma. Available online: http://www.crotoneinforma.it/pgn/news.php?id=6165#.Vd72U_ntmko (accessed on 15 March 2017).
- Comune Cosenza. Available online: http://www.comune.cosenza.gov.it/archivio10_notizie-e-comunicati_0_15502.html (accessed on 15 March 2017).
- Alberti-Fidanza, A.; Fidanza, F. Mediterranean adequacy index of Italian diets. Public Health Nutr. 2004, 7, 937–941. [Google Scholar] [CrossRef] [PubMed]
- Rising, R.; Harper, I.T.; Fontvielle, A.M.; Ferraro, R.T.; Spraul, M.; Ravussin, E. Determinants of total daily energy expenditure: Variability in physical activity. Am. J. Clin. Nutr. 1994, 59, 800–804. [Google Scholar] [PubMed]
- Lee, S.M.; Burgeson, C.R.; Fulton, J.E.; Spain, C.G. Physical education and physical activity: results from the School Health Policies and Programs Study 2006. J. Sch. Health 2007, 77, 435–463. [Google Scholar] [CrossRef] [PubMed]
- Fisher, R.A. Applications of “Student’s” distribution. Metron 1925, 5, 90–104. [Google Scholar]
- Brooke, J. SUS-A quick and dirty usability scale. Usability Eval. Ind. 1996, 189, 4–7. [Google Scholar]
- Bangor, A.; Kortum, P.T.; Miller, J.T. An empirical evaluation of the system usability scale. Int. J. Hum. Comput. Interact. 2008, 24, 574–594. [Google Scholar] [CrossRef]
- Bangor, A.; Kortum, P.; Miller, J. Determining what individual SUS scores mean: Adding an adjective rating scale. J. Usability Stud. 2009, 4, 114–123. [Google Scholar]
- Lewis, J.R.; Sauro, J. The factor structure of the system usability scale. In Proceedings of the International Conference on Human Centered Design, San Diego, CA, USA, 9–24 July 2009; pp. 94–103.
- Carroll, R.; Cnossen, R.; Schnell, M.; Simons, D. Continua: An interoperable personal healthcare ecosystem. IEEE Pervasive Comput. 2007, 6, 4. [Google Scholar] [CrossRef]


| App | Store | BCT Score |
|---|---|---|
| 1UpFit | iTunes | 5 |
| 20/20 LifeStyles Online | iTunes | 4 |
| Activious | iTunes | 2 |
| All-in Fitness: 1000 Exercises, Workouts & Calorie Counter | iTunes | 5 |
| Be Fit, Stay Fit Challenge | Google Play | 5 |
| Big Welsh Walking Challenge | iTunes | 8 |
| Croi HeartWise | iTunes | 4 |
| CrossFitr | Google Play | 3 |
| Endomondo Sports Tracker | Google Play | 5 |
| Everywhere Run!—GPS Run Walk | Google Play | 5 |
| Exercise Reminder HD Lite | iTunes | 4 |
| Faster | iTunes | 4 |
| Fit Friendzy | iTunes | 5 |
| Fitbit Activity Tracker | iTunes/Google Play | 4 |
| fitChallenge | iTunes | 6 |
| FitCoach—powered by Lucozade Sport | iTunes | 6 |
| FitCommit—Fitness Tracker and Timer | iTunes | 5 |
| Fitness War | iTunes | 6 |
| Fitocracy—Fitness Social Network, Turn Working Out | iTunes/Google Play | 5 |
| FitRabbit | iTunes | 4 |
| FitTrack | Google Play | 3 |
| Forty | iTunes | 3 |
| Get Active! | iTunes | 4 |
| Get In Gear | iTunes/Google Play | 4 |
| Go-go | iTunes | 4 |
| GymPush | iTunes | 7 |
| Healthy Heroes | iTunes | 5 |
| HIIT Interval Training TimerAD | Google Play | 3 |
| Hiking Log | iTunes | 3 |
| Hubbub Health | iTunes | 7 |
| IDoMove Work out and Win | iTunes/Google Play | 4 |
| Improver | iTunes | 5 |
| Macaw | iTunes/Google Play | 5 |
| Make your move | iTunes | 5 |
| Mobile Adventure Walks | iTunes | 3 |
| My Pocket Coach | iTunes | 7 |
| Nexercise = fun weight loss | iTunes/Google Play | 5 |
| Nike + Running | Google Play | 5 |
| Noom CardioTrainer | Google Play | 5 |
| Poworkout Trim & Tone | Google Play | 4 |
| Run Tracker Pro—TrainingPeaks | iTunes | 3 |
| RunKeeper—GPS Track Run Walk | Google Play | 8 |
| Running Club | iTunes | 6 |
| Running Log! PRO | iTunes | 3 |
| ShelbyFit | iTunes | 5 |
| Sixpack—Personal Trainer | iTunes | 7 |
| SmartExercise | Google Play | 4 |
| SoFit | Google Play | 5 |
| Softrace | Google Play | 3 |
| Strava Cycling | Google Play | 5 |
| Sworkit Pro | Google Play | 6 |
| Take a Walk Lite | iTunes | 6 |
| Teemo: the fitness adventure game! | iTunes | 7 |
| Track & Field REALTIMERUN (GPS) | iTunes | 6 |
| Tribesports | Google Play | 5 |
| Walk ’n Play | iTunes | 5 |
| Withings | iTunes/Google Play | 6 |
| Proposed Wellness App | soon on Google Play | 9 |
| Section | Specifications |
|---|---|
| Administrative | |
| Title | Wellness App Trial Protocol |
| Protocol version | Version 2.0 |
| Funding | Project Pon04a2_C - MIUR D.D. 626Ric e 703Ric - Smart Health 2.0 |
| Roles and responsibilities | The coordination of the experiment is entrusted to the University of Catanzaro. They should therefore appoint and register the names and roles of those who will join the team for the experimentation, for the stages of validation and data management, and for all the activities necessary for the performance of the entire trial. For privacy reasons, the names of the responsible managers cannot be listed here. |
| Introduction | |
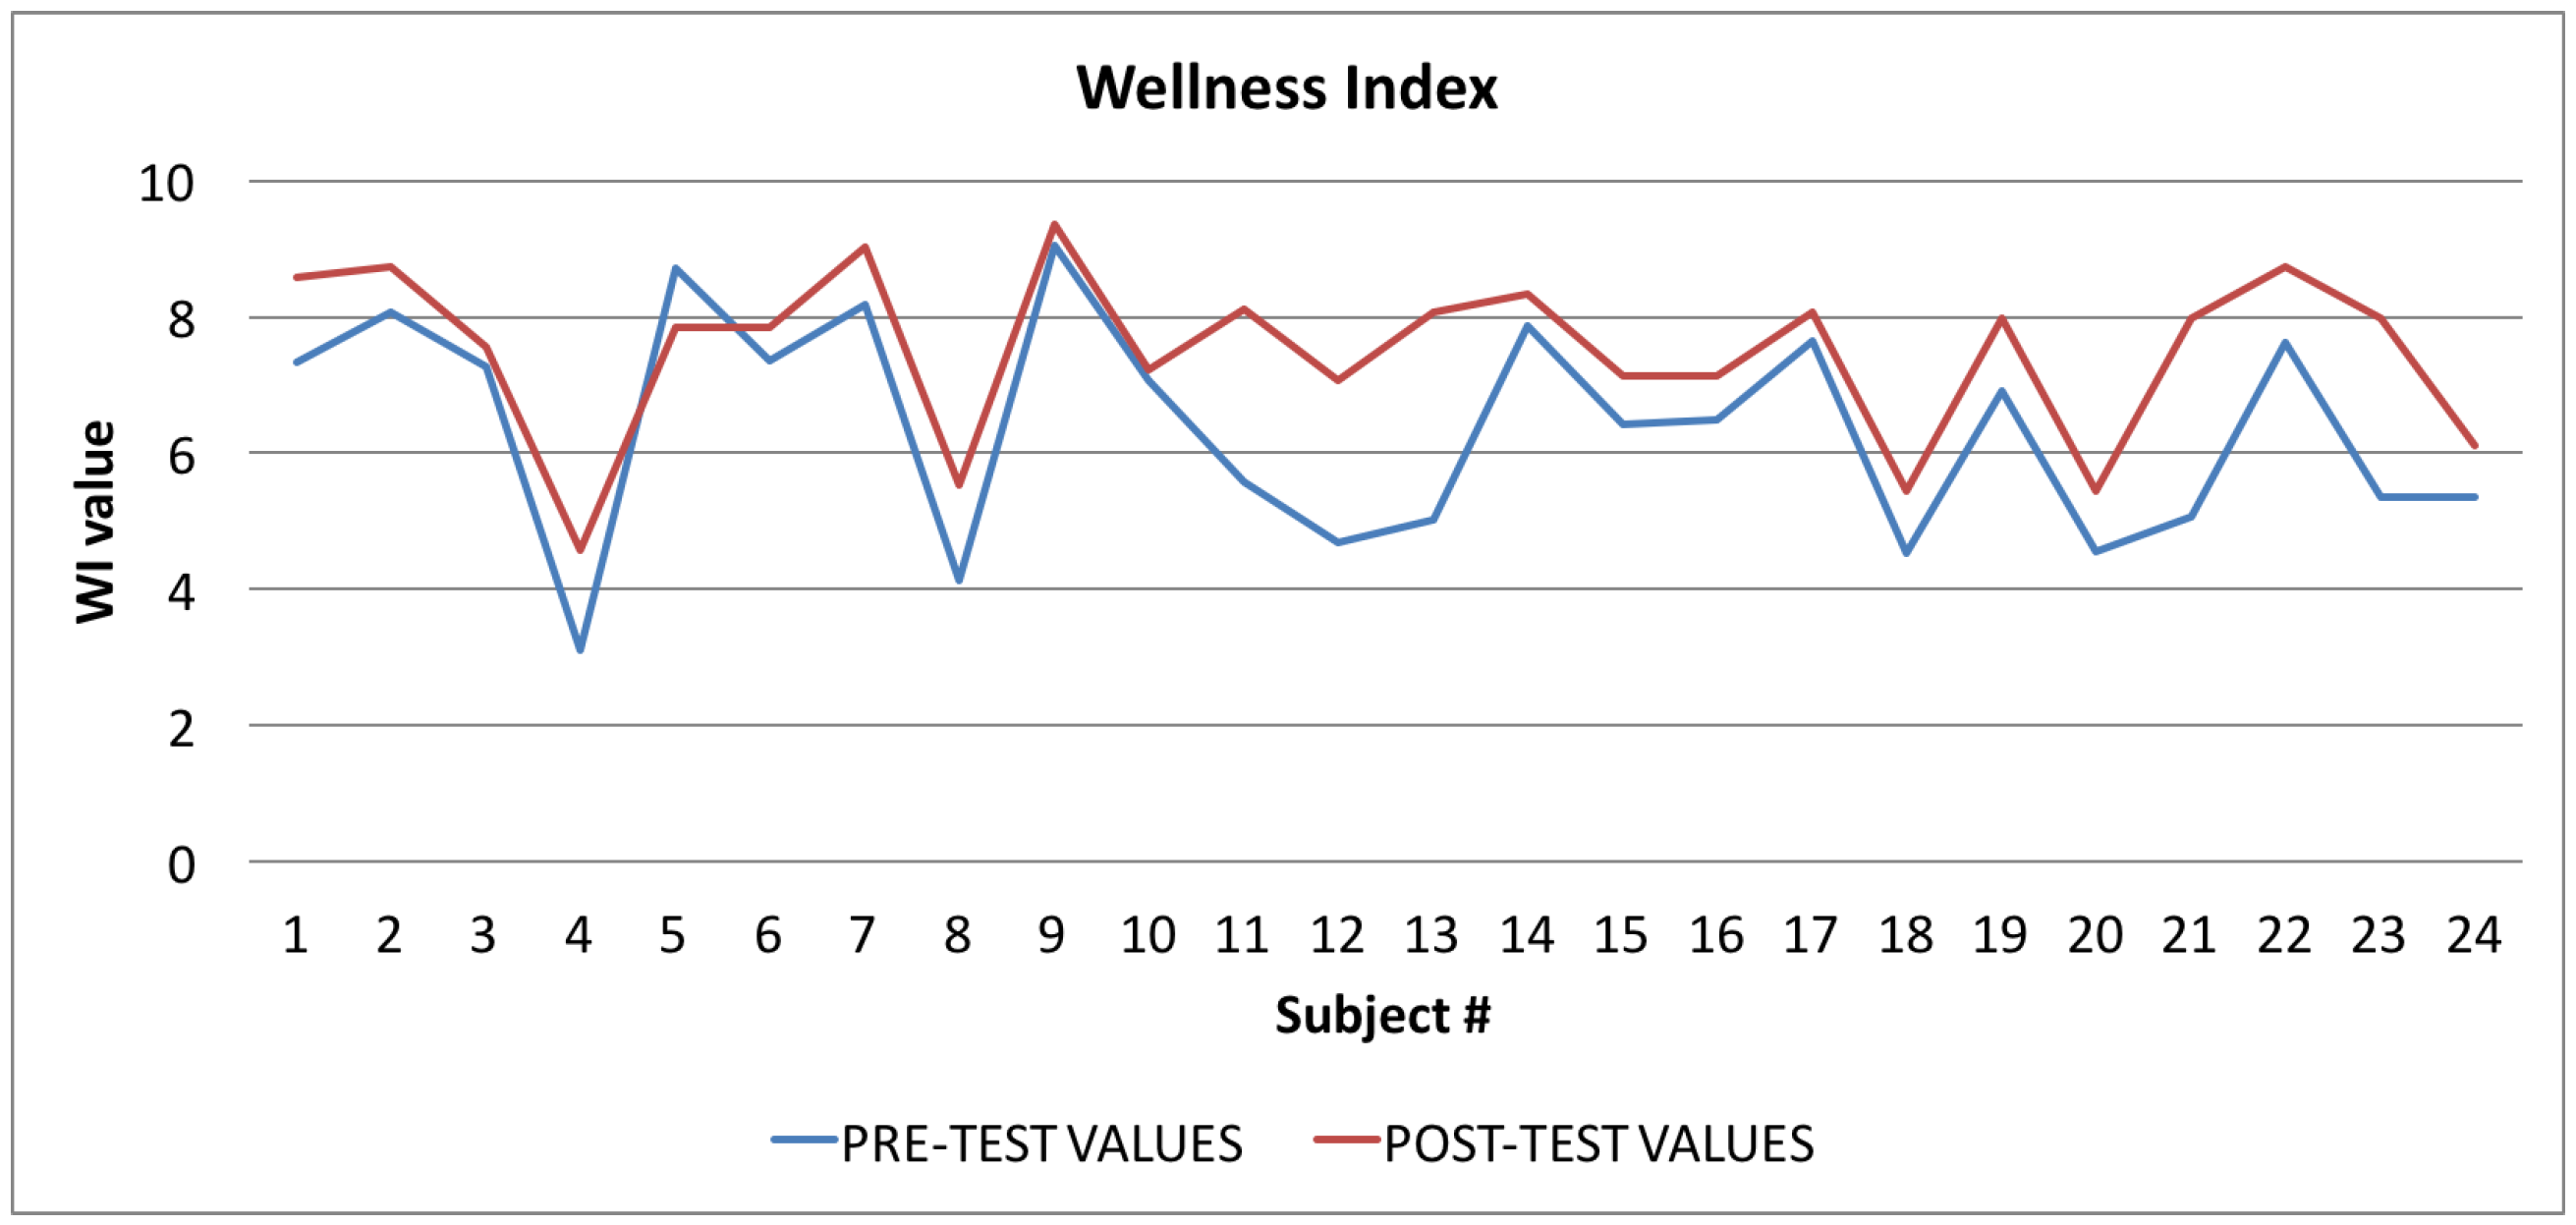
| Objectives | The outcomes are fundamental for the trial process and the interpretation of the results. The outcomes are referred to as primary and secondary according to their relevance The primary outcome of the trial process is to determine the effectiveness of the realized Wellness App, evaluating it in relation to the Wellness Index that indicates if the app is able to stimulate the subjects to change their unhealthy behaviors, improving their diet, level of physical activity, and the conditions that affect their quality of sleep. Secondary outcome measures are: ● the usability of the app; and ● the navigability of the app; |
| Methods | |
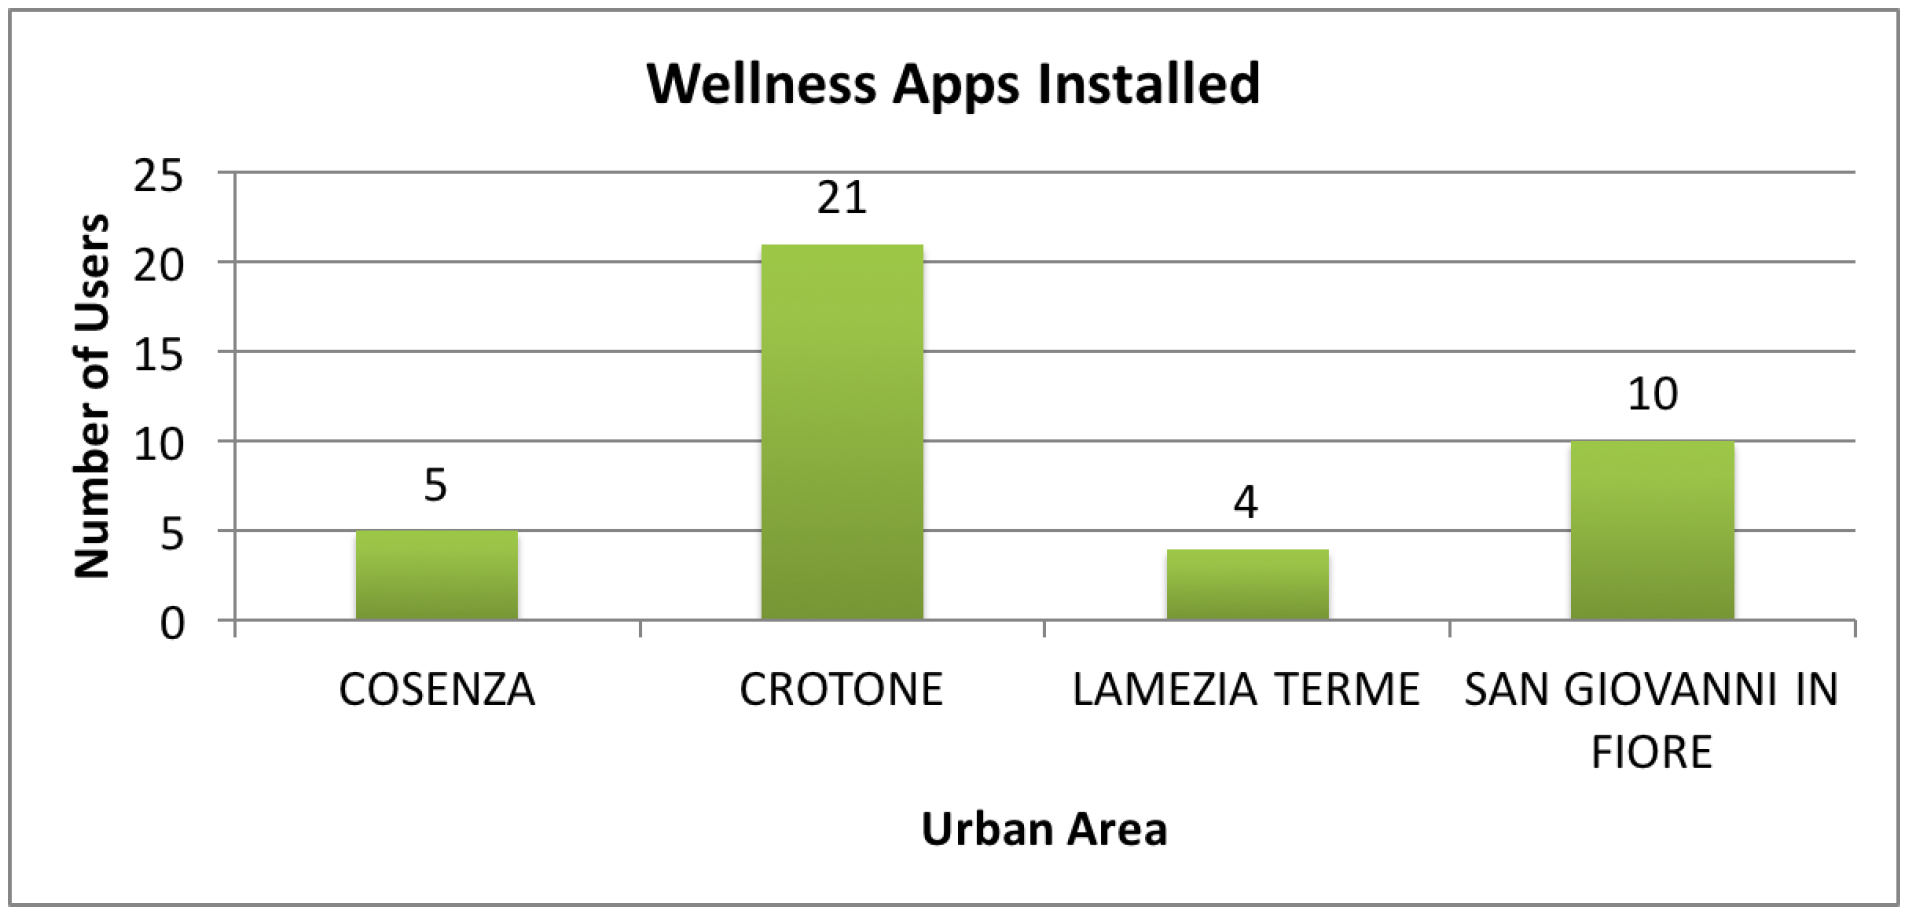
| Study setting | Four districts of the Calabria Region (Crotone, Cosenza, San Giovanni in Fiore and Lamezia Terme) have been selected to be the reference point for the conducting of the trial. |
| Eligibility criteria | The subjects to be considered suitable for the trial process must meet the following inclusion criteria: ● Italian adults aged between 18 and 65 years; ● Subjects able to comply with the study program and the other requirements of the Protocol. |
| The exclusion criteria listed below mean that the individual is ineligible for the trial: ● People aged under 18 and over 65; ● Subjects with an overt disease which include the risk factors analyzed, such as diabetes, or a cardiovascular or liver disease; ● People with neurological disorders. | |
| Interventions | The procedures to be performed are divided into the following phases: ● Recruitment of subjects: promotion of the testing program in order to recruit the subjects; ● Information & Registration: explanation of the aims of the study. After this meeting the interested subjects receive the documents to be signed (the information, informed consent form and medical history reported in the appendix) to be delivered to the staff in charge; ● Conduct of the Trial:
During the course of the testing, the investigator should not interfere when the participants are using the application, any intervention being limited to a minimum, so as not to influence the behavior of the participant. The responsibility of the investigator is purely to reassure the participant in case of difficulty, urging her/him to continue with confidence, without ever suggesting actions to be performed and without providing explanations. Instead, she/he should, when necessary, remind the participant to comment aloud when performing actions: indicating what she/he proposes to do, what she/he sees on the screen,what she/he feels about the experience, what difficulties she/he is encountering, which doubts she/he has, etc. The investigator should note the comments made, recording the situations in which the subject expresses uncertainty or makes mistakes, or other possible problems. The investigator has the task of interrupting the subject in the event that, during the performance of the testing, she/he encounters difficulties which cannot be overcome. |
| Recruitment | The recruitment of the participants should be carried out by publicizing the trial process through information campaigns, using tools such as posters, journals, magazines, newspapers, the web, leaflets, brochures and meetings with project staff who will promote the aims of the study. In the recruitment phase they will outline the objectives of the trial process to the subjects, presenting to those who wish to participate the necessary paperwork, namely the information sheet, informed consent and the medical history form. Those who meet the criteria for inclusion will be invited to participate in the study. |
| Data collection methods and management | All data collected during the testing phase and all information required by the Protocol, in respect of each participant in the trial process must be properly registered in a clear, accurate and complete. The data collected must be signed and dated by the person who recorded them. Such data must be stored anonymously and the individual must be uniquely identified by a code. The investigator is responsible for preserving the original data of the participant. To promote the conservation of the data, the participants themselves will be involved in the process, updating their records from time to time which details about the process and about subsequent developments in the application, using their contact details (phone, address e-mail) disclosed during the “Information” phase. The data to be collected for participants who abandon the study are as follows: ● Identification of the subject; ● Cause of the abandonment of the process; ● Results obtained in the study until the time of the abandonment. |
| Statistical methods for the analysis of primary and secondary outcomes | For the validation, the index values calculated by the participants before and after the trial will be compared using statistical techniques to assess whether the difference between the averages is significant; in particular, for each of the four indicators, using the t-Student distribution method, the relative values will be calculated to determine the significance level (with a maximum threshold equal to 5%) to understand if the differences between the averages are attributable to a null hypothesis, or, on the contrary, if the hypothesis concerning the effectiveness of the application in improving that specific indicator of wellness seem to be justified. The same type of statistical calculation will be made for the global indicator IW, which is a datum derived from the other indexes. A significant improvement in the Index of Wellness confirms the success of the application. In any case, if the results for some of the indicators are not satisfactory, we will try to understand the causes by analyzing the answers given by the participants to the Usability Tests, to understand what difficulties they had encountered during the trial. From this feedback it will be possible to obtain useful information for the further improvement of the application. |
| Problems | In the event that the study is abandoned, the following guidelines should be implemented, depending on the cause of abandonment: ● Abandonment due to difficulties in recruiting participants:
● Abandonment due to incorrect execution of the testing phase:
Adverse events that may affect the trial process in place must be recorded in certain modules in which the following information must be specified: ● Date and time of the event; ● Stage of the process where the adverse event occurred; ● Cause of the adverse event; ● In cases where the adverse event involves a participant of the process, the data of the subject should be indicated. The investigator is responsible for assessing the severity of an adverse event and for making the subsequent decision to abandon or proceed with the study. |
| Ethics and Dissemination | |
| Research ethics approval | The protocol, the recruitment materials and other materials are required to be approved by the sponsors of the study and the test manager. |
| Changes | Any change to the protocol that can impact on the conduct of the study, compromising the safety of the participants, including changes in the objectives of the study, or significant administrative issues, require a formal amendment to the protocol. This amendment must be approved by the sponsors of the study and the test manager. |
| Consent or assent | Each person participating in the trial process must be fully informed about the purposes of the study, on the methods of how to conduct it, on the benefits and possible risks arising from participation in research and the ability to stop participating in the trial, at any time and without any consequences. This operation is essential because the understanding of these details and the ability to exchange information generates participation and contributes to improving the quality of the process of experimentation. All subjects are asked to sign the informed consent form and the information document, shown in the appendix, essential to ensure the protection of the confidentiality of the trial subjects, informing them about the process of testing and the treatment of personal data and the search results. In order to facilitate the task of the participants it is also desirable to provide a telephone answering service, preferably free, which is always available for further requests for clarification, comments or suggestions. |
| Appendix | |
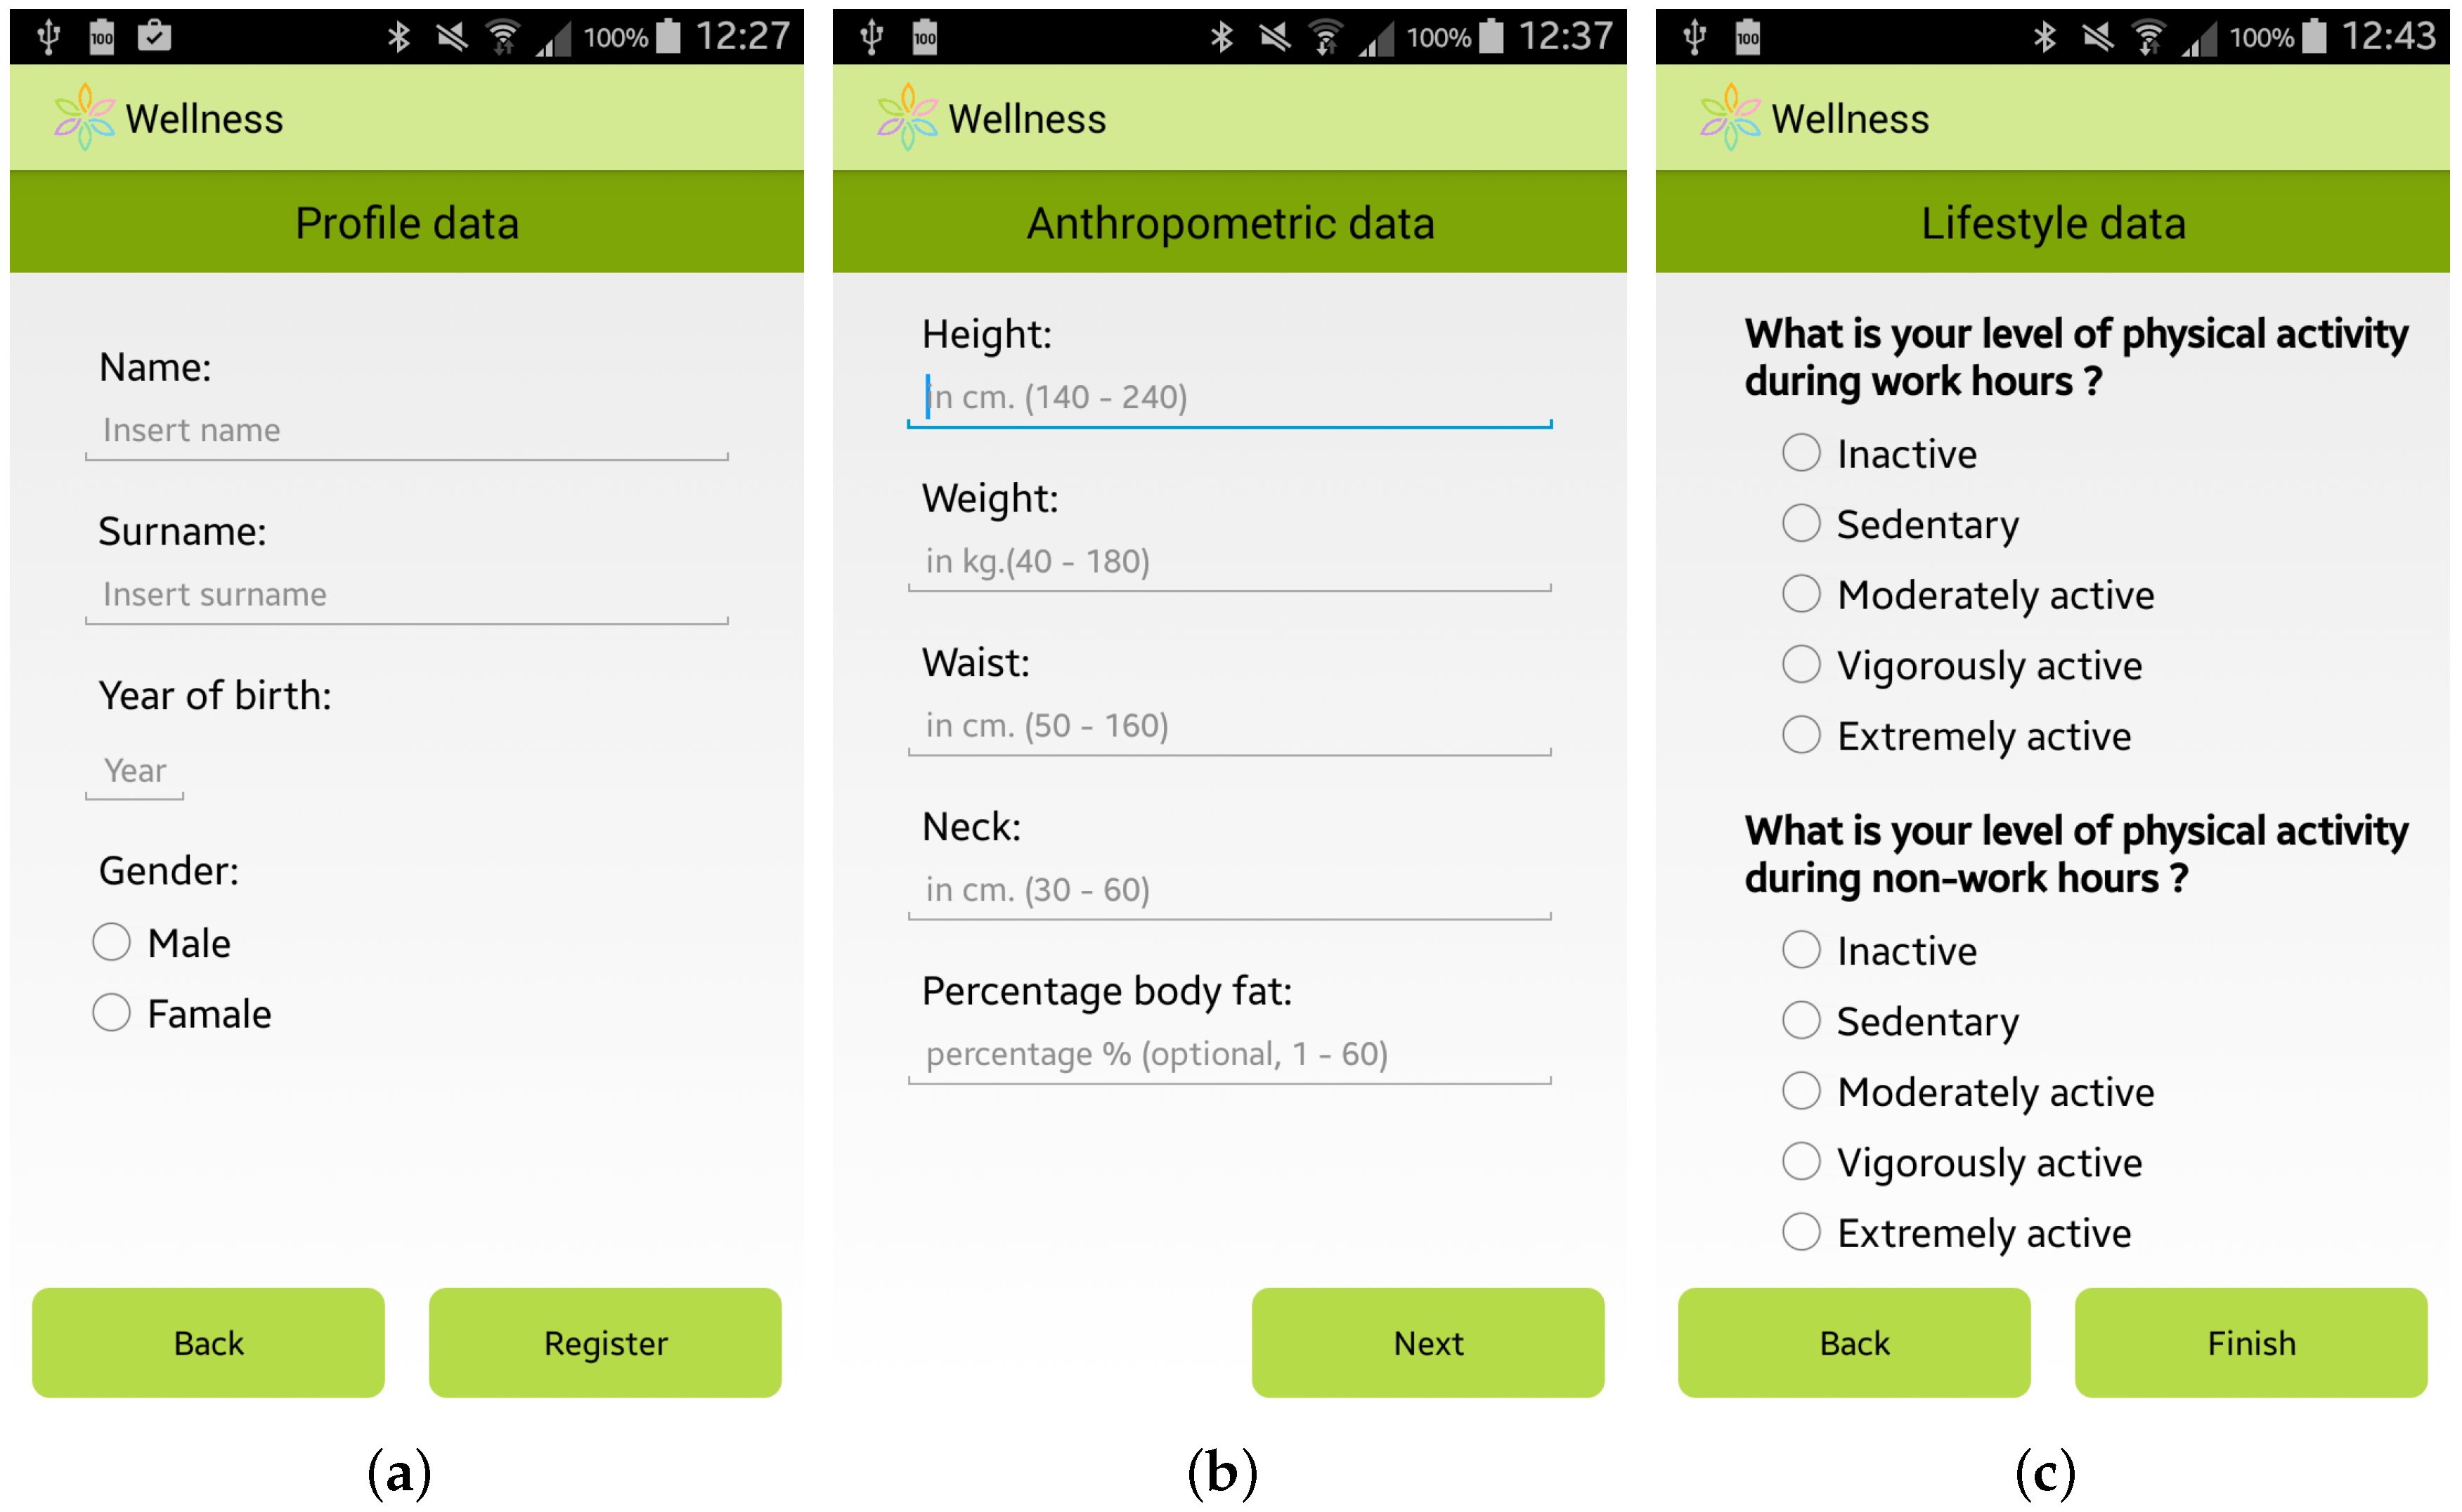
| Anamnestic Form | ● Personal Data: name, surname, date of birth, address, etc. ● Physiological History: smoking, alcohol consumption, etc. ● Anthropometric data: height, weight, neck size, waistline, hips (women only), etc. |
| Post-usability test questionnaires | Questionnaires useful for the usability evaluation. They are described in Section 6, subsection “Usability Results”. |
| Urban Area | Citizens | Installed Apps | Sheets | Usability Tests |
|---|---|---|---|---|
| Cosenza | 10 | 5 (50%) | 5 | 1 |
| Crotone | 28 | 21 (75%) | 21 | 7 |
| Lamezia Terme | 17 | 4 (24%) | 4 | 4 |
| S.Giovanni in Fiore | 26 | 10 (35%) | 10 | 10 |
| Total | 81 | 40 (48%) | 40 | 22 |
| Values at the Beginning of the Trial | Values at the End of the Trial | |||||||||
|---|---|---|---|---|---|---|---|---|---|---|
| Subject | IAM | TPA | PSQI | TCI | IW | IAM | TPA | PSQI | TCI | IW |
| Subject#1 | 6.28 | 8.27 | 7.62 | 7.28 | 7.33 | 7.54 | 10.00 | 7.62 | 8.77 | 8.58 |
| Subject#2 | 6.70 | 10.00 | 6.67 | 8.35 | 8.07 | 8.13 | 10.00 | 7.14 | 9.07 | 8.74 |
| Subject#3 | 8.24 | 10.00 | 6.67 | 0.52 | 7.28 | 8.57 | 10.00 | 7.14 | 1.00 | 7.55 |
| Subject#4 | 5.34 | 0.00 | 5.24 | 2.67 | 3.10 | 6.50 | 2.00 | 6.19 | 4.25 | 4.57 |
| Subject#5 | 8.24 | 10.00 | 6.67 | 9.12 | 8.71 | 6.35 | 10.00 | 6.19 | 8.17 | 7.84 |
| Subject#6 | 5.95 | 10.00 | 4.29 | 7.98 | 7.36 | 7.13 | 10.00 | 4.29 | 8.57 | 7.85 |
| Subject#7 | 6.77 | 10.00 | 7.14 | 8.39 | 8.18 | 8.45 | 10.00 | 8.10 | 9.22 | 9.04 |
| Subject#8 | 6.89 | 0.00 | 7.62 | 3.44 | 4.14 | 8.25 | 2.00 | 7.62 | 5.13 | 5.54 |
| Subject#9 | 8.13 | 10.00 | 9.00 | 9.06 | 9.05 | 8.48 | 10.00 | 10.00 | 9.24 | 9.37 |
| Subject#10 | 4.21 | 10.00 | 7.62 | 6.31 | 7.06 | 6.11 | 10.00 | 7.62 | 3.53 | 7.23 |
| Subject#11 | 6.17 | 4.00 | 8.10 | 5.08 | 5.59 | 6.41 | 10.00 | 7.62 | 8.20 | 8.11 |
| Subject#12 | 6.02 | 4.00 | 8.10 | 0.00 | 4.69 | 6.47 | 10.00 | 8.10 | 1.30 | 7.06 |
| Subject#13 | 5.39 | 4.00 | 6.67 | 4.70 | 5.02 | 6.41 | 10.00 | 7.40 | 8.21 | 8.07 |
| Subject#14 | 6.22 | 10.00 | 6.67 | 8.11 | 7.87 | 7.33 | 10.00 | 6.67 | 8.67 | 8.33 |
| Subject#15 | 6.00 | 6.00 | 8.50 | 6.00 | 6.42 | 6.50 | 7.00 | 9.00 | 6.75 | 7.13 |
| Subject#16 | 8.47 | 5.00 | 5.24 | 6.73 | 6.48 | 7.67 | 7.00 | 6.19 | 7.34 | 7.15 |
| Subject#17 | 6.73 | 8.00 | 9.00 | 7.36 | 7.64 | 8.95 | 6.80 | 9.00 | 7.87 | 8.06 |
| Subject#18 | 7.45 | 3.00 | 1.00 | 5.23 | 4.52 | 8.77 | 3.50 | 2.00 | 6.13 | 5.44 |
| Subject#19 | 7.54 | 8.00 | 6.67 | 3.76 | 6.92 | 8.46 | 10.00 | 7.14 | 3.76 | 7.97 |
| Subject#20 | 6.67 | 2.00 | 5.71 | 4.33 | 4.56 | 7.60 | 3.00 | 6.19 | 5.30 | 5.45 |
| Subject#21 | 5.68 | 4.00 | 6.19 | 4.84 | 5.06 | 9.29 | 7.00 | 7.14 | 8.14 | 7.98 |
| Subject#22 | 7.64 | 8.00 | 6.67 | 7.82 | 7.63 | 8.30 | 10.00 | 6.67 | 9.15 | 8.74 |
| Subject#23 | 7.51 | 4.00 | 4.76 | 4.38 | 5.36 | 7.86 | 8.00 | 8.10 | 8.05 | 7.98 |
| Subject#24 | 7.75 | 3.00 | 5.24 | 5.38 | 5.35 | 8.39 | 4.00 | 5.70 | 6.20 | 6.11 |
© 2017 by the authors. Licensee MDPI, Basel, Switzerland. This article is an open access article distributed under the terms and conditions of the Creative Commons Attribution (CC BY) license ( http://creativecommons.org/licenses/by/4.0/).
Share and Cite
Sannino, G.; Forastiere, M.; De Pietro, G. A Wellness Mobile Application for Smart Health: Pilot Study Design and Results. Sensors 2017, 17, 611. https://doi.org/10.3390/s17030611
Sannino G, Forastiere M, De Pietro G. A Wellness Mobile Application for Smart Health: Pilot Study Design and Results. Sensors. 2017; 17(3):611. https://doi.org/10.3390/s17030611
Chicago/Turabian StyleSannino, Giovanna, Manolo Forastiere, and Giuseppe De Pietro. 2017. "A Wellness Mobile Application for Smart Health: Pilot Study Design and Results" Sensors 17, no. 3: 611. https://doi.org/10.3390/s17030611