Article

Diazonium Salt-Based Surface-Enhanced Raman Spectroscopy Nanosensor: Detection and Quantitation of Aromatic Hydrocarbons in Water Samples

by
Inga Tijunelyte
1,
Stéphanie Betelu
2,*,
Jonathan Moreau
3,
Ioannis Ignatiadis
2,
Catherine Berho
2,
Nathalie Lidgi-Guigui
1,
Erwann Guénin
4,
Catalina David
5,
Sébastien Vergnole
5,
Emmanuel Rinnert
3 and
Marc Lamy de la Chapelle
1,*
1
CSPBAT Laboratory, UMR 7244, UFR SMBH, University of Paris 13, Sorbonne Paris Cite, 93017 Bobigny, France
2
BRGM, F-45060 Orléans CEDEX 02, France
3
IFREMER, Brittany Center, Detection, Sensors and Measurements Laboratory, CS10070, 29280 Plouzané, France
4
Laboratoire TIMR, EA4297, Sorbonne Universités—Université de Technologie de Compiègne, Centre de recherche de Royallieu, rue du docteur Schweitzer, CS 60319, 60203 Compiègne CEDEX, France
5
HORIBA Jobin Yvon SAS, 59650 Villeneuve d’Ascq, France
*
Authors to whom correspondence should be addressed.
Sensors 2017, 17(6), 1198; https://doi.org/10.3390/s17061198
Submission received: 31 March 2017 / Revised: 11 May 2017 / Accepted: 16 May 2017 / Published: 24 May 2017
(This article belongs to the Special Issue State-of-the-Art Sensors Technology in France 2016)

Abstract

:
Here, we present a surface-enhanced Raman spectroscopy (SERS) nanosensor for environmental pollutants detection. This study was conducted on three polycyclic aromatic hydrocarbons (PAHs): benzo[a]pyrene (BaP), fluoranthene (FL), and naphthalene (NAP). SERS substrates were chemically functionalized using 4-dodecyl benzenediazonium-tetrafluoroborate and SERS analyses were conducted to detect the pollutants alone and in mixtures. Compounds were first measured in water-methanol (9:1 volume ratio) samples. Investigation on solutions containing concentrations ranging from 10−6 g L−1 to 10−3 g L−1 provided data to plot calibration curves and to determine the performance of the sensor. The calculated limit of detection (LOD) was 0.026 mg L−1 (10−7 mol L−1) for BaP, 0.064 mg L−1 (3.2 × 10⁻⁷ mol L−1) for FL, and 3.94 mg L−1 (3.1 × 10⁻⁵ mol L−1) for NAP, respectively. The correlation between the calculated LOD values and the octanol-water partition coefficient (Kow) of the investigated PAHs suggests that the developed nanosensor is particularly suitable for detecting highly non-polar PAH compounds. Measurements conducted on a mixture of the three analytes (i) demonstrated the ability of the developed technology to detect and identify the three analytes in the mixture; (ii) provided the exact quantitation of pollutants in a mixture. Moreover, we optimized the surface regeneration step for the nanosensor.

1. Introduction

As part of the latest European Water Framework Directives (Directives 2000/60/EC, 2006/118/EC, and 2006/11/EC), the development of analytical tools allowing on-site, accurate, and sensitive detection of pollutants in environmental waters is of primary importance. Although extensive efforts have been devoted to developing highly sensitive, reproducible, accurate, and robust analytical sensors for on-site or in situ monitoring of trace elements (i.e., qualitative and quantitative analysis) [1,2,3,4,5,6,7], organic contaminants have received less attention.
Among the strategies investigated to meet the need for detecting organic contaminants in water, novel extraction techniques have been widely reported. Solid phase microextraction (SPME) [8,9,10,11] or stir-bar sorptive extraction (SBSE) [12] combined with gas chromatography (GC) [13,14,15], high performance liquid chromatography (HPLC) [15,16], mass spectrometry (MS) [17], Raman spectroscopy [10], or capillary electrophoresis (CE) have led to accurate results down to pg L−1 concentrations for chlorinated solvents [16], benzene, toluene, ethylbenzene, and xylenes (BTEXs) [10], and polycyclic aromatic hydrocarbons (PAHs) [9,15]. Despite their high sensitivity, procedures using these passive sensors are ill-suited for on-site monitoring due to their limitations regarding the co-injection of solvents [18,19] and the desorption procedure under high temperature and/or pressure [20].
New alternative methodologies with similar efficiencies are thus needed for detecting organic contaminants. Given their low limit of detection on the order of ng L−1, piezoelectric chemical sensors (quartz crystal microbalance, QCM) [21,22,23,24,25,26,27,28,29,30,31] have attracted considerable attention. Although QCM is suitable for investigating the preconcentration of organic contaminants using coated polymers or calixarenes [22,23,24,25,26,27,28,29,31,32], the use of QCM-based sensors for the detection of various organic compounds in natural samples has not been reported as far as we know, probably because they cannot identify individual compounds.
In comparison, issues related to compound identification in complex environmental conditions can be overcome by exploiting surface-enhanced Raman spectroscopy (SERS). SERS is a powerful technique based on nanostructured metallic surfaces that greatly enhance the Raman signal via both electromagnetic and chemical effects. The first effect arises from the interaction between the incident light and the metallic nanostructures, inducing local enhancement of the electromagnetic field through the excitation of localized surface plasmons [33,34,35,36,37]. As a result, the Raman signal of any molecule located in close vicinity to the nanostructured surface can be enhanced up to 108-fold [38,39,40,41,42]. The second effect contributing to Raman signal enhancement by up to 102-fold is due to the electronic interaction between the molecules and the metallic nanostructures (i.e., charge transfer between surface and chemisorbed molecules) [43]. SERS nanosensors can detect very low concentrations of analytes and thus, attain high sensitivity and low limit of detection (LOD) values, down to the individual molecule [44,45,46]. Most importantly, SERS provides a molecular fingerprint, thus molecules can be individually identified and deciphered in complex mixtures [47,48].
Finally, due to the improvements in Raman spectrometer miniaturization [11], the innovations in nanoscale technologies applied to sensors (essentially based on colloid systems [49,50]), and the implemented surface chemistry strategies (i.e., surface functionalization by using Self-Assembled Monolayers (SAMs) for analyte preconcentration), SERS has already been recognized as a powerful tool for on-site monitoring of organic contaminants at the ng L−1 level [50,51,52,53,54,55,56,57]. However, despite great improvements made to produce colloidal nanostructures with controlled sizes and shapes [49,50], SERS nanosensors have a major drawback related to poor SERS signal reproducibility due to the uncontrollable aggregation of metal colloids. To overcome the lack of reproducibility and capitalize on the increasing number of SERS substrates available commercially, we selected substrates (Wavelet) based on supported gold nanorod arrays produced and distributed by the S.T. Japan company. These SERS substrates are devoted for highly reproducible and very sensitive measurements.
Regarding surface functionalization, SAMs are widely recognized as excellent systems for sensing applications because they offer well-defined organization and densely-packed structures [58]. However, there are limitations with regard to the stability of the bond between the thiol and the metallic surface and hence the stability of the resulting SAMs [59,60]. As a powerful, innovative alternative to SAMs, we adopted a diazonium salt-based surface functionalization strategy. Immobilization of aryldiazonium has been described as a versatile method, providing surface properties that can be fine-tuned given the wide variety of available diazonium salts and stable grafted organic layers [61,62,63,64,65,66,67,68], thereby ensuring sensor robustness. Therefore, we studied a diazonium-salt-functionalized SERS sensor for the detection and the quantitation of three PAHs. Among the 130 PAHs released into the environment, benzo[a]pyrene (BaP), fluoranthene (FL), and naphthalene (NAP) belong to the priority substances under the European Water Framework Directive (2000/60/EC) and the United States Environment Protection Agency. The investigation of selected pollutants was conducted to demonstrate the proof-of-concept of this novel SERS nanosensor for compound sensing. PAH compounds were analyzed alone and in mixture. Investigations of the targeted compounds were carried out with different concentrations prepared in water-methanol (9:1 volume ratio) solutions. Calibration curves and detection limits were established for each compound. Moreover, given that the preconcentration of targeted molecules at the nanosensor surface is essentially based on weak molecular forces, we tested the possibility of regeneration and reuse of the developed nanosensor.

2. Materials and Methods

2.1. Reagents

Diethyl ether (≥98%), tetrafluoroboric acid (49.5–50.5%), sodium nitrite (≥97%), 4-dodecylaniline (97%), benzo[a]pyrene (≥96% HPLC), fluoranthene (98%), and naphthalene (99%) were purchased from Sigma-Aldrich and used without further purification. Ethanol (96%) and methanol (100%) were purchased from VWR; sulfuric acid (95–98%) was purchased from JT Baker. Milli-Q water (resistivity of 18.2 MΩ cm−1) was used in all experiments.

2.2. Diazonium Salt Chemical Synthesis

4-dodecyl benzenediazonium-tetrafluoroborate (DS-C10H21), was synthesized regarding the reaction between aryl amines and sodium nitrite at 0 °C [69]. Briefly, the primary amine (4 × 10⁻³ mol L−1) was dissolved in a tetrafluoroboric acid (HBF4) solution and the mixture was then cooled for 15 min. A precooled aqueous sodium nitrite (4.3 × 10⁻³ mol L−1) solution was added dropwise to the acid amine mixture under stirring. The mixture was then allowed to react for 40 min. The obtained precipitate was filtered through a 0.2 μm cellulose ester filter (Whatman) and generously washed with milli-Q water. The diazonium salt was purified by re-crystallization in diethyl ether for 48 h at 6 °C. Afterwards, the prepared salt was dried under vacuum and preserved at −20 °C.
The synthesized diazonium salt was characterized by nuclear magnetic resonance (NMR). Spectra were recorded using a Bruker Avance III 400 MHz instrument in a d6-DMSO solvent. Tetramethylsilane (TMS) was used as an internal standard. DS-C10H21:1H NMR (400 MHz, DMSO-d6): d (ppm) 0.84–0.87 (t, J = 6.4 Hz, 3H); 1.25 (s, 14H); 1.61 (s, 2H); 2.81–2.85 (t, J = 7.6 Hz, 2H); 7.81–7.83 (d, J = 8.4 Hz, 2H); 8.55–8.57 (d, J = 8.4 Hz, 2H).

2.3. SERS Substrate

Commercially available gold nanorod arrays (Wavelet) (hereafter referred to as gold nanostructures, GNSs) were purchased from S.T. Japan and were used in this study as SERS active substrates.

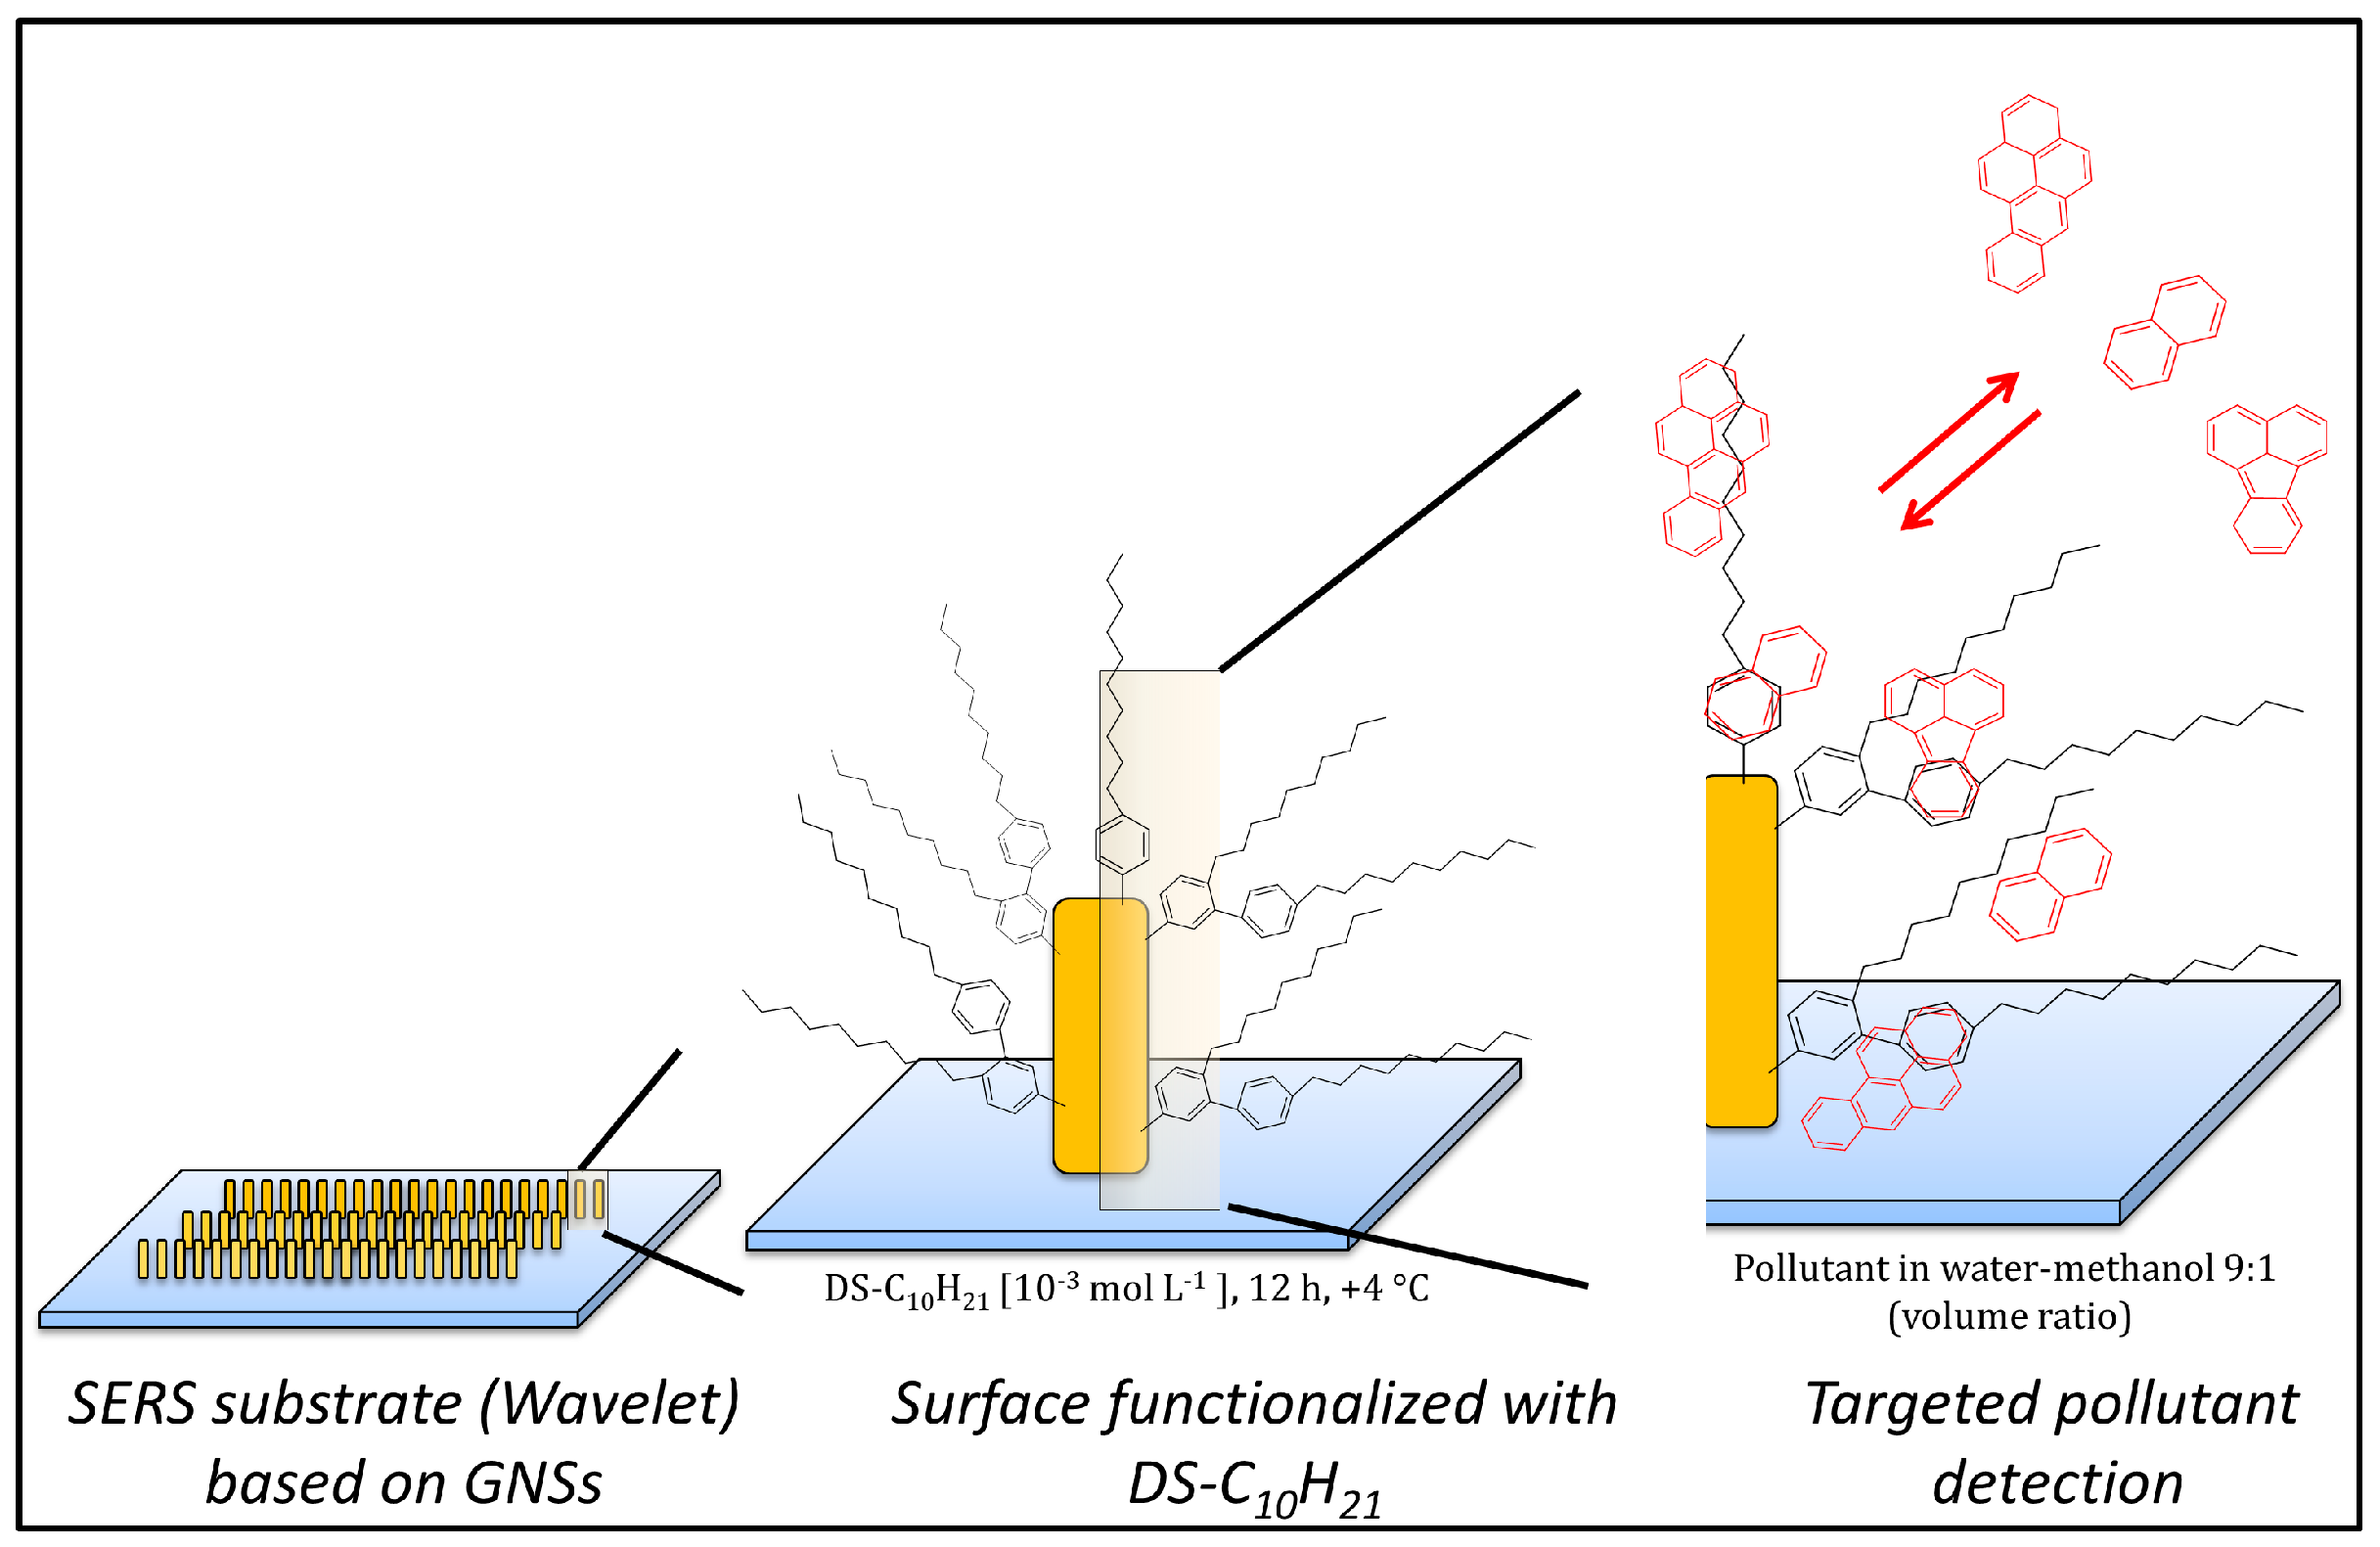
2.4. Surface Functionalization

Chemical (spontaneous) grafting of the diazonium salt was performed by immersing SERS substrates in a 30 mL solution containing the diazonium salt (10−3 mol L−1) dissolved in H2SO4 (10−3 mol L−1). Substrates were then incubated for 12 h at +4 °C. They were then rinsed under mild stirring by immersion in (i) milli-Q water (3 times) and (ii) pure methanol (3 times), for 10 min for each immersion. Afterwards, the functionalized substrates were dried under a mild nitrogen flux.

2.5. Solutions of the Targeted Compounds

Benzo[a]pyrene (BaP), fluoranthene (FL), and naphthalene (NAP) were used in this study to test the ability of the diazonium-salt-based SERS sensor to detect the PAH compounds. These PAHs were selected for their different solubility values related to their polarity defined by the octanol-water partition coefficient, KOW. The KOW of each compound is summarized in Table 1.
Due to solubility issues, stock solutions were prepared by dissolving the targeted pollutants in pure methanol (MeOH). Stock solutions of BaP, FL, and NAP were prepared at different concentrations as follows: 10 mg L−1 for BaP, 200 mg L−1 for FL, and 1000 mg L−1 for NAP, and were stored at −20 °C. Stock solutions were diluted daily with milli-Q water (10% of pollutant stock solution in 90% of water % v/v) to obtain stock solutions which were then stored at +4 °C and used for further dilution, keeping a constant volume ratio (9:1) between milli-Q water and MeOH.

2.6. Nanosensor Surface Regeneration

The preconcentration of the targeted pollutants on the SERS nanosensors was driven by weak interactions with the DS-C10H21 layer, such as hydrophobic interactions and/or π−π stacking (Scheme 1). To regenerate the surface, MeOH was found to be an efficient solution. Thus, after performing the detection of the targeted pollutants, the SERS nanosensors were regenerated with MeOH for 30 min.

2.7. Raman and SERS Measurements

Raman and SERS measurements were performed using a transportable micro-Raman spectrometer prototype designed by HORIBA Scientific for on-site applications. The instrumental set-up was equipped with a 691 nm laser diode (Ondax) and a 60× magnification objective (0.7 N.A.) with a collar for glass correction (Olympus). The spectral range was recorded from 400 to 2100 cm−1 with a spectral resolution better than 4 cm−1. For SERS experiments, the laser power was set to 4 mW to avoid molecular degradation induced by photochemical or thermal effects. The integration time for SERS measurements was set to 20 s with three accumulations to reach a relevant signal-to-noise ratio. Spectral calibration was performed daily on a crystalline silicon sample (peak position at 520 cm−1). A fluidic cell located above the microscope objective allowed the sample solutions to flow onto the SERS substrate.

2.8. Chemometrics

To remove the Raman and SERS spectral background in a similar way for all spectra, leaving the analytical signal intact, an algorithm was programmed in MatLab 7.0.1 based on [71,72]. Background correction was possible by minimizing the following S function:
S = ( i ) κ i ( y i z i ) 2 + λ ( i ) ( Δ 2 z i ) 2
where y is the signal intensity for each i wavenumber, z is the baseline, λ is the smoothing parameter, and p is the asymmetric parameter as κi = p if yi > zi and κi = 1 – p otherwise. The last term was defined as follows:
Δ 2 z i = ( z i z i 1 ) ( z i 1 z i 2 )
The two parameters needed for the calculations, p and λ, were set to 103 and 10−3, respectively. However for the diazonium-salt-based system during the detection of BaP, the λ value was set to 104 to remove fluorescence induced by impurities. Figure S1 illustrates the background removal process.

3. Results and Discussion

3.1. Diazonium Salt Based Surface Functionalization

Surface functionalization by aryldiazonium is a convenient method leading to a robust, grafted organic coating. Grafting can be accomplished by either chemical (spontaneous grafting) [65,66,67,68], electrochemical [62,63,64], or photochemical methods [73,74]. A spontaneous grafting strategy was used in this study to functionalize SERS-active substrates. The substrates were immersed in a diazonium salt (DS-C10H21) solution and incubated at +4 °C for 12 h. The temperature control during the functionalization step is important to drive the covalent grafting and at the same time reduce the rate of spontaneous polymerization [75]. Functionalized substrates were then investigated using SERS. The SERS spectra for DS-C10H21-GNSs are shown in Figure 1. These spectra are presented in real intensities with the SERS spectral background removed using the algorithm detailed in the Material and Methods section. Because the complete characterization of DS-C10H21-GNSs can be found in the literature [61], here we just briefly mention that the recorded spectra have a number of features in the spectral ranges that represent the vibrations related to the aromatic ring (see Figure S2 for direct comparison between the SERS spectra of the grafted phenyl derivative and the Raman spectrum of the synthesized diazonium salt). The peak at 1079 cm−1 for DS-C10H21 assigned to the C-H in-plane bending mode coupled with the C-N stretching mode [76] constitutes the signature of the coating. Thus, this peak was used as an internal reference during the quantitation of the detected pollutants. Moreover, this peak does not overlap with the Raman signature of the targeted pollutants (see Figure 1), providing further support for selecting this internal reference.

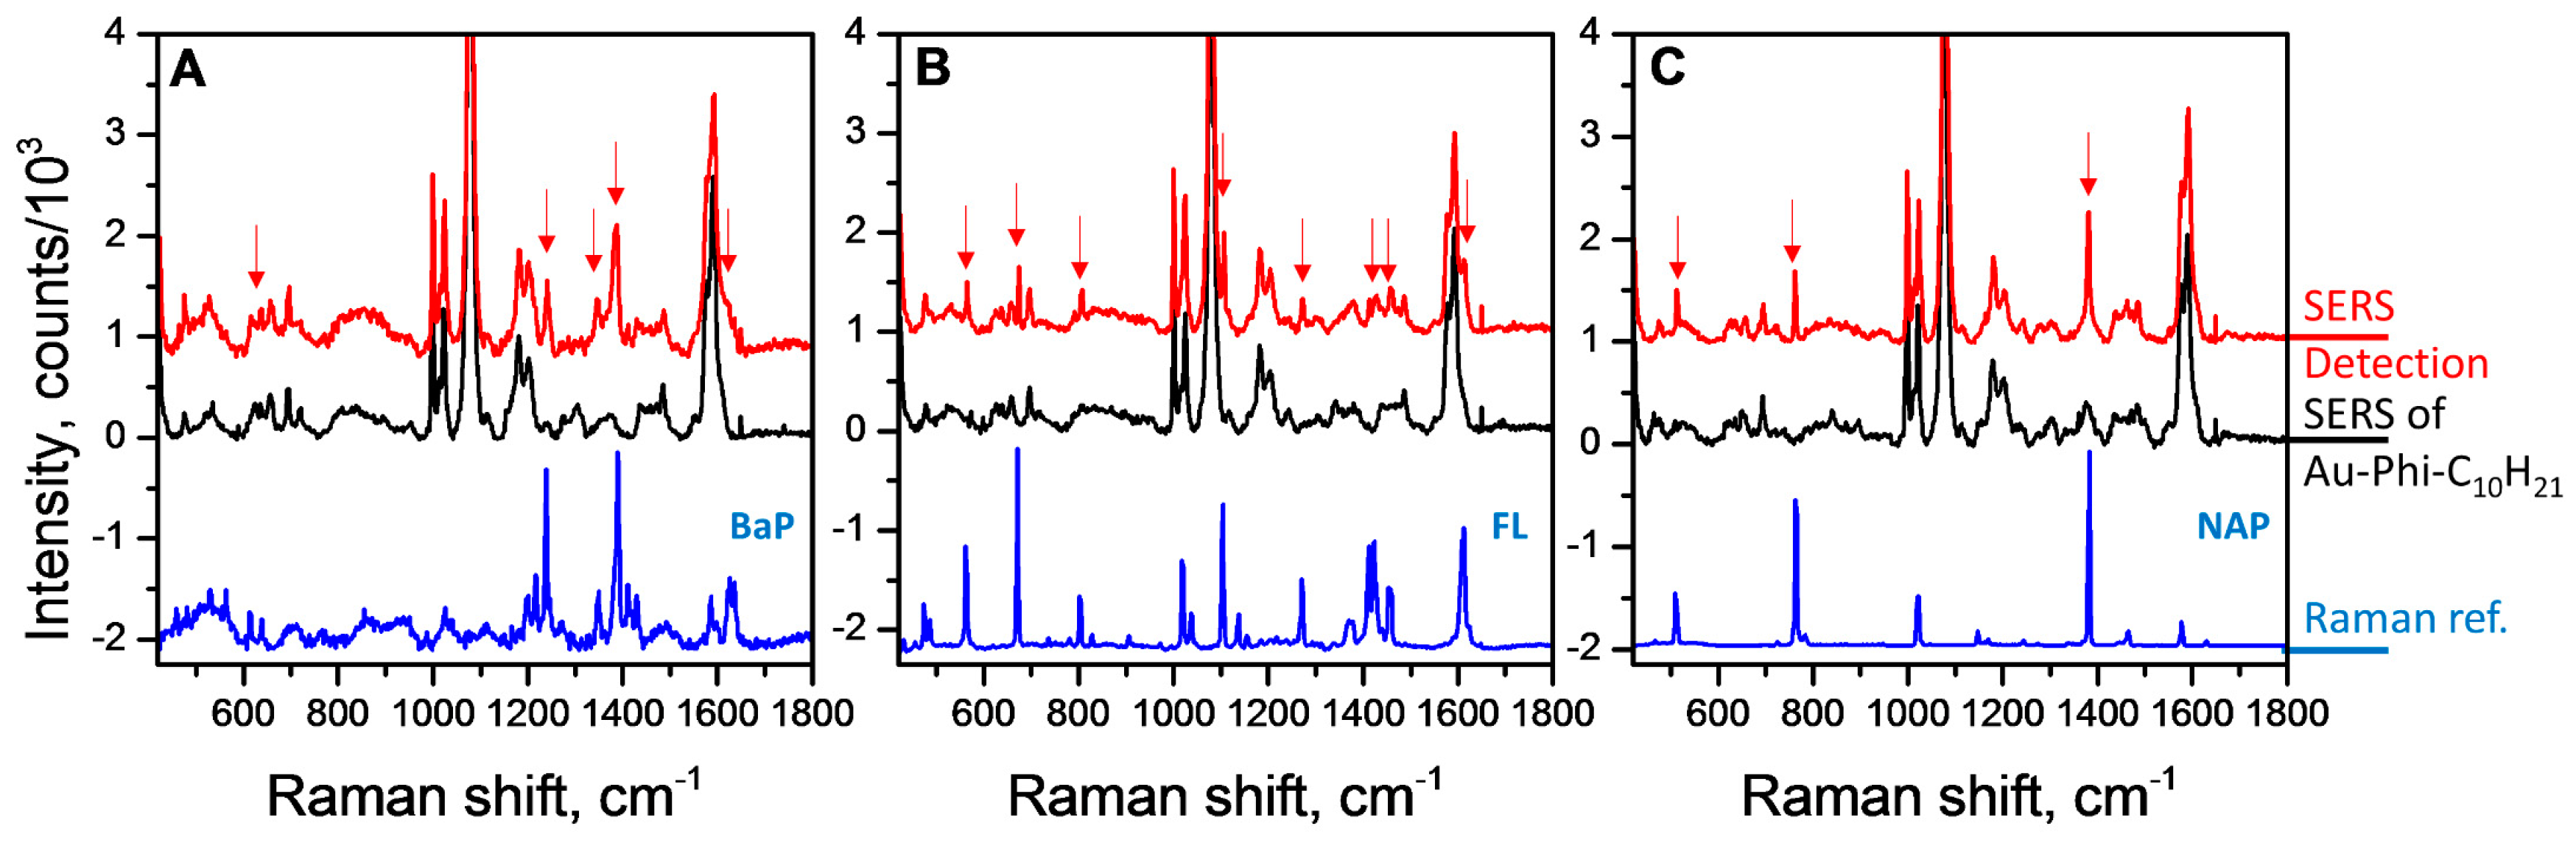
3.2. Detection of PAHs

Diazonium-salt-based SERS substrates were then evaluated on the sensing of the targeted compounds. Thus, functionalized SERS substrates were incubated in pollutant solutions for 30 min. Investigated concentrations for the initial test were 0.75 mg L−1 for BaP, 5 mg L−1 for FL, and 50 mg L−1 for NAP. After incubation, SERS spectra were measured in six different randomly selected areas on the substrates, covering the entire substrate surface. Averaged spectra for BaP, FL, and NAP detection are shown in Figure 1A–C, respectively. All SERS spectra are presented with removed background.
The successful preconcentration and sensing of the targets by the DS-C10H21-based SERS sensor was validated after the observation of characteristic fingerprint peaks of each pollutant as summarized in Table 2.
The interaction between the analyte and the coating layer did not induce important shifts in the position of the pollutant peaks. Hence, most of the peak positions were nearly identical to those of the Raman reference spectra. However, in the case of the preconcentration of BaP (Figure 1A), the peak at 1236 cm−1 corresponding to the ring stretching and the C-H stretching modes was found shifted 3 cm−1 upwards towards higher wavenumbers after adsorption on the nanosensor surface, whereas the peak observed at 1389 cm−1 assigned to C-C ring stretching shifted 4 cm−1 downwards to lower wavenumbers. Spectral differences mostly related to the vibrational mode intensities were observed for FL (Figure 1B). For instance, the peaks around 1400 cm−1 were very weakly enhanced in the SERS spectrum. Such weak spectral modifications may be due to weak interactions between the pollutants and the functionalization layer.

3.3. Sensing Performance

After having first proven the ability of the developed DS-C10H21-based nanosensor to preconcentrate (the targeted) compounds, calibration curves were established to compare the analytical performance of the nanosensor for each pollutant. To do so, the substrate was fixed on the microfluidic cell of the Raman set-up and solutions with increasing concentrations of pollutants were injected onto the substrate at a flow rate of 3 µL min−1 for 30 min for each solution.

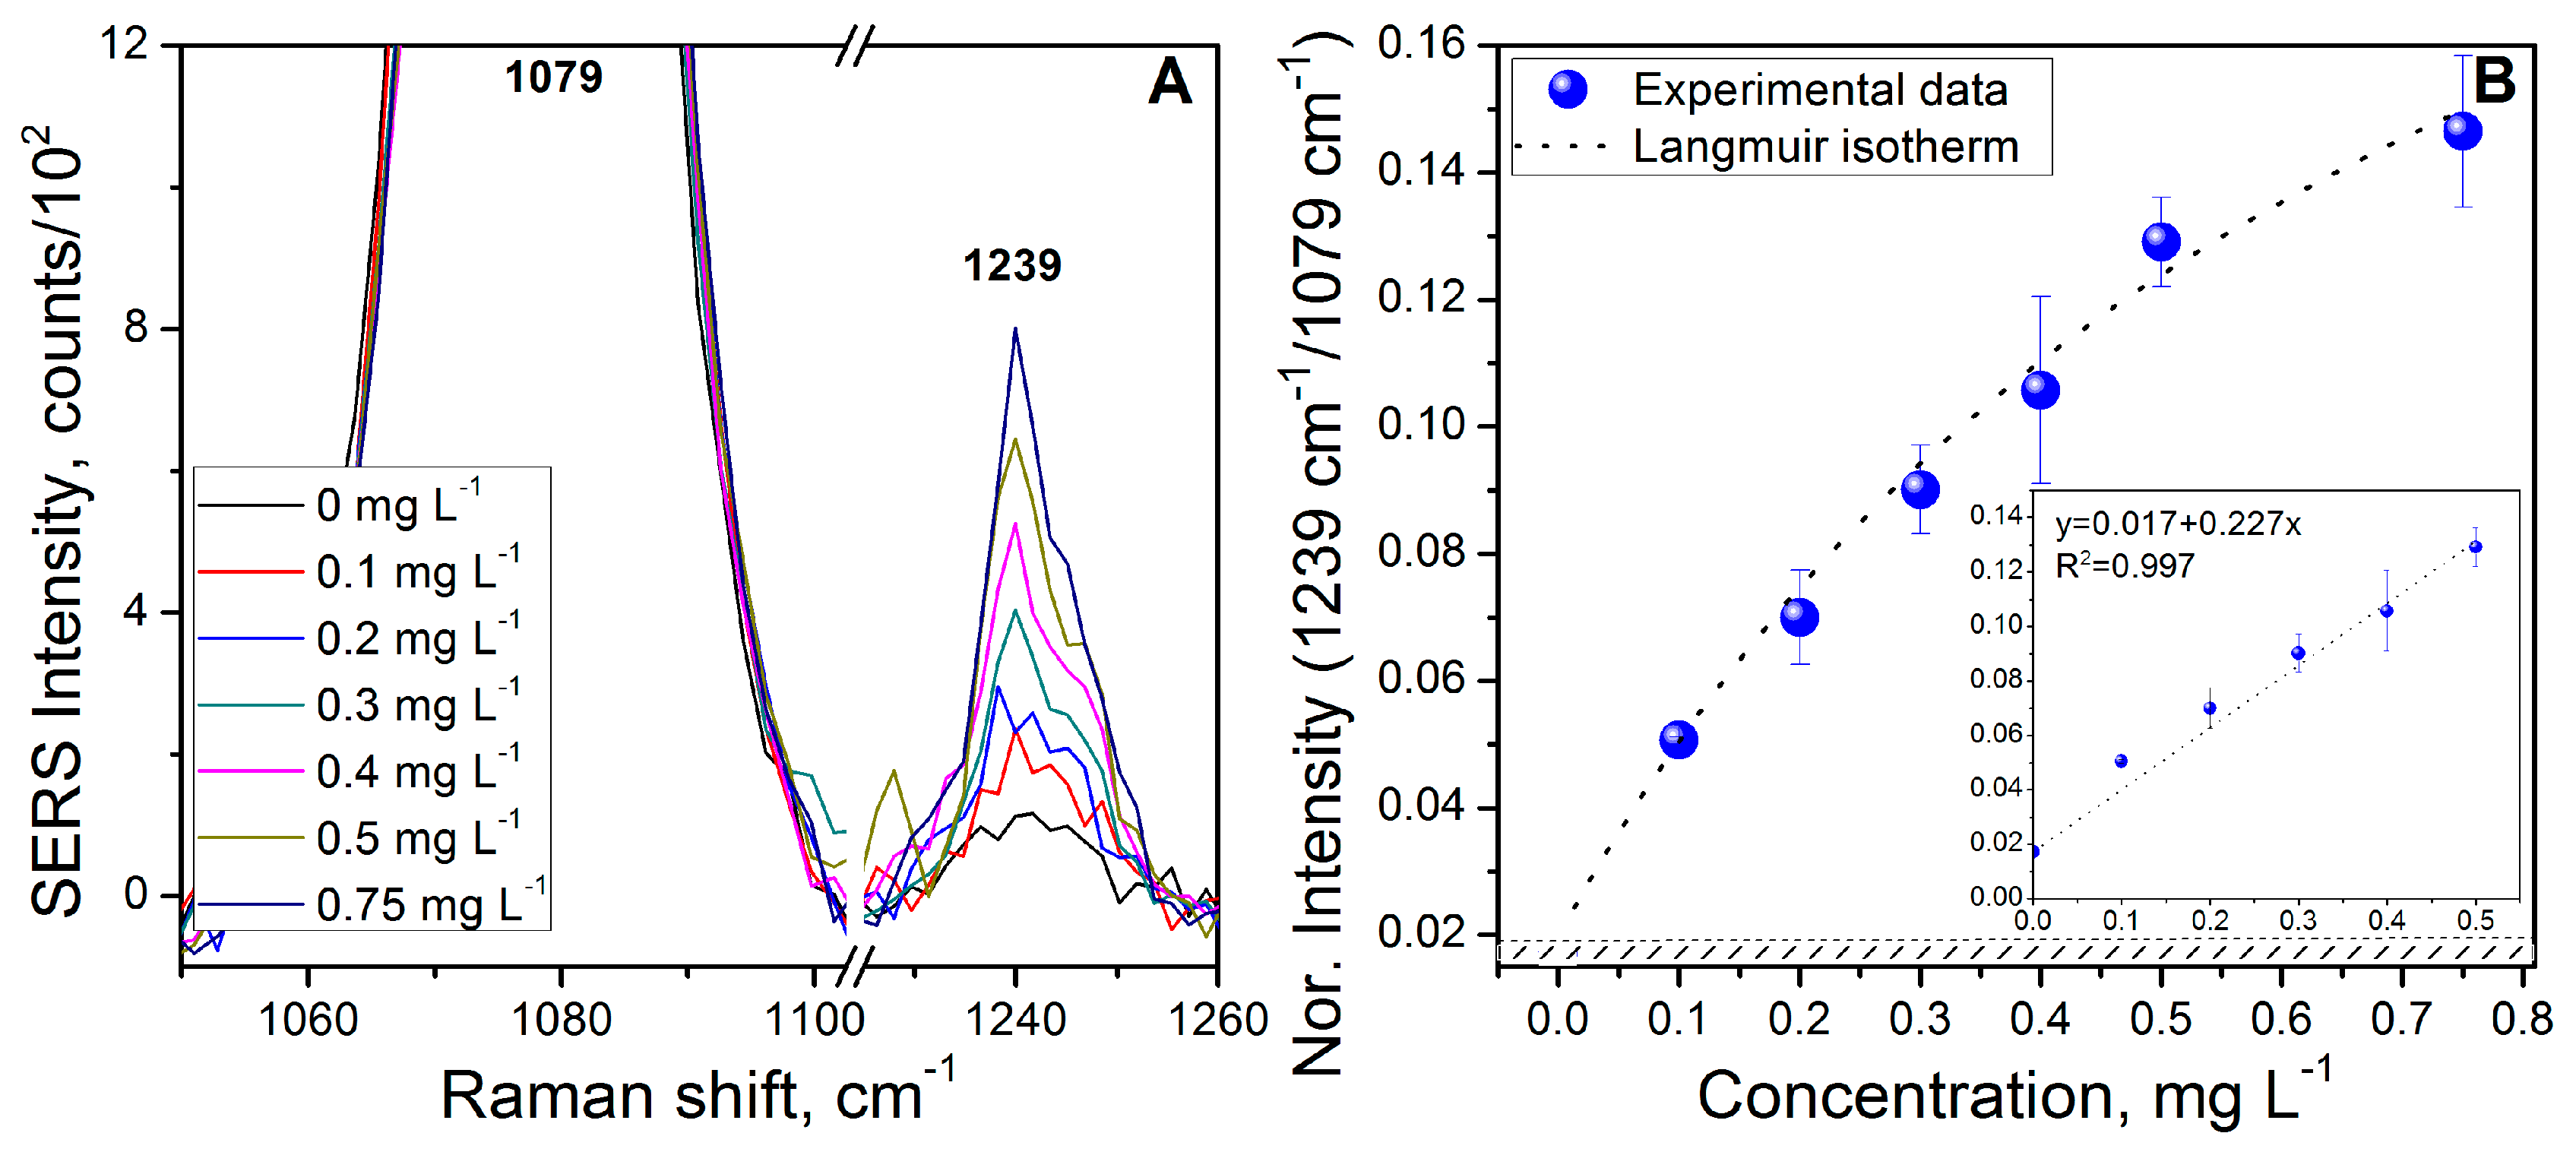
3.4. Benzo[a]pyrene (BaP) Calibration Curve

BaP solutions with concentrations increasing from 0.1 mg L−1 to 0.75 mg L−1 (0.4–3.0 µmol L−1) were tested to establish the calibration curve. Between each concentration, SERS measurements were carried out on six different areas on the surface. Averaged spectra are shown in Figure 2A, focusing on the peak of BaP at 1239 cm−1 (the full spectral range of averaged SERS spectra can be seen in Figure S3). The calibration curve was plotted using the relative intensity of this peak compared with the intensity of the characteristic peak of the coating (i.e., the peak at 1079 cm−1) as a function of the analyte concentration (Figure 2B).
The calibration curve was then fitted using the Langmuir adsorption isotherm expressed as follows:
I = I m a x K c 1 + K c
where I is the normalized SERS intensity, K is the adsorption constant, and c is the analyte concentration.
The calibration plot was found to be linear over the range of 0.1–0.5 mg L−1 (0.4–2.0 µmol L−1) but surface saturation was not reached. The limiting factor was the solubility of BaP in the milli-Q water-MeOH (9:1 volume ratio) solution.
The slope of the linear regression on the low concentrations (insert in Figure 3B) was used for the calculation of the LOD and the LOQ. LOD is defined as the lowest concentration of analyte in the sample that can be detected [79] and can be calculated using the following formula [80]: LOD = 3 σ/s, where s is the slope of calibration curve and σ is the standard deviation of the blank response. LOQ is the lowest concentration of an analyte that can be determined with acceptable precision and accuracy. LOQ was calculated using the same formula that was used for the calculation of LOD with a confidence level increased to 10: LOQ = 10 σ/s. The calculated LOD and LOQ for BaP were 0.026 mg L−1 (0.10 µmol L−1) and 0.087 mg L−1 (0.34 µmol L−1), respectively (Table 3).

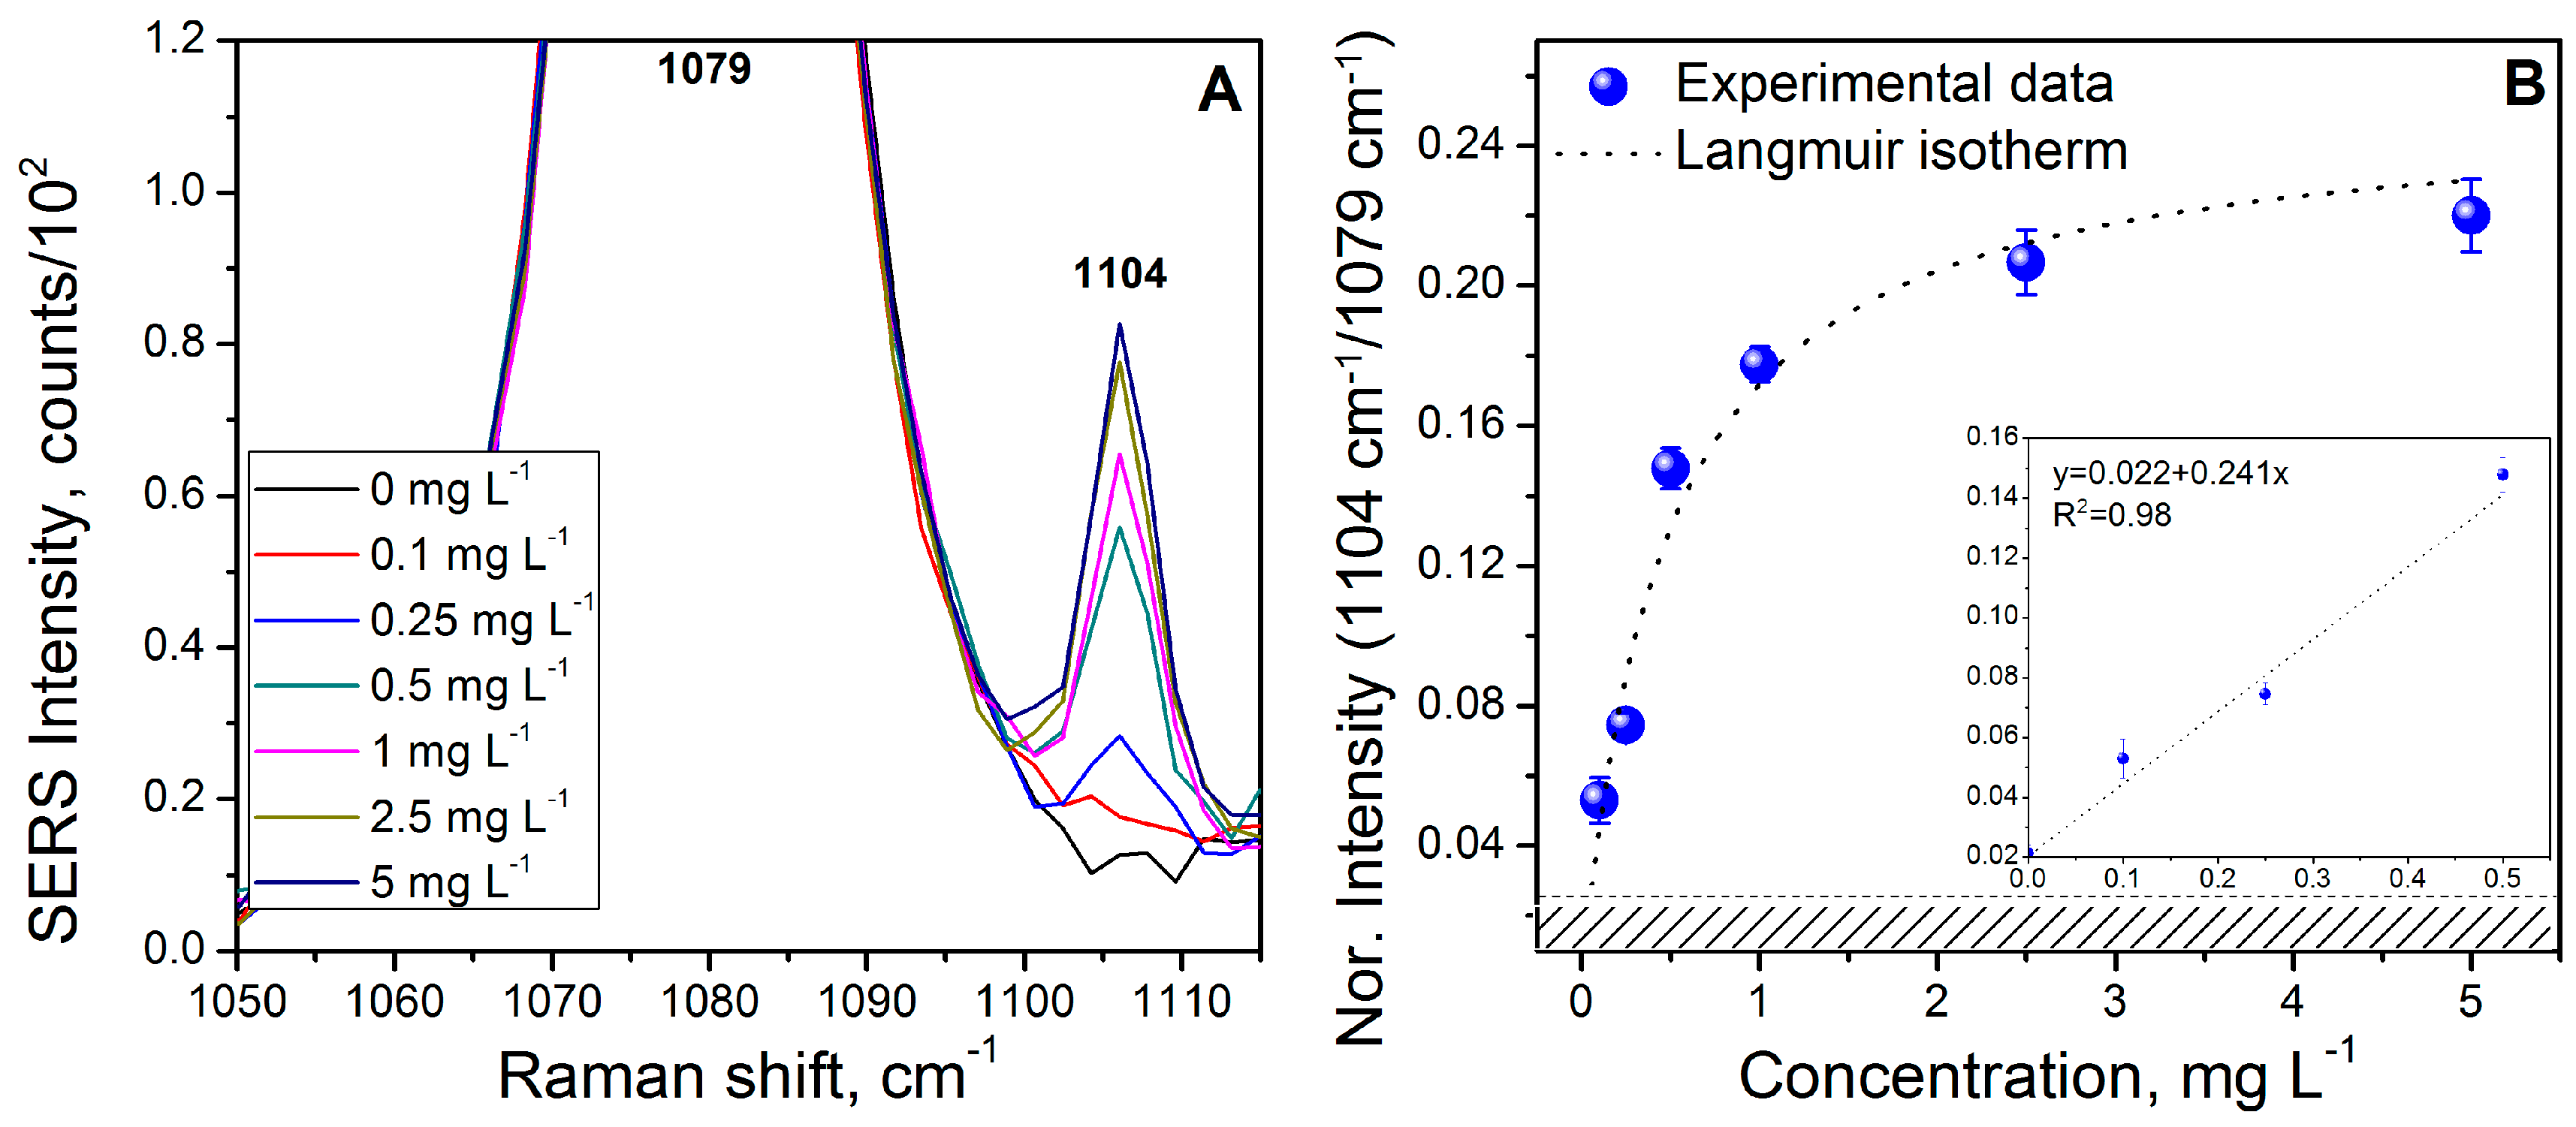
3.5. Fluoranthene (FL) Calibration Curve

The calibration curve for FL was performed using the same protocol as that for BaP. In comparison with BaP, the investigated concentrations of FL ranged from 0.1 mg L−1 to 5 mg L−1 (0.5–25 µmol L−1) due to its higher solubility (see Table 1). As before, between each concentration, SERS was measured on six different areas on the surface. Averaged spectra are shown in Figure 3A, focusing on the peak at 1104 cm−1 (the full spectral range of the averaged SERS spectra is given in Figure S4). Assigned to the FL C-C in-plane stretching mode, this peak was the most intense band observed in the SERS spectrum (Figure 1B). It was thus selected to establish the calibration curve (Figure 3B), in which the relative intensity of this peak compared with the intensity of the peak at 1079 cm−1—characteristic of the diazonium salt DS-C10H21—was plotted as a function of the FL concentration.
At values greater than 3 mg L−1, there is a plateau, indicating that the adsorption equilibrium was reached. The calibration curve can be considered linear in the range of 0.1–0.5 mg L−1. The LOD of FL was calculated to be 0.064 mg L−1 (0.32 µmol L−1). The calculated LOQ value was 0.214 mg L−1 (1.06 µmol L−1).

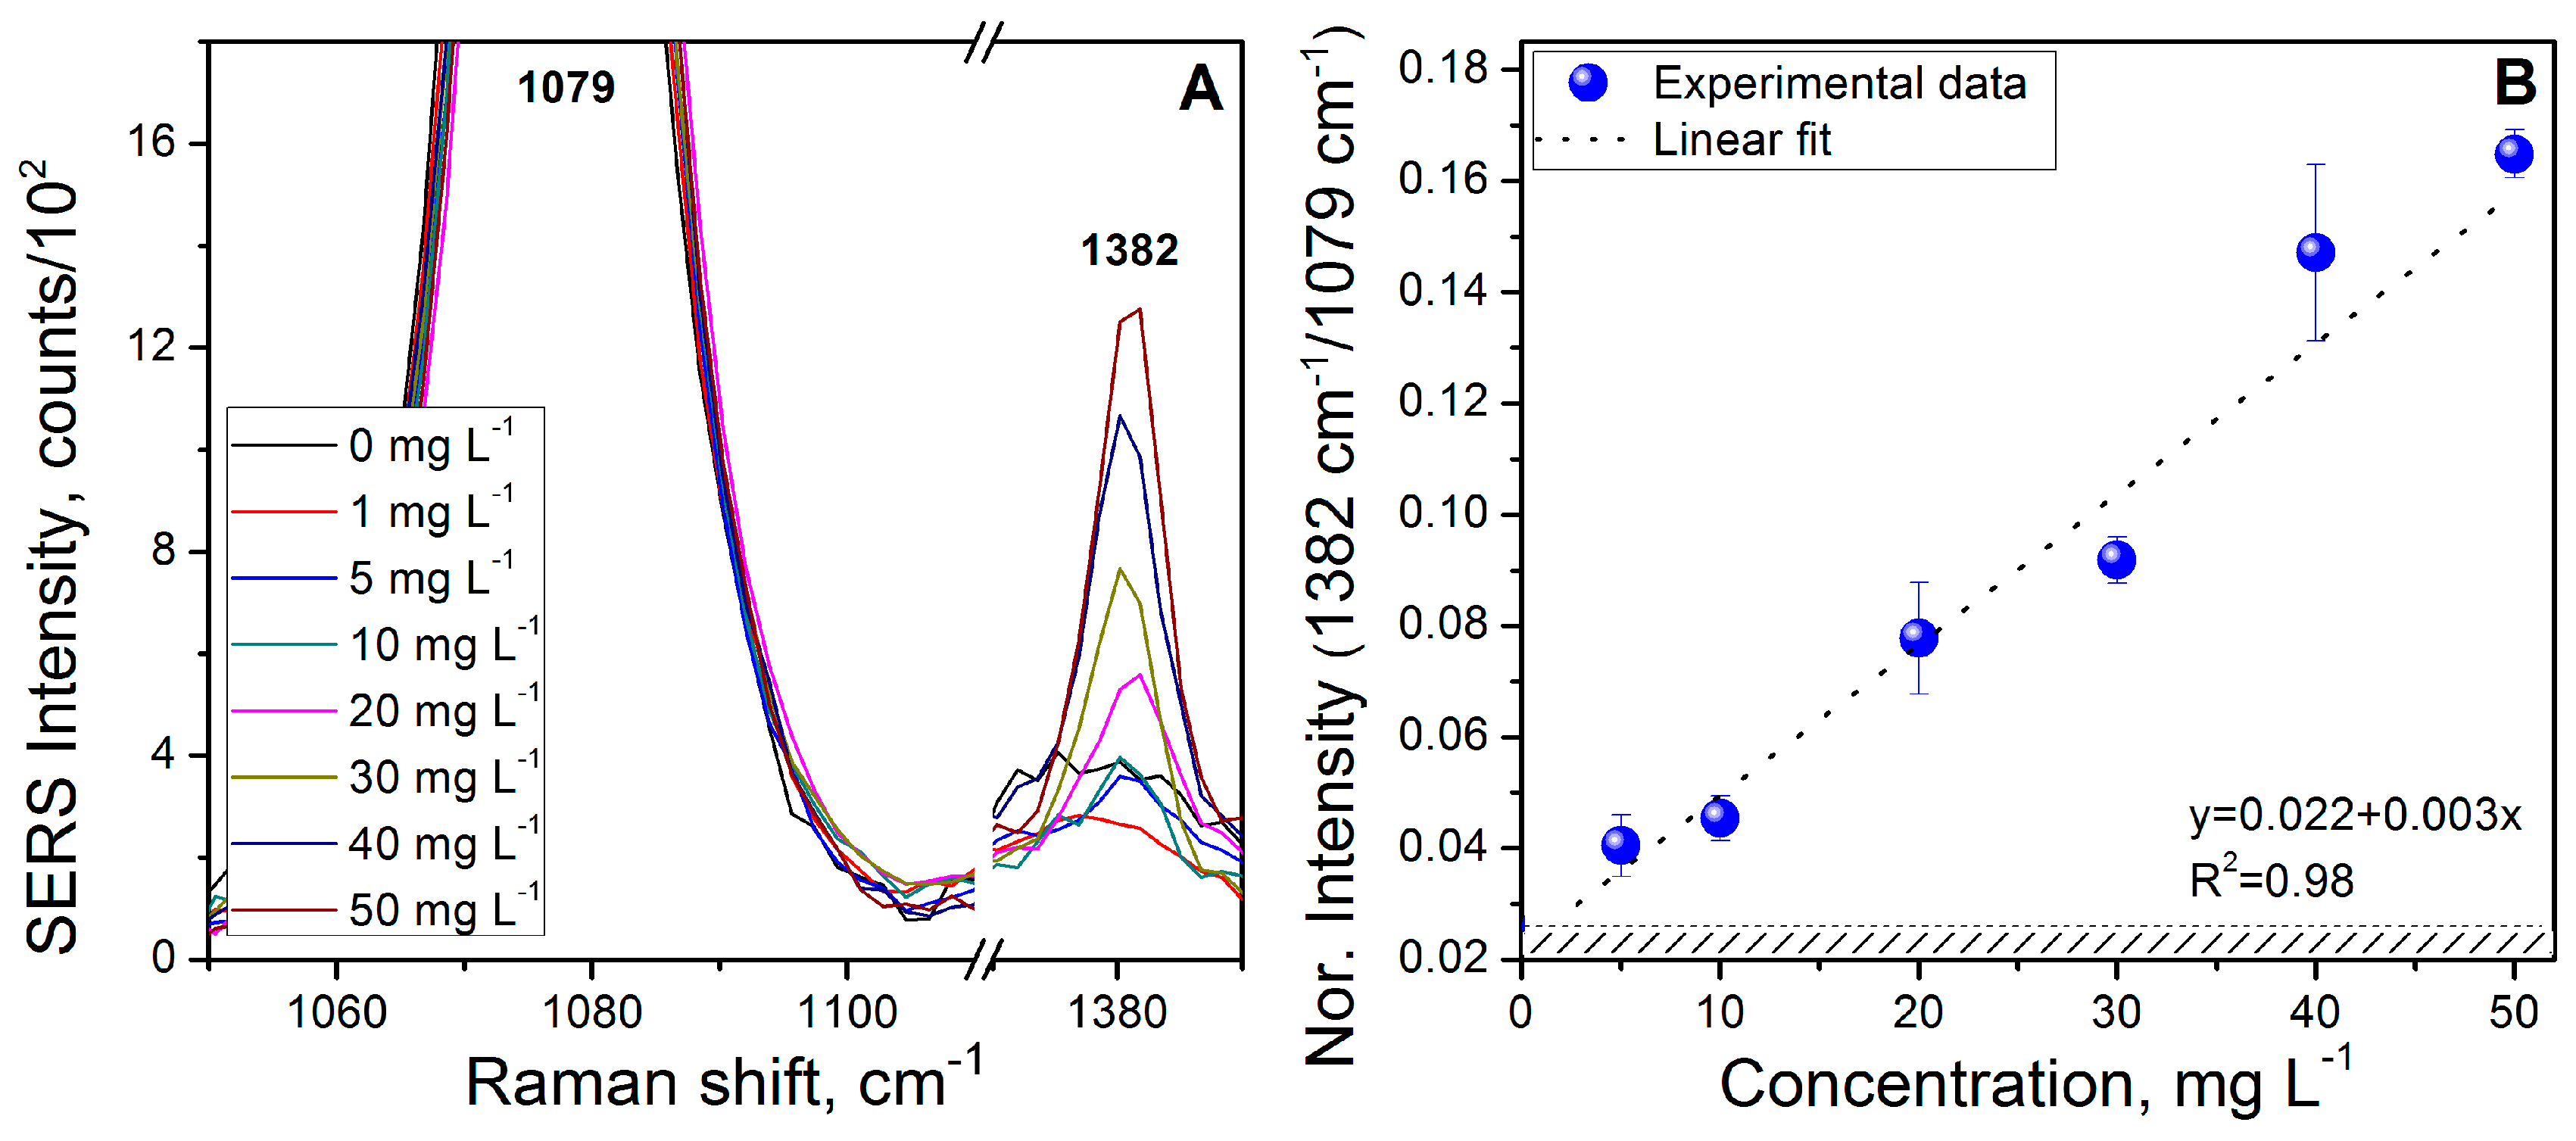
3.6. Naphthalene (NAP) Calibration Curve

For the study of NAP pre-concentration and detection, SERS measurements were carried out as previously described in milli-Q/MeOH (9:1 v/v) media containing different concentrations of NAP ranging from 1 mg L−1 up to 50 mg L−1 (7.8–390 µmol L−1). NAP peaks observed in the SERS spectra are shown in Figure 1C and summarized in Table 2. Figure 4A focuses on the increase in the intensity of the peak located at 1382 cm−1, assigned to the C=C stretching mode (the full spectral range averaged SERS spectra are shown in Figure S5). This peak was chosen to establish the calibration curve shown in Figure 4B since it is the only one that does not overlap with the vibrational signature of the grafted diazonium salt.
The calibration curve was found to be linear over the investigated range. The calculated LOD and LOQ values were 3.9 mg L−1 (30 µmol L−1) and 13 mg L−1 (0.1 mmol L−1), respectively (Table 3).

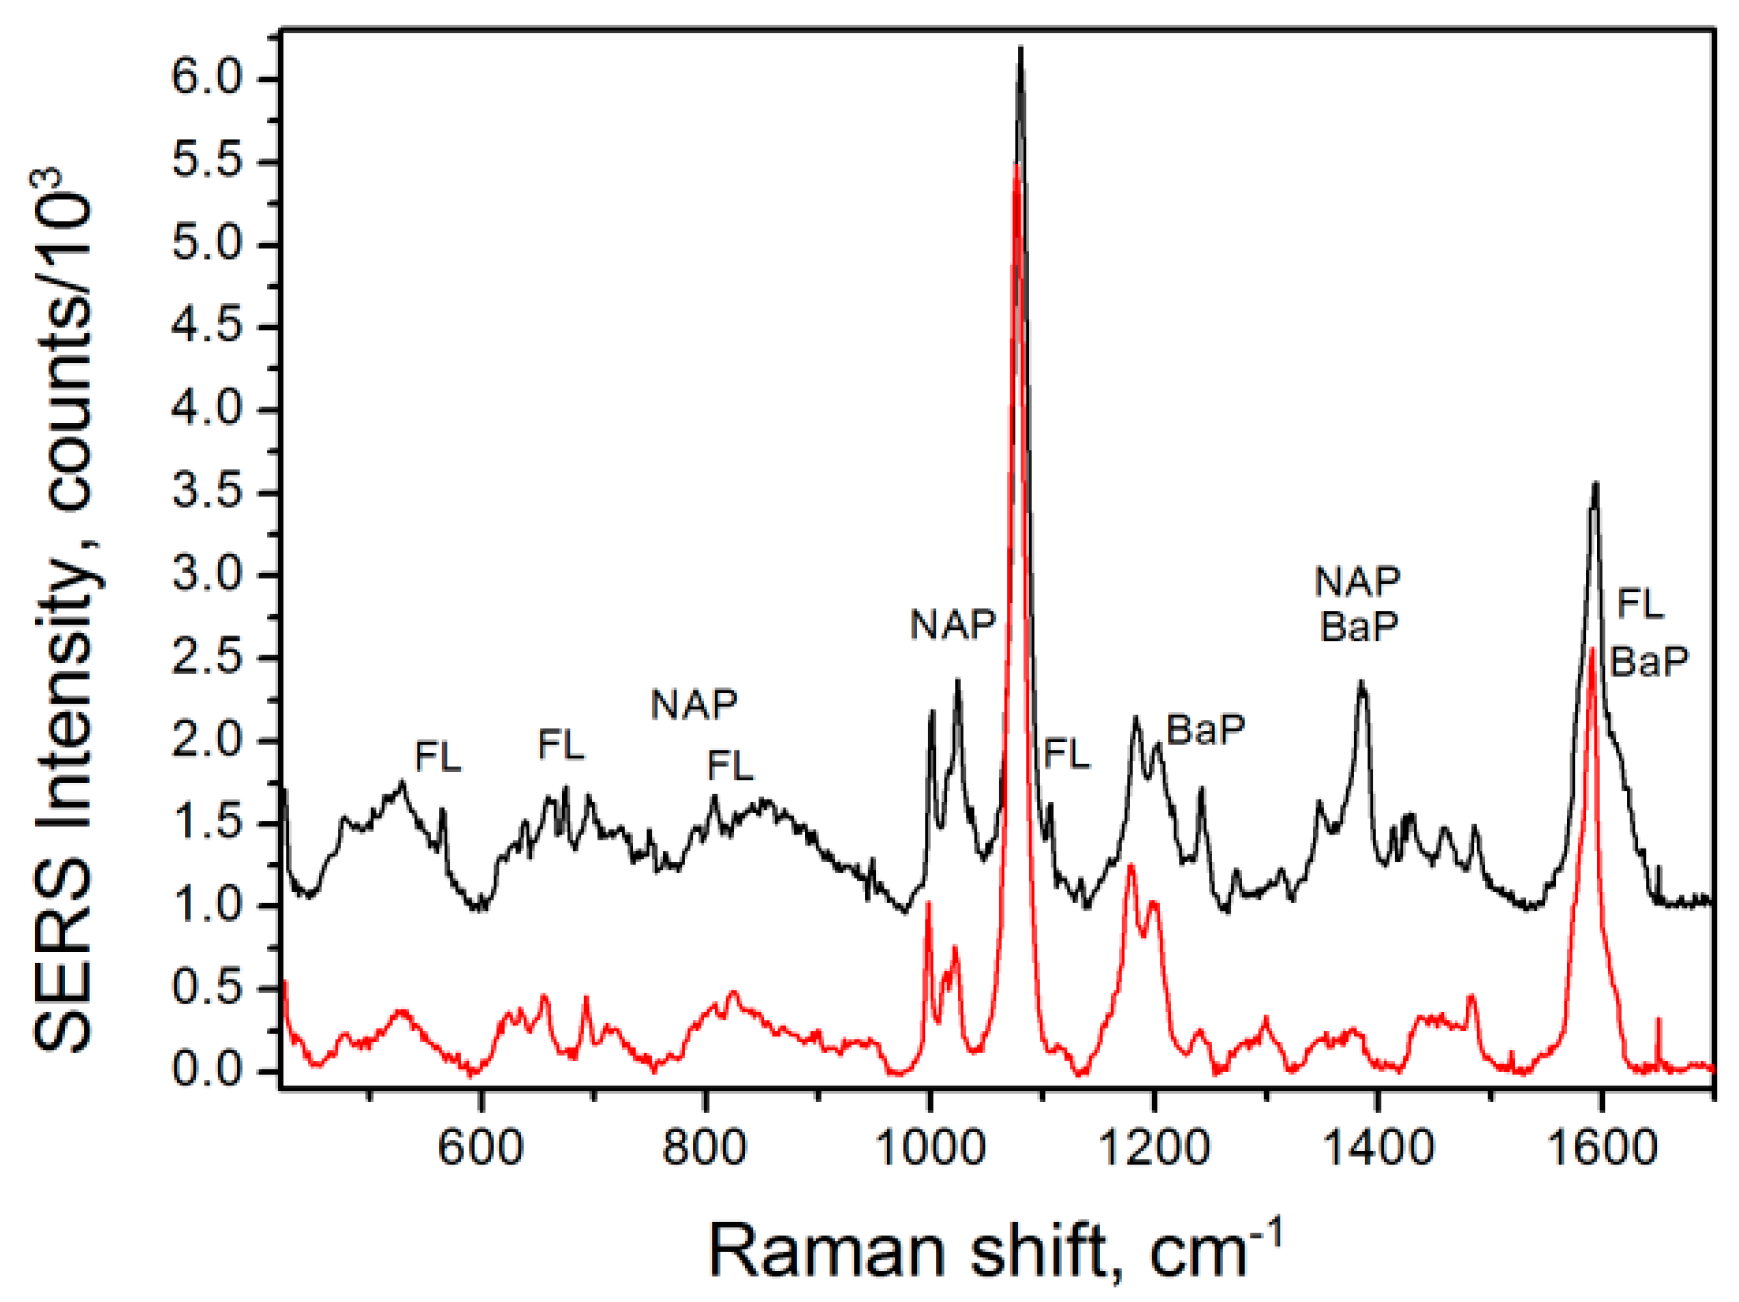
3.7. Analysis in a Mixture of Analytes

An experiment using a mixture of the three investigated pollutants was performed to further assess the feasibility of the designed nanosensor for PAHs sensing in water samples and to demonstrate the SERS spectra suitability for on-site screening purposes. For this experiment, a mixed solution of BaP (0.75 mg L−1, 3.0 µmol L−1), FL (5 mg L−1, 25 µmol L−1), and NAP (5 mg L−1, 39 µmol L−1) was prepared in pure water-MeOH (9:1 volume ratio) media. The concentration of BaP was notably lower due to the solubility issue discussed above. The SERS substrate was exposed to the prepared mixture for 30 min before starting SERS measurements. The averaged SERS spectra obtained before and after substrate exposure to the pollutants are shown in Figure 5. At the selected concentrations, BaP and FL were detected and well identified. However, most NAP peaks overlapped either the signal of the coating (i.e., at 1022 cm−1) or the signal of the other analytes (i.e., the peak used for establishing the calibration curve for NAP at 1382 cm−1 was found combined with the signal of BaP). Nonetheless, it showed one weak, but characteristic peak at 762 cm−1. Together, these results demonstrate that the SERS nanosensor can detect the different pollutants in a mixed solution and that we can clearly identify them by using their spectral signatures. However, the quantitation of BaP, FL, and NAP in the mixture is more problematic, as discussed below.

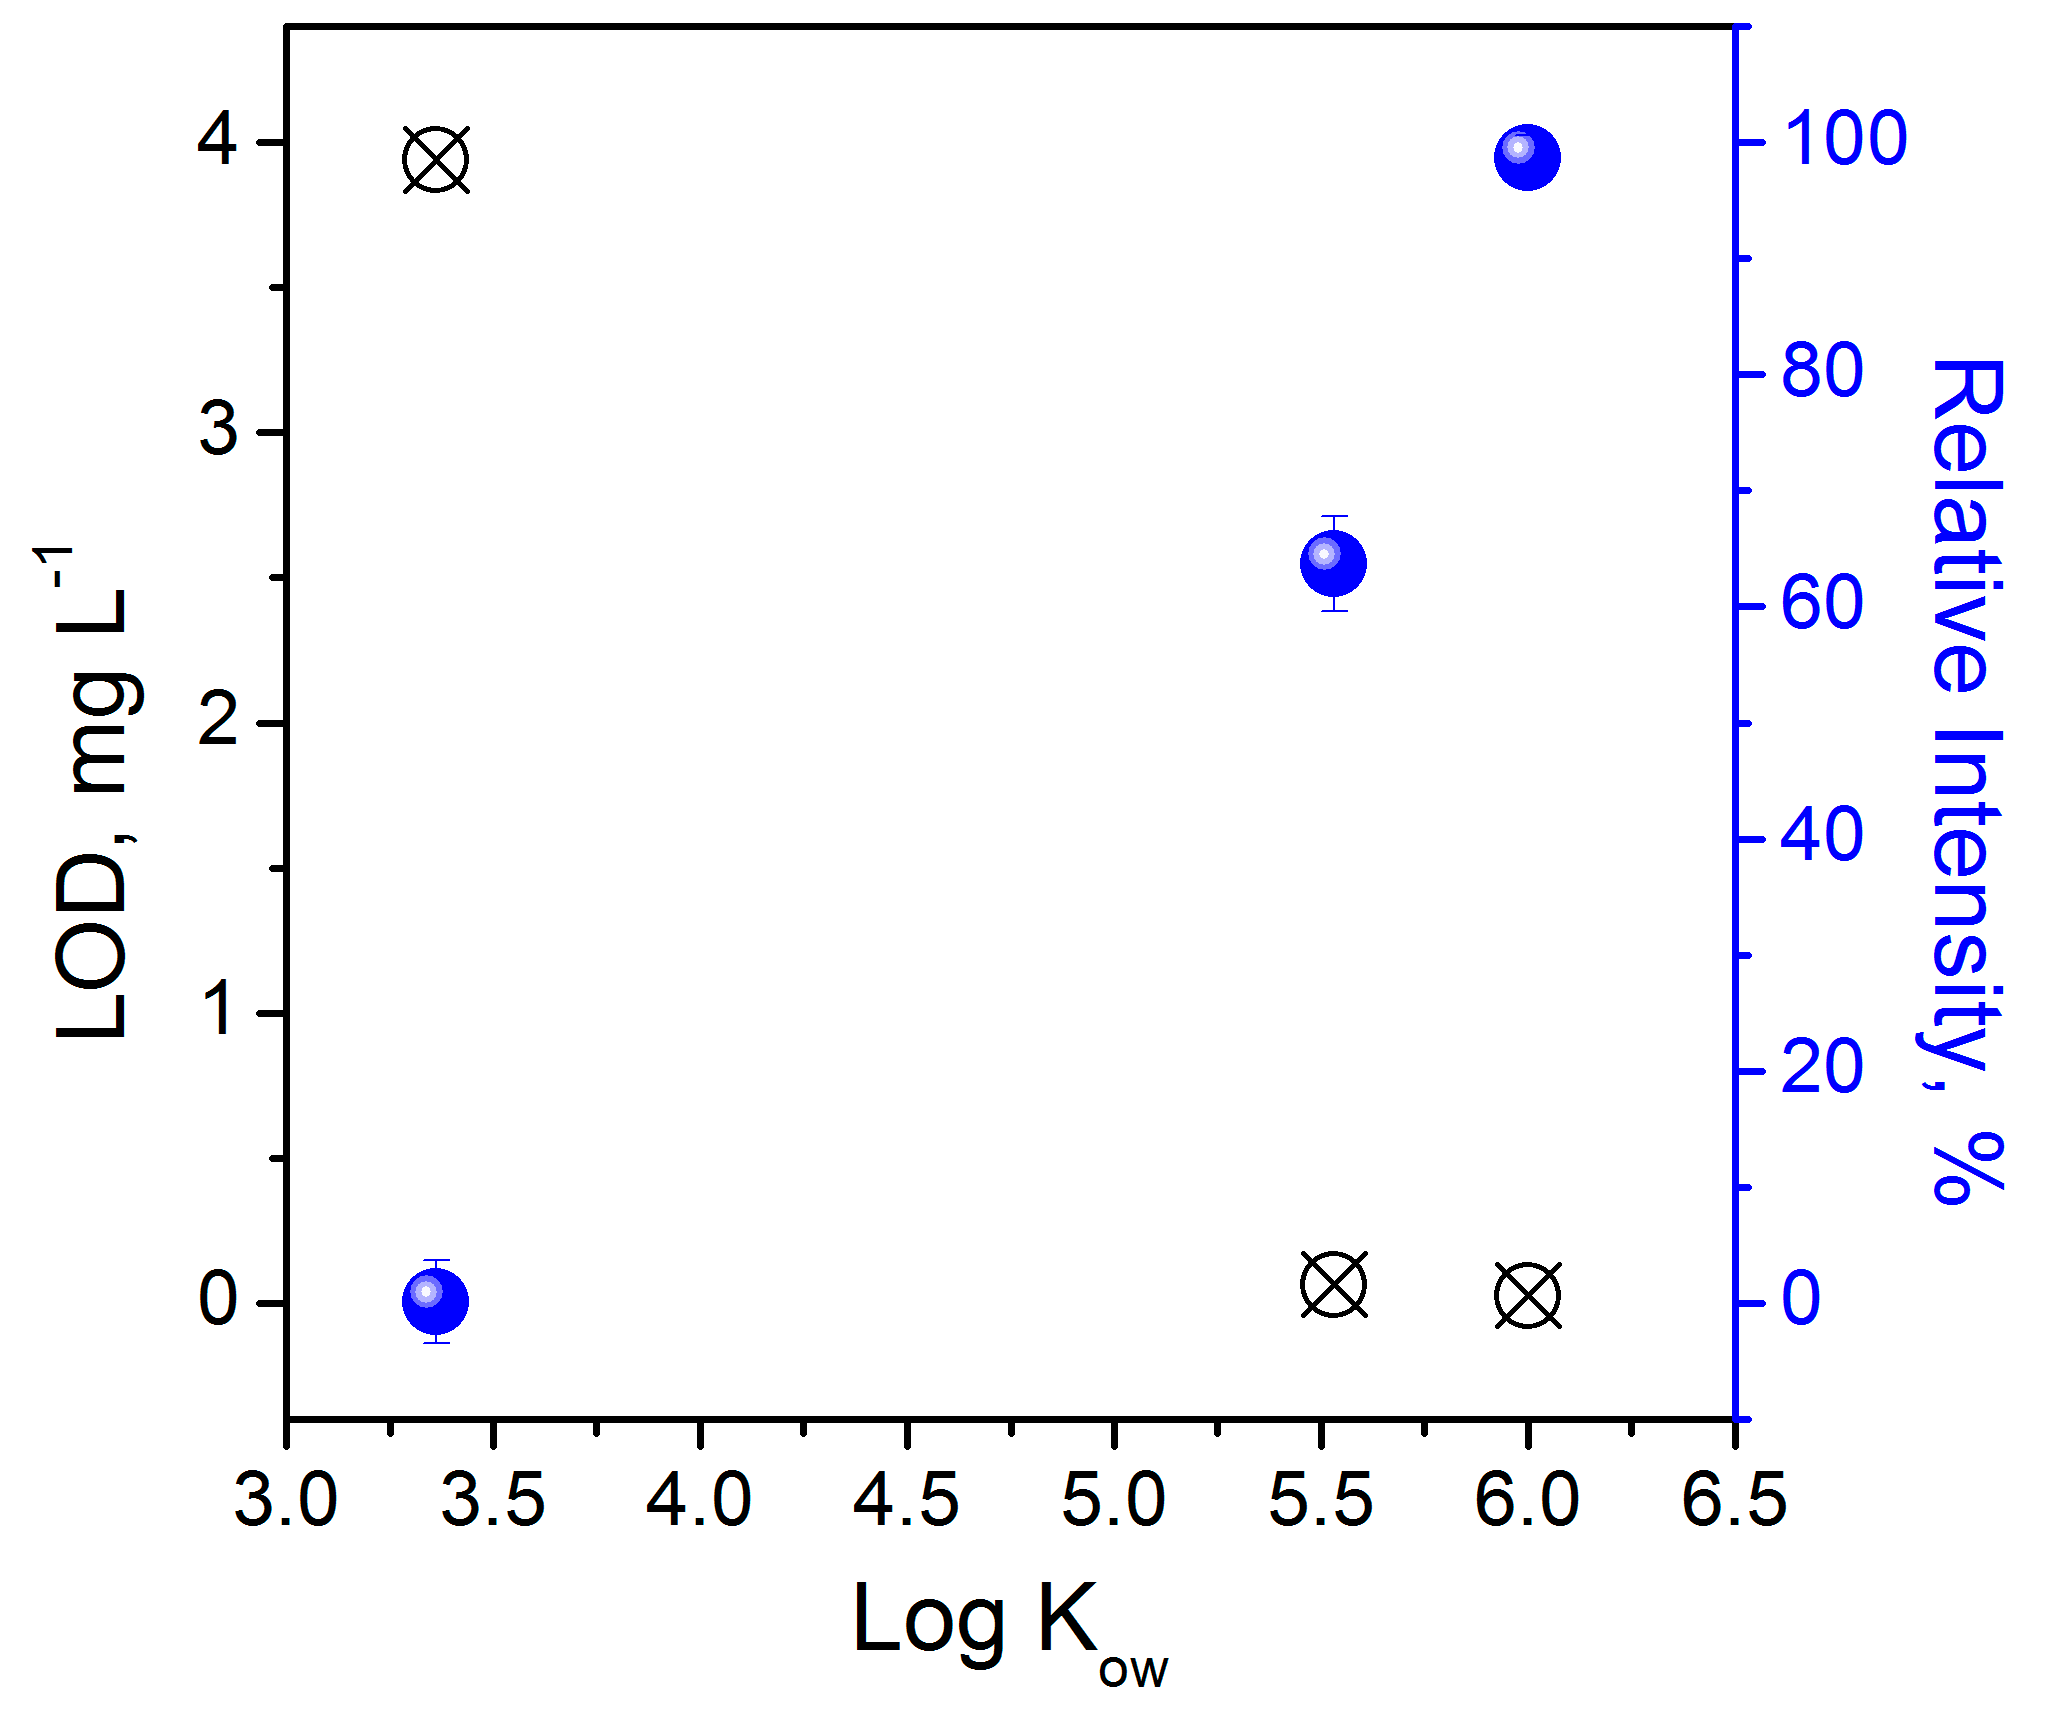
3.8. Feasibility of the Nanosensor for Sensing Polycyclic Aromatic Hydrocarbons

The results obtained on targeted pollutants in their individual solutions and in mixture provide important information on (i) the sensor effectiveness for PAH sensing and (ii) the sensor selectivity for BaP, FL, or NAP. First, the LOD concentrations for the investigated PAH compounds varied by two orders of magnitude (Table 3) between BaP and NAP. The correlation of the observed LOD values versus the log of the Kow factor of the investigated analytes is given in Figure 6. This curve suggests that the hydrophobic coating of the sensor is more suitable for the preconcentration of highly non-polar PAH compounds.
This relationship is confirmed by the results obtained from the detection of pollutants in the mixed solution. Figure 6 shows the relative SERS intensity of the pollutant peaks calculated as follows:
R e l a t i v e   I n t e n s i t y ( % ) = 100 % I P e a k   o f A n a l y t e I P e a k   o f   D S C 10 H 21 I P e a k   o f   D S C 10 H 21 I P e a k   o f A n a l y t e
where I’ is the SERS intensity of the selected peaks measured in the mixed solution and I is the SERS intensity of the peaks measured for each individual PAH at the same concentration as that used in the mixed solution (0.75 mg L−1 for BaP and 5 mg L−1 for FL and NAP). The peaks used for this calculation are those used for the establishment of the calibration curves (the peak of DS-C10H21 at 1079 cm−1 and the peaks at 1239 cm−1, 1104 cm−1, and 1382 cm−1 for BaP, FL, and NAP, respectively). With this formula, the relative SERS intensity of the PAH signal obtained in the mixed solution was directly compared with the relative SERS intensity given by the calibration curve for the same pollutant concentration and it was then expressed as a percentage. For instance, for BaP, at a concentration of 0.75 mg L−1, the relative intensity of the peak at 1239 cm−1 measured in the calibration curve and in the mixed solution were found to be almost identical, leading to a calculated relative intensity of 98.7%. This value shows that the adsorption of BaP onto the nanosensor surface was not restricted by the presence of competitive analytes. The FL calibration curve indicates that at a concentration of 5 mg L−1, the adsorption equilibrium was reached with a maximum relative intensity of 0.22 ± 0.01. At the same concentration, FL in the mixed solution exhibited a relative intensity of 0.140 ± 0.012. This corresponds to 64% of the relative intensity reached with FL alone. The calculation of the NAP signal recorded in the mixed solution was more challenging. Due to the low intensity of the non-overlapping peak, it was not possible to quantify the intensity with the same formula. The approximate contribution of NAP was calculated indirectly. Since NAP and BaP both have peaks around 1382 cm−1, we subtracted the SERS spectra of BaP detection at 0.75 mg L−1 concentration from that measured in the mixed solution. The relative intensity of NAP was then found to be 0.14%.
The calculated relative intensities of the PAHs peaks in the SERS spectra obtained in the mixed solution confirmed that the strength of the interaction between the coating layer and the analyte have a strong influence on the preconcentration and thus on the detection of the analytes. Highly hydrophobic molecules having a high Kow value will be easier to detect and will exhibit lower LOD. Moreover, the SERS nanosensor allowed the detection of BaP with a sensitivity comparable to the detection carried out using colloidal nanoparticles [81,82].

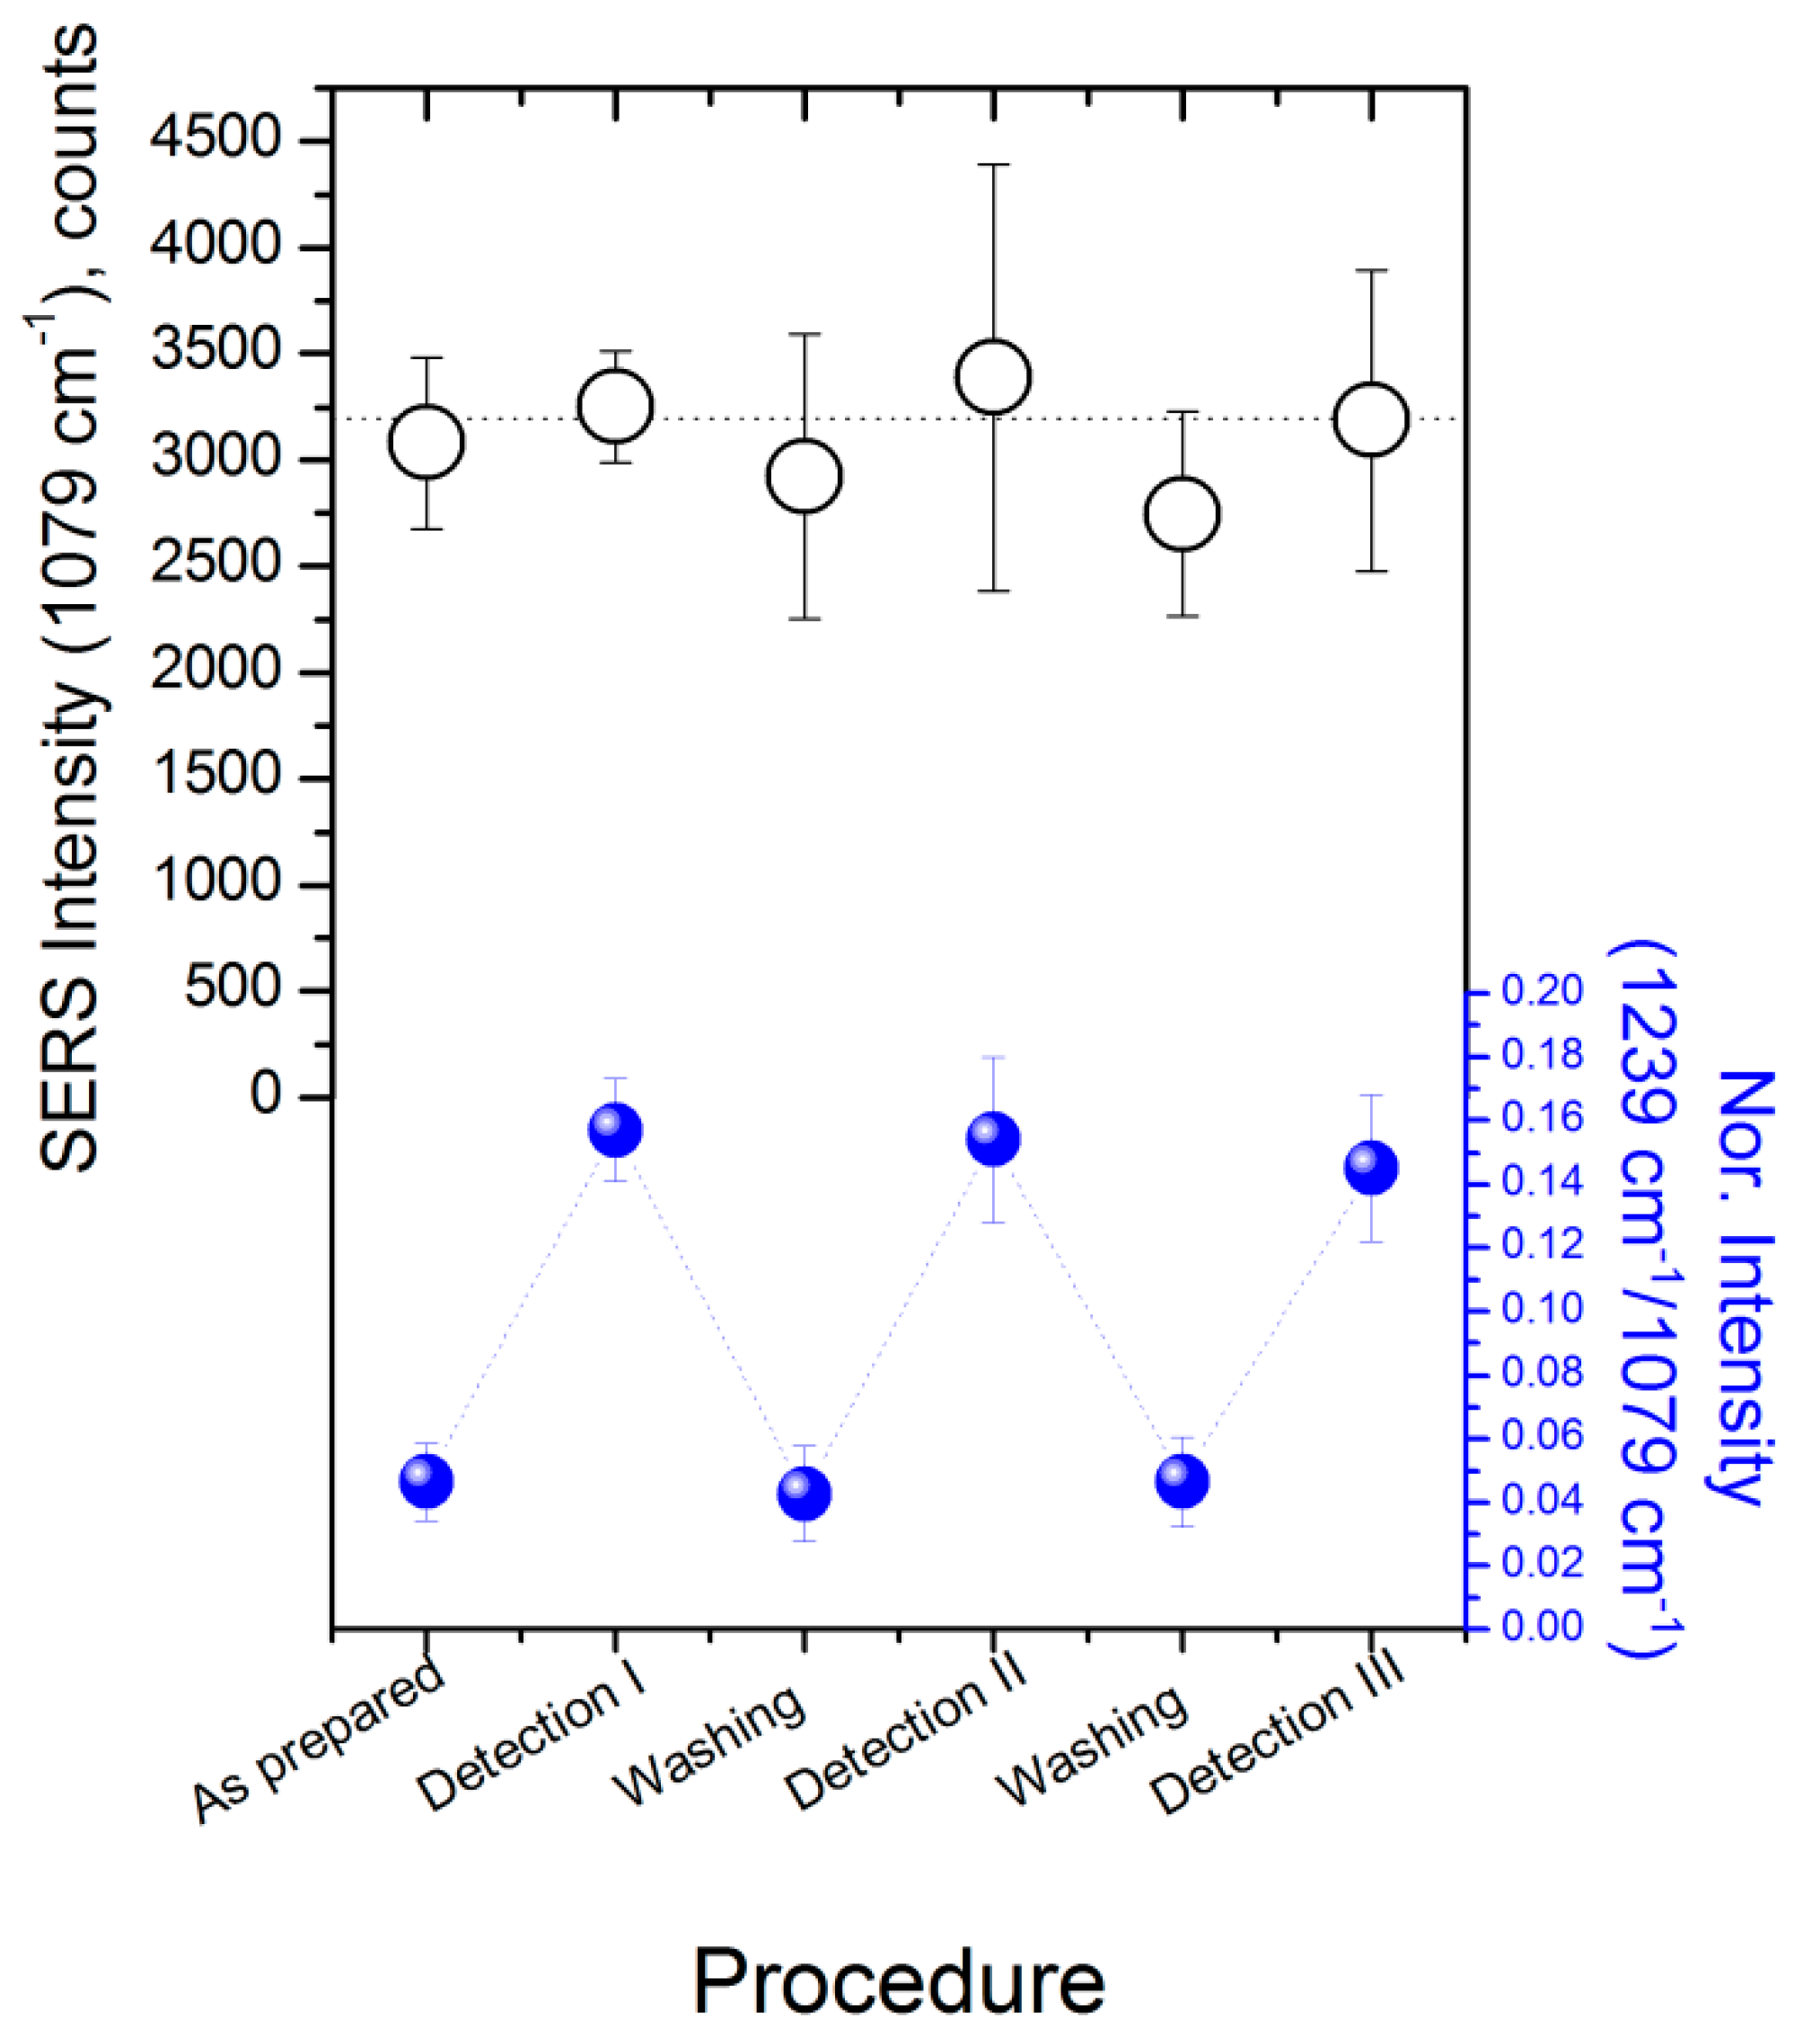
3.9. Surface Regeneration

To demonstrate the reusability of the developed nanosensor, we performed regeneration experiments using a pure MeOH solution to remove the adsorbed PAHs from the sensor surface. For each step of regeneration, MeOH was injected and circulated in the fluidic cell for 30 min. To determine the impact of the surface regeneration step on the nanosensor performance, we screened for BaP at a concentration of 0.75 mg L−1. For this demonstration, BaP was selected for its strong interaction with the coated layers (as discussed above). Figure 7 summarizes the results of (i) SERS signal intensities for the peak at 1079 cm−1 assigned to the DS-C10H21 coating and (ii) the SERS intensity ratio between the peak of BaP at 1236 cm−1 and the peak of the DS-C10H21 coating for each experimental step (detection and washing). The surface regeneration process did not affect the stability of the functionalization layer, and the average intensity of the peak was found to be nearly constant with a variation of 11% between the different experimental steps. Moreover, several cycles of BaP screening show highly reproducible SERS signals of the analyte with an average intensity ratio of 0.152 with a standard deviation lower than 5%. This result demonstrates that the nanosensor surface can be washed and therefore reused several times without affecting the detection efficiency.

3.10. Detection Reproducibility and Repeatability

The high reproducibility and repeatability of the SERS signal of the developed nanosensor is of primary importance for its application to quantitative analyte detection. Statistical analysis was carried out to estimate the repeatability of the SERS signal intensity between various spots on the substrate as well as to define reproducibility between two functionalized nanosensors. For this, SERS spectra of BaP at a concentration of 0.75 mg L−1 were recorded on six individual spots for two substrates. By comparing the calculated relative intensity ratios between the signal of BaP and the signal of the coating (I1236 cm−1/I1079 cm−1), we attained very reproducible targeted pollutant detection. Calculated average values were 0.147 and 0.152 for different substrates with a coefficient of variation of 15% and 13%, respectively. These results indicate that commercially available Wavelet SERS substrates functionalized with a diazonium salt can be considered as a repeatable and reproducible SERS solution. To further demonstrate the suitability of our diazonium salt-SERS solution, we compared it with a popular commercial SERS substrate, Klarite, for which a coefficient of variation of 45% has been reported from the measurement of benzenethiol grafted to the surface [83]. Moreover, the low coefficient of variation observed from spot-to-spot measurements suggests that DS-C10H21 diazonium-salt-based surface functionalization offers robust and homogeneous surface coverage.

4. Conclusions

Here, we demonstrated a novel approach for the decoration of a SERS nanosensor for the reversible and reproducible detection of non-polar pollutants. Diazonium salt (DS-C10H21) was tested for substrate surface functionalization and for subsequent preconcentration of the targeted compounds. Spontaneous DS-C10H21 layer formation was found to be highly reproducible under the operating conditions. During this conceptual study, we demonstrated the detection of BaP, FL, and NAP with LOD values of 0.026 mg L−1 (0.1 µmol L−1), 0.064 mg L−1 (0.32 µmol L−1), and 3.94 mg L−1 (31 µmol L−1), respectively. The LOD concentrations of the detected compounds were strongly correlated with their physicochemical properties. The observed selectivity of the coated nanosensor favoring highly non-polar molecules such as BaP suggests that the preconcentration of aromatic pollutants can be optimized by varying the nature of the aryldiazonium salt used for surface functionalization.
The level of BaP detection obtained in this study is comparable with that documented in the literature using colloidal nanoparticles. Given that the major drawback of colloidal nanoparticles’ application for pollutant monitoring is signal reproducibility, our proposed nanosensor functionalized with diazonium salt holds great promise for applications to in situ measurements due to its demonstrated sensitivity, reproducibility, repeatability, and reusability.

Supplementary Materials

The Supplementary Materials containing Figures S1–S5 are available online at https://www.mdpi.com/1424-8220/17/6/1198/s1.

Acknowledgments

The authors would like to acknowledge the REMANTAS project: Enhanced Raman scattering for aquatic media: a new technology for on-site analysis 2011–2014 (REMANTAS project; ANR-11-ECOT-0010) for financial support. They also thank Carolyn Engel-Gautier for providing a proofreading of the English text. The authors thank Ifremer for covering the costs to publish in open access.

Author Contributions

I.T. and S.B. contributed equally to this work: they synthesized diazonium salt and performed the experiments on surface enhanced Raman scattering (SERS) at BRGM, treated the obtained data, and wrote the paper; J.M. adapted the algorithm for chemometrics; E.R. provided information on the pollution of marine waters; C.D. and S.V. developed a prototype of a transportable micro-Raman spectrometer; I.I., C.B., E.G., N.L.-G. and M.L.d.l.C. followed the experiments and advised on the questions related with nanosensors and SERS applications.

Conflicts of Interest

The authors declare no conflict of interest.

References

  1. Bessbousse, H.; Nandhakumar, I.; Decker, M.; Barsbay, M.; Cuscito, O.; Lairez, D.; Clochard, M.C.; Wade, T.L. Functionalized nanoporous track-etched β-pvdf membrane electrodes for lead (ii) determination by square wave anodic stripping voltammetry. Anal. Methods 2011, 3, 1351–1359. [Google Scholar] [CrossRef]
  2. Parat, C.; Authier, L.; Betelu, S.; Petrucciani, N.; Potin-Gautier, M. Determination of labile cadmium using a screen-printed electrode modified by a microwell. Electroanalysis 2007, 19, 403–406. [Google Scholar] [CrossRef]
  3. Betelu, S.; Parat, C.; Petrucciani, N.; Castetbon, A.; Authier, L.; Potin-Gautier, M. Semicontinuous monitoring of cadmium and lead with a screen-printed sensor modified by a membrane. Electroanalysis 2007, 19, 399–402. [Google Scholar] [CrossRef]
  4. Parat, C.; Betelu, S.; Authier, L.; Potin-Gautier, M. Determination of labile trace metals with screen-printed electrode modified by a crown-ether based membrane. Anal. Chim. Acta 2006, 573, 573–574. [Google Scholar] [CrossRef] [PubMed]
  5. Buffle, J.; Tercier-Waeber, M.L. Trends in analytical chemistry. Voltammetric environmental trace-metal analysis and speciation: From laboratory to in situ measurements. Trends Anal. Chem. 2005, 24, 172–191. [Google Scholar] [CrossRef]
  6. Finch, M.S.; Hydesa, D.J.; Claysona, C.H.; Weiglb, B.; Dakinc, J.; Gwilliama, P. A low power ultra violet spectrophotometer for measurement of nitrate in seawater: Introduction, calibration and initial sea trials. Anal. Chim. Acta 1998, 377, 167–177. [Google Scholar] [CrossRef]
  7. Mikkelsen, Ø.; Skogvold, S.M.; Schrøder, K.H. Continuous heavy metal monitoring system for application in river and seawater. Electroanalysis 2005, 17, 431–439. [Google Scholar] [CrossRef]
  8. Heglund, D.L.; Tilotta, D.C. Determination of volatile organic compounds in water by solid phase microextraction and infrared spectroscopy. Environ. Sci. Technol. 1996, 30, 1212–1219. [Google Scholar] [CrossRef]
  9. Potter, D.W.; Pawliszyn, J. Rapid determination of polyaromatic hydrocarbons and polychlorinated biphenyls in water using solid-phase. Environ. Sci. Technol. 1994, 28, 298–305. [Google Scholar] [CrossRef] [PubMed]
  10. Wittkamp, B.L.; Tillota, D.C. Determination of btex compounds in water by solid-phase microextraction and raman spectroscopy. Anal. Chem. 1995, 67, 600–605. [Google Scholar] [CrossRef]
  11. Young, M.A.; Stuart, D.A.; Lyandres, O.; Glucksberg, M.R.; Van Duyne, R.P. Surface-enhanced raman spectroscopy with a laser pointer light source and miniature spectrometer. Can. J. Chem. 2004, 82, 1435–1441. [Google Scholar] [CrossRef]
  12. Demeestere, K.; Dewulf, J.; De Witte, B.; Van Langenhove, H. Review: Sample preparation for the analysis of volatile organic compounds in air and water matrices. J. Chromatogr. A 2007, 1153, 130–144. [Google Scholar] [CrossRef] [PubMed]
  13. Arthur, C.L.; Killiam, L.M.; Motlagh, S.; Lim, M.; Potter, D.W.; Pawliszyn, J. Analysis of substituted benzene compounds in groundwater using solid-phase microextraction. Environ. Sci. Technol. 1992, 26, 979–983. [Google Scholar] [CrossRef]
  14. Buchholz, K.D.; Pawliszyn, J. Determination of phenols by solid-phase microextraction and gas chromatographic analysis. Environ. Sci. Technol. 1993, 27, 2844–2848. [Google Scholar] [CrossRef]
  15. Zhang, Z.; Pawliszyn, J. Quantitative extraction using an internally cooled solid phase microextraction device. Anal. Chem. 1995, 67, 34–43. [Google Scholar] [CrossRef]
  16. Arthur, C.L.; Pawliszyn, J. Solid phase microextraction with thermal desorption using fused silica optical fibers. Anal. Chem. 1990, 62, 2145–2148. [Google Scholar] [CrossRef]
  17. Qiaoa, M.; Qia, W.; Liua, H.; Qua, J. Simultaneous determination of typical substituted and parent polycyclic aromatic hydrocarbons in water and solid matrix by gas chromatography–mass spectrometry. J. Chromatogr. A 2013, 1291, 129–136. [Google Scholar] [CrossRef] [PubMed]
  18. Eisert, R.; Levsen, K. Determination of pesticides in aqueous samples by solid-phase microextraction in-line coupled to gas chromatography-mass spectrometry. J. Am. Soc. Mass. Spectrom. 1995, 6, 1119–1130. [Google Scholar] [CrossRef]
  19. Roy, G.; Vuillemin, R.; Guyomarch, J. On-site determination of polynuclear aromatic hydrocarbons in seawater by stir bar sorptive extraction (SBSE) and thermal desorption GC-MS. Talanta 2005, 66, 540–546. [Google Scholar] [CrossRef] [PubMed]
  20. Huang, X.; Qiu, N.; Yuan, D.; Huang, B. A novel stir bar sorptive extraction coating based on monolithic material for apolar, polar organic compounds and heavy metal ions. Talanta 2009, 78, 101–106. [Google Scholar] [CrossRef] [PubMed]
  21. Brunink, J.A.J.; Di Natale, C.; Bungaro, F.; Davide, F.A.M.; D’Amico, A.; Paolesse, R.; Boschi, T.; Faccio, M.; Ferri, G. The application of metalloporphyrins as coating material for quartz microbalance-based chemical sensors. Anal. Chim. Acta 1995, 325, 53–64. [Google Scholar] [CrossRef]
  22. Cygan, M.T.; Collins, G.E.; Dunbar, T.D.; Allara, D.L.; Gibbs, C.G.; Gutsche, C.D. Calixarene monolayers as quartz crystal microbalance sensing elements in aqueous solution. Anal. Chem. 1999, 71, 142–148. [Google Scholar] [CrossRef] [PubMed]
  23. Harbeck, M.; Erbahar, D.D.; Gürol, I.; Musluoglu, E.; Ahsen, V.; Öztürk, Z.Z. Phthalocyanines as sensitive coatings for qcm sensors operating in liquids for the detection of organic compounds. Sens. Actuators B 2010, 150, 346–354. [Google Scholar] [CrossRef]
  24. Lieberzeit, P.; Halikias, K.; Afzal, A.; Dickert, F. Polymers imprinted with pah mixtures-comparing fluorescence and qcm sensors. Anal. Bioanal. Chem. 2008, 392, 1405–1410. [Google Scholar] [CrossRef] [PubMed]
  25. Lucklum, R.; Rösler, S.; Hartmann, J.; Hauptmann, P. On-line detection of organic pollutants in water by thickness shear mode resonators. Sens. Actuators B 1996, 35–36, 103–111. [Google Scholar] [CrossRef]
  26. Menon, A.; Zhou, R.; Josse, F. Coated-quartz crystal resonator (qcr) sensors for on-line detection of organic contaminants in water. IEEE Trans. Ultrason. Ferroelect. Freq. Control 1998, 45, 1416–1426. [Google Scholar] [CrossRef]
  27. Patel, R.; Zhou, R.; Zinszer, K.; Josse, F. Real-time detection of organic compounds in liquid environments using polymer-coated thickness shear mode quartz resonator. Anal. Chem. 2000, 72, 4888–4898. [Google Scholar] [CrossRef] [PubMed]
  28. Pejcic, B.; Barton, C.; Crooke, E.; Eadington, P.; Jee, E.; Ross, A. Hydrocarbon sensing. Part 1: Some important aspects about sensitivity of a polymer-coated quartz crystal microbalance in the aqueous phase. Sens. Actuators B 2009, 135, 436–443. [Google Scholar] [CrossRef]
  29. Rösler, S.; Lucklum, R.; Borngräber, R.; Hartmann, J.; Hauptmann, P. Sensor system for the detection of organic pollutants in water by thickness shear mode resonators. Sens. Actuators B 1998, 48, 415–424. [Google Scholar] [CrossRef]
  30. Schierbaum, K.D.; Weimar, U.; Göpel, W. Comparison of ceramic, thick-film and thin-film chemical sensors based upon sno2. Sens. Actuators B 1992, 7, 709–716. [Google Scholar] [CrossRef]
  31. Zhou, R.; Haimbodi, M.; Everhart, D.; Josse, F. Polymer-coated QRC sensors for the detection of organic solvents in water. Sens. Actuators B 1996, 35, 176–182. [Google Scholar] [CrossRef]
  32. Dickert, F.L.; Lieberzeit, P.; Miarecka, S.G.; Mann, K.J.; Hayden, O.; Palfinger, C. Synthetic receptors for chemical sensors-subnano- and micrometre patterning by imprinting techniques. Biosens. Bioelectron. 2004, 20, 1040–1044. [Google Scholar] [CrossRef] [PubMed]
  33. Colas, F.J.; Cottat, M.; Gillibert, R.; Guillot, N.; Djaker, N.; Lidgi-Guigui, N.; Toury, T.; Barchiesi, D.; Toma, A.; Di Fabrizio, E.; et al. Red-shift effects in surface enhanced raman spectroscopy: Spectral or intensity dependence of the near-field? J. Phys. Chem. C 2016, 120, 13675–13683. [Google Scholar] [CrossRef]
  34. Grand, J.; de la Chapelle, M.L.; Bijeon, J.L.; Adam, P.M.; Vial, A.; Royer, P. Role of localized surface plasmons in surface-enhanced raman scattering of shape-controlled metallic particles in regular arrays. Phys. Rev. B 2005, 72, 033407. [Google Scholar] [CrossRef]
  35. Schatz, G.C.; Van Duyne, R.P. Electromagnetic mechanism of surface enhanced raman spectroscopy. In Handbook of Vibrational Spectroscopy; Chalmers, J.M., Griffiths, P.R., Eds.; Wiley: Hoboken, NJ, USA, 2002; Volume 1, p. 759. [Google Scholar]
  36. Wokaun, A. Surface-enhanced electromagnetic processes. Solid State Phys. 1984, 38, 223–294. [Google Scholar]
  37. Guillot, N.; de la Chapelle, M.L. The electromagnetic effect in surface enhanced raman scattering: Enhancement optimization using precisely controlled nanostructures. J. Quant. Spectrosc. Radiat. Transf. 2012, 113, 2321–2333. [Google Scholar] [CrossRef]
  38. Cottat, M.; Lidgi-Guigui, N.; Hamouda, F.; Bartenlian, B.; Venkataraman, D.; Marks, R.S.; Steele, T.W.S.; Lamy de la Chapelle, M. Highly sensitive detection of paclitaxel by surface-enhanced raman scattering. J. Opt. 2015, 17, 114019. [Google Scholar] [CrossRef]
  39. Cottat, M.; D’Andrea, C.; Yasukuni, R.; Malashikhina, N.; Grinyte, R.; Lidgi-Guigui, N.; Fazio, B.; Sutton, A.; Oudar, O.; Charnaux, N.; et al. High sensitivity, high selectivity sers detection of mnsod using optical nanoantennas functionalized with aptamers. J. Phys. Chem. C 2015, 119, 15532–15540. [Google Scholar] [CrossRef]
  40. Albrecht, M.G.; Creighton, J.A. Intense raman spectra of pyridine at a silver electrode. J. Am. Chem. Soc. 1977, 99, 5215–5217. [Google Scholar] [CrossRef]
  41. Fleischmann, M.; Hendra, P.J.; McQuillan, A.J. Raman spectra of pyridine adsorbed at a silver electrode. Chem. Phys. Lett. 1974, 26, 163–166. [Google Scholar] [CrossRef]
  42. Jeanmaire, D.L.; Van Duyne, R.P. Surface raman spectroelectrochemistry: Part I. Heterocyclic, aromatic, and aliphatic amines adsorbed on the anodized silver electrode. J. Electroanal. Chem. Interfacial Electrochem. 1977, 84, 1–20. [Google Scholar] [CrossRef]
  43. Kambhampati, P.; Child, C.M.; Foster, M.C.; Campion, A. On the chemical mechanism of surface enhanced raman scattering: Experiment and theory. J. Chem. Phys. 1998, 108, 5013–5026. [Google Scholar] [CrossRef]
  44. Guillot, N.; Lamy de la Chapelle, M. Lithographied nanostructures as nanosensors. J. Nanophotonics 2012, 6, 064506–064528. [Google Scholar] [CrossRef]
  45. Kneipp, K.; Wang, Y.; Kneipp, H.; Perelman, L.T.; Itzkan, I.; Dasari, R.R.; Feld, M.S. Single molecule detection using surface-enhanced raman scattering (sers). Phys. Rev. Lett. 1997, 78, 1667–1670. [Google Scholar] [CrossRef]
  46. Nie, S.; Emory, S.R. Probing single molecules and single nanoparticles by surface-enhanced raman scattering. Science 1997, 275, 1102–1106. [Google Scholar] [CrossRef] [PubMed]
  47. Schmidt, H.; Bich Ha, N.; Pfannkuche, J.; Amann, H.; Kronfeldt, H.-D.; Kowalewska, G. Detection of pahs in seawater using surface-enhanced raman scattering (sers). Mar. Pollut. Bull. 2004, 49, 229–234. [Google Scholar] [CrossRef] [PubMed]
  48. Xie, Y.; Wang, X.; Han, X.; Song, W.; Ruan, W.; Liu, J.; Zhao, B.; Ozaki, Y. Selective sers detection of each polycyclic aromatic hydrocarbon (PAH) in a mixture of five kinds of pahs. J. Raman Spectrosc. 2011, 42, 945–950. [Google Scholar] [CrossRef]
  49. Otto, A.; Mrozek, I.; Grabhorn, H.; Akemann, W. Surface-enhanced raman scattering. J. Phys. Condens. Matter 1992, 4, 1143. [Google Scholar] [CrossRef]
  50. Peron, O.; Rinnert, E.; Lehaitre, M.; Crassous, P.; Compere, C. Detection of polycyclic aromatic hydrocarbon (pah) compounds in artificial sea-water using surface-enhanced raman scattering (sers). Talanta 2009, 79, 199–204. [Google Scholar] [CrossRef] [PubMed]
  51. Allan, I.J.; Vrana, B.; Greenwood, R.; Mills, G.A.; Roig, B.; Gonzales, C. A “toolbox” for biological and chemical monitoring requirements for the european union’s water framework directive. Talanta 2006, 69, 302–322. [Google Scholar] [CrossRef] [PubMed]
  52. Peron, O.; Rinnert, E.; Florent, C.; Lehaitre, M.; Compere, C. First steps of in situ surface-enhanced raman scattering during shipboard experiments. Appl. Spectrosc. 2010, 64, 1086–1093. [Google Scholar] [CrossRef] [PubMed]
  53. Peron, O.; Rinnert, E.; Toury, T.; Lamy de la Chapelle, M.; Compère, C. Quantitative sers sensors for environmental analysis of naphthalene. Analyst 2011, 136, 1018–1022. [Google Scholar] [CrossRef] [PubMed]
  54. Prien, R.D. The future of chemical in situ sensors. Mar. Chem. 2007, 107, 422–432. [Google Scholar] [CrossRef]
  55. Rogers, J.A.; Jackman, R.J.; Whitesides, G.M. Constructing single- and multiple-helical microcoils and characterizing their performance as components of microinductors and microelectromagnets. J. Microelectromech. Syst. 1997, 6, 184–192. [Google Scholar] [CrossRef]
  56. Ulman, A. Formation and structure of self-assembled monolayers. Chem. Rev. 1996, 96, 1533–1554. [Google Scholar] [CrossRef] [PubMed]
  57. Zielinski, O.; Busch, J.A.; Cembella, A.D.; Daly, K.L.; Engelbrektsson, J.; Hannides, A.K.; Schmidt, H. Detecting marine hazardous substances and organisms: Sensors for pollutants, toxins, and pathogens. Ocean Sci. Discuss. 2009, 6, 953–1005. [Google Scholar] [CrossRef]
  58. Chow, E.; Hibbert, D.B.; Gooding, J.J. Voltammetric detection of cadmium ions at glutathione-modified gold electrodes. Analyst 2005, 130, 831–837. [Google Scholar] [CrossRef] [PubMed]
  59. Delamarche, E.; Michel, B.; Kang, H.; Gerber, C. Thermal stability of self-assembled monolayers. Langmuir 1994, 10, 4103–4108. [Google Scholar] [CrossRef]
  60. Horn, A.B.; Russell, D.A.; Shorthouse, L.J.; Simpson, T.R.E. Ageing of alkanethiol self-assembled monolayers. J. Chem. Soc. 1996, 92, 4759–4762. [Google Scholar] [CrossRef]
  61. Betelu, S.; Tijunelyte, I.; Boubekeur-Lecaque, L.; Ignatiadis, I.; Ibrahim, J.; Gaboreau, S.; Berho, C.; Toury, T.; Guenin, E.; Lidgi-Guigui, N.; et al. Evidence of the grafting mechanisms of diazonium salts on gold nanostructures. J. Phys. Chem. C 2016, 120, 18158–18166. [Google Scholar] [CrossRef]
  62. Betelu, S.; Vautrin-Ul, C.; Chaussé, A. Novel 4-carboxyphenyl-grafted screen-printed electrode for trace cu(ii) determination. Electrochem. Commun. 2009, 11, 383–386. [Google Scholar] [CrossRef]
  63. Betelu, S.; Vautrin-Ul, C.; Ly, J.; Chaussé, A. Screen-printed electrografted electrode for trace uranium analysis. Talanta 2009, 80, 372–376. [Google Scholar] [CrossRef] [PubMed]
  64. Delamar, M.; Hitmi, R.; Pison, J.; Savéan, J. Covalent modification of carbon surfaces by grafting of functionalized aryl radicals produced from electrochemical reduction of diazonium salts. J. Am. Chem. Soc. 1992, 114, 5883–5884. [Google Scholar] [CrossRef]
  65. Adenier, A.; Cabet-Deliry, E.; Chaussé, A.; Griveau, S.; Mercier, F.; Pinson, J.; Vautrin-Ul, C. Grafting of nitrophenyl groups on carbon without electrochemical induction. Chem. Mater. 2005, 17, 491–501. [Google Scholar] [CrossRef]
  66. Bekyarova, E.; Itkis, M.E.; Ramesh, P.; Berger, C.; Sprinkle, M.; de Heer, W.A.; Haddon, R.C. Chemical modification of epitaxial graphene: Spontaneous grafting of aryl groups. J. Am. Chem. Soc. 2009, 131, 1336–1337. [Google Scholar] [CrossRef] [PubMed]
  67. Combellas, C.M.; Delamar, F.; Kanoufi, F.; Pinson, J.; Podvorica, F.I. Spontaneous grafting of iron surfaces by reduction of aryldiazonium salts in acidic or neutral aqueous solution. Application to the protection of iron against corrosion. Chem. Mater. 2005, 17, 3968–3975. [Google Scholar] [CrossRef]
  68. Laurentius, L.; Stoyanov, S.R.; Gusarov, S.; Kovalenko, A.; Du, R.; Lopinski, G.P.; McDermott, M.T. Diazonium-derived aryl films on gold nanoparticles: Evidence for a carbon–gold covalent bond. ACS Nano 2011, 5, 4219–4227. [Google Scholar] [CrossRef] [PubMed]
  69. Griveau, S.; Mercier, D.; Vautrin-Ul, C.; Chaussé, A. Electrochemical grafting by reduction of 4-aminoethylbenzenediazonium salt: Application to the immobilization of (bio)molecules. Electrochem. Commun. 2007, 9, 2768–2773. [Google Scholar] [CrossRef]
  70. Manoli, E.; Samara, C. Polycyclic aromatic hydrocarbons in natural waters: Sources, occurrence and analysis. Trends Anal. Chem. 1999, 18, 417–428. [Google Scholar] [CrossRef]
  71. Eilers, P.H.C. A perfect smoother. Anal. Chem. 2003, 75, 3631–3636. [Google Scholar] [CrossRef] [PubMed]
  72. Moreau, J.; Rinnert, E. Fast identification and quantification of btex coupling by raman spectrometry and chemometrics. Analyst 2015, 140, 3535–3542. [Google Scholar] [CrossRef] [PubMed]
  73. Busson, M.; Berisha, A.; Combellas, C.; Kanoufi, F.; Pinson, J. Photochemical grafting of diazonium salts on metals. Chem. Commun. 2011, 47, 12631–12633. [Google Scholar] [CrossRef] [PubMed]
  74. Bouriga, M.; Chehimi, M.M.; Combellas, C.; Decorse, P.; Kanoufi, F.; Deronzier, A.; Pinson, J. Sensitized photografting of diazonium salts by visible light. Chem. Mater. 2013, 25, 90–97. [Google Scholar] [CrossRef]
  75. Abiman, P.; Wildgoose, G.G.; Compton, R.G. Investigating the mechanism for the covalent chemical modification of multiwalled carbon nanotubes using aryl diazonium salts. Int. J. Electrochem. Sci. 2008, 3, 104–117. [Google Scholar]
  76. Ahmad, R.; Boubekeur-Lecaque, L.; Nguyen, M.; Lau-Truong, S.; Lamouri, A.; Decorse, P.; Galtayries, A.; Pinson, J.; Felidj, N.; Mangeney, C. Tailoring the surface chemistry of gold nanorods through au–c/ag–c covalent bonds using aryl diazonium salts. J. Phys. Chem. C 2014, 118, 19098–19105. [Google Scholar] [CrossRef]
  77. Qu, L.-L.; Li, Y.-T.; Li, D.-W.; Xue, J.-Q.; Fossey, J.S.; Long, Y.-T. Humic acids-based one-step fabrication of sers substrates for detection of polycyclic aromatic hydrocarbons. Analyst 2013, 138, 1523–1528. [Google Scholar] [CrossRef] [PubMed]
  78. Tijunelyte, I.; Dupont, N.; Milosevic, I.; Barbey, C.; Rinnert, E.; Lidgi-Guigui, N.; Guenin, E.; de la Chapelle, M. Investigation of aromatic hydrocarbon inclusion into cyclodextrins by raman spectroscopy and thermal analysis. Environ. Sci. Pollut. Res. 2015, 1–13. [Google Scholar] [CrossRef] [PubMed]
  79. International Union of Pure and Applied Chemistry. Compendium of Chemical Terminology; Blackwell Science: Oxford, UK, 1997. [Google Scholar]
  80. Guideline, I.H.T. Validation of Analytical Procedures: Text and Methodology. Available online: https://www.ich.org/fileadmin/Public_Web_Site/ICH_Products/Guidelines/Quality/Q2_R1/Step4/Q2_R1__Guideline.pdf (accessed on 24 May 2017).
  81. Na, W.; Hai-Feng, Y.; Xuan, Z.; Rui, Z.; Yao, W.; Guan-Feng, H.; Zong-Rang, Z. Synthesis of anti-aggregation silver nanoparticles based on inositol hexakisphosphoric micelles for a stable surface enhanced raman scattering substrate. Nanotechnology 2009, 20, 315603. [Google Scholar]
  82. Fu, S.; Guo, X.; Wang, H.; Yang, T.; Wen, Y.; Yang, H. Functionalized au nanoparticles for label-free raman determination of ppb level benzopyrene in edible oil. Sens. Actuators B 2015, 212, 200–206. [Google Scholar] [CrossRef]
  83. Zheng, Y.; Thai, T.; Reineck, P.; Qiu, L.; Guo, Y.; Bach, U. DNA-directed self-assembly of core-satellite plasmonic nanostructures: A highly sensitive and reproducible near-ir sers sensor. Adv. Funct. Mater. 2013, 23, 1519–1526. [Google Scholar] [CrossRef]
Scheme 1. General illustration of nanosensor surface functionalization and preconcentration of the targeted compounds via weak interactions. Gold Nanostructures GNSs, DS-C10H21, 4-dodecyl benzenediazonium-tetrafluoroborate diazonium salt.
Sensors 17 01198 sch001
Figure 1. Detection of benzo[a]pyrene (BaP) at 0.75 mg L−1 (A), fluoranthene (FL) at 5 mg L−1 concentration (B) and naphthalene (NAP) at 50 mg L−1 (C) using gold nanostructures (GNSs) functionalized with diazonium salt (Au-Phi-C10H21). The black and red spectra correspond to the SERS signals before and after incubation in the pollutants solutions, respectively. Blue spectra in (AC) correspond to the Raman reference spectra for BaP, FL, and NAP, respectively, acquired on powder. Red and blue spectra are shifted vertically for better visualization. Red arrows indicate the peaks of detected pollutants.
Sensors 17 01198 g001
Figure 2. (A) Surface-enhanced Raman spectroscopy (SERS) spectra of benzo[a]pyrene (BaP) detection for concentrations from 0 up to 0.75 mg L−1; (B) calibration curve of BaP detection (blue circles: experimental data, dotted line: Langmuir adsorption isotherm fit). Insert: zoom on the concentration range from 0 to 0.5 mg L−1 (blue circles: experimental data, dotted line: linear fit). The hatched area corresponds to the noise level.
Sensors 17 01198 g002
Figure 3. (A) Surface-enhanced Raman spectroscopy (SERS) spectra of fluoranthene (FL) detection for concentrations ranging from 0 to 5 mg L−1; (B) calibration curve of FL detection (blue circles: experimental data, dotted line: Langmuir adsorption isotherm fit). Insert: zoom on the concentration in the range from 0 to 0.5 mg L−1 (blue circles: experimental data, dotted line: linear fit). The hatched area corresponds to the noise level.
Sensors 17 01198 g003
Figure 4. (A) Surface-enhanced Raman spectroscopy (SERS) spectra of naphthalene (NAP) detection for concentrations ranging from 0 to 50 mg L−1; (B) calibration curve of NAP detection (blue circles: experimental data, dotted line: linear fit). The hatched area corresponds to the noise level.
Sensors 17 01198 g004
Figure 5. Black spectrum corresponds to the surface-enhanced Raman spectroscopy (SERS) spectrum obtained for the analysis of a mixed solution composed of benzo[a]pyrene BaP (0.75 mg L−1, 3 µmol L−1), fluoranthene FL (5 mg L−1, 25 µmol L−1), and naphthalene (NAP) (5 mg L−1, 39 µmol L−1). The red spectrum shows the SERS signal of the DS-C10H21 diazonium-salt-based gold nanostructures (GNSs) for comparison. The black spectrum is vertically shifted for clarity.
Sensors 17 01198 g005
Figure 6. Correlation of the limit of detection (LOD) concentration (crossed circles) and the observed related surface-enhance Raman spectroscopy (SERS) intensities of the analytes in the mixed solution (blue circles) plotted as a function of the Kow factor of the investigated compounds.
Sensors 17 01198 g006
Figure 7. Surface-enhanced Raman spectroscopy (SERS) intensity variations for the peak at 1079 cm−1 of the diazonium salt (DS-C10H21) coating measured after each procedure (open black circles); SERS intensity ratios between the peaks at 1236 cm−1 and 1079 cm−1 for benzo[a]pyrene (BaP) and the DS-C10H21 coating, respectively (filled blue circles).
Sensors 17 01198 g007
Table 1. Physical properties of the selected targeted pollutants [70].
Polycyclic Aromatic HydrocarbonStructureSolubility in Water (mg L−1)Kow
Benzo[a]pyrene (BaP) Sensors 17 01198 i0010.0038 at 25 °C106
Fluoranthene (FL) Sensors 17 01198 i0020.26 at 25 °C3.4 × 105
Naphthalene (NAP) Sensors 17 01198 i003322.3 × 103
Table 2. Positions in cm−1 of the main polycyclic aromatic hydrocarbon (PAH) bands observed in the Raman and SERS spectra (see [77,78] for assignments).
Benzo[a]Pyrene (BaP)Fluoranthene (FL)Naphthalene (NAP)
RamanSERSRamanSERSRamanSERS
615615562562509511
12151215671672762762
1236123980380310211021
134513451018101813821382
138913851104110415771577
1623162312691270
16121612
Table 3. Summarized limit of detection (LOD) and limit of quantitation (LOQ) values for all targeted pollutants.
Polycyclic Aromatic HydrocarbonLODLOQ
(mg L−1)(mol L−1)(mg L−1)(mol L−1)
Benzo[a]pyrene (BaP)0.02610−70.0873.4 × 10−7
Fluoranthene (FL)0.0643.2 × 10−70.2141.1 × 10−6
Naphthalene (NAP)3.93 .0× 10−5131.0 × 10−4

