The Resistance–Amplitude–Frequency Effect of In–Liquid Quartz Crystal Microbalance

School of Automation Engineering, University of Electronic Science and Technology of China, Chengdu 611731, China
*
Author to whom correspondence should be addressed.
Sensors 2017, 17(7), 1476; https://doi.org/10.3390/s17071476
Submission received: 10 May 2017
/
Revised: 17 June 2017
/
Accepted: 21 June 2017
/
Published: 22 June 2017
(This article belongs to the Section Chemical Sensors)
Abstract
:Due to the influence of liquid load, the equivalent resistance of in-liquid quartz crystal microbalance (QCM) increases sharply, and the quality factor and resonant frequency decreases. We found that the change in the resonant frequency of in-liquid QCM consisted of two parts: besides the frequency changes due to the mass and viscous load (which could be equivalent to motional inductance), the second part of frequency change was caused by the increase of motional resistance. The theoretical calculation and simulation proved that the increases of QCM motional resistance may indeed cause the decreases of resonant frequency, and revealed that the existence of static capacitance was the root cause of this frequency change. The second part of frequency change (due to the increases of motional resistance) was difficult to measure accurately, and may cause great error for in-liquid QCM applications. A technical method to reduce the interference caused by this effect is presented. The study contributes to the accurate determination of the frequency and amplitude change of in-liquid QCM caused by liquid load, which is significant for the QCM applications in the liquid phase.
1. Introduction
Quartz crystal microbalance (QCM) has been used for a long time in vacuum and gaseous environments as an ultrasensitive mass sensor, especially for film thickness monitoring [1,2], humidity sensors [3,4,5], proximity sensors [6,7], and various gas sensors [8,9,10]. A QCM device typically consists of a thin disk of AT-cut quartz crystal with circular electrodes patterned on both sides. Due to the piezoelectric properties and crystalline orientation of quartz, the alternating voltage between the electrodes excites crystal oscillating in a thickness shear mode. With varying mass attached to one side of the electrode, the QCM resonant frequency changes accordingly. The fundamental theory describing the relationship between frequency change and mass change was derived by Sauerbrey [11]; however, this theory is limited to the assumption that the mass deposition forms a thin, rigid film and that the mass sensitivity is uniform over the entire surface [12]. Since Nomura and Okuhara [13] showed that a QCM completely immersed in a liquid could also be excited to stable oscillation [14]—which marked the beginning of the QCM’s applications in liquid phase—QCM has often been applied as electrochemistry sensors [15,16,17], biosensors [18,19,20,21], and immunosensors [22,23,24,25].
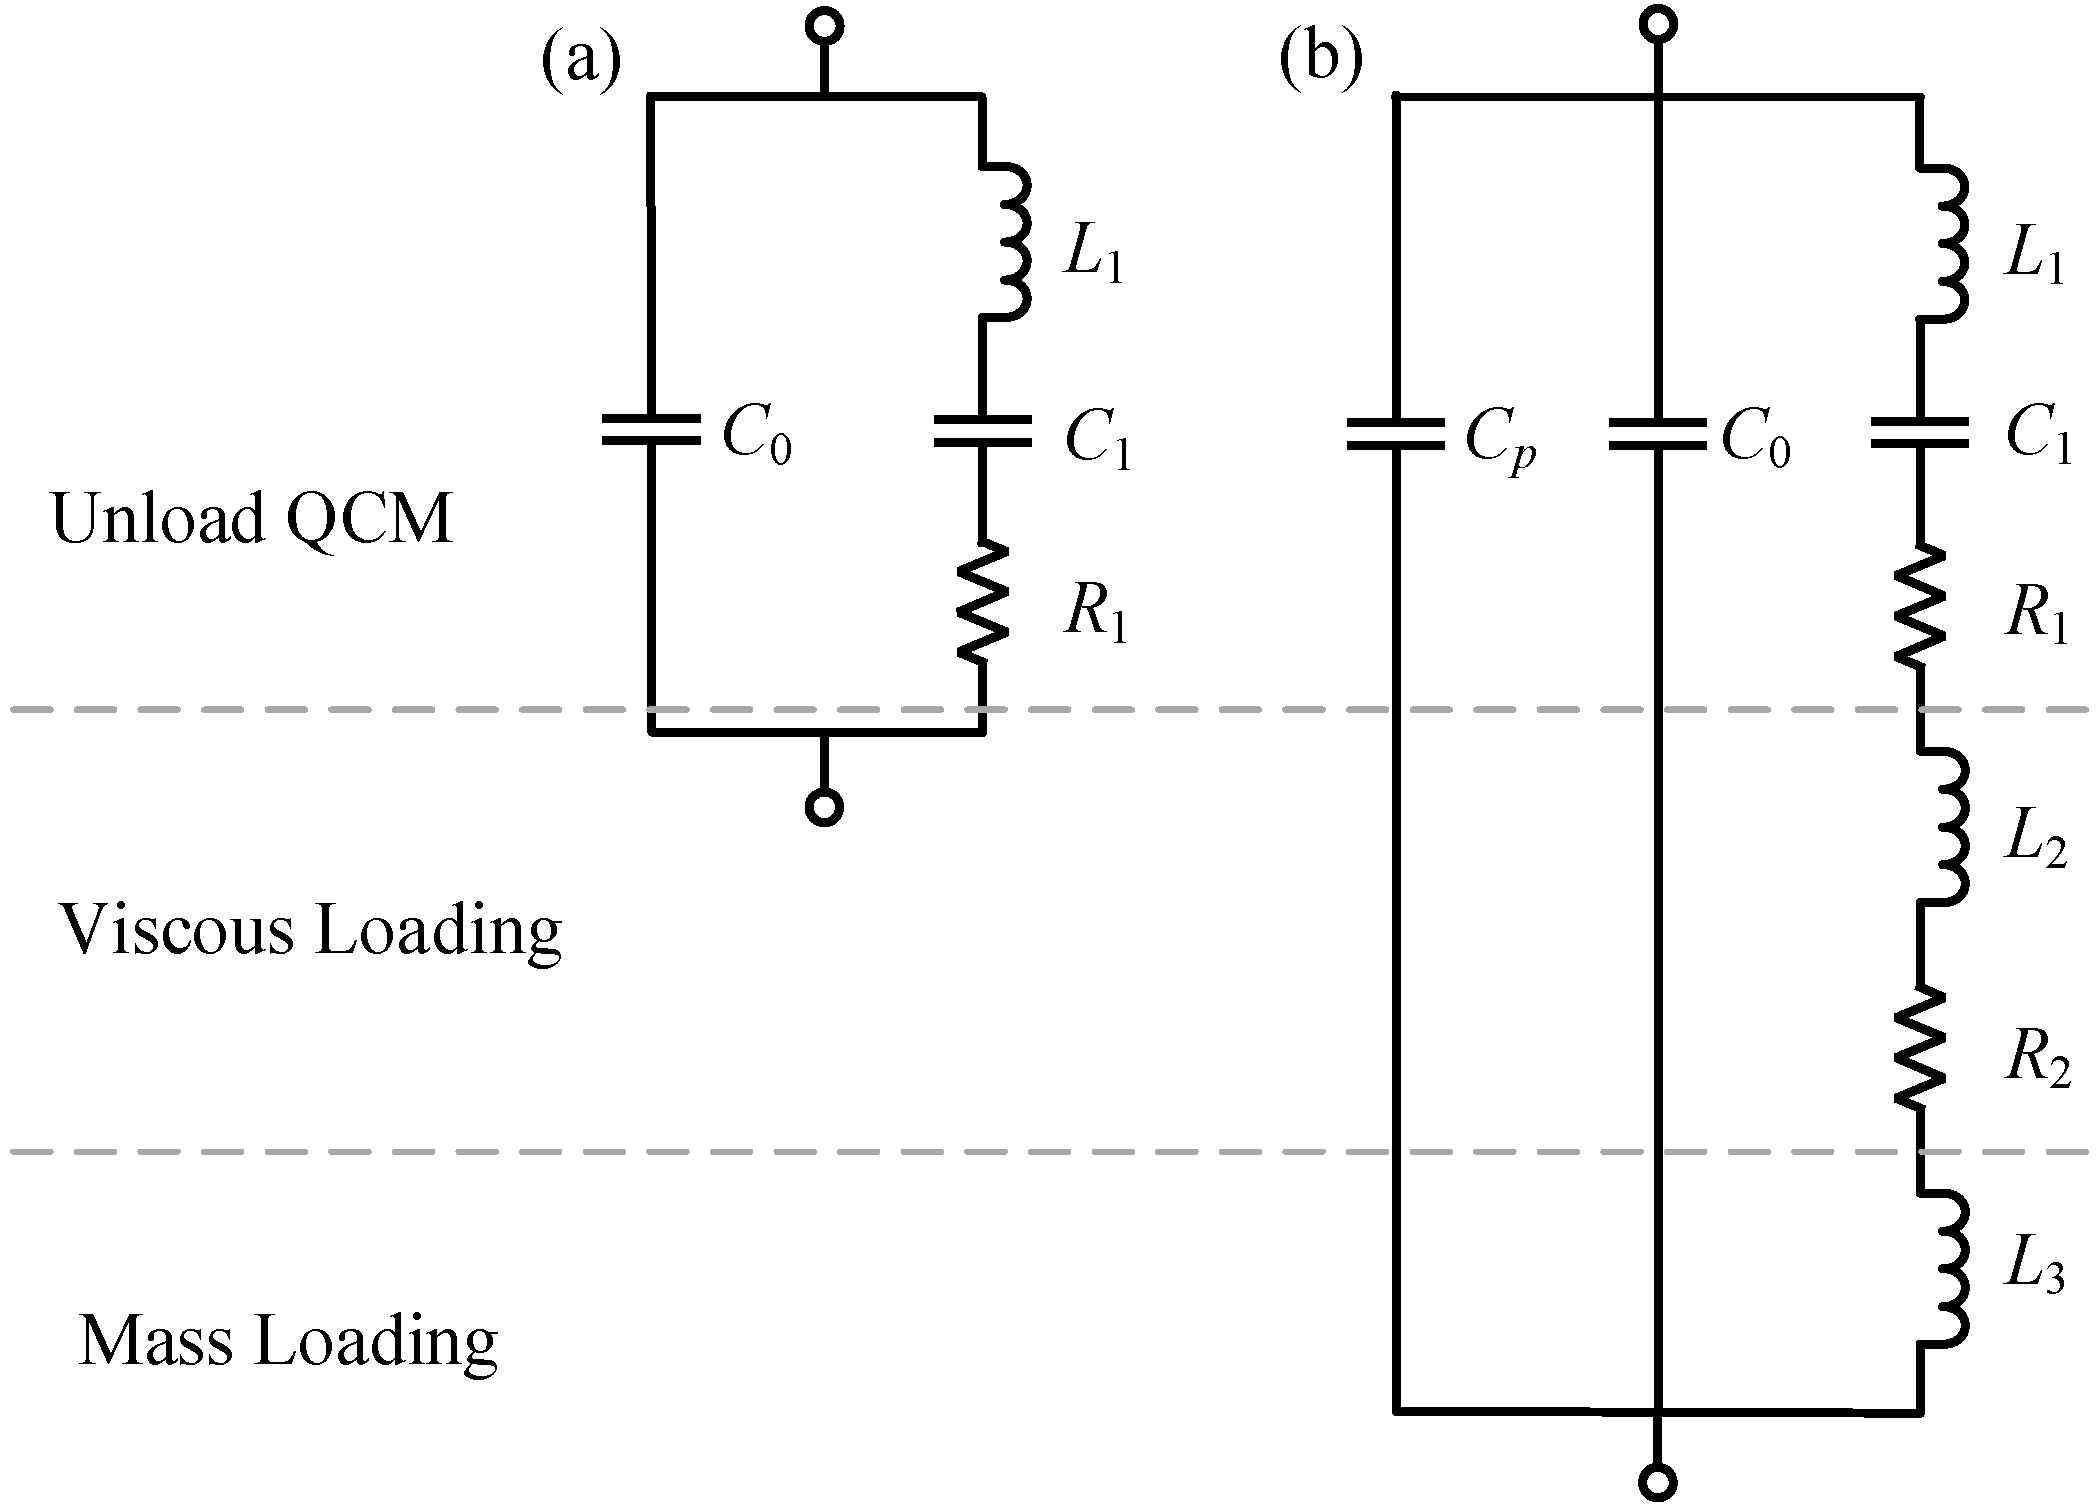
It is convenient to use a lumped-parameter equivalent circuit to characterize a QCM for a narrow range of frequencies near resonance. In such a frequency range, the circuit parameters can be considered constant. Several years before the discovery of the piezoelectric resonator, Van Dyke and Butterworth showed that any mechanically vibrating system driven by means of an electrostatic field could be represented by the Butterworth-Van Dyke (BVD) equivalent circuit [26,27]. Therefore, the BVD equivalent circuit is typically used to describe the unloaded QCM (Figure 1a). In the BVD model, , , , and are the static capacitance, motional capacitance, motional inductance, and motional resistance for unloaded QCM, respectively.
However, in-liquid QCM applications are more important and complex, as the existence of a liquid load causes sharp increases of equivalent resistance and resonance damping, which consequently decreases the quality factor and resonant frequency. Martin et al. presented a model of an equivalent circuit for in-liquid QCM, which is shown in Figure 1b [28]. In Martin’s model, the influence caused by a liquid load was divided into mass loading and viscous loading; inductance and resistance were used to approximate the impedance of the viscous loading; inductance was used to approximate the impedance of the mass loading; and capacitance was used to express the parasitic capacitance of the test fixture [28]. In general, the increased resistance (caused by viscous loading) was much larger than , which is the motional resistance of unloaded QCM. The increased inductance ( and ) and the increased resistance ( caused by viscous loading resulted in the decreases of QCM resonant frequency.
It is noteworthy that the resonant frequency we measured in most in-liquid QCMs was the S21 minimum impedance frequency rather than the zero-phase frequency, where S21 is an S-parameter which represents the forward transmission coefficient of two-port networks. There were two reasons: (1) for practical in-liquid QCM applications, when equivalent resistance increased to a certain degree, the S21 phase curve could not reach zero (that is, the zero-phase frequency would disappear); and (2) due to the existence of scatter phase shift in circuits, the actual oscillation frequency of oscillators was the minimum impedance frequency instead of the zero-phase frequency.
2. Theory and Simulation
The equivalent circuit of QCM loaded with liquid could be divided into the static arm branch and the motional arm branch. The static arm branch contained and , where is the parasitic capacitance arising in the test fixture; and is the static capacitance arising from the two electrodes separated by the insulating quartz and is a function of the electrodes size, shape, and configuration. Due to the piezoelectric effect of quartz crystal, the electromechanical coupling gave rise to the motional arm branch (, , , , , and ). If we define that, the impedance of the static arm branch () and the motional arm branch () can be obtained:
where ; ; ; and . Consequently, the total impedance and admittance of the in-liquid QCM are obtained:
Therefore, the resonant frequency is the frequency at the point of minimum impedance (or the point of maximum admittance ).
The increased inductance caused by mass and viscous loading is what we normally think of as the reason for change in QCM resonant frequency: since the resonant frequency , where and , and would not change for mass or viscous loading, therefore the fractional change of resonant frequency is as in Reference [28].
Nevertheless, it is worth noting that increased motional resistance may also lead to resonant frequency change. Unfortunately, only the resonance damping caused by the added motional resistance has been considered, but the resonant frequency change caused by the added motional resistance had long remained unknown.
The calculated results of the equivalent circuit illustrated the resonant frequency change caused by the added motional resistance. The equivalent electronic parameters of an AT-cut 10 MHz QCM with one surface loaded by a drop of lube oil were measured. Considering that liquid loading results in great increases of resonance damping and great decreases of Q factor, the short-term frequency stability worsens significantly; therefore, we adopted a passive forward transmission measurement method with a vector network analyzer (Agilent E5062A). The radius of the oil drop was approximately 1.2 mm. The diameters of the crystal wafer and gold electrode were 8.7 and 5.1 mm, and the thicknesses of the gold electrodes and quartz crystal wafer were about 1000 Å and 0.167 mm, respectively. Due to the droplet loading, the measured resonance frequency decreased from 9.999873 MHz to 9.992959 MHz. The static capacitance of the QCM was 6.0 pF; and the parasitic capacitance formed in the test fixture was about 2.5 pF. The motional capacitance of the QCM was 27.0 fF. The motional resistance of the unload QCM and the motional resistance caused by oil loading were approximately 12 Ω and 690 Ω, respectively. The motional inductance of the loaded QCM was about 9.3816 mH, where .
Table 1 shows the calculation results obtained by MATLAB software (The Math Works, Inc.) using the BVD equivalent circuit model. The resonant frequency and resonant amplitude of QCM with and without added motional resistance were calculated. It was clear that when other parameters remained constant, the motional resistance increase caused both frequency change and resonance damping simultaneously. The resonant frequency change caused by the added motional resistance was influenced by the static capacitance : increased sharply along with increasing. Moreover, the resonance damping caused by the added motional resistance decreased along with increasing. That is, the smaller the static capacitance , the larger the resonance damping caused by the added motional resistance.
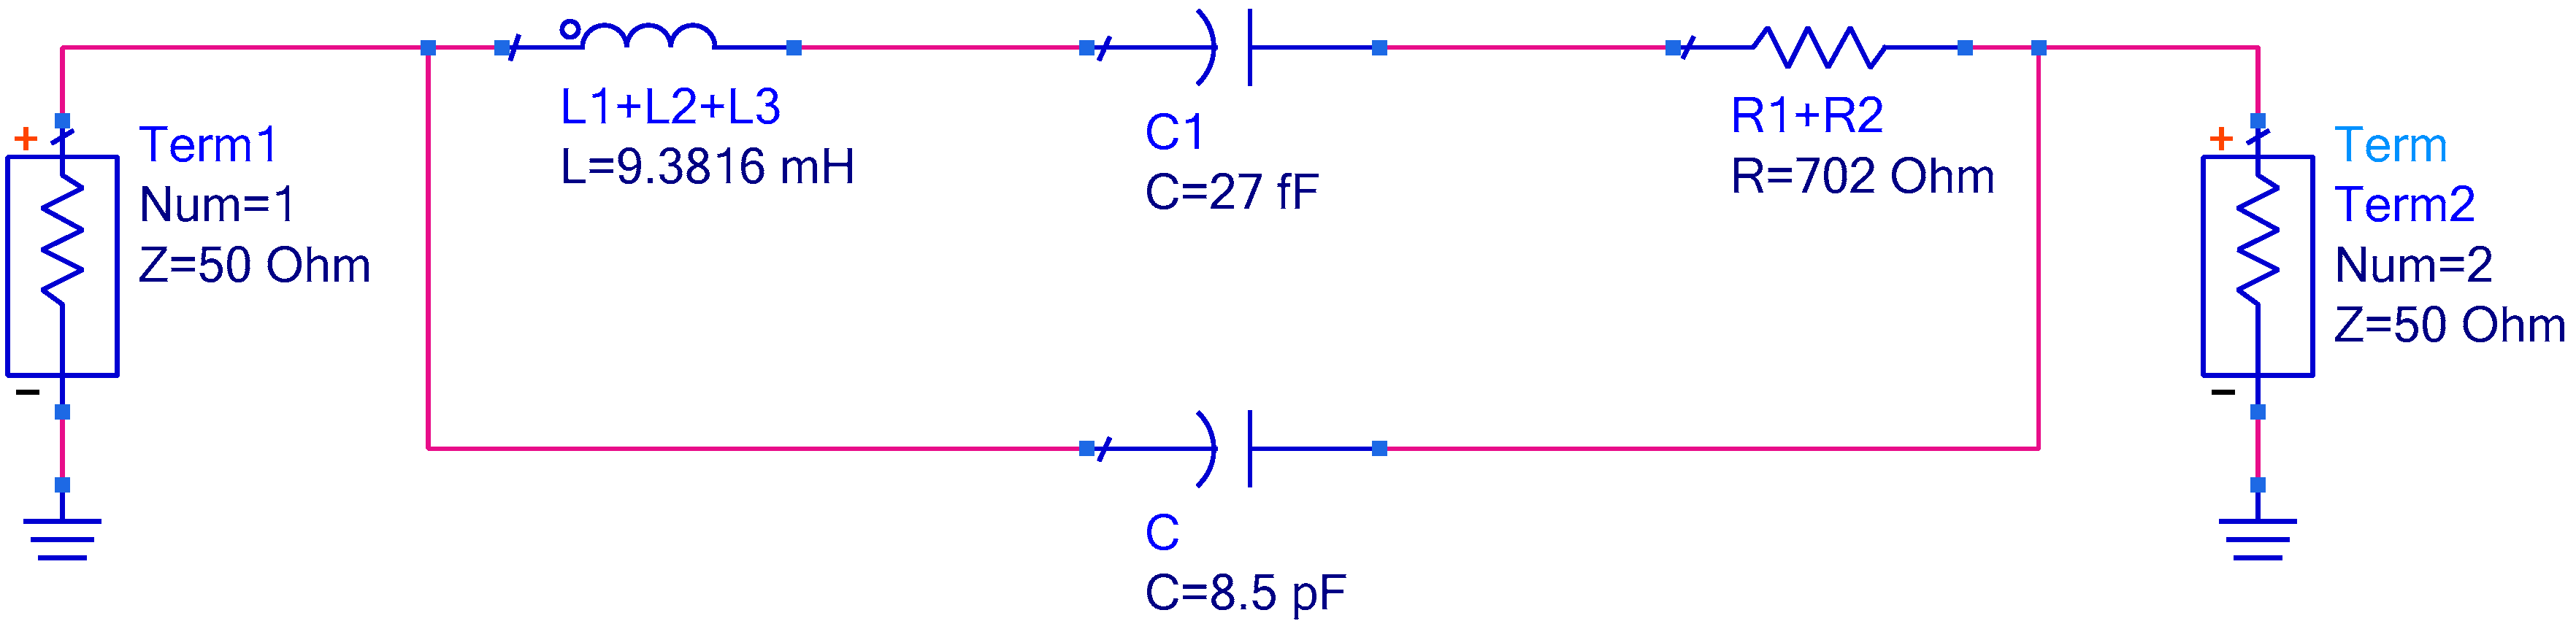
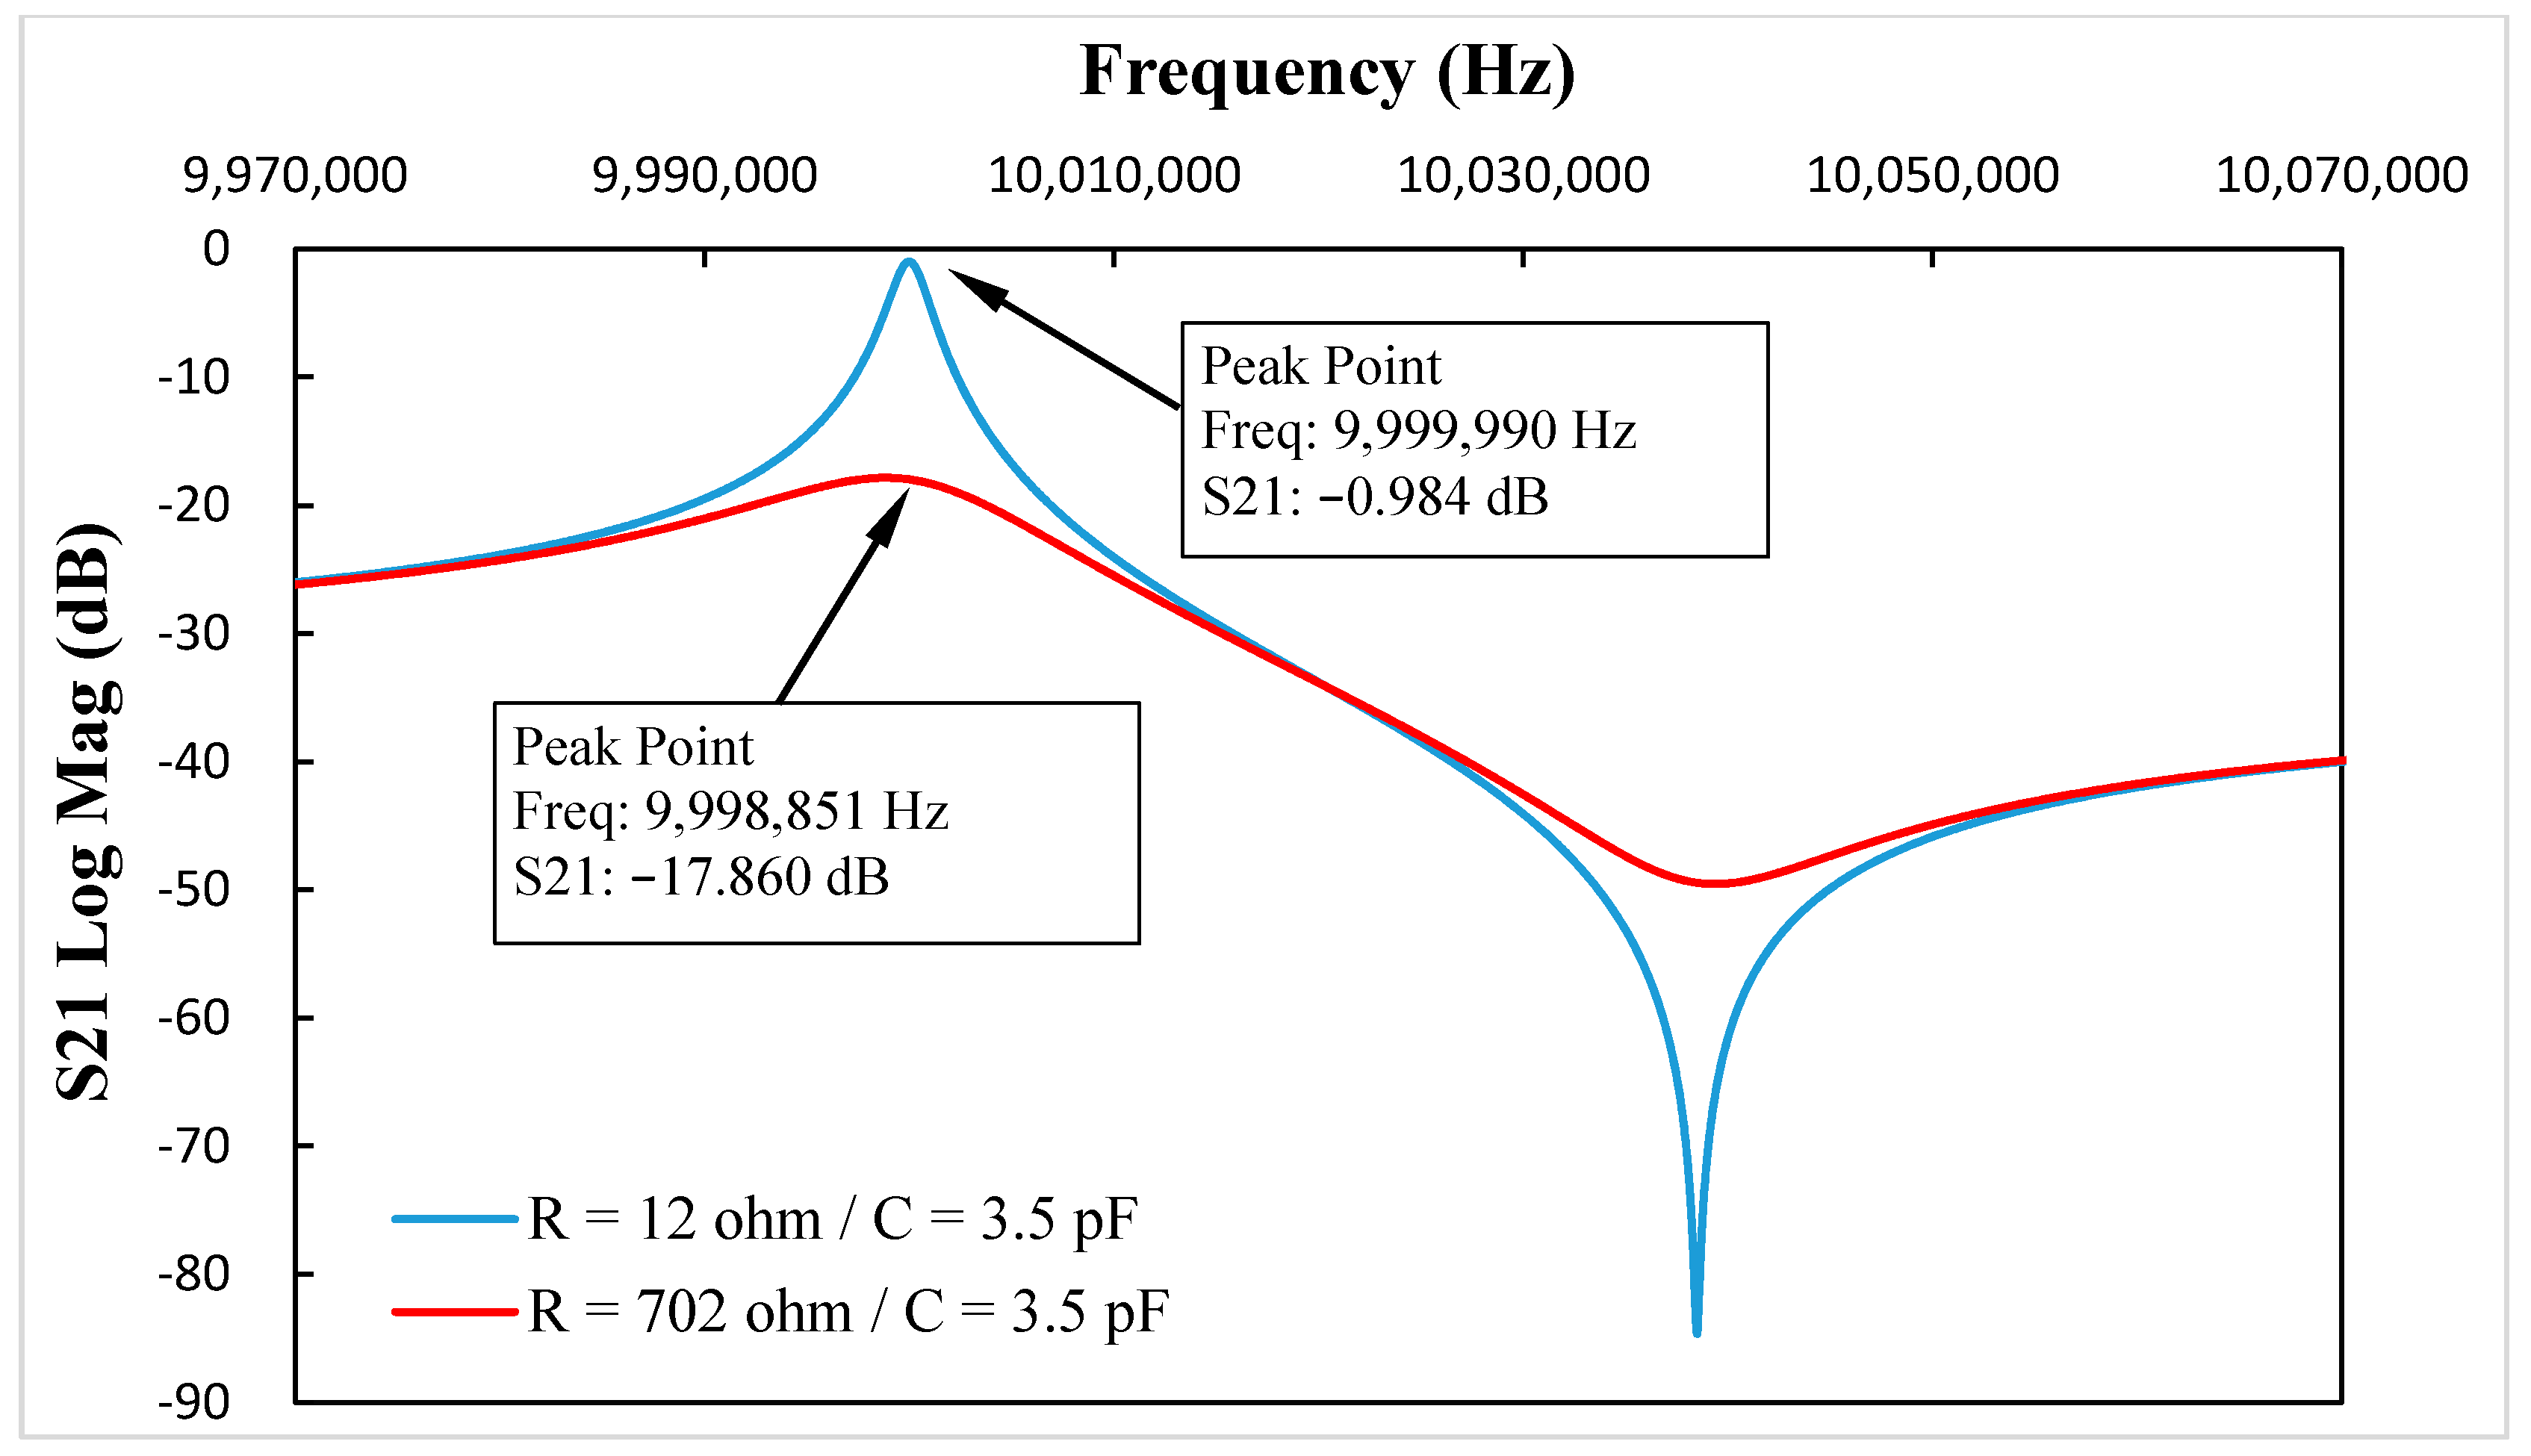
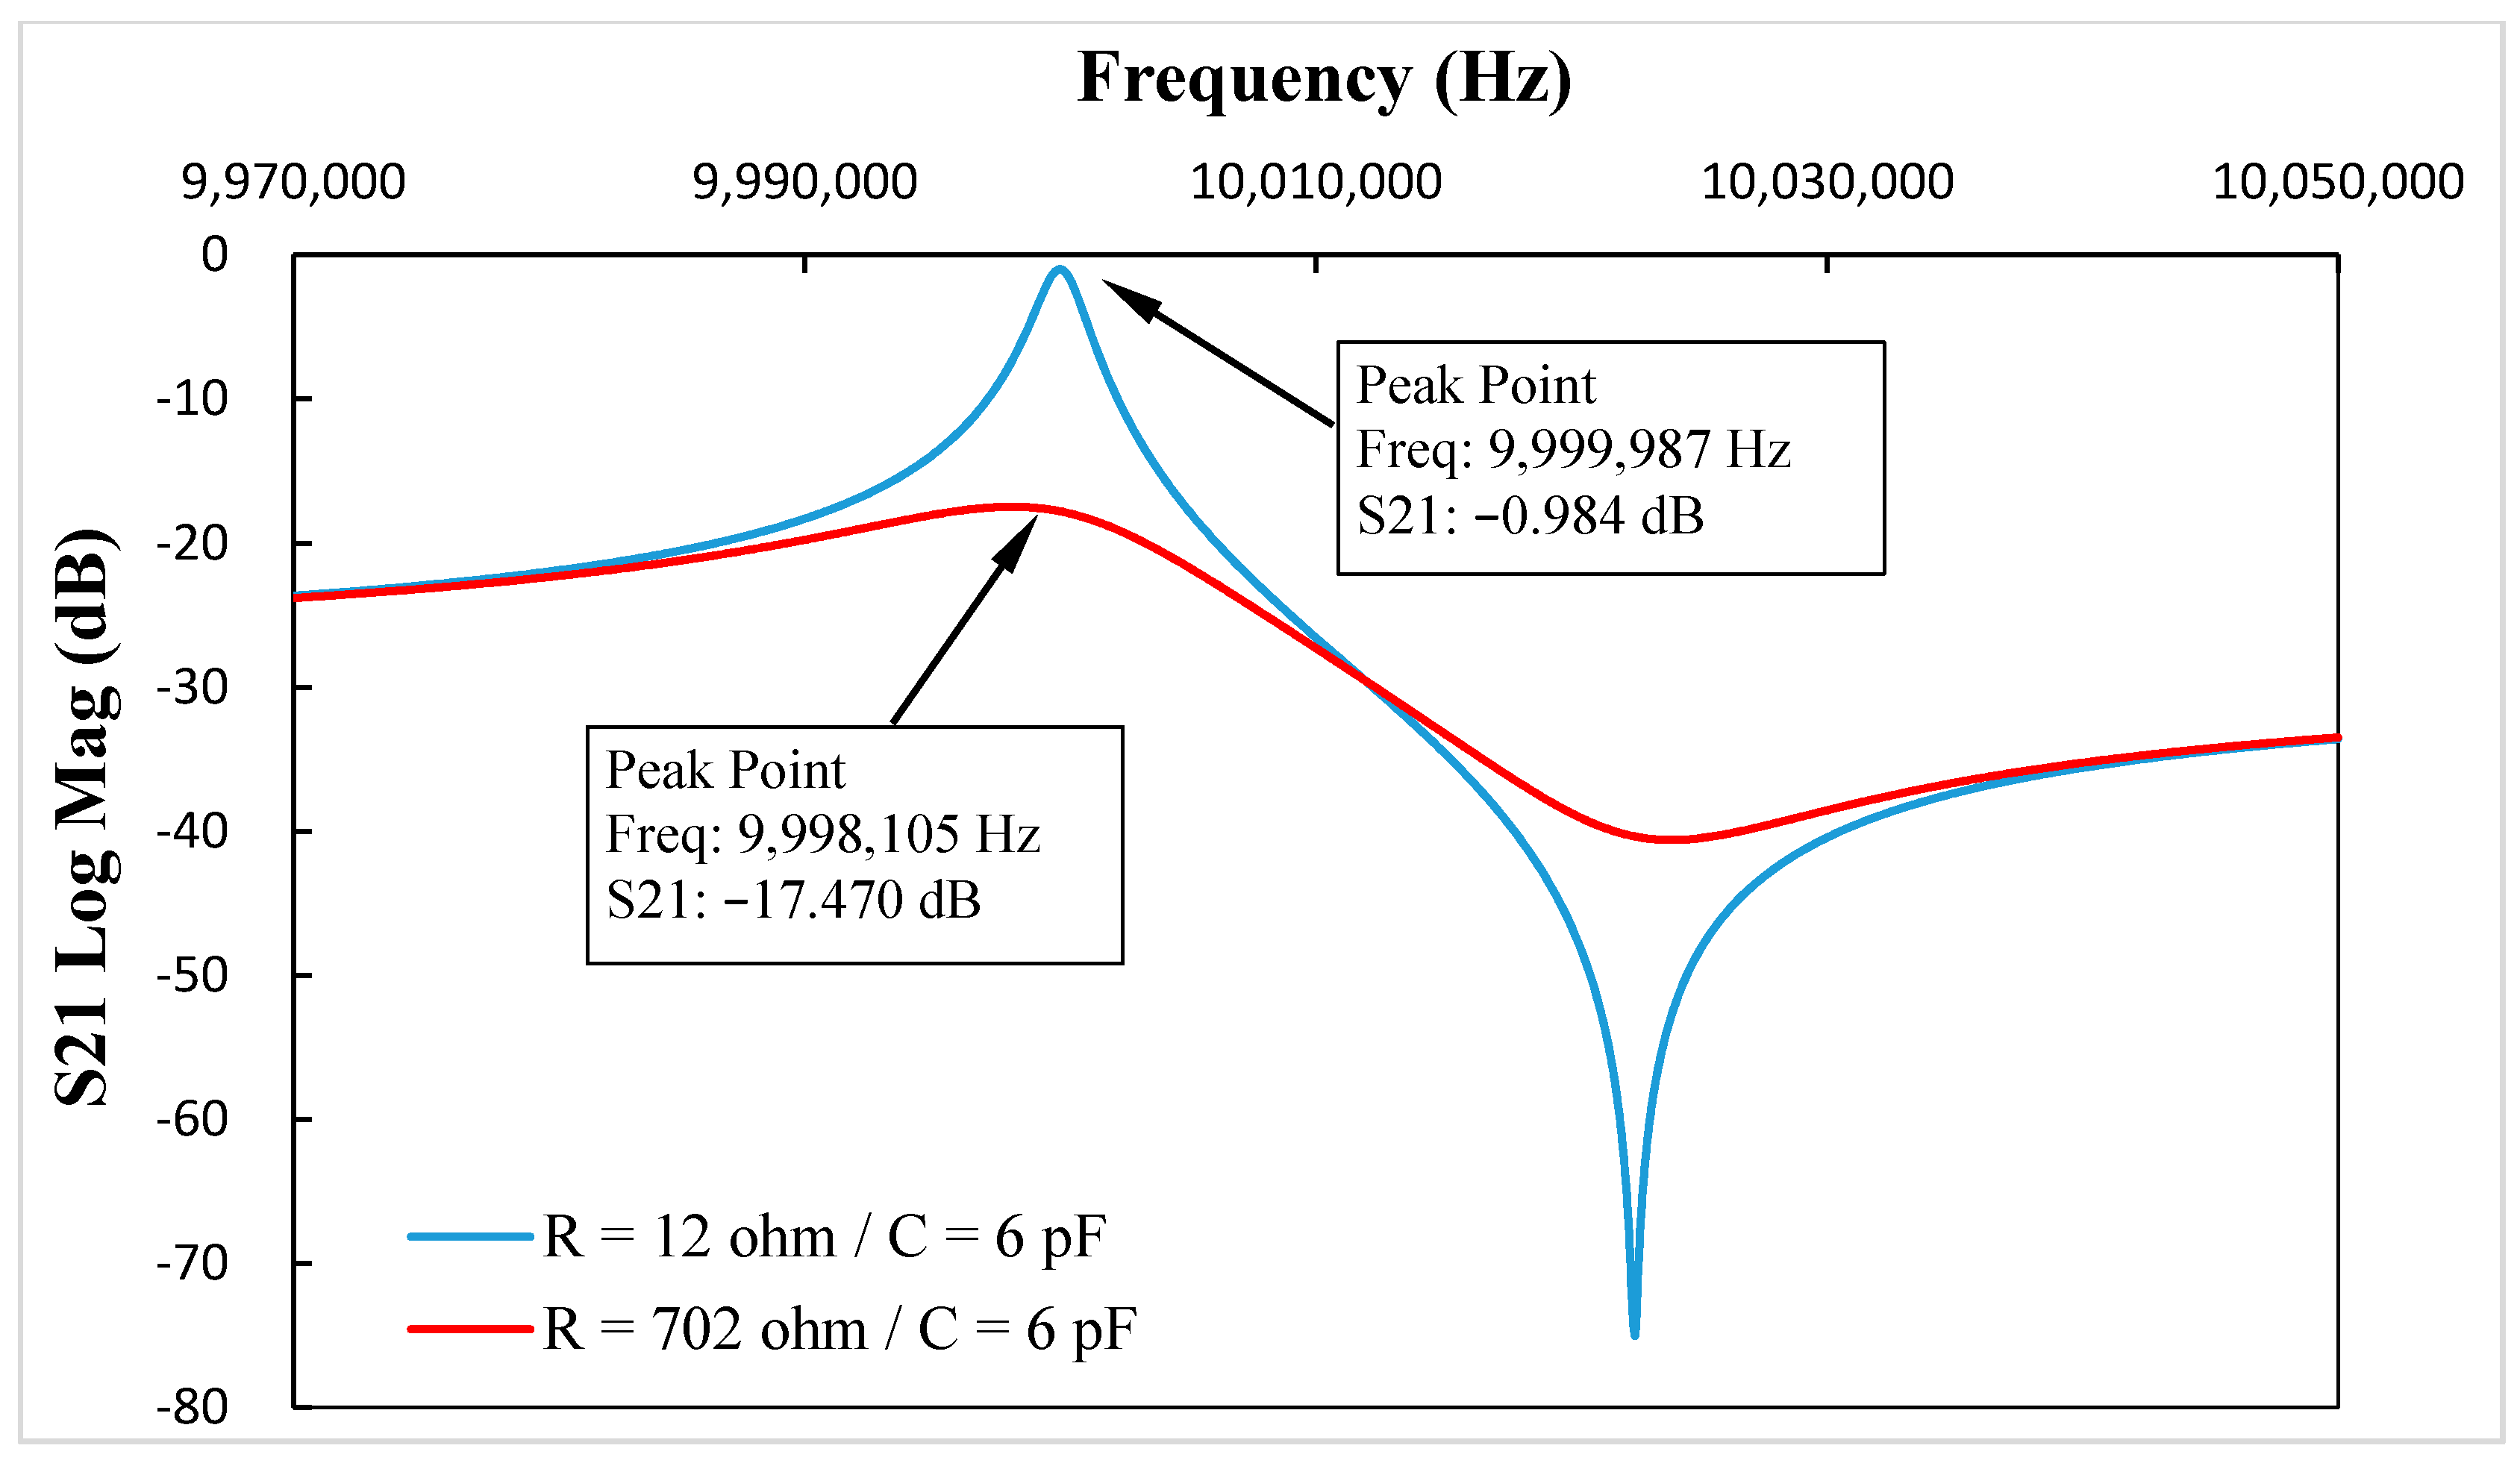
To illustrate the resistance-amplitude-frequency effect of in-liquid QCM more clearly, simulations were carried out using business software Advanced Design System (Agilent Technologies, Inc. Santa Clara, CA, USA) a professional commercial circuit simulation tool software and well suited to simulate the circuit’s S-parameters. The scheme of the BVD equivalent circuit simulation is shown in Figure 2. Using Groups 3–5 in Table 1 as instances, the S21 parameters vs. frequency curve with and without the added motional resistance are shown as Figure 3, Figure 4 and Figure 5, which reflect the same phenomenon.
By comparing the data in Table 1 and Figure 3, Figure 4 and Figure 5, the resonance damping caused by the added motional resistance was the same, and the changes in resonance frequency were different, but had the same trend. The reason leading to different resonance frequency shifts between the calculation results and the simulations was that two 50 Ohm impedances were added at each port when using the Advanced Design System (ADS) software to simulate the equivalent circuit. On the other hand, the symmetry of the two added impedances at two ports in the ADS simulations could eliminate the influence of the added impedances on the resonance damping simulations. Therefore, the resonance damping in the calculation and simulation results had the same values, and the resonance frequency changes in calculation and simulation results had different values but reflected the same trend.
3. Discussion
For in-liquid QCM applications, the viscous coupling of the contact liquid to the quartz crystal resonator surface resulted in decreases in both the resonant frequency of the QCM and damping of the resonance. Traditional knowledge has suggested that the resonance damping is only caused by the added equivalent resistance , and the resonant frequency change was only caused by the added equivalent inductance . However, both the theoretical calculations and simulations proved that the added equivalent resistance also caused resonant frequency change. Therefore, the in-liquid QCM resonant frequency change is comprised of two parts: the frequency change caused by the added equivalent motional inductance ; and the frequency change caused by the added resonant motional resistance . In actual measurements, the measured frequency change was , but the theoretical frequency change as per Equation (5) was just and did not contain . Although was smaller than in most applications, the influence of could not be ignored, especially in in-liquid QCM with large motional capacitance, as increased sharply along with increasing .
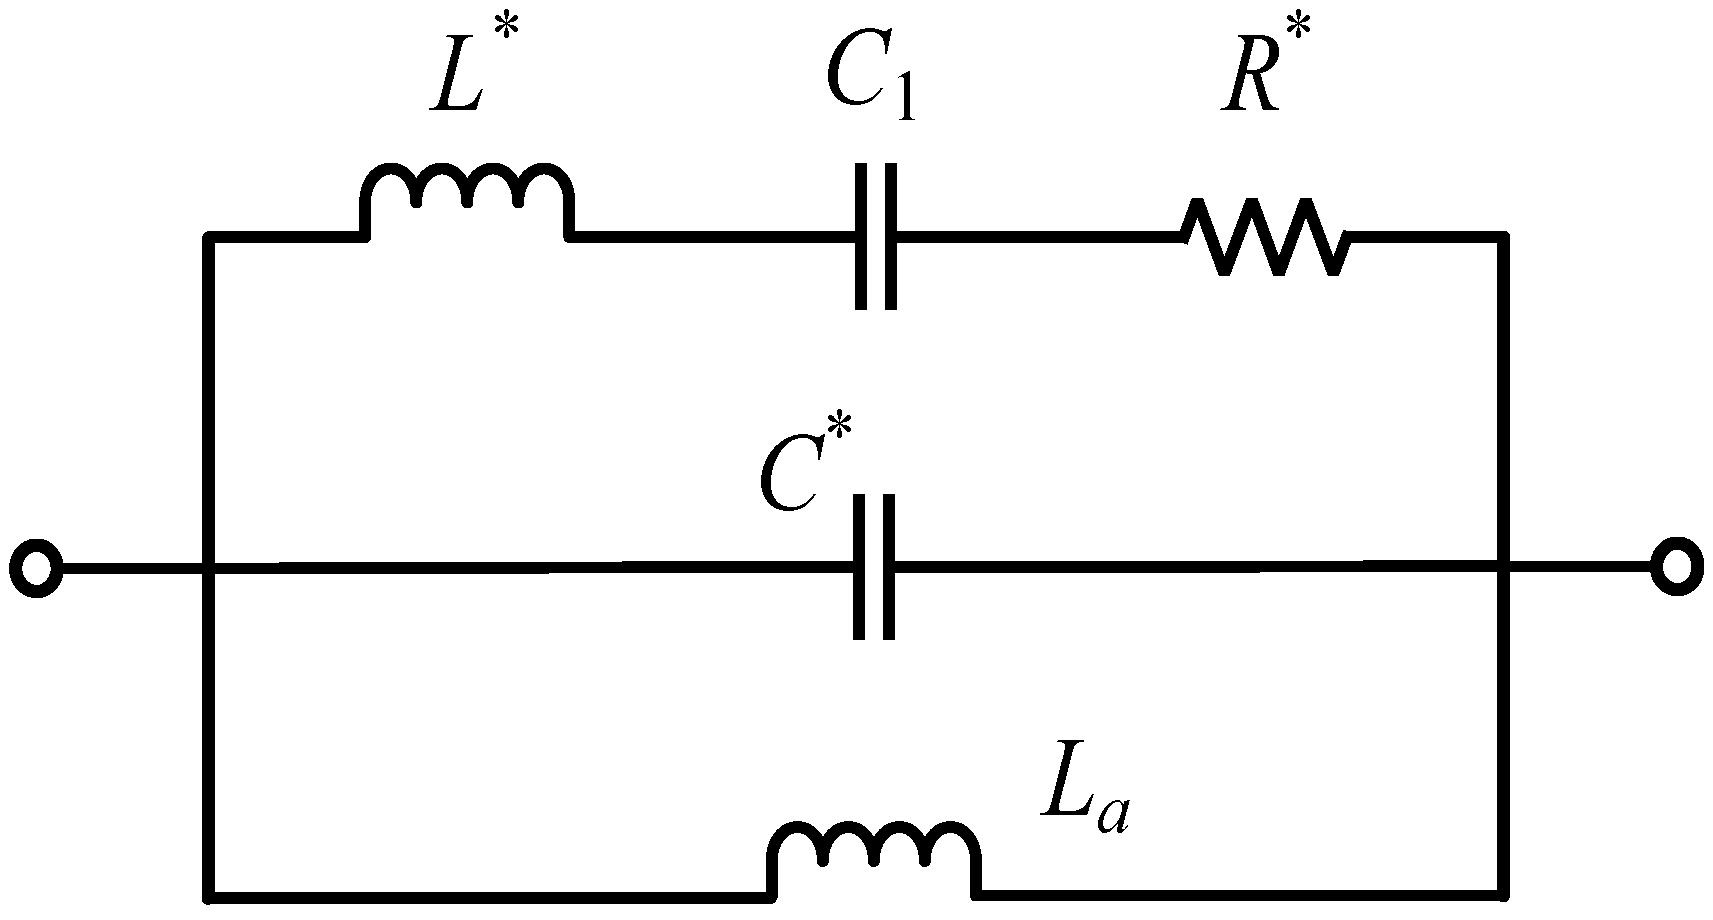
Currently, the frequency change is not easily measured accurately, which is an important area of future research. As we could not change the equivalent resistance alone in the actual experiment (the addition of a resistor in series with QCM could not model the increase of equivalent resistance), it was hard to isolate the frequency change caused by the added resonant motional resistance . Therefore, the existence of unpredictable will lead to errors for in-liquid QCM applications. To resolve these issues, a possible solution was presented: to add an inductance (make the resonant frequency of the oscillating circuit that consists of and equal to ) to eliminate the influence of on resonant frequency, as Figure 6 shows.
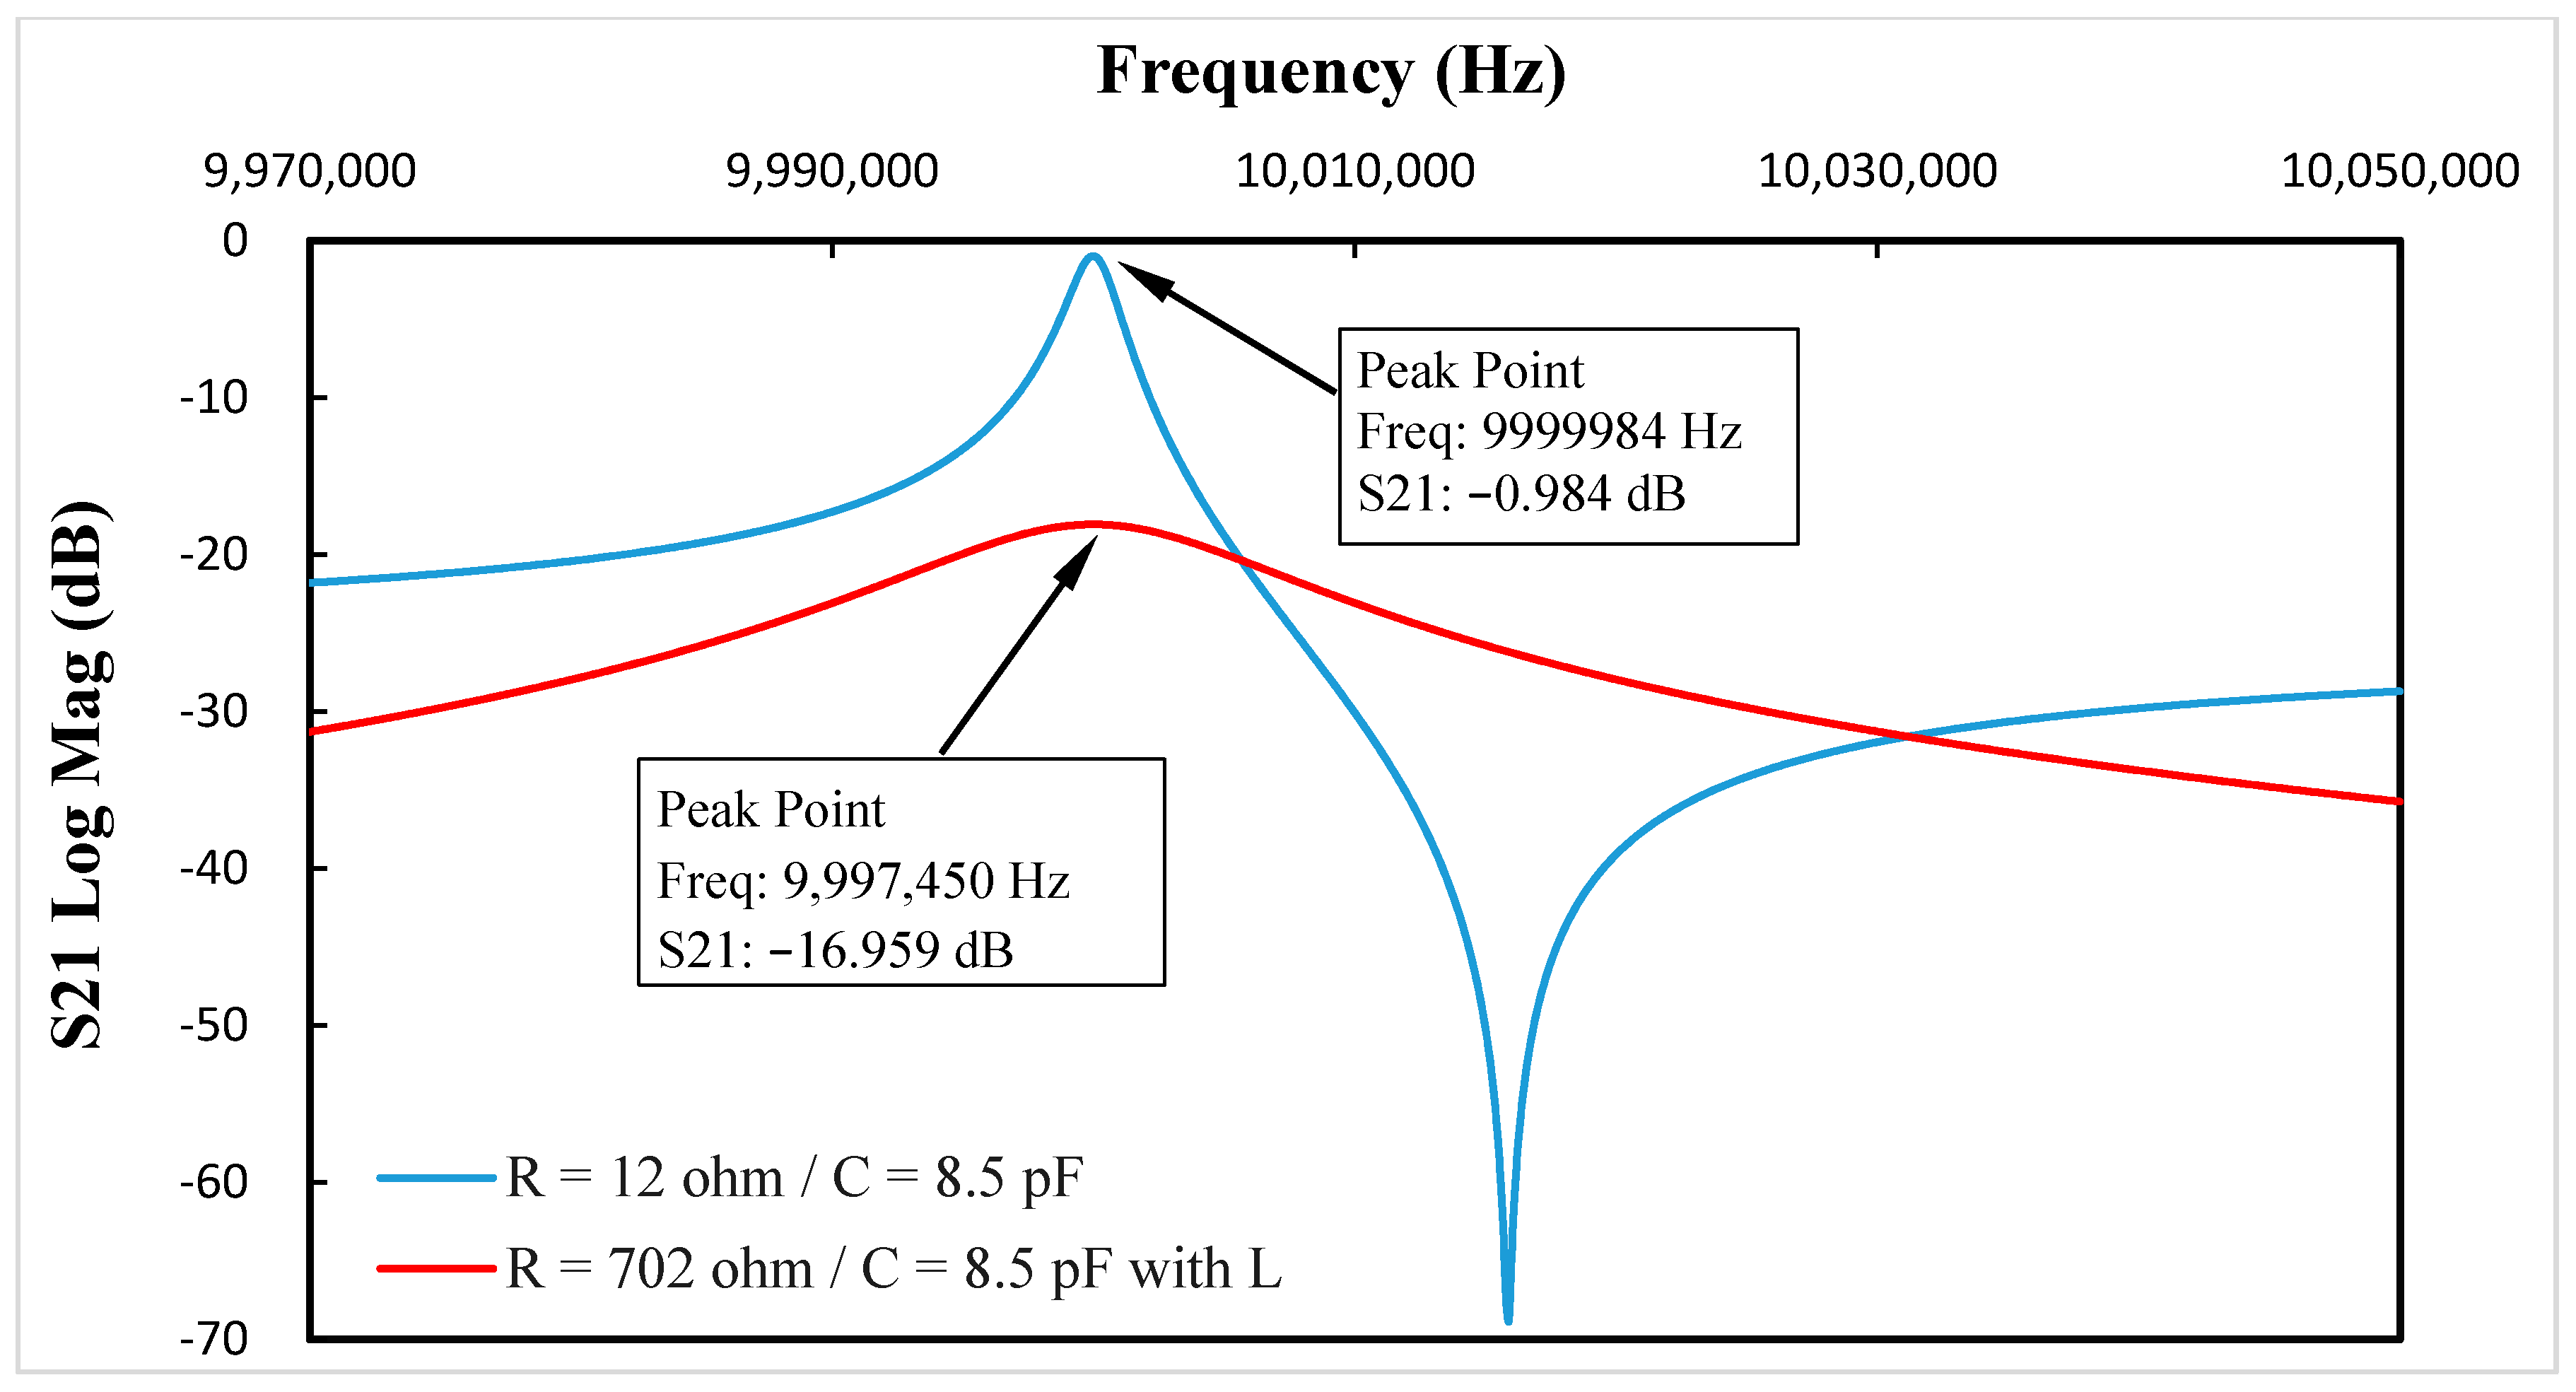
Using Group 5 in Table 1 as an example, the S21 parameters vs. frequency curve after added the inductance is shown in Figure 7. By comparing Figure 5 and Figure 7, it was clear that the addition of with a value of 29.8 µH, the resonance frequency change caused by the added resistance decreased from 2534 Hz to 9 Hz. Furthermore, resonance damping also increased.
4. Conclusions
For in-liquid QCM applications, the liquid load was equivalent to a mass loading () and a viscous loading (). The viscous coupling of the contact liquid to the QCM surface led to decreases in resonant frequency and increases in resonance damping. Unlike previous notions, motional resistance caused by viscous loading resulted not only in resonance damping, but also resonance frequency change. Furthermore, the resonant frequency change caused by the added motional resistance increased sharply along with increases in static capacitance. In addition, the resonance damping caused by the added motional resistance decreased along with static capacitance increasing. These results will be instrumental in understanding in-liquid QCM characterization, which is of importance in in-liquid QCM applications.
Author Contributions
X.H.H. conceived and designed the experiments, and performed the simulations and calculations; Q.S.B. helped perform the simulations and calculations, and was in charge of the paper writing; Q.Z. took part in the revision process; J.G.H. took part in the discussion of the results; and X.H.H. as group leader was responsible for project management and the revision of this manuscript.
Conflicts of Interest
The authors declare no conflict of interest.
References
- Fukao, N.; Kyung, K.H.; Fujimoto, K.; Shiratori, S. Automatic Spray-LBL Machine Based on in-Situ QCM Monitoring. Macromolecules 2011, 44, 2964–2969. [Google Scholar] [CrossRef]
- Huang, H.L.; Xu, Y.; Hong, Y.L. Effects of film thickness on moisture sorption, glass transition temperature and morphology of poly(chloro-p-xylylene) film. Polymer 2005, 46, 5949–5955. [Google Scholar] [CrossRef]
- Yao, Y.; Ma, W.Y. Self-Assembly of Polyelectrolytic/Graphene Oxide Multilayer Thin Films on Quartz Crystal Microbalance for Humidity Detection. IEEE Sens. J. 2014, 14, 4078–4084. [Google Scholar] [CrossRef]
- Pascal-Delannoy, F.; Sorli, B.; Boyer, A. Quartz Crystal Microbalance (QCM) used as humidity sensor. Sens. Actuators A Phys. 2000, 84, 285–291. [Google Scholar] [CrossRef]
- Yao, Y.; Chen, X.D.; Li, X.Y.; Chen, X.P.; Li, N. Investigation of the stability of QCM humidity sensor using graphene oxide as sensing films. Sens. Actuators B Chem. 2014, 191, 779–783. [Google Scholar] [CrossRef]
- Yao, Y.; Zhang, H.; Huang, X.H. Enhanced sensitivity of quartz crystal proximity sensors using an asymmetrical electrodes configuration. Sens. Actuators A Phys. 2017, 258, 95–100. [Google Scholar] [CrossRef]
- Chang, W.T. Metal-electrode-sandwiched quartz crystal-based oscillator as proximity sensor. Sens. Actuators A Phys. 2011, 171, 292–296. [Google Scholar] [CrossRef]
- Procek, M.; Stolarczyk, A.; Pustelny, T.; Maciak, E. A Study of a QCM Sensor Based on TiO2 Nanostructures for the Detection of NO2 and Explosives Vapours in Air. Sensors 2015, 15, 9563–9581. [Google Scholar] [CrossRef] [PubMed]
- Wang, X.F.; Ding, B.; Sun, M.; Yu, J.Y.; Sun, G. Nanofibrous polyethyleneimine membranes as sensitive coatings for quartz crystal microbalance-based formaldehyde sensors. Sens. Actuators B Chem. 2009, 144, 11–17. [Google Scholar] [CrossRef]
- Selyanchyn, R.; Korposh, S.; Wakamatsu, S.; Lee, S.W. Respiratory Monitoring by Porphyrin Modified Quartz Crystal Microbalance Sensors. Sensors 2011, 11, 1177–1191. [Google Scholar] [CrossRef] [PubMed]
- Sauerbrey, G. Use of quartz vibration for weighing thin films on a microbalance. Z. Phys. 1959, 155, 206–212. [Google Scholar] [CrossRef]
- Hillier, A.C.; Ward, M.D. Scanning electrochemical mass sensitivity mapping of the quartz crystal microbalance in liquid media. Anal. Chem. 1992, 64, 2539–2554. [Google Scholar] [CrossRef]
- Nomura, T.; Okuhara, M. Frequency shift of piezoelectric quartz crystals immersed in organic liquids. Anal. Chim. Acta 1982, 142, 281–284. [Google Scholar] [CrossRef]
- Sato, T.; Izyan Ruslan, R.; Goto, S.; Akitsu, T. Double-Resonance Quartz Crystal Oscillator and Excitation of a Resonator Immersed in Liquid Media. IEEE Trans. Ultrason. Ferroelectr. Freq. Control 2011, 58, 788–797. [Google Scholar] [CrossRef] [PubMed]
- Sigalov, S.; Levi, M.D.; Salitra, G.; Aurbach, D.; Maier, J. EQCM as a unique tool for determination of ionic fluxes in microporous carbons as a function of surface charge distribution. Electrochem. Commun. 2010, 12, 1718–1721. [Google Scholar] [CrossRef]
- Levi, M.D.; Sigalov, S.; Salitra, G.; Aurbach, D. Quartz crystal microbalance with dissipation monitoring (EQCM-D) for in-situ studies of electrodes for supercapacitors and batteries: A mini-review. Electrochem. Commun. 2016, 67, 16–21. [Google Scholar] [CrossRef]
- Tsai, W.-Y.; Taberna, P.L.; Patrice, S. Electrochemical quartz crystal microbalance (EQCM) study of ion dynamics in nanoporous carbons. J. Am. Chem. Soc. 2014, 136, 8722–8728. [Google Scholar] [CrossRef] [PubMed]
- Diltemiz, S.E.; Keçili, R.; Ersöz, A.; Say, R. Molecular Imprinting Technology in Quartz Crystal Microbalance (QCM) Sensors. Sensors 2017, 17, 454. [Google Scholar] [CrossRef] [PubMed]
- Yao, C.Y.; Qu, L.; Fu, W.L. Detection of Fibrinogen and Coagulation Factor VIII in Plasma by a Quartz Crystal Microbalance Biosensor. Sensors 2013, 13, 6946–6956. [Google Scholar] [CrossRef] [PubMed]
- Cho, N.J.; Frank, C.W.; Kasemo, B.; Hook, F. Quartz crystal microbalance with dissipation monitoring of supported lipid bilayers on various substrates. Nat. Protoc. 2010, 5, 1096–1106. [Google Scholar] [CrossRef] [PubMed]
- Yao, C.Y.; Zhu, T.Y.; Qi, Y.Z.; Zhao, Y.H.; Xia, H.; Fu, W.L. Development of a Quartz Crystal Microbalance Biosensor with Aptamers as Bio-recognition Element. Sensors 2010, 10, 5859–5871. [Google Scholar] [CrossRef] [PubMed]
- Xiao, Y.H.; Liu, Y.; Borg, G.; Withers, R.L.; Li, Z.R.; Xu, Z.; Li, C.M. Lead magnesium niobate-lead titanate piezoelectric immunosensors. Sens. Actuators A Phys. 2010, 163, 82–87. [Google Scholar] [CrossRef]
- Yang, Y.; Tu, Y.F.; Wang, X.S.; Pan, J.Y.; Ding, Y. A Label-Free Immunosensor for Ultrasensitive Detection of Ketamine Based on Quartz Crystal Microbalance. Sensors 2015, 15, 8540–8549. [Google Scholar] [CrossRef] [PubMed]
- Akter, R.; Rhee, C.K.; Rahman, M.A. A highly sensitive quartz crystal microbalance immunosensor based on magnetic bead-supported bienzymes catalyzed mass enhancement strategy. Biosens. Bioelectron. 2015, 66, 539–546. [Google Scholar] [CrossRef] [PubMed]
- Ertekin, Ö.; Öztürk, S.; Öztürk, Z.Z. Label Free QCM Immunobiosensor for AFB1 Detection Using Monoclonal IgA Antibody as Recognition Element. Sensors 2016, 16, 1274. [Google Scholar] [CrossRef] [PubMed]
- Butterworth, S. On Electrically-maintained Vibrations. Proc. Phys. Soc. Lond. 1914, 27, 410–424. [Google Scholar] [CrossRef]
- Van Dyke, K.S. The piezo-electric resonator and its equivalent network. Proc. Inst. Radio Eng. 1928, 16, 742–764. [Google Scholar] [CrossRef]
- Martin, S.J.; Granstaff, V.E.; Frye, G.C. Characterization of a quartz crystal microbalance with simultaneous mass and liquid loading. Anal. Chem. 1991, 63, 2272–2281. [Google Scholar] [CrossRef]
Figure 1.
The Butterworth-Van Dyke (BVD) equivalent circuit for (a) an unloaded quartz crystal microbalance (QCM); and (b) a QCM under viscous and mass loading.
Figure 1.
The Butterworth-Van Dyke (BVD) equivalent circuit for (a) an unloaded quartz crystal microbalance (QCM); and (b) a QCM under viscous and mass loading.

Figure 2.
The Butterworth-Van Dyke (BVD) equivalent circuit schematic of Advanced Design System (ADS) simulation.
Figure 2.
The Butterworth-Van Dyke (BVD) equivalent circuit schematic of Advanced Design System (ADS) simulation.

Figure 3.
When = 3.5 pF, the S21 parameters vs. frequency curve with and without added motional resistance.
Figure 3.
When = 3.5 pF, the S21 parameters vs. frequency curve with and without added motional resistance.

Figure 4.
When = 6.0 pF, the S21 parameters vs. frequency curve with and without added motional resistance.
Figure 4.
When = 6.0 pF, the S21 parameters vs. frequency curve with and without added motional resistance.

Figure 5.
When = 8.5 pF, the S21 parameters vs. frequency curve with and without added motional resistance.
Figure 5.
When = 8.5 pF, the S21 parameters vs. frequency curve with and without added motional resistance.

Figure 6.
The equivalent circuit for an in-liquid QCM after the addition of inductance .

Figure 7.
When = 8.5 pF, the S21 parameters vs. frequency curve after the addition of inductance .


Table 1.
The calculated results using the BVD equivalent circuit model.
| Resonance Damping (dB) | |||||||
|---|---|---|---|---|---|---|---|
| Group 1 | 12 | 9.3816 | 27 | 0.0 | 9,999,995 | 0 | –0.984 |
| 702 | 9.3816 | 27 | 0.0 | 9,999,995 | –18.083 | ||
| Group 2 | 12 | 9.3816 | 27 | 1.0 | 9,999,995 | 262 | –0.984 |
| 702 | 9.3816 | 27 | 1.0 | 9,999,733 | –18.065 | ||
| Group 3 | 12 | 9.3816 | 27 | 3.5 | 9,999,995 | 898 | –0.984 |
| 702 | 9.3816 | 27 | 3.5 | 9,999,097 | –17.860 | ||
| Group 4 | 12 | 9.3816 | 27 | 6.0 | 9,999,995 | 1478 | –0.984 |
| 702 | 9.3816 | 27 | 6.0 | 9,998,517 | –17.470 | ||
| Group 5 | 12 | 9.3816 | 27 | 8.5 | 9,999,995 | 1983 | –0.984 |
| 702 | 9.3816 | 27 | 8.5 | 9,998,012 | –16.959 |
© 2017 by the authors. Licensee MDPI, Basel, Switzerland. This article is an open access article distributed under the terms and conditions of the Creative Commons Attribution (CC BY) license (http://creativecommons.org/licenses/by/4.0/).
Share and Cite
MDPI and ACS Style
Huang, X.; Bai, Q.; Zhou, Q.; Hu, J. The Resistance–Amplitude–Frequency Effect of In–Liquid Quartz Crystal Microbalance. Sensors 2017, 17, 1476. https://doi.org/10.3390/s17071476
AMA Style
Huang X, Bai Q, Zhou Q, Hu J. The Resistance–Amplitude–Frequency Effect of In–Liquid Quartz Crystal Microbalance. Sensors. 2017; 17(7):1476. https://doi.org/10.3390/s17071476
Chicago/Turabian StyleHuang, Xianhe, Qingsong Bai, Qi Zhou, and Jianguo Hu. 2017. "The Resistance–Amplitude–Frequency Effect of In–Liquid Quartz Crystal Microbalance" Sensors 17, no. 7: 1476. https://doi.org/10.3390/s17071476
Note that from the first issue of 2016, this journal uses article numbers instead of page numbers. See further details here.