Size Controlled Copper (I) Oxide Nanoparticles Influence Sensitivity of Glucose Biosensor


1
Department of Mechanical Engineering, Iowa State University, Ames, IA 50011, USA
2
Microelectronics Research Center, Iowa State University, Ames, IA 50011, USA
*
Author to whom correspondence should be addressed.
Sensors 2017, 17(9), 1944; https://doi.org/10.3390/s17091944
Submission received: 14 July 2017
/
Revised: 20 August 2017
/
Accepted: 21 August 2017
/
Published: 24 August 2017
(This article belongs to the Special Issue Sensors for Health Monitoring and Disease Diagnosis)
Abstract
:Copper (I) oxide (Cu2O) is an appealing semiconducting oxide with potential applications in various fields ranging from photovoltaics to biosensing. The precise control of size and shape of Cu2O nanostructures has been an area of intense research. Here, the electrodeposition of Cu2O nanoparticles is presented with precise size variations by utilizing ethylenediamine (EDA) as a size controlling agent. The size of the Cu2O nanoparticles was successfully varied between 54.09 nm to 966.97 nm by changing the concentration of EDA in the electrolytic bath during electrodeposition. The large surface area of the Cu2O nanoparticles present an attractive platform for immobilizing glucose oxidase for glucose biosensing. The fabricated enzymatic biosensor exhibited a rapid response time of <2 s. The limit of detection was 0.1 μM and the sensitivity of the glucose biosensor was 1.54 mA/cm2. mM. The Cu2O nanoparticles were characterized by UV-Visible spectroscopy, scanning electron microscopy and X-ray diffraction.
1. Introduction
Copper (I) oxide (Cu2O) is a highly attractive oxide semiconductor due to its unique properties. It is a p-type semiconductor having a direct bandgap of 2 eV. Cu2O is a non-toxic material and its starting material, copper, is abundantly available. Furthermore, the fabrication and processing of Cu2O is inexpensive. Due to these advantages, Cu2O has potential applications in several fields including photovoltaics, catalysis, batteries, gas sensing and biosensing [1,2,3,4,5,6,7,8,9]. In photovoltaics, Cu2O presents a promising alternative to silicon and other potential semiconductors. The author, Rai, in a review article has provided a comprehensive overview of Cu2O as an appealing material for solar cells including the inexpensive fabrication methods, the construction of a solar cell followed by its performance. This review also highlights the advantages of the Cu2O material and some of its drawbacks [4]. It has been demonstrated that Cu2O is a potential material for gas sensing. Deng and co-workers have used graphene oxide conjugated with Cu2O nanowires for nitrogen dioxide sensing. Here they demonstrated the crystallization of Cu2O in the presence of graphene oxide to form nanowires, which were highly anisotropic. These structures show a high performance, as compared to the separate systems of Cu2O and graphene oxide [5]. In another application, Cu2O was utilized as a photocathode for solar water splitting [10]. Paracchino and co-workers demonstrated a highly efficient Cu2O photocathode with the highest recorded photocurrent of −7.6 mA/cm2 [10]. The Cu2O nanostructures have also been utilized as platforms for biosensing. Zhu and co-workers synthesized Cu2O hollow microspheres with the help of polyvinylpyrrolidone [11]. The Cu2O hollow microspheres were investigated for biosensing applications and served as an excellent immobilization platform for the DNA probe and enhanced the sensitivity of the DNA biosensor. In a similar study, an enzymatic biosensor was fabricated using graphene oxide, zinc oxide and Cu2O [12]. The composite biosensing electrode exhibited enhanced immobilization of glucose oxidase (GOx) enzyme with a linear range of 0.01–2 mM and the detection limit of 1.99 μM.
In all the above studies the Cu2O nanostructures were presented in varying morphologies ranging from thin film to nanocubes. Thus, it is pertinent to note that Cu2O can be fabricated in several different morphologies. The variations in morphologies has been studied and well documented in the literature. It has been demonstrated that variation in morphology can affect the properties of Cu2O including their optical and electronic properties. Radi and co-workers fabricated size and shape controlled Cu-Cu2O core shell nanoparticles via electrodeposition on H terminated silicon [13]. The size was varied between 5–400 nm and different shapes including cubic, cuboctahedral, and octahedral were obtained by controlling the deposition time and the electrolyte concentration respectively. Zhang and co-workers synthesized nearly monodispersed Cu2O nanoparticles by a hydrothermal method [14]. Here, they observed that by carefully changing the reactant concentration the Cu2O nanoparticle size, monodispersity and crystallinity can be controlled. In another example, Xu and co-workers synthesized octahedral Cu2O nanoparticles with varying edge length from 130 nm to 600 nm [15]. This variation in edge length was carried out by adjusting the molar ratio of the reactants. The absorption properties of these Cu2O nanoparticles also varied and thus demonstrated improved ability in photodegradation of methyl orange compared to cubic Cu2O nanoparticles. Feng and co-workers demonstrated the formation of hollow spherical and octahedral Cu2O nanocrystals in the presence of EDA and sodium hydroxide [16]. The change in morphology affected the photocatalytic activity of the Cu2O nanocrystals. Thus, size and shape control of the Cu2O nanoparticles can alter their properties significantly.
In the present work, a strong control over the size of the Cu2O nanoparticle during electrodeposition was demonstrated by utilizing ethylenediamine (EDA) in the electrolytic bath. To the best of our knowledge, this is the first report of size-controlled synthesis of Cu2O nanoparticles, using EDA during the electrodeposition technique. The electrodeposition method is facile, inexpensive and scalable [17,18,19]. It can be used for precise control of size and morphology of the depositing species. The Cu2O nanoparticles have been synthesized in varying sizes from 54.09 nm to 966 nm. The Cu2O nanoparticle electrodes, fabrication by the above mentioned route, were utilized for the first time as platform for glucose biosensing. The current response of the Cu2O electrodes indicates that the nanoparticle size has a strong influence on the sensitivity of the glucose biosensor. The Cu2O electrodes were characterized by UV-visible spectroscopy (UV-Vis), scanning electron microscopy (SEM) and X-ray diffraction (XRD).
2. Materials and Methods
2.1. Materials
The chemicals used for the electrodeposition of Cu2O were cupric sulfate pentahydrate (CuSO4·5H2O, ≥98%), ethylenediamine (EDA), lactic acid (C3H6O3, ≥88.5%) and potassium hydroxide (KOH, ≥85.8%). These chemicals were purchased from Fisher Scientific (Hanover Park, IL, USA). The chemicals did not require any further purification and thus were used as purchased. The aqueous solutions were prepared by dissolving the precursor in deionized water. The electrodeposition was performed on a fluorine doped tin oxide (FTO) coated on glass substrate. The size and conductivity of the substrate was 25 mm × 25 mm × 1.1 mm and 6–8 ohm/sq. respectively. The substrate was purchased from University Wafer Inc. (Boston, MA, USA). The chemicals used for cleaning the FTO substrate were acetone (100%, 200 proof), hydrochloric acid (HCl) and nitric acid (HNO3).
2.2. Fabrication of Cu2O Electrode via Electrodeposition
The electrodeposition was performed in an electrochemical cell (Figure 1a). For the electrodeposition of Cu2O, an Ag/AgCl wire was used as the reference electrode (Figure 1b). A platinum wire of 2 mm diameter served as the counter electrode (Figure 1c) and an FTO substrate was the working electrode (Figure 1d). Prior to electrodeposition, the FTO substrate was sonicated for 10 min in a bath of acetone. It was then cleaned by hydrochloric acid (HCl) followed by nitric acid (HNO3) for 2 min each. The substrate was rinsed with deionized water between every cleaning step.
For the electrodeposition of Cu2O nanoparticles, the CuSO4·5H2O precursor was dissolved in deionized water. The aqueous solution was stabilized by the addition of C3H6O3 to the solution. The addition of EDA was carried out after the copper precursor was completely dissolved in solution. The pH of the final solution was adjusted, to 13, by utilizing KOH. The electrodeposition temperature was kept at 50 °C. The duration for electrodeposition was 30 min. During electrodeposition, the applied potential was −0.6 V.
2.3. Fabrication of Enzymatic Biosensor
The glucose oxidase (GOx), enzyme was immobilized on the Cu2O electrode by electrostatic interaction. Since the isoelectric point (IEP) of GOx is 4.5 and that of Cu2O nanoparticles is ~11, the electrostatic interaction is strong leading to successful immobilization [20]. The GOx enzyme solution was prepared by dissolving 1 mg of GOx in 1 mL of 10 mM phosphate buffer saline (PBS) at a pH of 7.4. The immobilization was carried out by drop casting 100 μL of the GOx enzyme solution onto the Cu2O electrode and left to dry for 2 h at room temperature. The dried electrode was rinsed with PBS to discard any enzyme that was not immobilized. The Cu2O electrode with immobilized GOx was stored in PBS at 4 °C overnight in a refrigerator.
2.4. Characterization
The absorption properties of the fabricated Cu2O nanoparticles was studied by a UV-Visible spectrometer, which was a Lambda 25 instrument. The morphology of the Cu2O nanoparticles was evaluated by scanning electron microscopy (SEM), a FEI Quanta-250 SEM instrument operating at 10 kV accelerating voltage. The composition of the Cu2O nanoparticles was investigated by X-ray diffraction (XRD). The XRD instrument was a Siemens D500. The X-ray diffractometer utilized a Cu Kα radiation (λ = 1.5406 Å) at 45 kV and 30 mA, with a scanning range of 20° to 80° and a scan step of 0.05°. The electrodeposition was carried out by using a CHI601E potentiostat from CH Instruments.
3. Results and Discussion
3.1. Characterization of Electrodeposited Cu2O Nanoparticles
The composition and crystallinity of the deposited Cu2O nanoparticles was characterized by X-ray diffraction. Figure 2a shows XRD plots of Cu2O nanoparticles with varying EDA content. The XRD plots were indexed and matched well with the Cu2O reference (JCPDS: 05–0667), having a cubic crystal structure. The XRD plots clearly show (111), (200) and (220) peaks for Cu2O. The intensity of the XRD peaks decreased with increase in the EDA content in the Cu2O samples. It was also observed that the sample thickness reduced with increase in the EDA content. Additionally, it was observed that the peak positions were shifted to higher Bragg values with increase in the EDA content (Figure 2b). This shift can be attributed to the decrease in the lattice parameter with increase in the EDA content. The peak position, in Figure 2b, for the samples with varying EDA content have been offset along the Y axis for clear viewing.
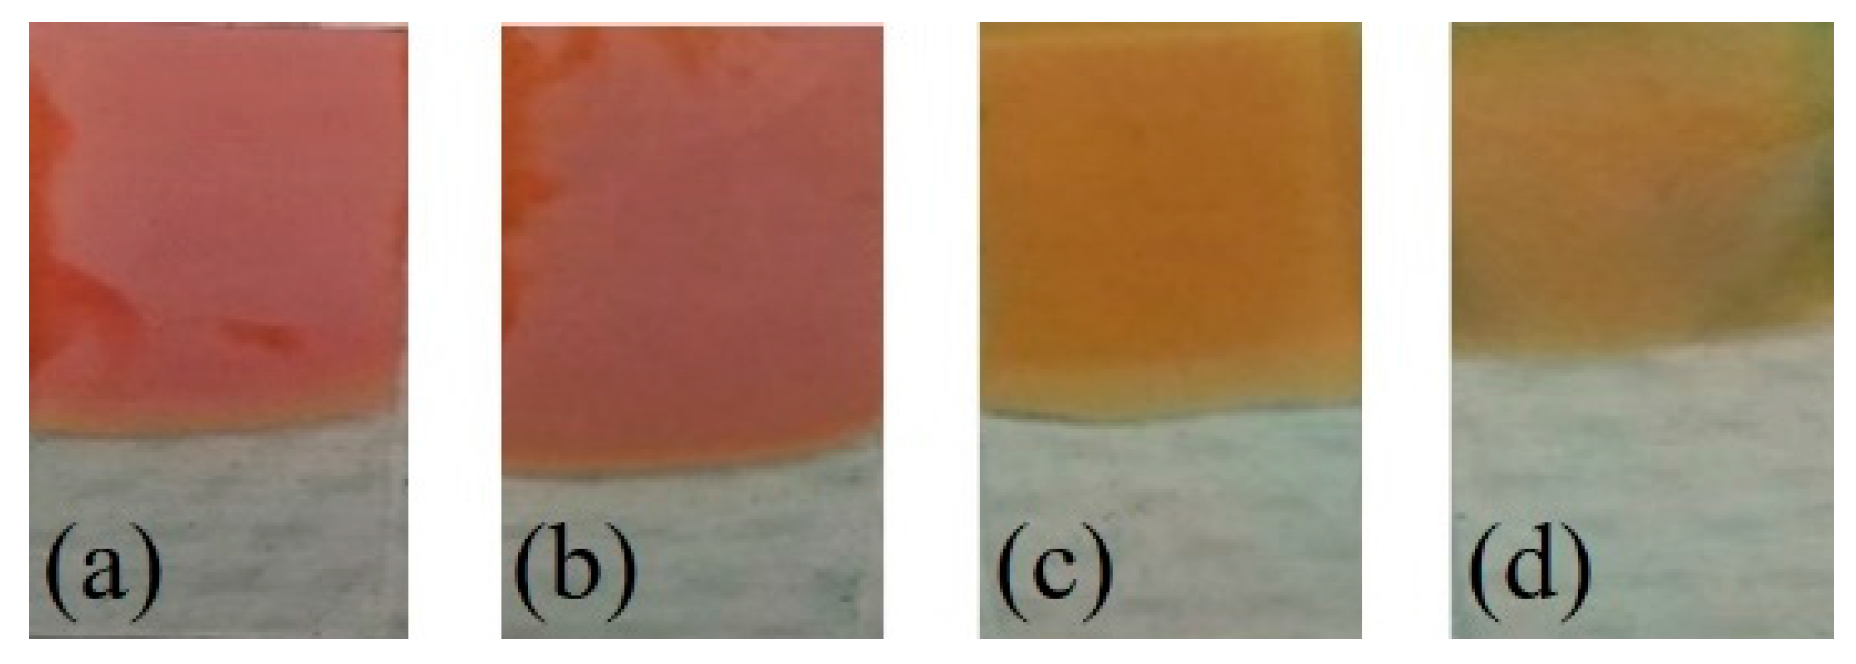
The photographs of the Cu2O nanoparticles electrodeposited on the FTO substrates are shown in Figure 3. These Cu2O nanoparticles were prepared with increasing content of EDA solution, from 0.2 mL to 1 mL, in the electrolytic bath during deposition. From these photographs it was clear that there was a distinct difference in the color of the Cu2O samples with increasing EDA content during deposition. The Cu2O sample with 0.2 mL of EDA appeared red-orange in color (Figure 3a), while the sample with 1 mL of EDA appeared yellow in color (Figure 3d). Thus these photographs suggested that there was a change in the absorption properties of the samples with increase in the EDA content in the deposition process.
Additionally, UV-Vis absorption spectra were collected from the Cu2O samples to evaluate their absorption properties. Figure 4 shows UV-Vis spectra for Cu2O samples with EDA content of 0.2 mL and 1 mL. The absorption between 350 nm and 550 nm was assigned to the inter-band transition in Cu2O nanoparticles. Further, the broad band feature around 700 nm was attributed to the localized surface plasmon resonance, which is observed in Cu2O nanoparticles [21]. Additionally, a blue shift in the absorption spectra indicated a decrease in the nanoparticle size with increase in the EDA content of the Cu2O samples. The differences in the absorption spectra for 0.2 mL and 1 mL EDA can be related to the photographs shown in Figure 2. For Cu2O sample with 0.2 mL EDA, the combination of absorption peaks at 510 nm and 700 nm can be related to the red-orange color (Figure 3a,b). As the EDA content was increased to 1 mL, the absorption peak blue shifted to 475 nm and a higher intensity broader peak was observed beyond 600 nm. The absorption peak combination of 475 nm and higher intensity at 700 nm can be related to the yellowish color of the Cu2O sample with 1 mL EDA (Figure 3c,d).
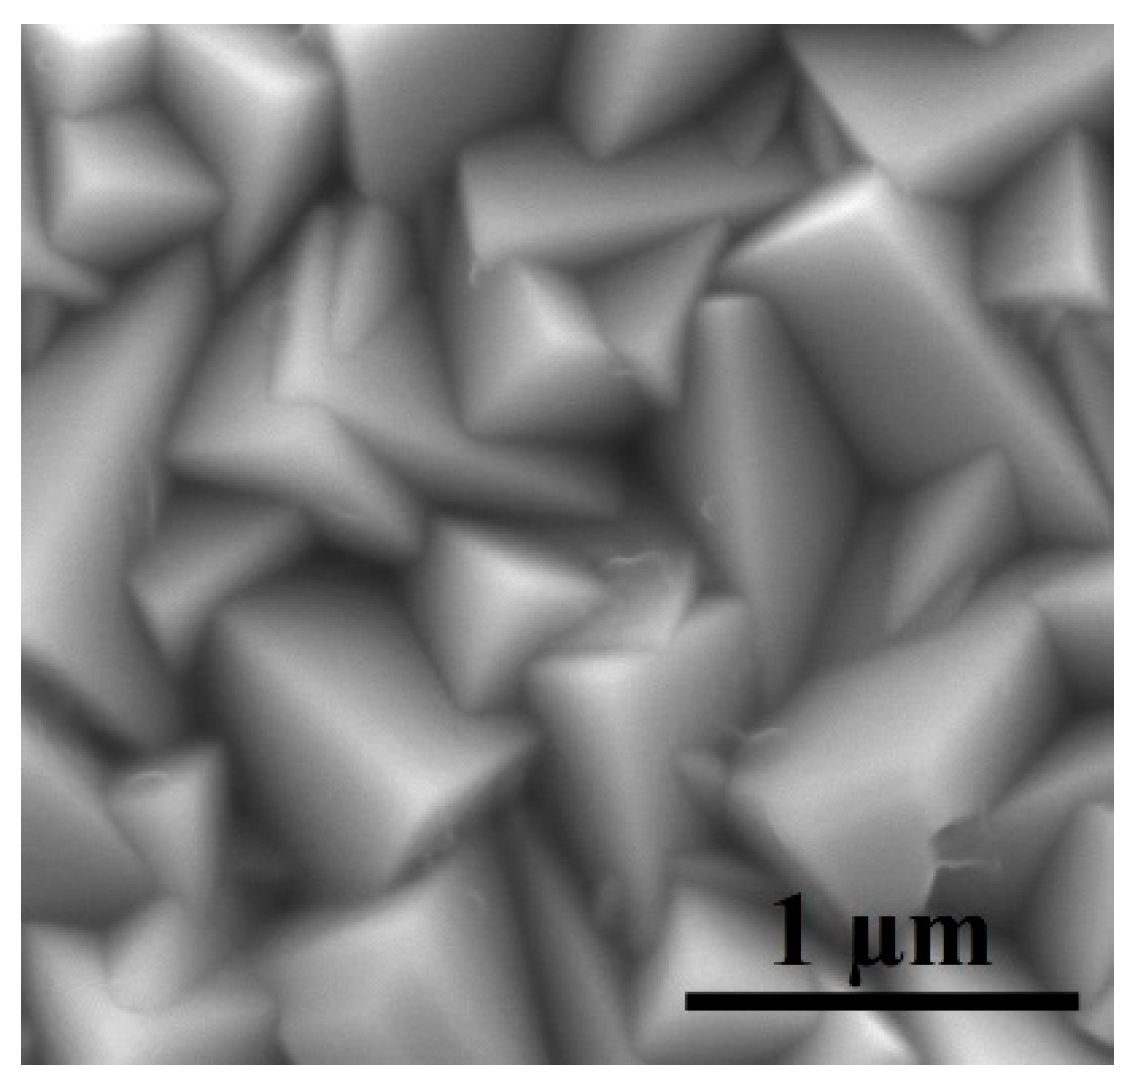
To further probe the nanoparticles size of the Cu2O samples, a series of SEM images were obtained and particle size distribution was calculated. Figure 5 shows the SEM image of Cu2O nanoparticles fabricated in the absence of EDA. Here, we observe a cubic structure of the Cu2O nanoparticles with size approximately 750 nm.
Figure 6 shows SEM images of Cu2O oxide samples with increasing EDA content along with their corresponding size distribution. Figure 6a shows Cu2O nanoparticles deposited in the presence of 0.2 mL of EDA in the electrolytic bath. The shape of the Cu2O nanoparticles appear to be mix of triangular and rhombic shapes. When the EDA content was increased to 0.4 mL the average nanoparticle size decreased. The SEM image in Figure 6c shows a combination of large and small nanoparticles. It was also observed that all the nanoparticles had similar shapes as seen in Figure 6a. Further increase in the EDA content to 0.8 mL did not show any apparent change in the Cu2O nanoparticle size and shape (Figure 6e). However, with additional increase in the EDA content to 1 mL, drastic decrease in the nanoparticle size and shape was observed (Figure 6g). Here, a bimodal distribution was observed. This distribution is confirmed by the SEM image for 1 mL EDA sample, which shows small Cu2O nanoparticles underneath larger nanoparticles. Moreover, the nanoparticle size distribution appeared to be narrow for both nanoparticle sizes. The nanoparticles were quasi spherical in shape. Table 1 provides the average nanoparticle size for Cu2O samples under investigation in the present work.
3.2. Cu2O Nanoparticles as Biosensing Platform
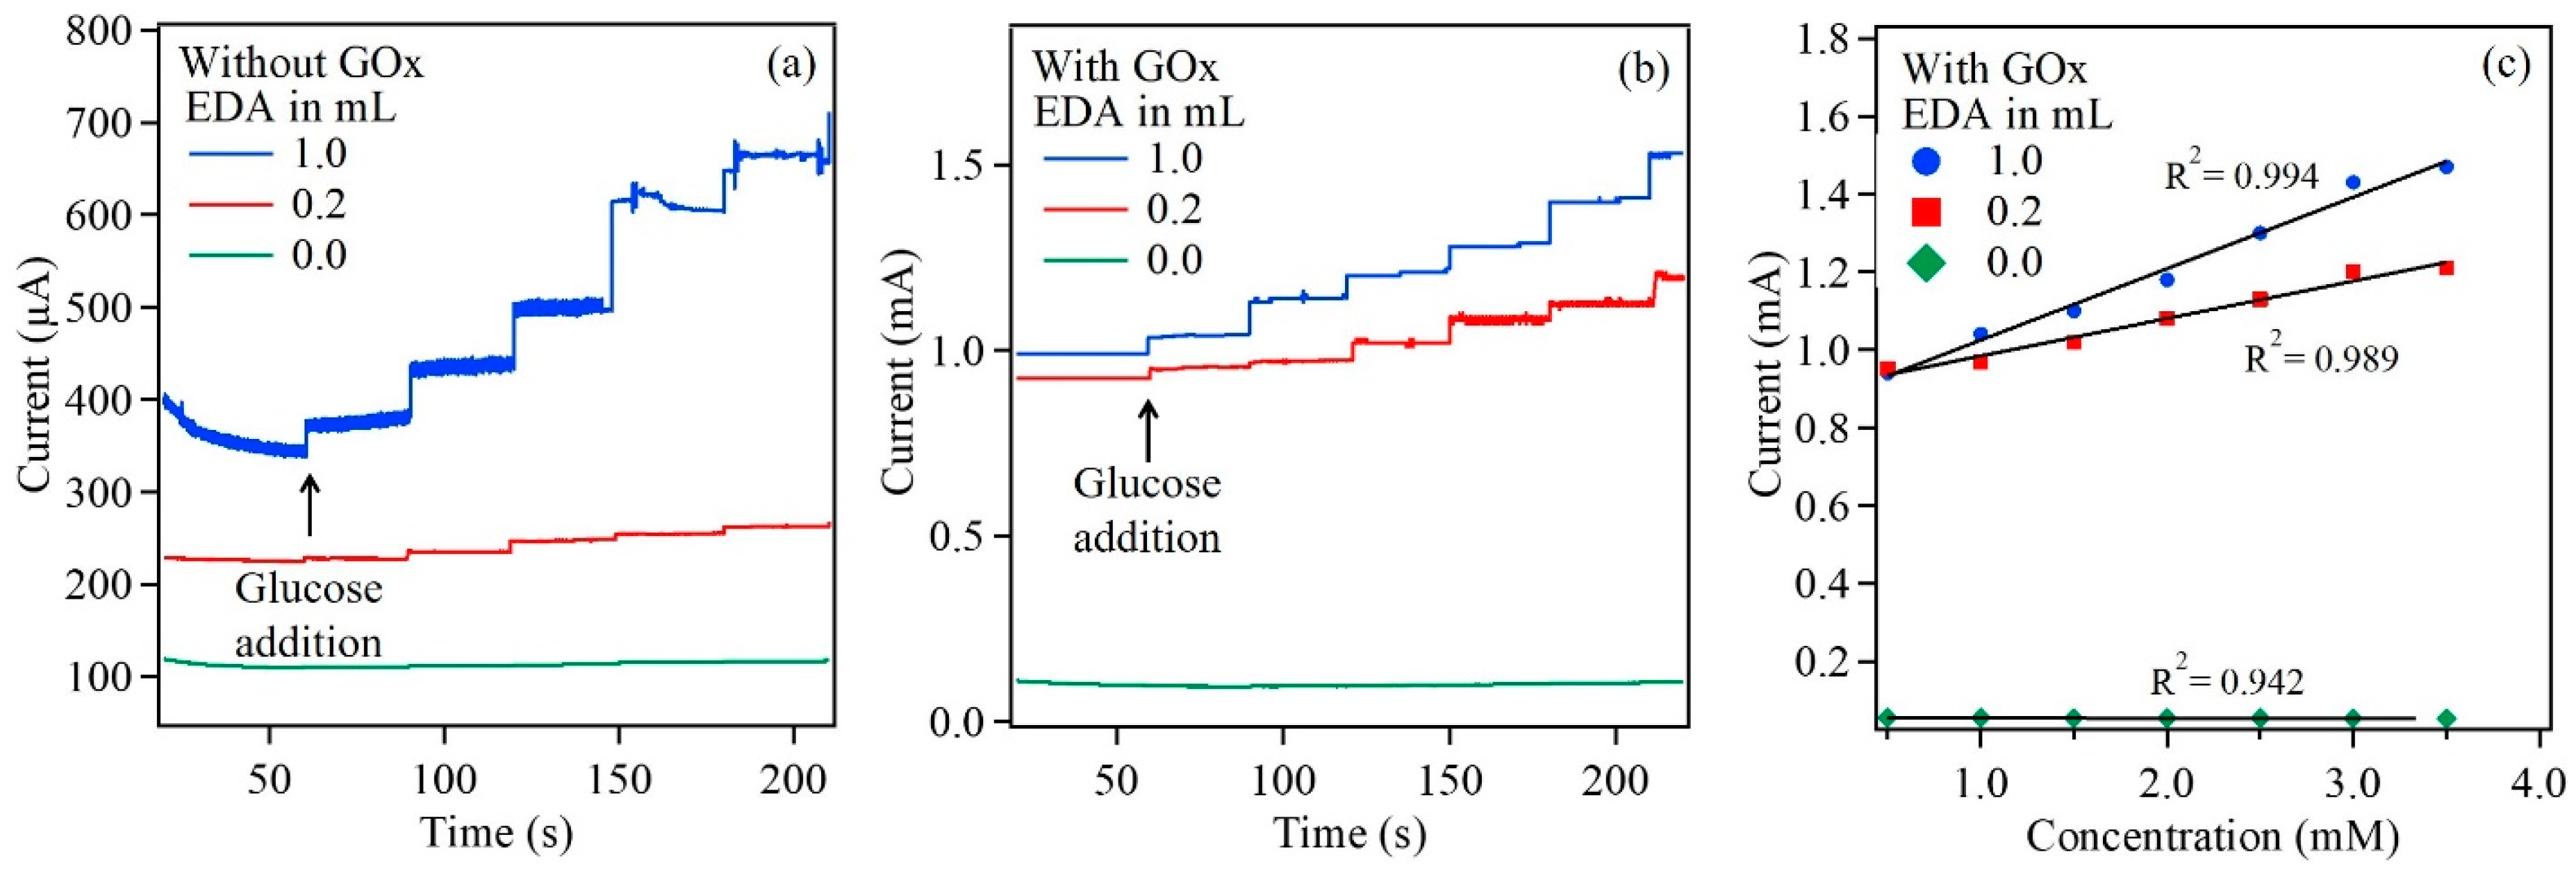
Here, Cu2O nanoparticles were utilized for glucose sensing to test whether the fabricated electrodes can serve as a robust and viable biosensing platform. The steady-state amperometric response of the enzymatic biosensor was investigated by the successive addition of equal amounts of glucose in 10 mM PBS, at an applied potential of 0.8 V under constant stirring condition. Amperometric response was first obtained from Cu2O reference sample followed by Cu2O samples with 0.2 mL and 1 mL EDA. These samples were not treated with GOx. All samples exhibited amperometric response, to the addition of glucose, in the absence of GOx. The amperometric response was higher in samples with EDA. The response and sensitivity increased with EDA content (Figure 7a). In the presence of GOx, the Cu2O samples with EDA exhibited an increase in the overall current along with distinct amperometric response. Figure 7b exhibited a rapid and sensitive response to the addition of glucose for the two biosensors fabricated in the presence of EDA. The current response increased with the increase in the glucose concentration at every step. The biosensors also demonstrated a fast current response of <2 s. Additionally, the Cu2O nanoparticles with higher concentration of EDA (1 mL) exhibited a total current enhancement compared to sample with 0.2 mL EDA. The reference sample, immobilized with GOx, exhibited the lowest current response compared to the other samples fabricated with EDA. Thus the total current response indicated that the biosensor was more sensitive to increased surface area. Furthermore, the concentration of EDA used during the deposition process eventually influences the sensitivity of the biosensor. Figure 7c shows the calibration curves for the Cu2O reference sample and Cu2O samples with EDA content of 0.2 mL and 1.0 mL. It is evident that the current increases with glucose concentration, almost linearly from a range of 0.1 mM to 3.5 mM. The sensitivity of the biosensors ranges between 1243.2–1538 μA/cm2. mM for Cu2O nanoparticles with EDA content of 0.2 mL to 1.0 mL respectively. The affinity of GOx to the substrate, glucose was obtained by calculating the apparent Michaelis–Menten constant with the help of the Lineweaver–Burk equation [22]:
where C is the glucose concentration, and are the currents for substrate saturation and steady state respectively, during the glucose sensing measurements. From the calculation, was obtained to be 1.00 mM and 1.25 mM for Cu2O samples with EDA content of 0.2 mL and 1.0 mL respectively, which indicates good affinity of the immobilized GOx to glucose. The biosensor characteristics obtained in this work were compared to the values in literature, shown in Table 2 [12]. The present work exhibited higher detection limit among other studies in literature. Additionally, a large linear range was obtained. Stability test on the biosensor was also performed. The Cu2O with 1 mL EDA sample was tested after 7 days of initial amperometric response. The amperometric response of the EDA sample diminished slightly after 7 days of storage.
From the above characterizations and biosensor investigation of the Cu2O nanoparticles it was clear that the nanoparticle size decreased and the density increased with increase in EDA content. Evidently, the optical properties varied with changing EDA content. Additionally, the XRD data provided evidence of decreasing lattice parameter with increasing EDA content. Furthermore, the sensitivity was enhanced with decrease in nanoparticle size. Thus, it was evident that EDA played an important role in controlling the size, density, optical and biosensing properties of the Cu2O nanoparticles. It was therefore pertinent to understand the influence of EDA on the final outcome of the Cu2O nanoparticles.
Chemical additives including sodium dodecyl sulfate (SDS), polyvinylpyrrolidone (PVP) and EDA have been often utilized in many solution-based synthesis as well as electrochemical synthesis of various nanostructures as a shape modifying agent [29,30,31]. However, the fabrication of Cu2O nanoparticles via electrodeposition using EDA as a size and shape modification additive has not been report to the best of our knowledge. Here, there are several factors that could influence the size, density and shape of the Cu2O nanoparticles in the presence of EDA. The chemical additive EDA has a tendency to adsorb on high energy faces of a growing crystal, thus leading to a controlled size and shape of the Cu2O nanoparticles. The drastic decrease in the nanoparticle size, with increase in the EDA content, can subsequently increase the density of the nanoparticles on the FTO substrate. The decrease in size and increase in the density was corroborated by the SEM data. However, the EDA present in the electrolytic bath can also interact with the FTO substrate occupying deposition sites of Cu2+ ions. This could hinder the deposition of Cu2+ and lower the deposition of the Cu2O on the FTO substrate. Such interaction of EDA with the FTO substrate resulted in lower sample thickness. This was confirmed by the XRD data and also verified by visual inspection. Thus, the presence of EDA affects the deposition forming small nanoparticle size, higher density and lower sample thickness with increase in EDA content. Further, the interplay between the applied potential, electrolyte pH and EDA content is still unclear and thus requires further exploration. Presently, detailed investigation is underway to understand the precise influence of EDA on size, density, deposition rate and conductivity of these Cu2O samples.
4. Conclusions
In conclusion, successful electrodeposition of Cu2O nanoparticle was performed in the presence of EDA. The nanoparticles size was varied between 54.09 nm to 966.97 nm, by adjusting the EDA content in the electrolyte bath. The absorption spectra indicated a blue shift in the absorption peak with decrease in the Cu2O nanoparticle size. The enzyme, GOx was successfully immobilized on the Cu2O nanoparticles. The sensitivity of the biosensor was influenced by the presence of EDA. The sensitivity increased with EDA content during electrodeposition. More detailed investigations elucidating the influence of EDA on the Cu2O nanoparticle size, density and sample thickness are underway.
Acknowledgments
The authors acknowledge funding support from the Iowa State University Startup Fund. S.P. thanks the Catron Fellowship. The authors would like to thank Warren Straszheim for help with SEM characterization. The authors declare no competing financial interest.
Author Contributions
T.L. and S.P. conceived and designed the experiments. T.L. and E.S. performed Cu2O electrodeposition. A.F. performed biosensing experiments and calculations. T.L., A.F. and S.P. analyzed the data. T.L. and S.P. wrote the paper. T.L. and A.F. have equal contribution to this work. A.F. would like to thank King Abdulaziz City for Science and Technology (KACST) for financial support.
Conflicts of Interest
The authors declare no conflict of interest.
References
- Siripala, W.; Ivanovskaya, A.; Jaramillo, T.F.; Baeck, S.-H.; McFarland, E.W. A Cu2O/TiO2 heterojunction thin film cathode for photoelectrocatalysis. Sol. Energy Mater. Sol. Cells 2003, 77, 229–237. [Google Scholar] [CrossRef]
- Xiang, J.Y.; Tu, J.P.; Huang, X.H.; Yang, Y.Z. A comparison of anodically grown CuO nanotube film and Cu2O film as anodes for lithium ion batteries. J. Solid State Electrochem. 2008, 12, 941–945. [Google Scholar] [CrossRef]
- Won, Y.-H.; Stanciu, L.A. Cu2O and Au/Cu2O particles: Surface properties and applications in glucose sensing. Sensors 2012, 12, 13019–13033. [Google Scholar] [CrossRef] [PubMed]
- Rai, B.P. Cu2O solar cells: A review. Sol. Cells 1988, 25, 265–272. [Google Scholar] [CrossRef]
- Deng, S.; Tjoa, V.; Fan, H.M.; Tan, H.R.; Sayle, D.C.; Olivo, M.; Mhaisalkar, S.; Wei, J.; Sow, C.H. Reduced graphene oxide conjugated Cu2O nanowire mesocrystals for high-performance NO2 gas sensor. J. Am. Chem. Soc. 2012, 134, 4905–4917. [Google Scholar] [CrossRef] [PubMed]
- Eom, K.; Kim, S.; Lee, D.; Seo, H. Physicochemical interface effect in Cu2O-ZnO heterojunction on photocurrent spectrum. RSC Adv. 2015, 5, 103803–103810. [Google Scholar] [CrossRef]
- Luo, J.; Steier, L.; Son, M.-K.; Schreier, M.; Mayer, M.T.; Grätzel, M. Cu2O nanowire photocathodes for efficient and durable solar water splitting. Nano Lett. 2016, 16, 1848–1857. [Google Scholar] [CrossRef] [PubMed]
- Hara, M.; Kondo, T.; Komoda, M.; Ikeda, S.; Kondo, J.; Domen, K.; Hara, M.; Shinohara, K.; Tanaka, A. Cu2O as a photocatalyst for overall water splitting under visible light irradiation. Chem. Commun. 1998, 3, 357–358. [Google Scholar] [CrossRef]
- Morales-Guio, C.G.; Liardet, L.; Mayer, M.T.; Tilley, S.D.; Grätzel, M.; Hu, X. Photoelectrochemical hydrogen production in alkaline solutions using Cu2O coated with earth-abundant hydrogen evolution catalysts. Angew. Chem. Int. Ed. 2015, 54, 664–667. [Google Scholar] [CrossRef]
- Paracchino, A.; Laporte, V.; Sivula, K.; Grätzel, M.; Thimsen, E. Highly active oxide photocathode for photoelectrochemical water reduction. Nat. Mater. 2011, 10, 456–461. [Google Scholar] [CrossRef] [PubMed]
- Zhu, H.; Wang, J.; Xu, G. Fast synthesis of Cu2O hollow microspheres and their application in DNA biosensor of hepatitis B virus. Cryst. Growth Des. 2009, 9, 633–638. [Google Scholar] [CrossRef]
- Elahi, M.Y.; Khodadasi, A.A.; Mortazavi, Y. A glucose biosensor based on glucose oxidase immobilized on ZnO/Cu2O graphene oxide nanocomposite electrode. J. Electrochem. Soc. 2014, 161, B81–B87. [Google Scholar] [CrossRef]
- Radi, A.; Pradhan, D.; Sohn, Y.; Leung, K.T. Nanoscale shape and size control of cubic, cuboctahedral, and octahedral Cu−Cu2O core−shell nanoparticles on Si(100) by one-step, templateless, capping-agent-free electrodeposition. ACS Nano 2010, 4, 1553–1560. [Google Scholar] [CrossRef] [PubMed]
- Zhang, J.; Liu, J.; Peng, Q.; Wang, X.; Li, Y. Nearly monodisperse Cu2O and CuO nanospheres: Preparation and applications for sensitive gas sensors. Chem. Mater. 2006, 18, 867–871. [Google Scholar] [CrossRef]
- Xu, H.; Wang, W.; Zhu, W. Shape evolution and size-controllable synthesis of Cu2O octahedra and their morphology-dependent photocatalytic properties. J. Phys. Chem. B 2006, 110, 13829–13834. [Google Scholar] [CrossRef] [PubMed]
- Feng, L.; Zhang, C.; Gao, G.; Cui, D. Facile synthesis of hollow Cu2O octahedral and spherical nanocrystals and their morphology-dependent photocatalytic properties. Nanoscale Res. Lett. 2012, 7, 276. [Google Scholar] [CrossRef] [PubMed]
- De Jongh, P.E.; Vanmaekelbergh, D.; Kelly, J.J.D. Photoelectrochemistry of electrodeposited Cu2O. J. Electrochem. Soc. 2000, 147, 486–489. [Google Scholar] [CrossRef]
- Hu, C.-C.; Nian, J.-N.; Teng, H. Electrodeposited p-type Cu2O as photocatalyst for H2 evolution from water reduction in the presence of WO3. Sol. Energy Mater. Sol. Cells 2008, 92, 1071–1076. [Google Scholar] [CrossRef]
- Nian, J.-N.; Hu, C.-C.; Teng, H. Electrodeposited p-type Cu2O for H2 evolution from photoelectrolysis of water under visible light illumination. Int. J. Hydrogen Energy 2008, 33, 2897–2903. [Google Scholar] [CrossRef]
- Zerbino, J.O.; Sanchez, R.M.T.; Sustersic, M.G. Effect of oxalate on the growth of cuprous oxide layers on copper electrodes. Ellipsometric and isoelectric point study. Acta Chim. Slov. 2009, 56, 124–130. [Google Scholar]
- Wang, G.; van den Berg, R.; de Mello Donega, C.; de Jong, K.P.; de Jongh, P.E. Silica-supported Cu2O nanoparticles with tunable size for sustainable hydrogen generation. Appl. Catal. B Environ. 2016, 192, 199–207. [Google Scholar] [CrossRef]
- Zhao, M.; Li, Z.; Han, Z.; Wang, K.; Zhou, Y.; Huang, J.; Ye, Z. Synthesis of mesoporous multiwall ZnO nanotubes by replicating silk and application for enzymatic biosensor. Biosens. Bioelectron. 2013, 49, 318–322. [Google Scholar] [CrossRef] [PubMed]
- Liu, M.; Liu, R.; Chen, W. Graphene wrapped Cu2O nanocubes: Non-enzymatic electrochemical sensors for the detection of glucose and hydrogen peroxide with enhanced stability. Biosens. Bioelectron. 2013, 45, 206–212. [Google Scholar] [CrossRef] [PubMed]
- Li, C.; Su, Y.; Zhang, S.; Lv, X.; Xia, H.; Wang, Y. An improved sensitivity nonenzymatic glucose biosensor based on a CuxO modified electrode. Biosens. Bioelectron. 2010, 26, 903–907. [Google Scholar] [CrossRef] [PubMed]
- Qian, Y.; Xu, J.; Le, Z.G. Synthesis of cuprous oxide (Cu2O) nanoparticles/graphene composite with an excellent electrocatalytic activity towards glucose. Int. J. Electrochem. Sci. 2012, 7, 10063–10073. [Google Scholar]
- Wang, L.; Fu, J.; Hou, H.; Song, Y. A facile strategy to prepare Cu2O/Cu electrode as a sensitive enzyme-free glucose sensor. Int. J. Electrochem. Sci. 2012, 7, 12587–12600. [Google Scholar]
- El Khatib, K.M.; Hameed, R.A. Development of Cu2O/Carbon vulcan XC-72 as non-enzymatic sensor for glucose determination. Biosens. Bioelectron. 2011, 26, 3542–3548. [Google Scholar] [CrossRef] [PubMed]
- Felix, S.; Kollu, P.; Raghupathy, B.P.; Jeon, S.K.; Grace, A.N. Electrocatalytic activity of Cu2O nanocubes-based electrode for glucose oxidation. J. Chem. Sci. 2014, 126, 25–32. [Google Scholar] [CrossRef]
- Yang, Y.; Han, J.; Ning, X.; Cao, W.; Xu, W.; Guo, L. Controllable morphology and conductivity of electrodeposited Cu2O thin film: Effect of surfactants. ACS Appl. Mater. Interfaces 2014, 6, 22534–22543. [Google Scholar] [CrossRef] [PubMed]
- Siegfried, M.J.; Choi, K.S. Electrochemical crystallization of cuprous oxide with systematic shape evolution. Adv. Mater. 2004, 16, 1743–1746. [Google Scholar] [CrossRef]
- Chen, M.; Xia, Z.; Liu, Q. Ethylenediamine-assisted hydrothermal synthesis of NaCaSiO3OH: Controlled morphology, mechanism, and luminescence properties by doping Eu3+/Tb3+. Inorg. Chem. 2016, 55, 11316–11322. [Google Scholar] [CrossRef] [PubMed]
Figure 1.
(a) Electrodeposition setup, with the reference (b), counter (c) and working (d) electrodes.
Figure 1.
(a) Electrodeposition setup, with the reference (b), counter (c) and working (d) electrodes.
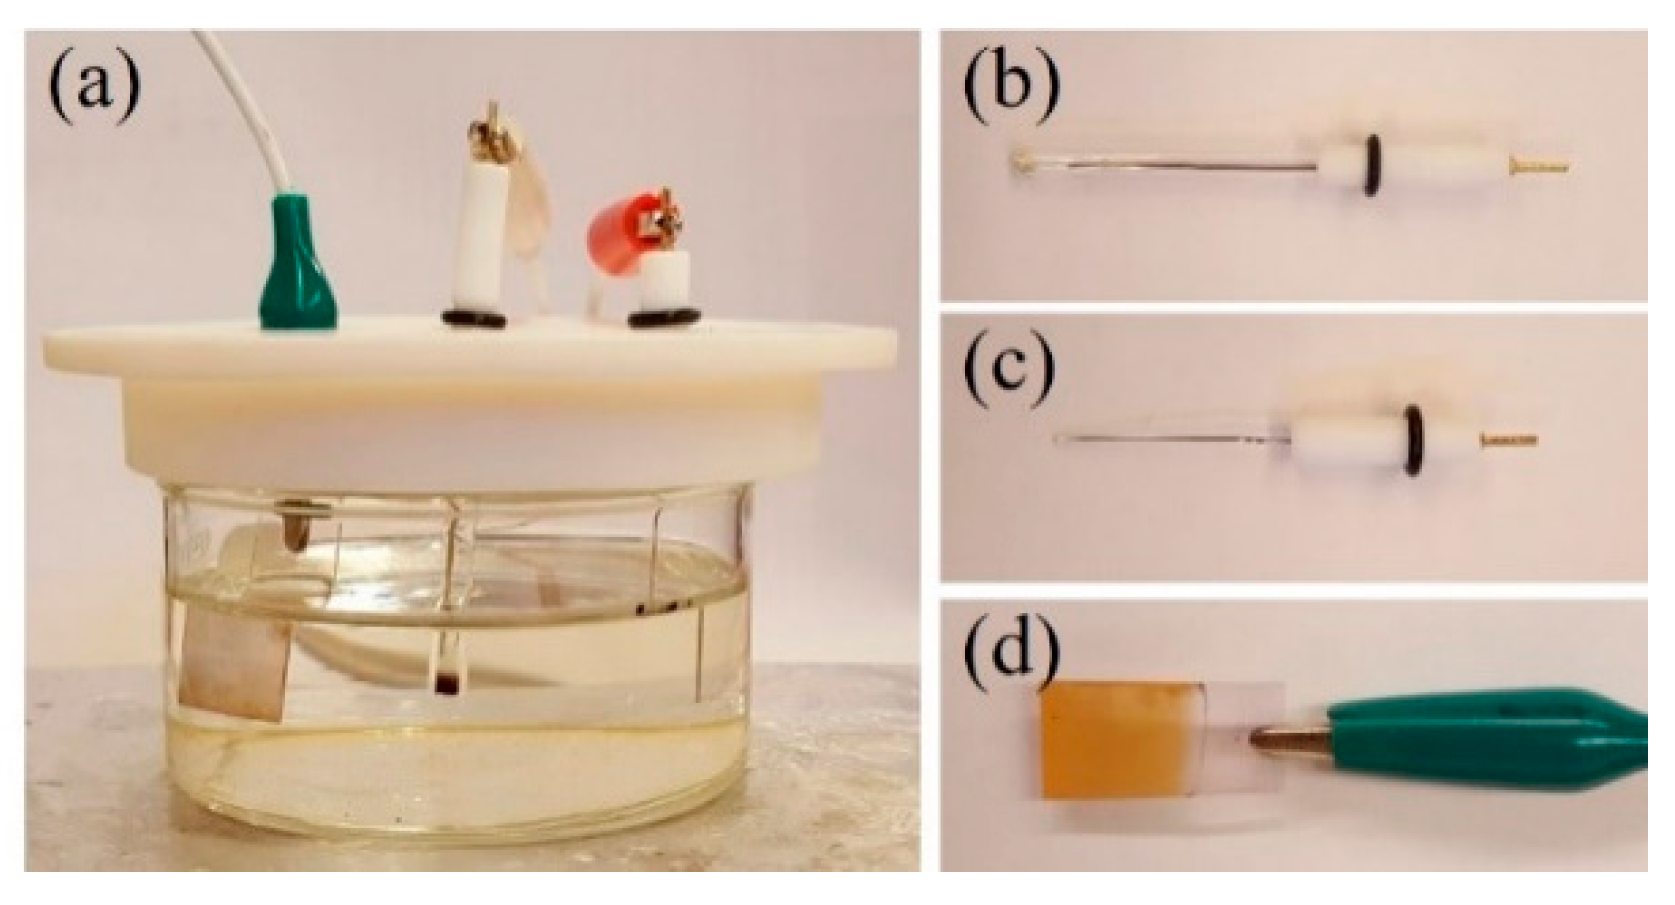
Figure 2.
(a) XRD plots of Cu2O samples with varying ethylenediamine (EDA) contents; (b) The right shift in the 2-theta values for (111), (200) and (220) planes.
Figure 2.
(a) XRD plots of Cu2O samples with varying ethylenediamine (EDA) contents; (b) The right shift in the 2-theta values for (111), (200) and (220) planes.
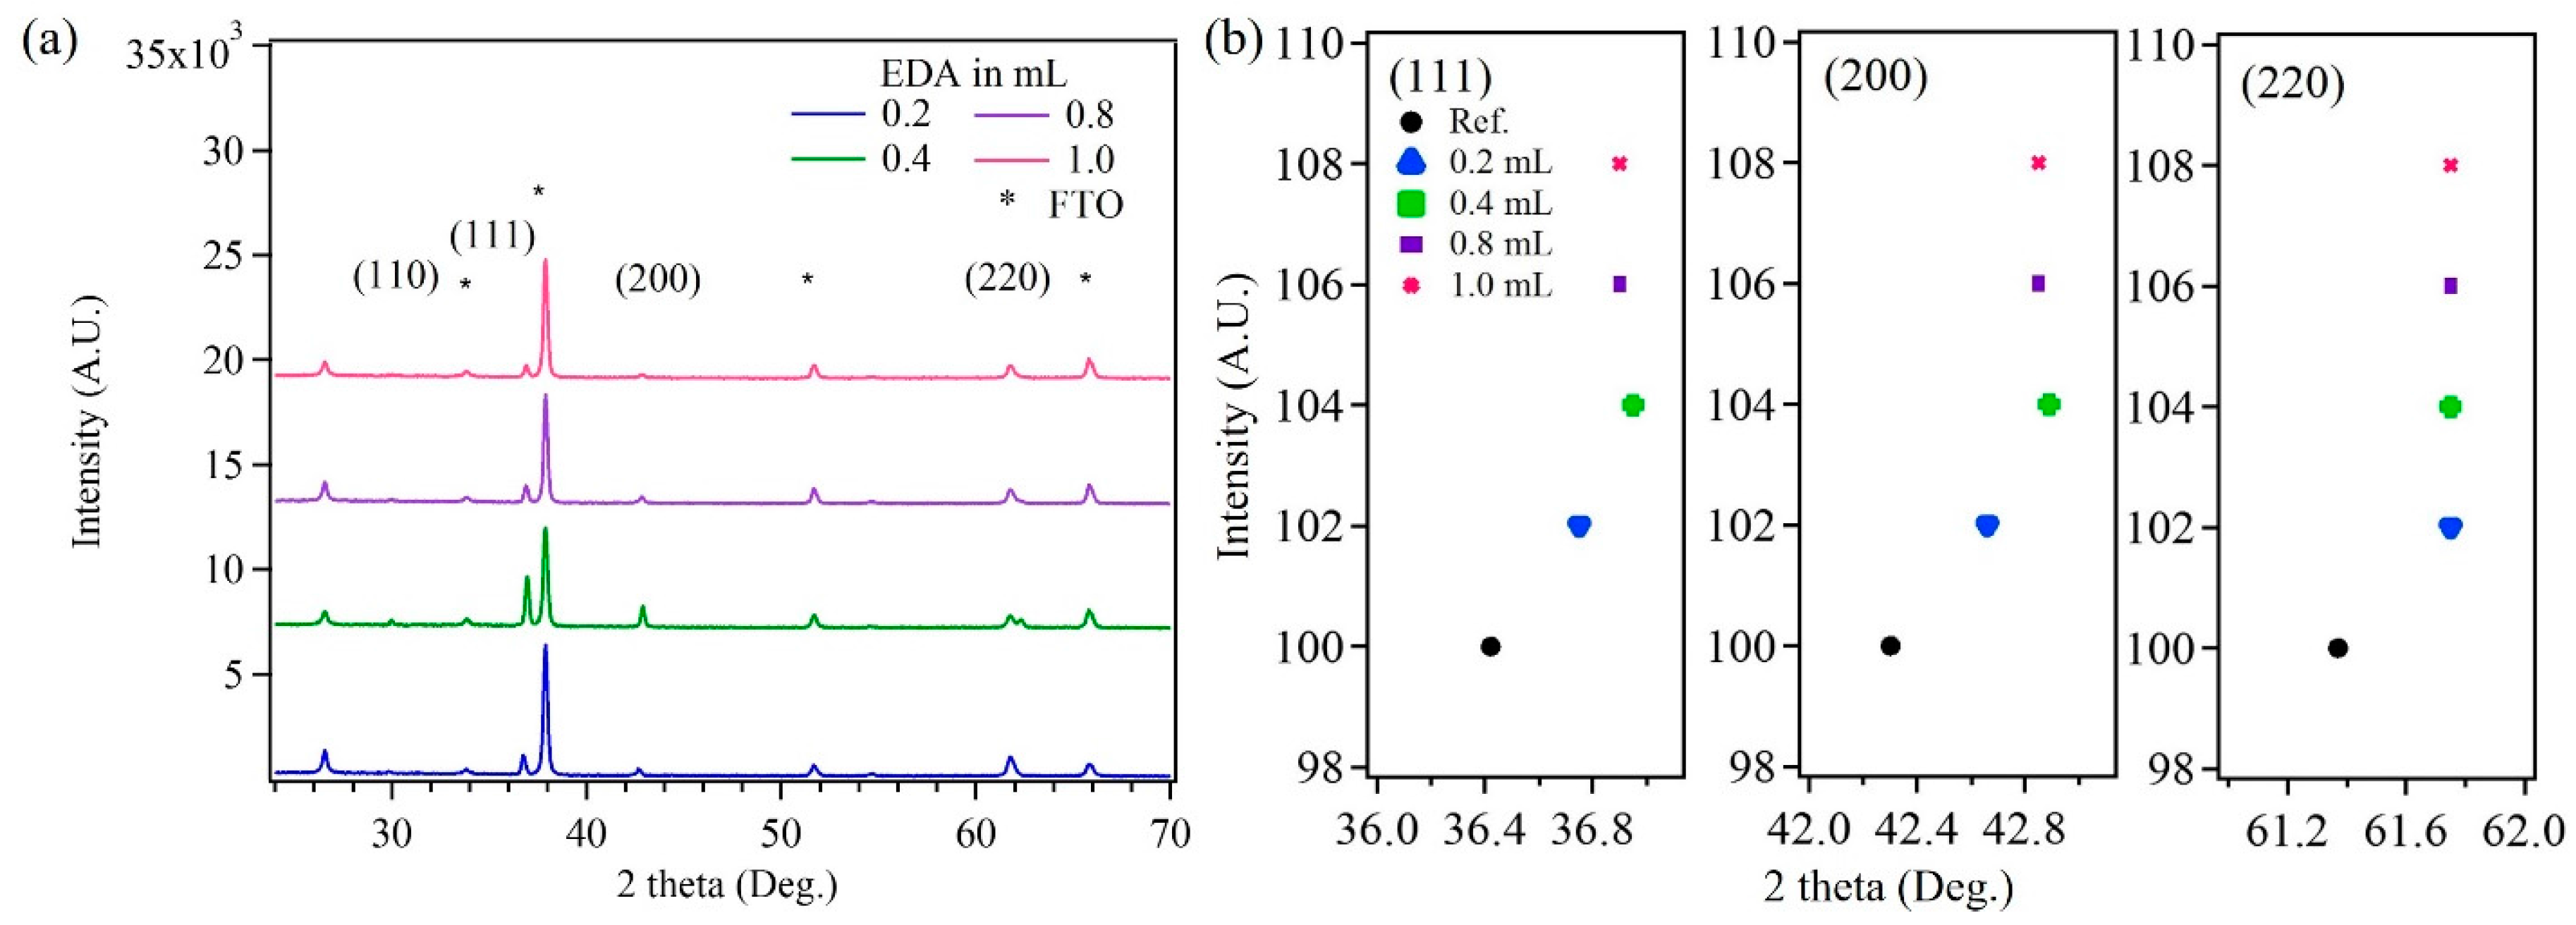
Figure 3.
Photographs Cu2O samples prepared by electrodeposition in the presence of varying volumes of EDA in electrolytic bath from (a) 0.2 mL; (b) 0.4 mL; (c) 0.8 mL to (d) 1 mL.
Figure 3.
Photographs Cu2O samples prepared by electrodeposition in the presence of varying volumes of EDA in electrolytic bath from (a) 0.2 mL; (b) 0.4 mL; (c) 0.8 mL to (d) 1 mL.

Figure 4.
UV-Vis spectra of Cu2O nanoparticle with increase in the EDA content from 0.2 mL (red curve), 0.4 mL (black curve), 0.8 mL (green curve) to 1 mL (blue curve).
Figure 4.
UV-Vis spectra of Cu2O nanoparticle with increase in the EDA content from 0.2 mL (red curve), 0.4 mL (black curve), 0.8 mL (green curve) to 1 mL (blue curve).
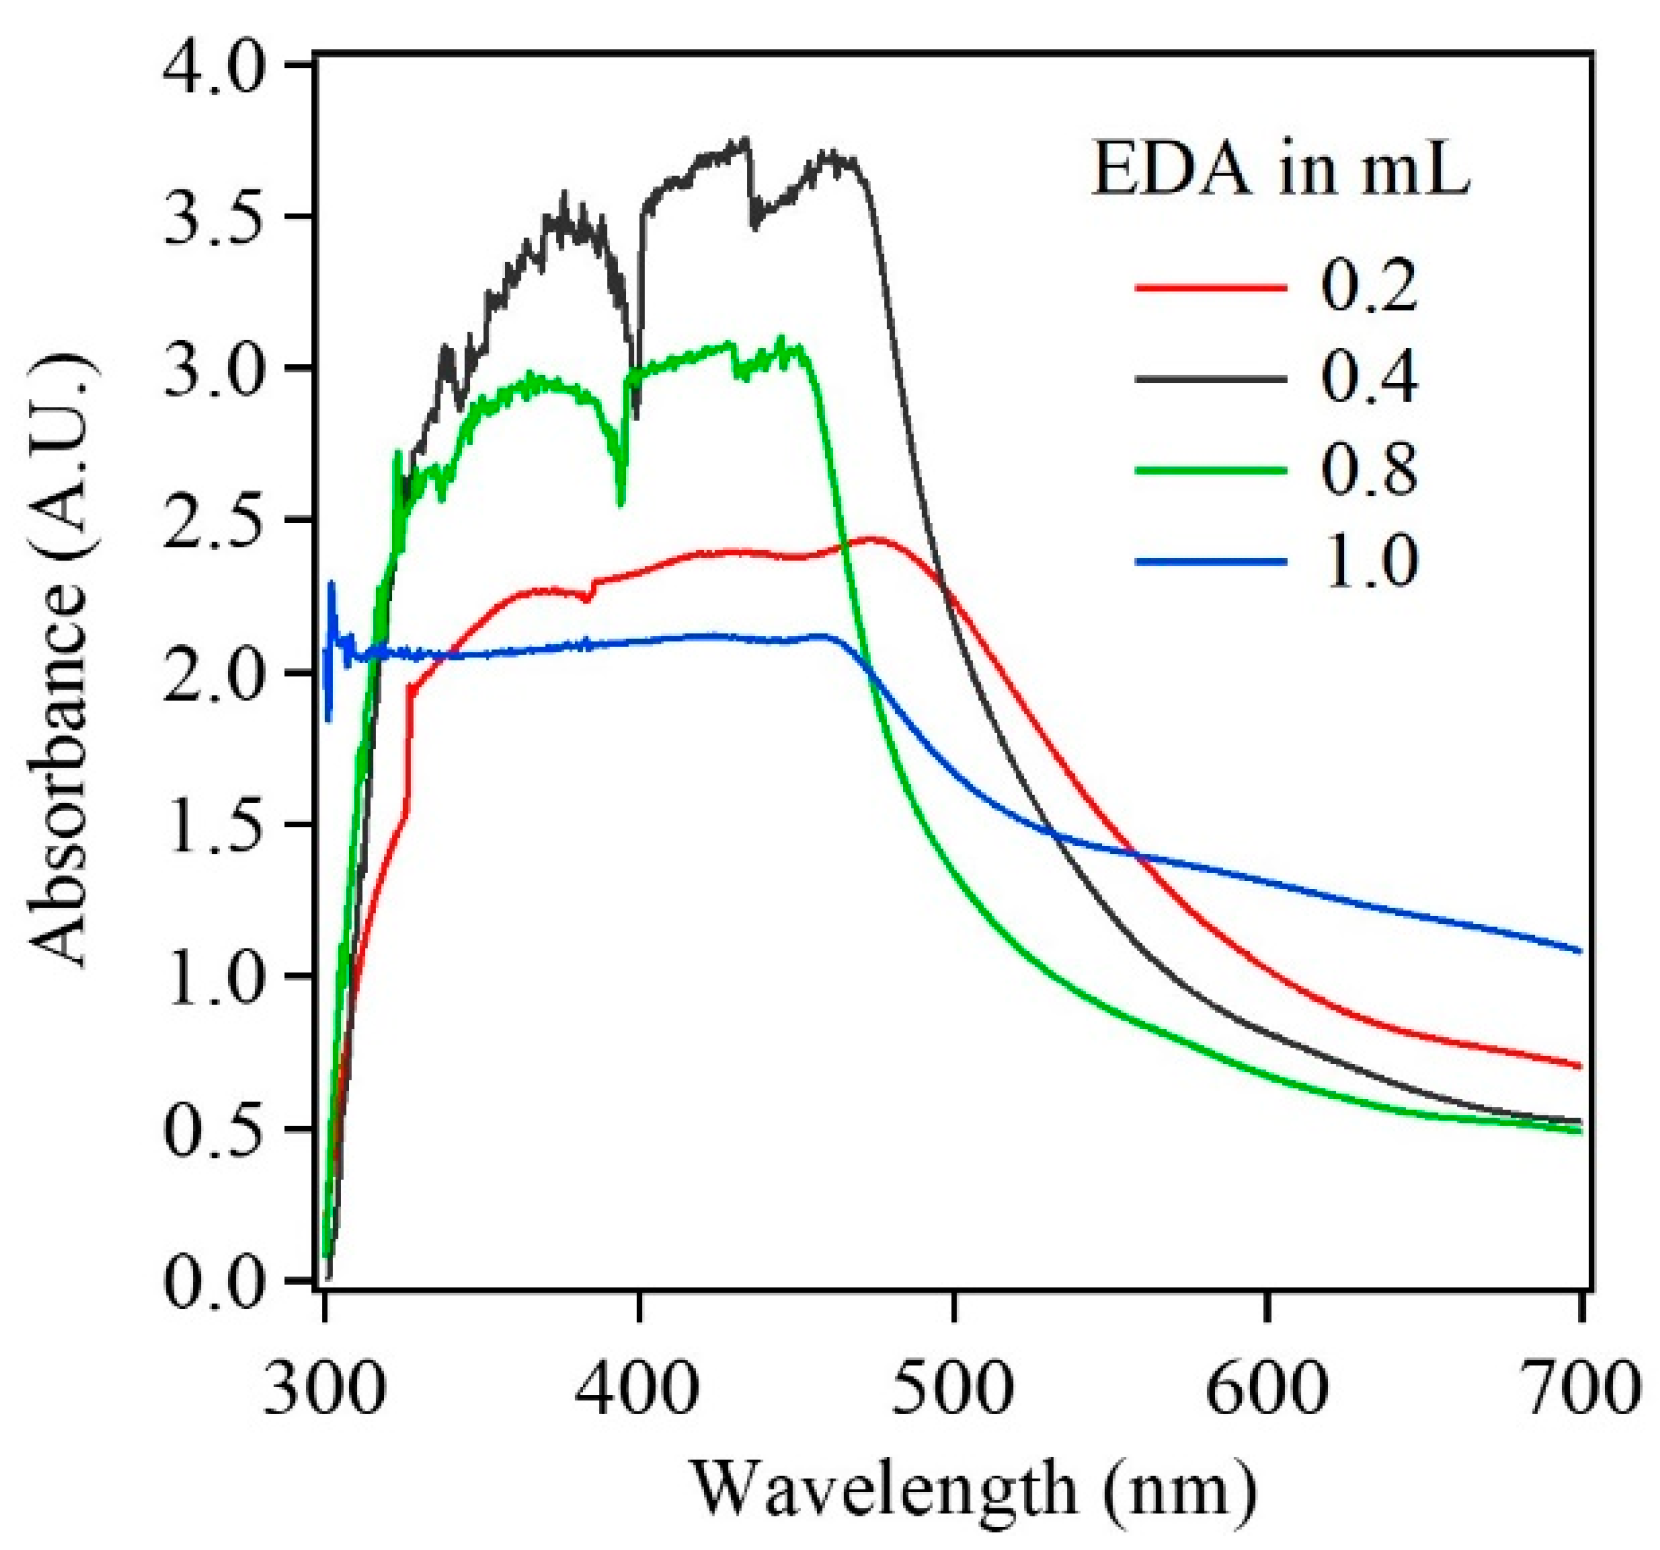
Figure 5.
SEM image of Cu2O reference sample, fabricated in the absence of EDA.

Figure 6.
SEM images and size distribution of Cu2O nanoparticles with increasing EDA content from (a,b) 0.2 mL, (c,d) 0.4 mL, (e,f) 0.8 mL to (g,h) 1 mL.
Figure 6.
SEM images and size distribution of Cu2O nanoparticles with increasing EDA content from (a,b) 0.2 mL, (c,d) 0.4 mL, (e,f) 0.8 mL to (g,h) 1 mL.
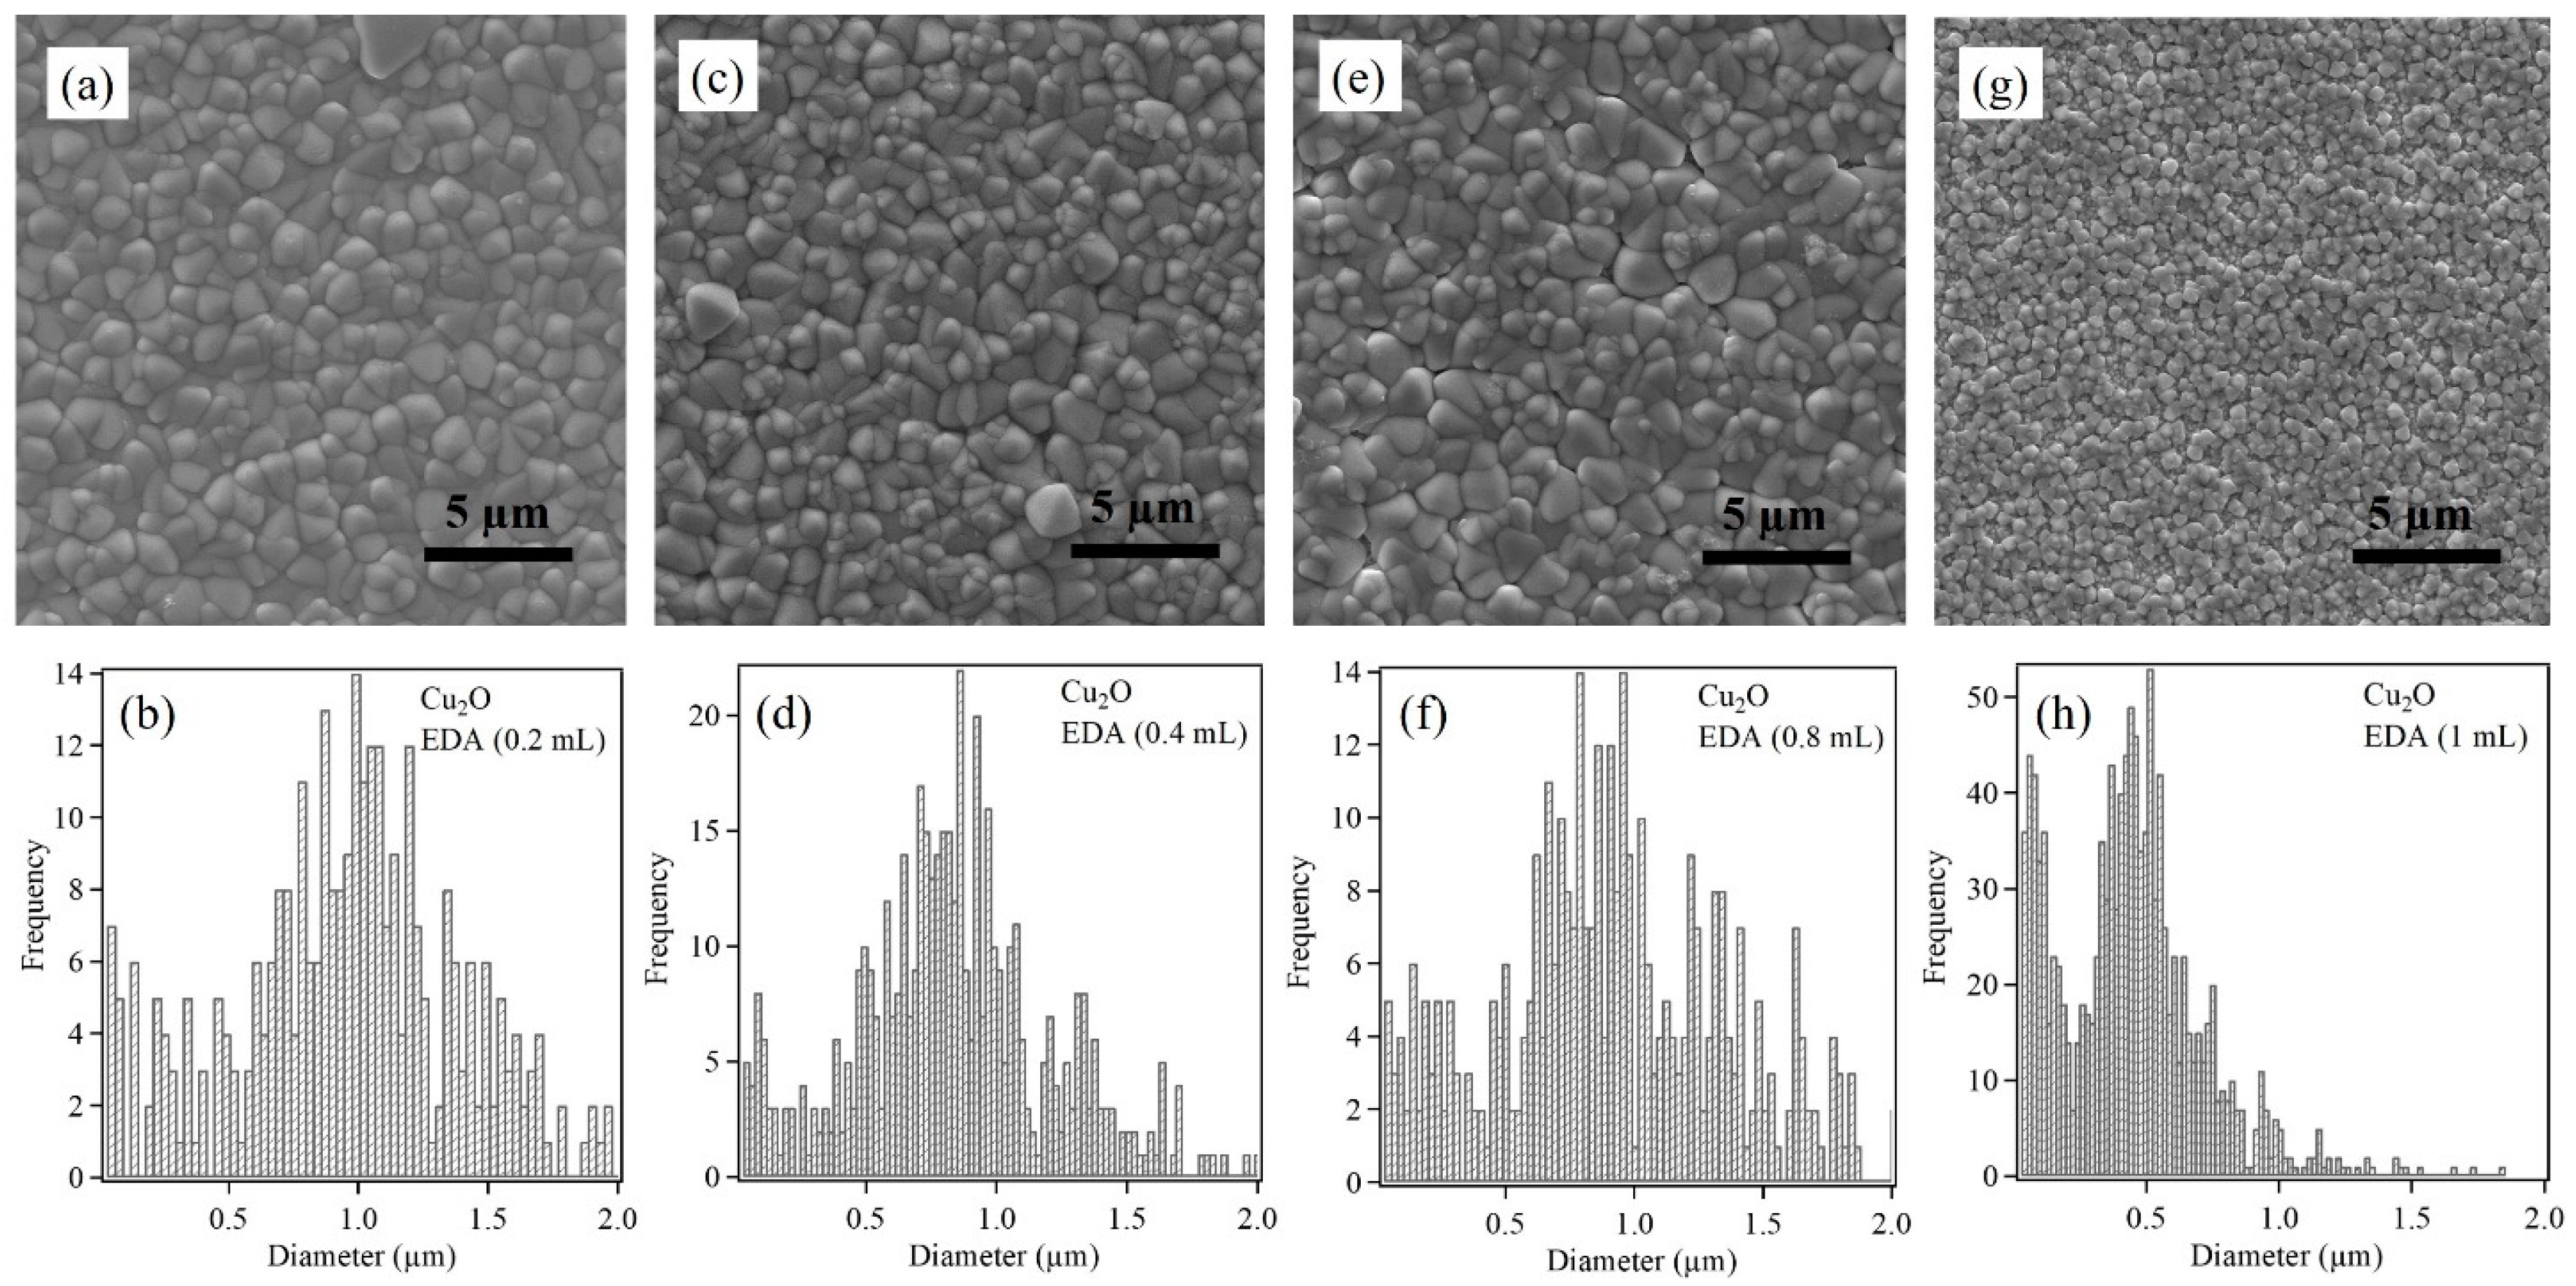
Figure 7.
Amperometric response of Cu2O/ITO (a) and GOx/Cu2O/ITO (b) electrodes to glucose in 10 mM PBS at applied potential of 0.8 V. Calibration curve for GOx/Cu2O/ITO electrode (c).
Figure 7.
Amperometric response of Cu2O/ITO (a) and GOx/Cu2O/ITO (b) electrodes to glucose in 10 mM PBS at applied potential of 0.8 V. Calibration curve for GOx/Cu2O/ITO electrode (c).


Table 1.
Size distribution of Cu2O nanoparticles with varying EDA content.
| Cu2O Sample with Varying EDA Content in mL | Particle Size (nm) | |
|---|---|---|
| 0.2 | 966 ± 23 | |
| 0.4 | 792 ± 16 | |
| 0.8 | 802 ± 34 | |
| 1.0 | 54 ± 20 | 427 ± 20 |
Table 2.
Comparison of glucose biosensor characteristics with different Cu2O nanostructures in literature.
Table 2.
Comparison of glucose biosensor characteristics with different Cu2O nanostructures in literature.
| Working Electrode | Sensitivity (μA/cm2·mM) | (mM) | LOD (μM) | Linear Range (mM) | Reference |
|---|---|---|---|---|---|
| GOx/Cu2O | 55.32 | 0.79 | 0.2 | 0.2–3.5 | The work |
| GOx/Cu2O/EDA (0.2) | 1243.2 | 1.00 | 0.1 | 0.1–3.5 | The work |
| GOx/Cu2O/EDA (1) | 1538 | 1.25 | 0.1 | 0.1–3.5 | The work |
| Cu2O/GNs | 285 | ------- | 3.3 | 0.3–3.3 | [23] |
| CuxO/Cu | 1620 | ------- | 49 | 0–4 | [24] |
| Cu2O/CRG | ------- | ------- | 1.2 | 0.1–1.1 | [25] |
| Cu2O/Cu | 62.29 | ------- | 37 | 0.05–6.75 | [26] |
| Cu2O/Carbon Vulcan XC-72 | 629 | ------- | 2.4 | 0–6 | [27] |
| Cu2O/Nafion/Glassy Carbon | 121.7 | ------- | 38 | 0–0.5 | [28] |
© 2017 by the authors. Licensee MDPI, Basel, Switzerland. This article is an open access article distributed under the terms and conditions of the Creative Commons Attribution (CC BY) license (http://creativecommons.org/licenses/by/4.0/).
Share and Cite
MDPI and ACS Style
Lan, T.; Fallatah, A.; Suiter, E.; Padalkar, S. Size Controlled Copper (I) Oxide Nanoparticles Influence Sensitivity of Glucose Biosensor. Sensors 2017, 17, 1944. https://doi.org/10.3390/s17091944
AMA Style
Lan T, Fallatah A, Suiter E, Padalkar S. Size Controlled Copper (I) Oxide Nanoparticles Influence Sensitivity of Glucose Biosensor. Sensors. 2017; 17(9):1944. https://doi.org/10.3390/s17091944
Chicago/Turabian StyleLan, Tian, Ahmad Fallatah, Elliot Suiter, and Sonal Padalkar. 2017. "Size Controlled Copper (I) Oxide Nanoparticles Influence Sensitivity of Glucose Biosensor" Sensors 17, no. 9: 1944. https://doi.org/10.3390/s17091944
Note that from the first issue of 2016, this journal uses article numbers instead of page numbers. See further details here.