A QRS Detection and R Point Recognition Method for Wearable Single-Lead ECG Devices


1
Department of Aeronautics and Astronautics, National Cheng-Kung University, Tainan 70101, Taiwan
2
Industrial Technology Research Institute, Tainan 70101, Taiwan
*
Author to whom correspondence should be addressed.
Sensors 2017, 17(9), 1969; https://doi.org/10.3390/s17091969
Submission received: 28 July 2017
/
Revised: 23 August 2017
/
Accepted: 24 August 2017
/
Published: 26 August 2017
(This article belongs to the Special Issue New Generation Sensors Enabling and Fostering IoT)
Abstract
:In the new-generation wearable Electrocardiogram (ECG) system, signal processing with low power consumption is required to transmit data when detecting dangerous rhythms and to record signals when detecting abnormal rhythms. The QRS complex is a combination of three of the graphic deflection seen on a typical ECG. This study proposes a real-time QRS detection and R point recognition method with low computational complexity while maintaining a high accuracy. The enhancement of QRS segments and restraining of P and T waves are carried out by the proposed ECG signal transformation, which also leads to the elimination of baseline wandering. In this study, the QRS fiducial point is determined based on the detected crests and troughs of the transformed signal. Subsequently, the R point can be recognized based on four QRS waveform templates and preliminary heart rhythm classification can be also achieved at the same time. The performance of the proposed approach is demonstrated using the benchmark of the MIT-BIH Arrhythmia Database, where the QRS detected sensitivity (Se) and positive prediction (+P) are 99.82% and 99.81%, respectively. The result reveals the approach’s advantage of low computational complexity, as well as the feasibility of the real-time application on a mobile phone and an embedded system.
Keywords:
ECG; QRS detection; heartbeat detection; mobile healthcare; IoT; wearable device; edge computing1. Introduction
A mobile healthcare system, as shown in Figure 1, has been one popular application of the internet of things (IoT) in recent years. Different from the traditional measurement devices, wearable devices can monitor long-term physiological signals and upload data to the cloud via a wireless communication system [1,2,3]. Therefore, low computation complexity and high efficiency algorithms become important issues in mobile healthcare systems.
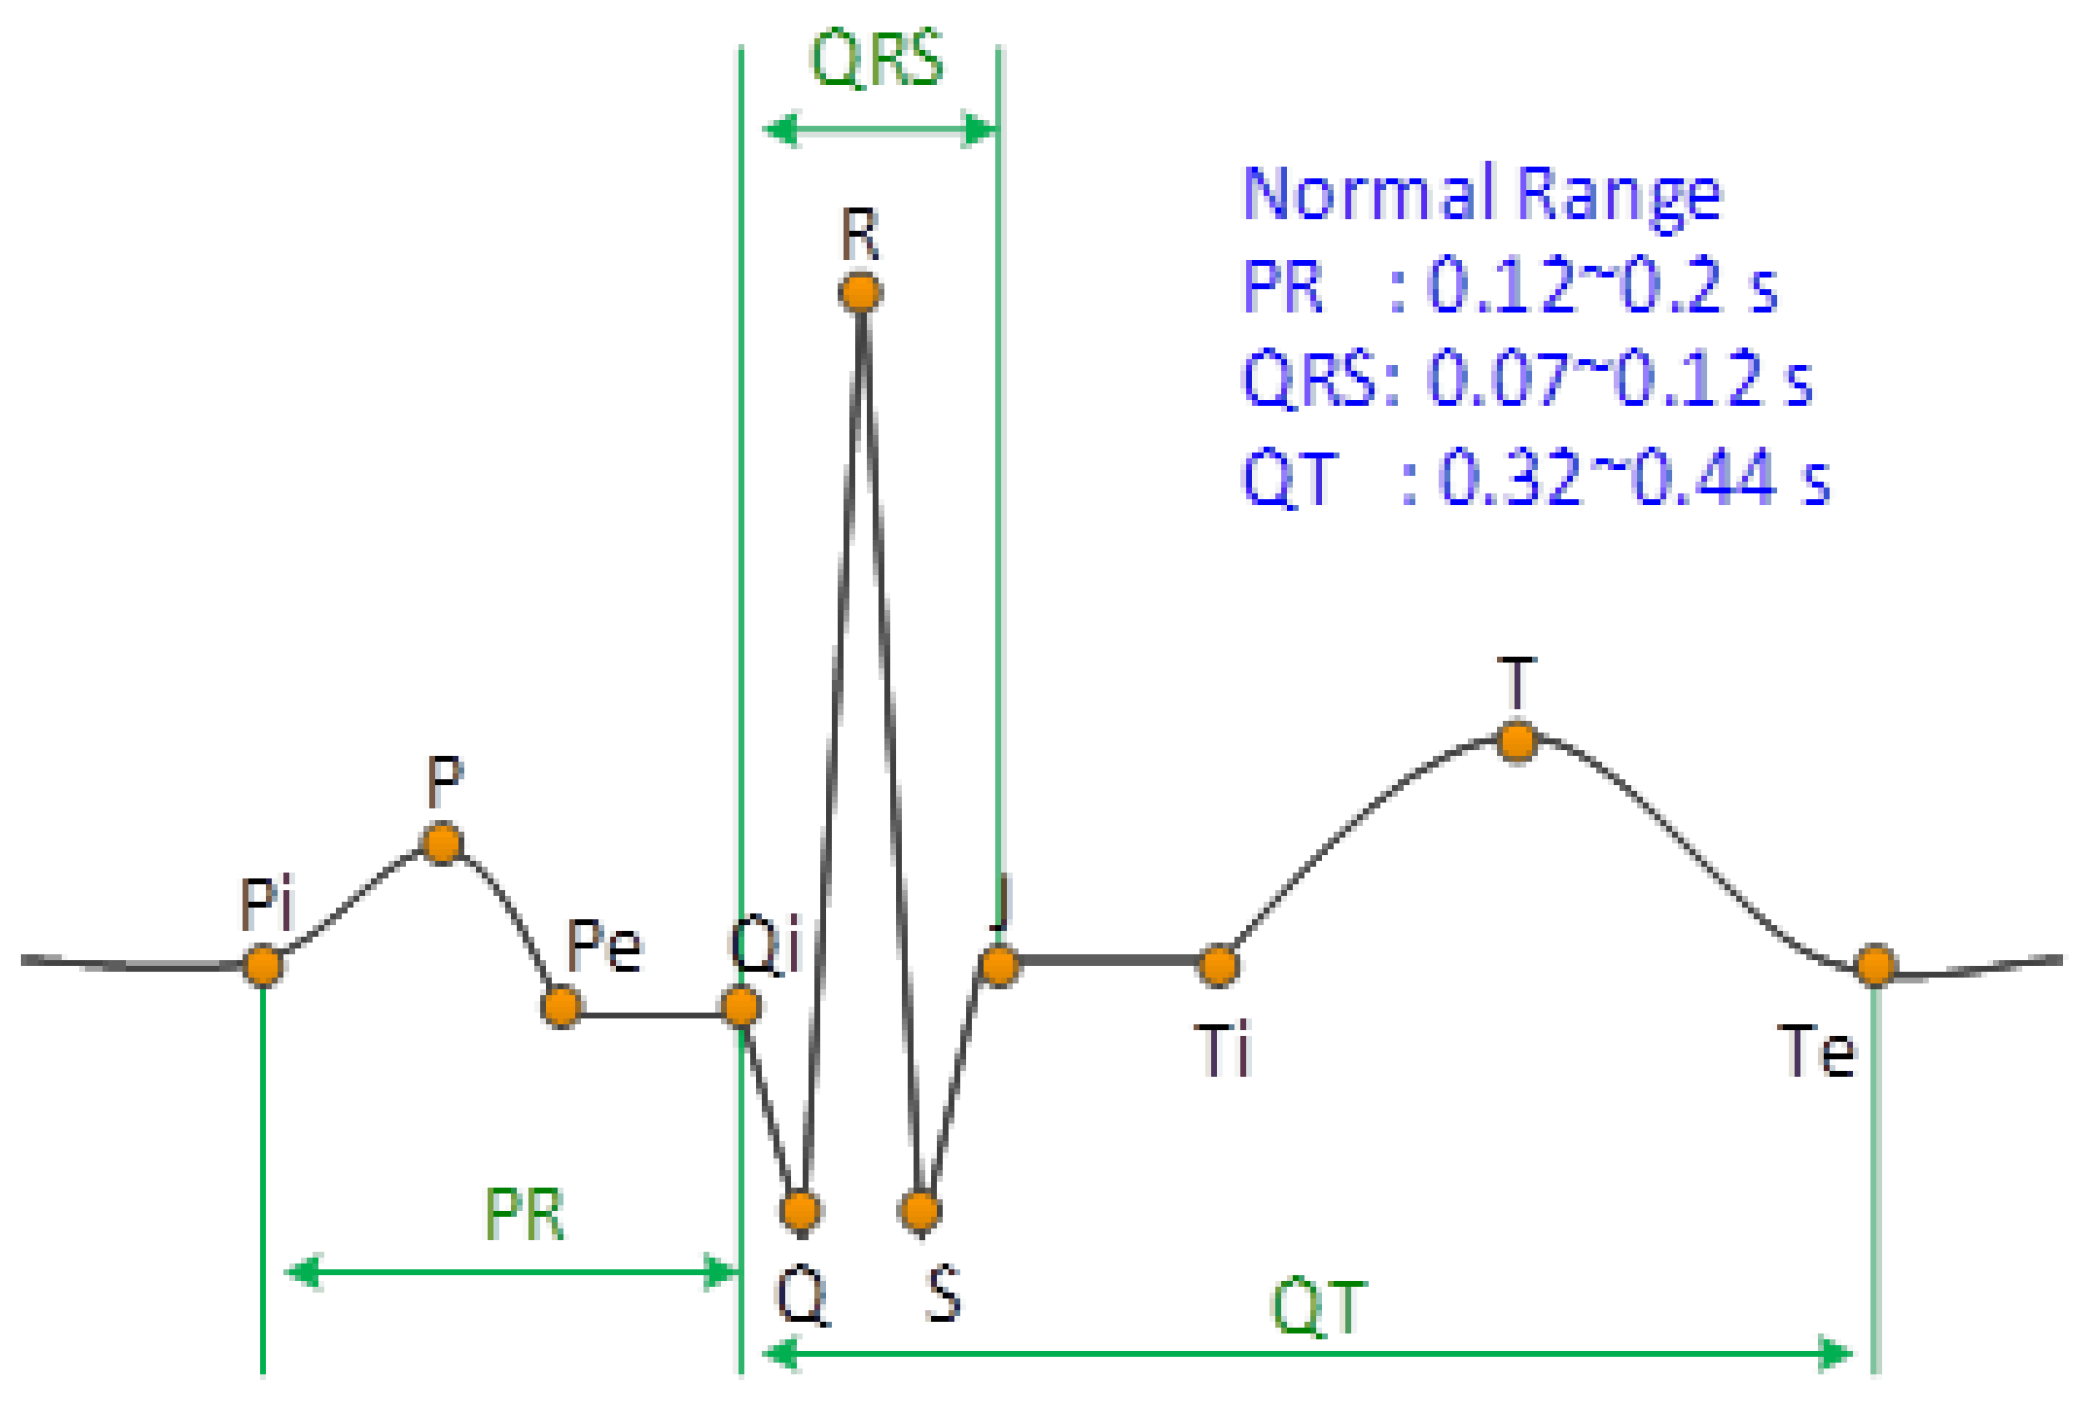
For a remote electrocardiogram (ECG) monitoring application, QRS detection is a preliminary step for detecting the heartbeat for the subsequent rhythm classification, so a high QRS detection rate method is the most significant part of the ECG analysis algorithm. Figure 2 shows the feature points (P, Q, R, S, and T) of a typical ECG waveform of a cardiac cycle in lead II. However, the measured ECG waveforms are usually different from one another due to motion artifact effects or abnormal rhythms [4], which leads to difficulty in detecting QRS. In the literature, there were numerous QRS detection methods proposed based on quadratic energy [5,6,7,8], the Shannon energy envelope [9,10], wavelet transform [11,12,13], adaptive threshold [14,15], and adaptive filter [16]. Based on a two-stage median filter and independent component analysis (ICA), approaches [17,18,19] were utilized in the signal pre-processing stage to eliminate the baseline wandering and waveform distortion caused by motion artifacts. Besides, recognizing Q, R, and S feature points for both typical and atypical QRS waveforms is also an important issue for clinical implications. There are nine pre-specified categories of QRS waveforms [20] applied to recognize reasonable R points. In addition, an adaptive mathematical morphology approach was proposed to extract the real R points [21]. Generally, most of the foregoing methods exhibited a good performance in QRS detection; however, issues relating to power efficiency and implementation simplicity are the main concerns for embedded system and mobile applications.
This study proposes a real-time QRS detection and R point recognition method with a high accuracy but very low computational complexity. It is achieved by the enhancement of QRS segments with the restraining of P and T waves. The QRS recognition is carried out based on four typical QRS waveform templates. The performance of the proposed method is verified using the MIT-BIH Arrhythmia Database and was implemented in a mobile phone and an embedded system (ARM Cortex M3), respectively, to demonstrate the real-time performance.
The paper is organized as follows. Section 2 presents the proposed methodology. The detected result according to the MIT-BIH Arrhythmia Database using the proposed method is demonstrated in Section 3. Section 4 presents the implementation of the proposed method on a mobile phone and an embedded system, as well as the comparison with a heart rate sensor product. Section 5 is the conclusion.
2. Methodology
The procedure of the proposed QRS detection and R point recognition method can be divided into four steps, as shown in Figure 3. The detailed process for each step is as follows.
2.1. Refreshment of the ECG Signal
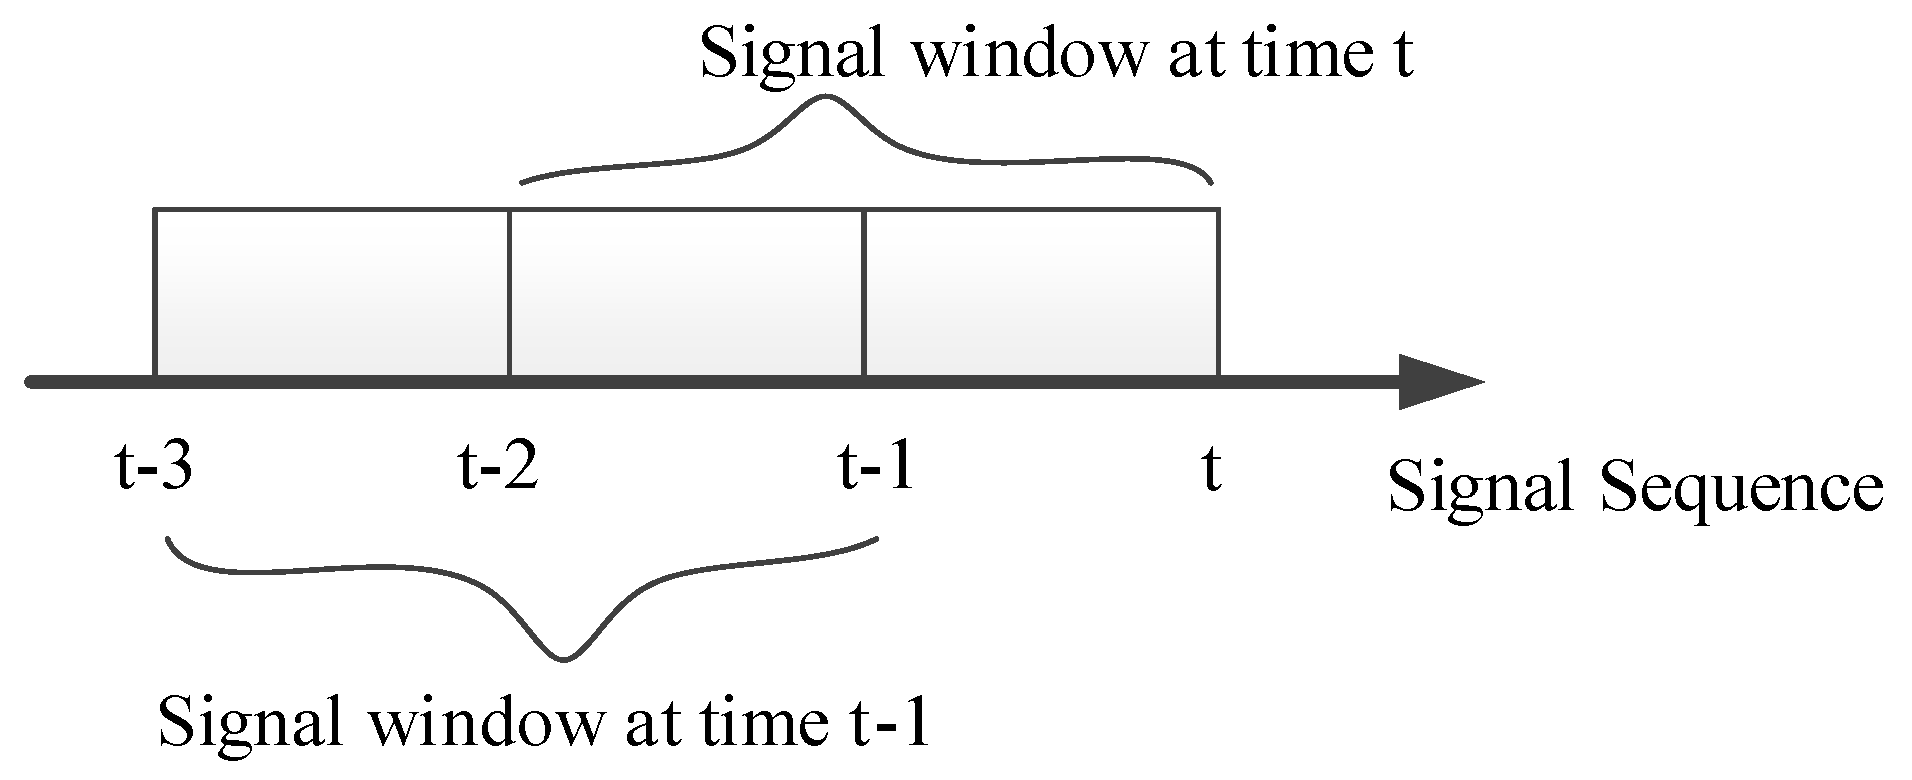
In most ECG devices, the monitoring heart rate range is from 30 to 240 beats per minute (bpm); therefore, there is at least one complete cardiac cycle within a two-second time interval. For this reason, a sliding window of two seconds is used to capture the ECG signal and the obtained ECG signal is refreshed every second, as shown in Figure 4.
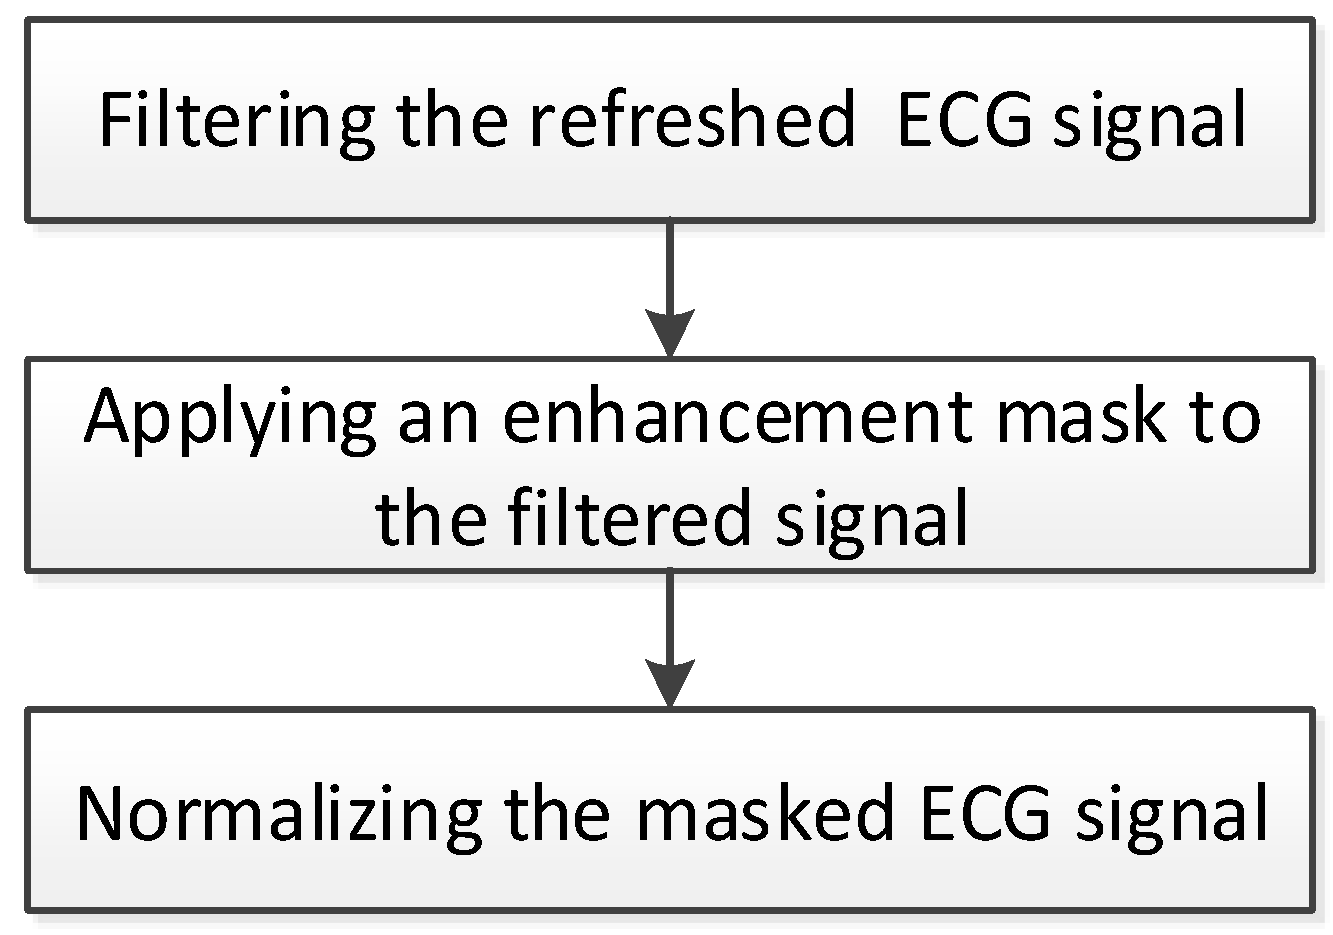
2.2. Signal Enhancement
In a normal sinus rhythm (NSR), the QRS wave usually has a sharp shape in lead II, as shown in Figure 2. However, for a wearable device such as a 24-h ECG recorder (holter), motion artifacts and abnormal rhythms bring about baseline wandering, amplitude variation, and atypical waveforms. This study proposed a signal transformation procedure, as shown in Figure 5, to eliminate motion artifact effects, and enhance the QRS segments, as well as restrain P and T waves. The refreshed ECG signal is filtered using a band-pass filter with a bandwidth between 0.5 and 17 Hz to eliminate noise and motion artifacts.
Then, the enhancement of the QRS segment whilst restraining P and T waves is achieved by applying the following mask:
where M represents the enhancement mask and:
E represents the filtered ECG signal and S represents the masked ECG signal. The zero sum of M’s entries will eliminate baseline wandering. Subsequently, the QRS amplitude variation is eliminated by normalizing the masked ECG signal to 1.
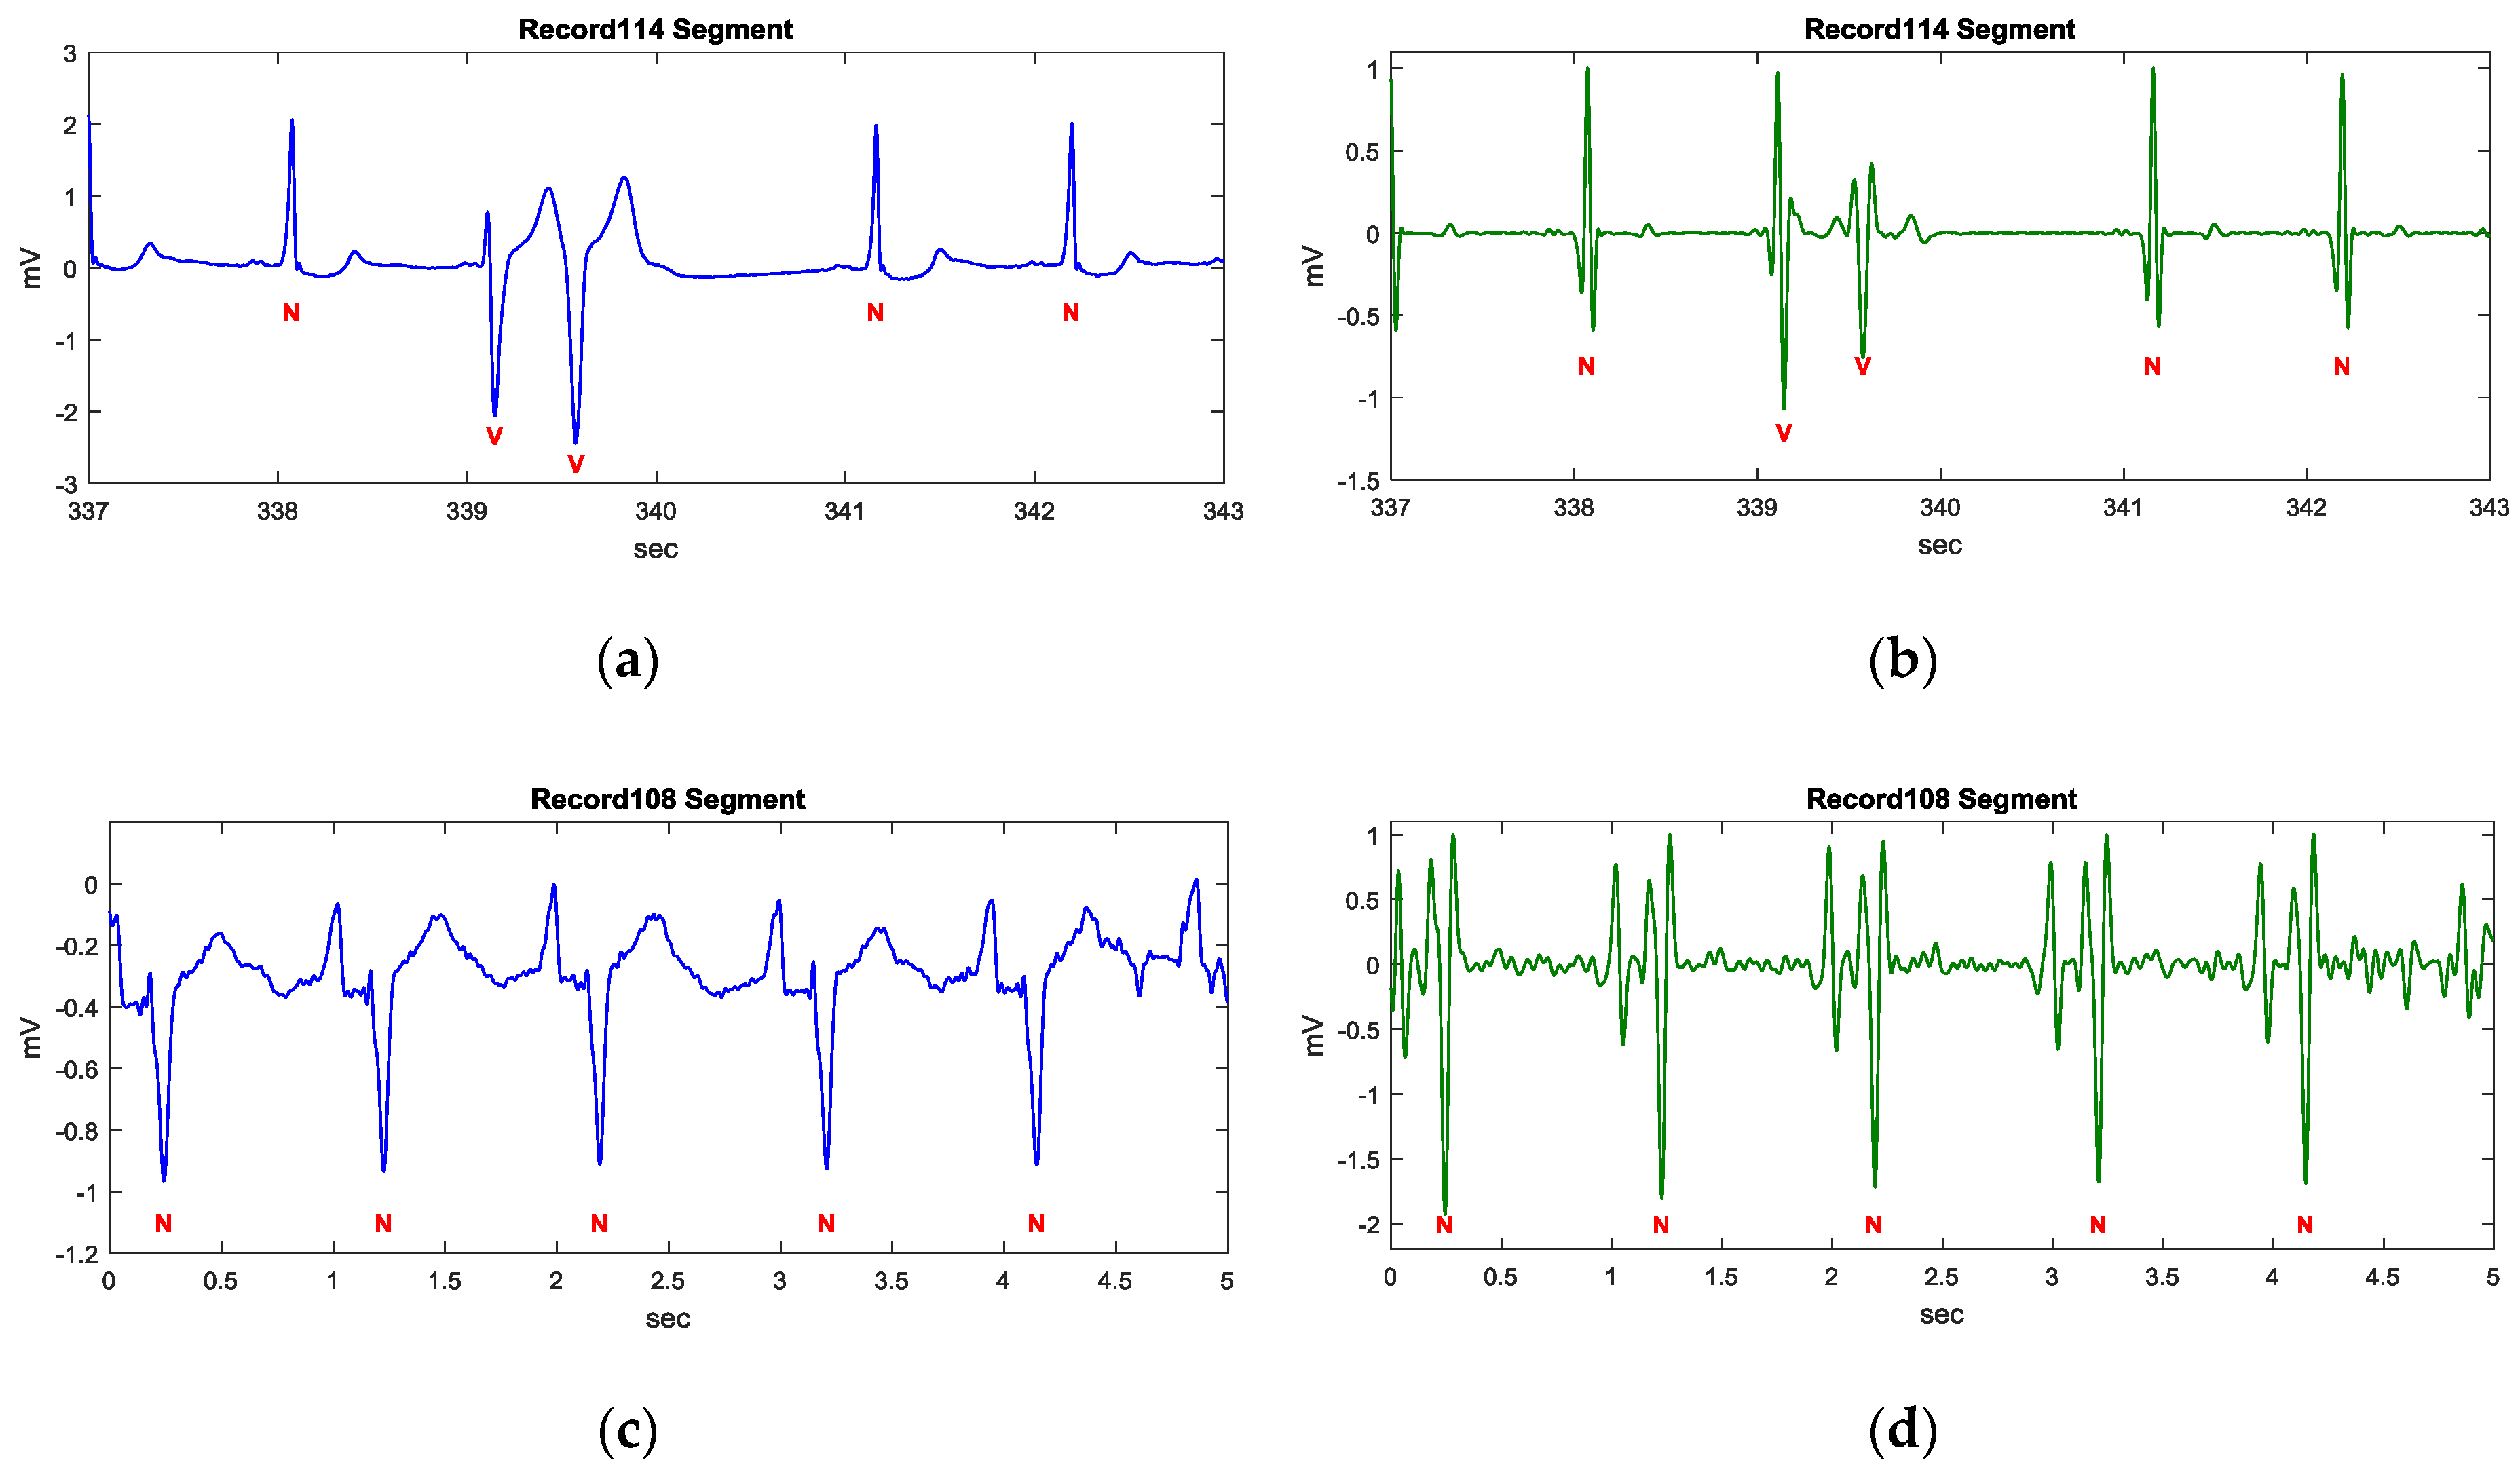
Figure 6 demonstrates three examples of different ECG rhythms provided by the MIT-BIH arrhythmia database using k = 1, where the annotation N represents a normal sinus rhythm (NSR), V represents a premature ventricular contract rhythm (PVC), and L represents a left bundle branch block rhythm (LBBB). Figure 6a,c,e illustrate the filtered ECG signal of Record 114, 108, and 111 segments, respectively, using a low pass filter with a 40 Hz cutoff frequency. The Record 114 segment is of NSR and PVC rhythms. The transform result shown in Figure 6b illustrates a restraining of P and T waves and an enhancement of QRS complexes. The Record 108 segment is of an atypical NSR rhythm, which contains bigger P waves and inverse QRS complexes. The transformed result demonstrates that the T waves are restrained, while bigger P waves and QRS segments are enhanced, as shown in Figure 6d. The Record 111 segment is of an LBBB rhythm, which contains fork-like QRS complexes and relatively tall T waves. Figure 6e shows that the fork-like QRS complexes are enhanced while retaining P and T waves.
In the above examples, most of P and T waves are restrained and QRS segments are enhanced by the proposed signal transformation. Besides, the amplitudes in the transformed signal are also normalized to 1 to eliminate the amplitude difference from person to person. As a result, the crests and troughs can be detected using static thresholds.
2.3. The QRS Fiducial Point Detection
For a typical lead II ECG waveform as shown in Figure 2, the feature intervals, such as the PR interval, QRS duration, QRS amplitude, and QT interval, have normal ranges. Therefore, the searching range is defined as 0.3 s and the minimum amplitude for detecting the QRS complex is defined as 0.5 mV in this study.
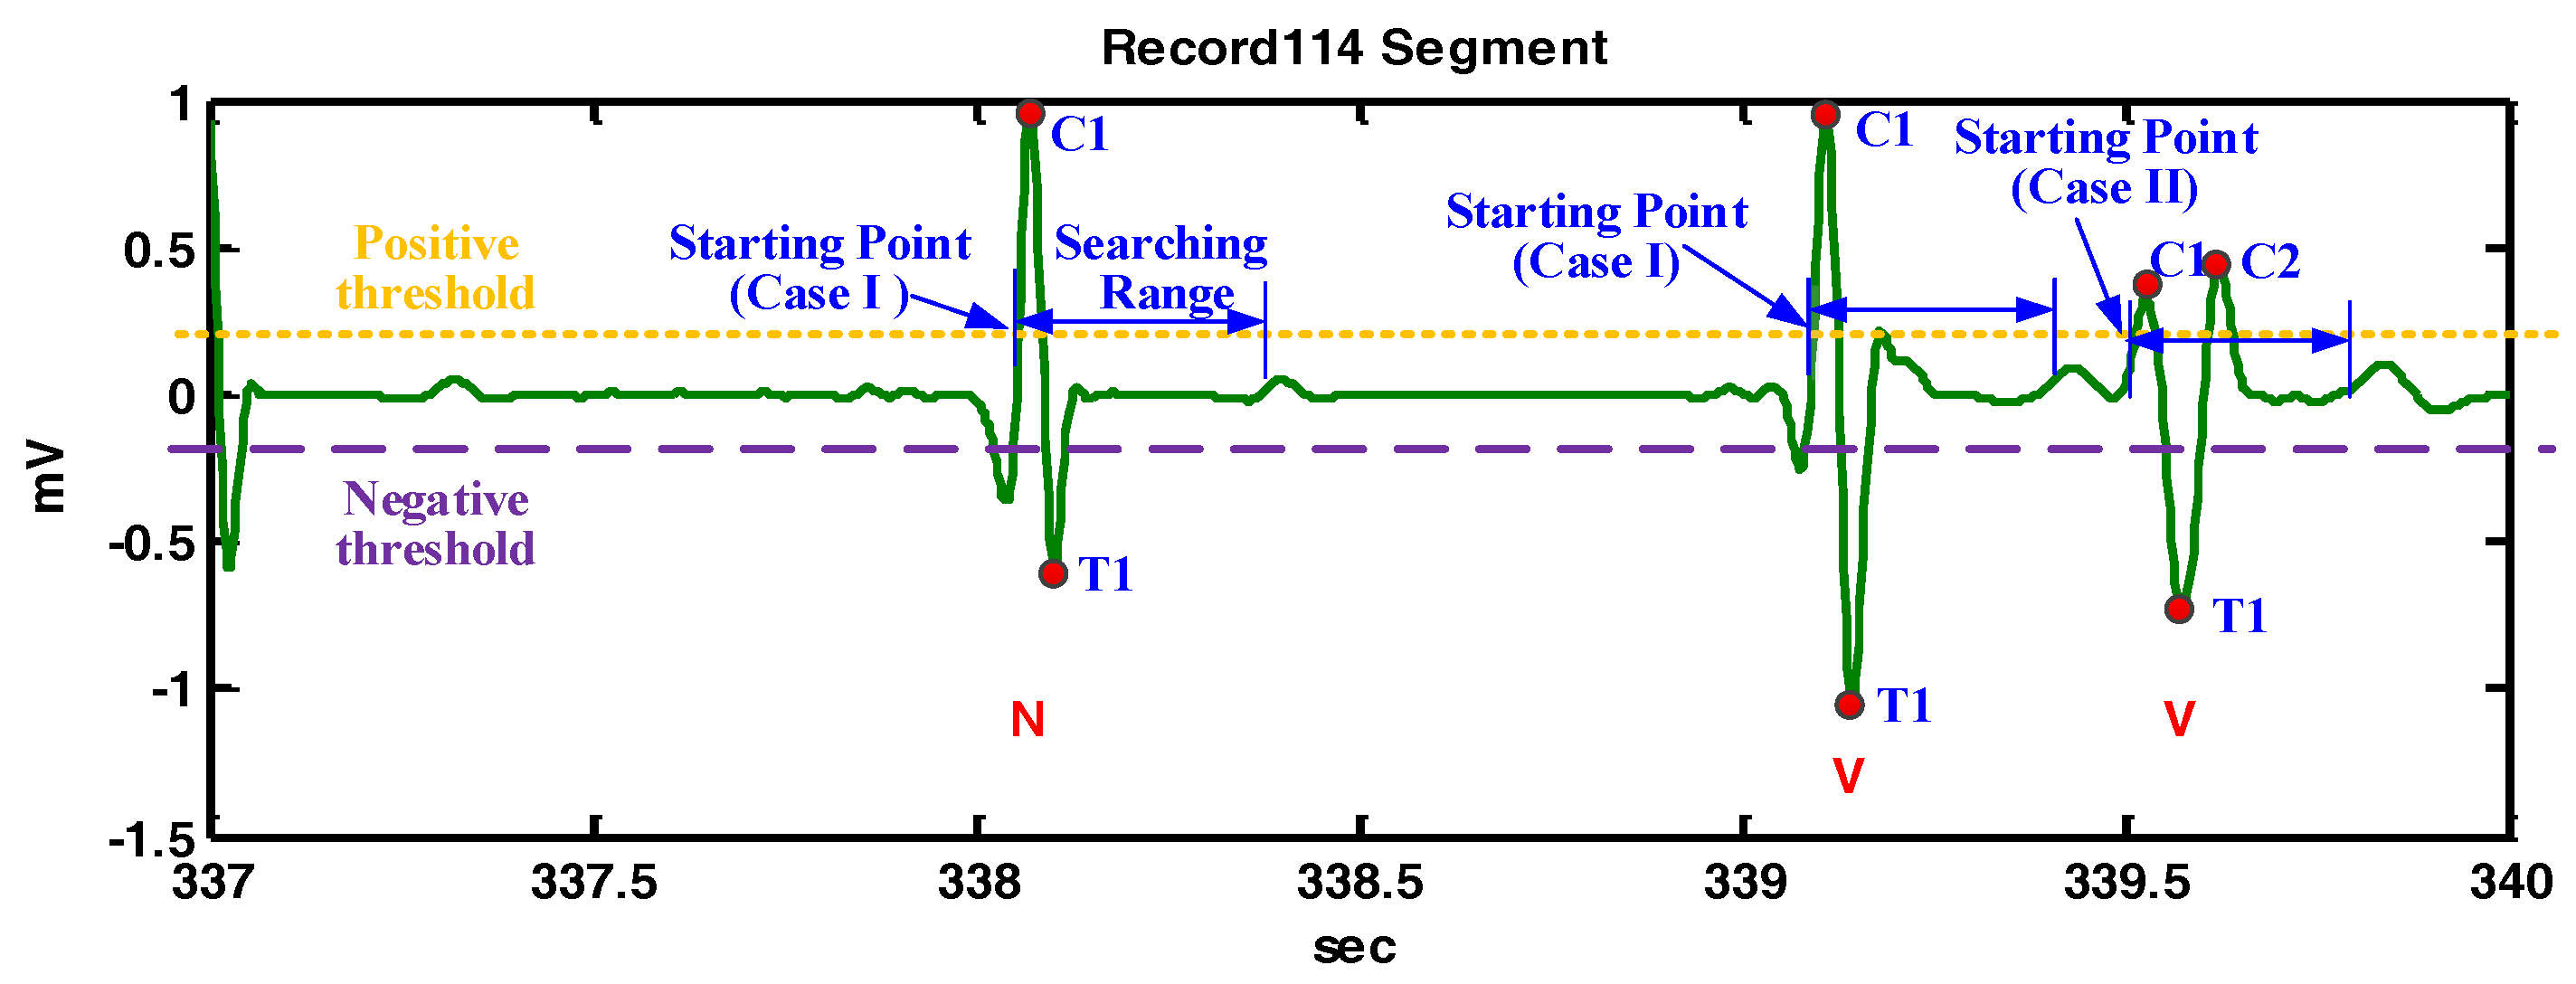
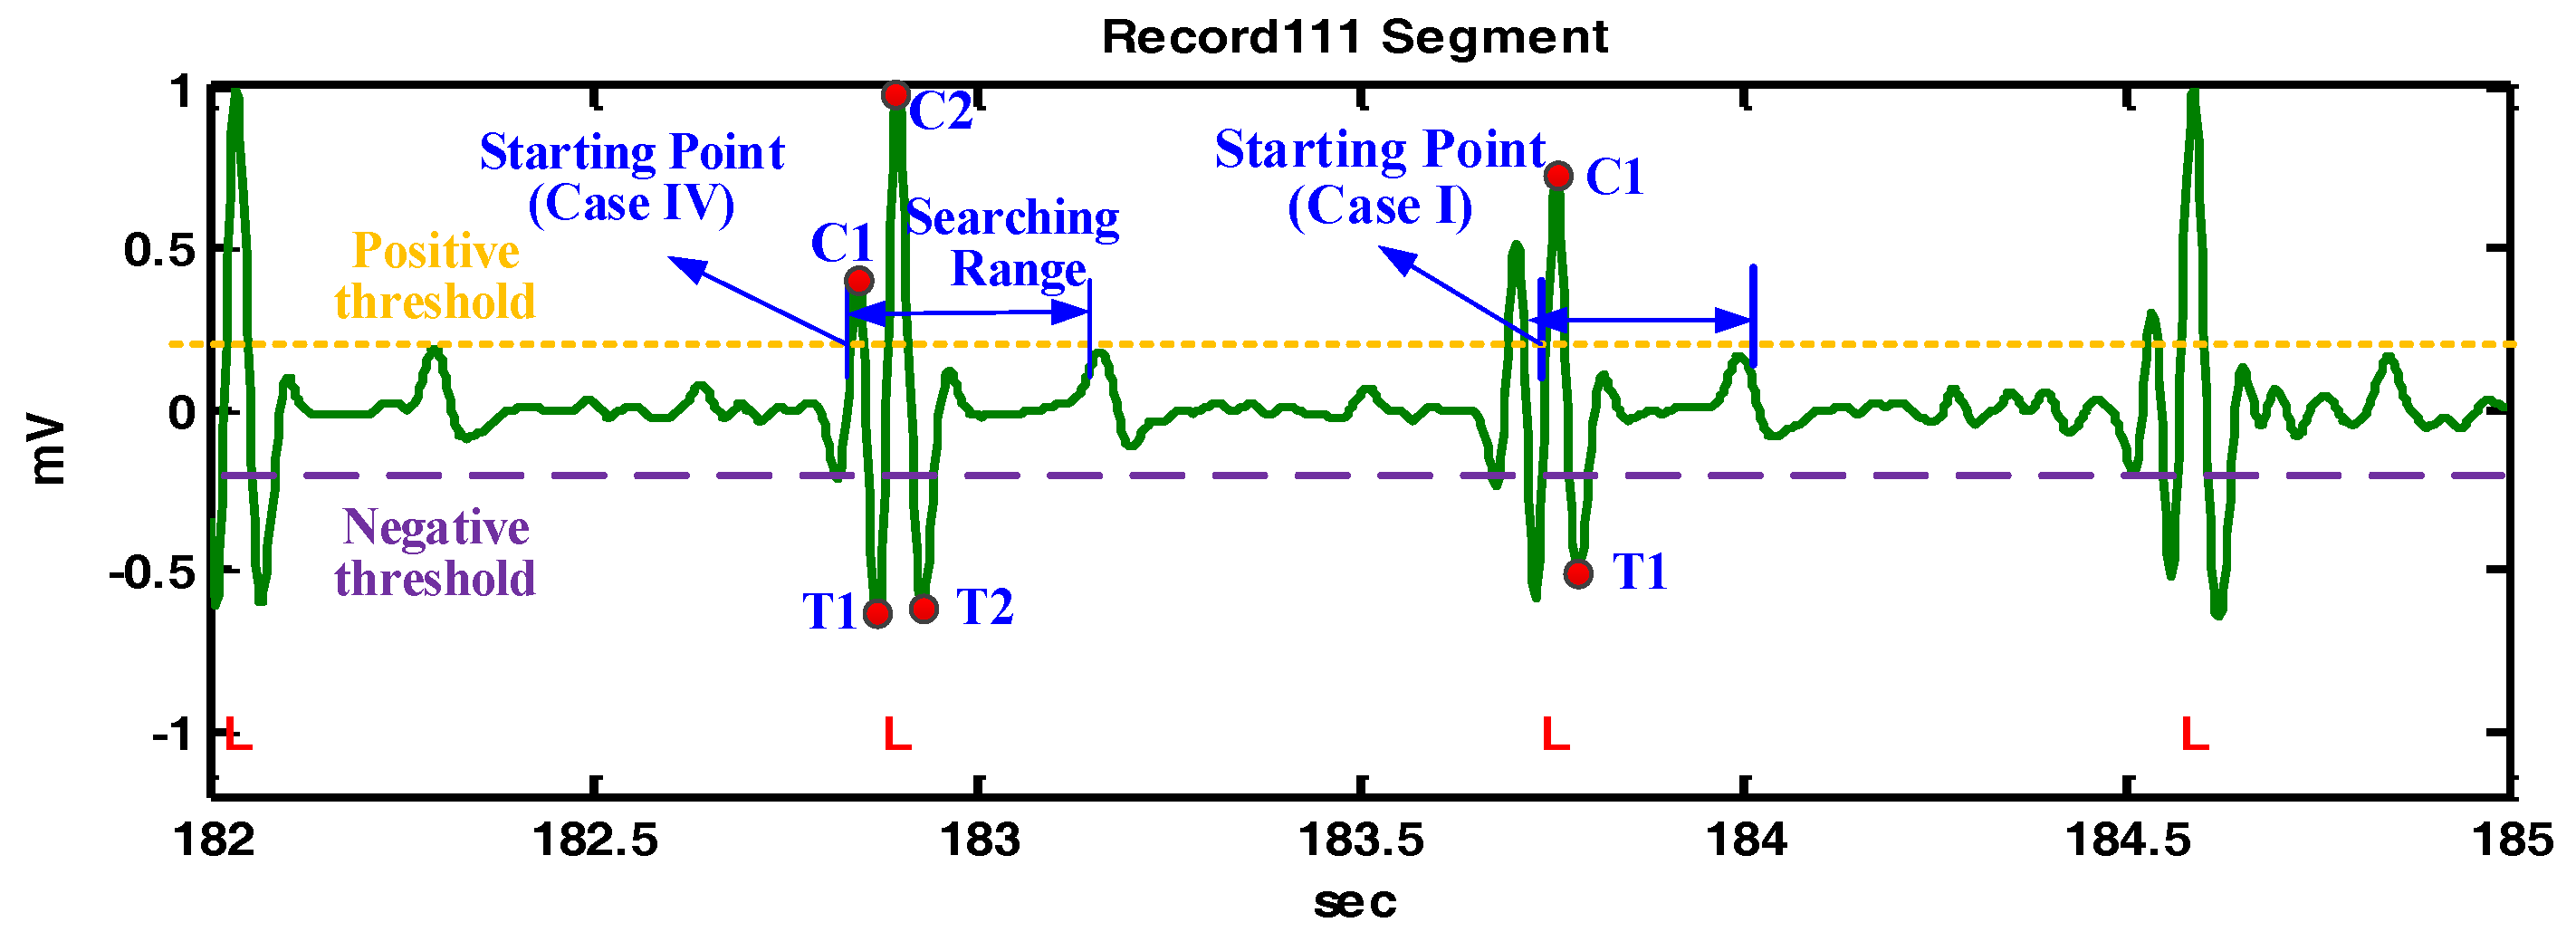
If the magnitude range of the refreshed ECG signal segment is higher than 0.5 mV, the procedure shown in Figure 7 will activate to detect the QRS fiducial point. Due to the transformed signal being normalized to 1, a positive threshold of 0.22 is used to detect the crests, and a negative threshold of −0.2 is used to detect the troughs, respectively. The first instance of a transformed ECG signal of a value higher than the positive threshold is marked as the starting point for QRS detection.
- Case I:If only one crest and only one trough exist within the specified searching range (0.3 s), the instance corresponding to the crest is defined as the QRS fiducial point and search for the next starting point after the detected trough.
- Case II:If two crests are within the searching range and one trough exists between the crests, then the trough is defined as the QRS fiducial point and search for the next starting point from 0.12 s after the detected trough is for. It is noted that a normal QRS waveform has a duration of 0.12 s.
- Case III:If there is only one crest with a value higher than another threshold of 0.52 within the searching range, then the crest is defined as the QRS fiducial point and search for the next starting point from 0.12 s after the detected crest. This case is a special case which can be referred to the MIT-BIH arrhythmia database Record 104 and 107.
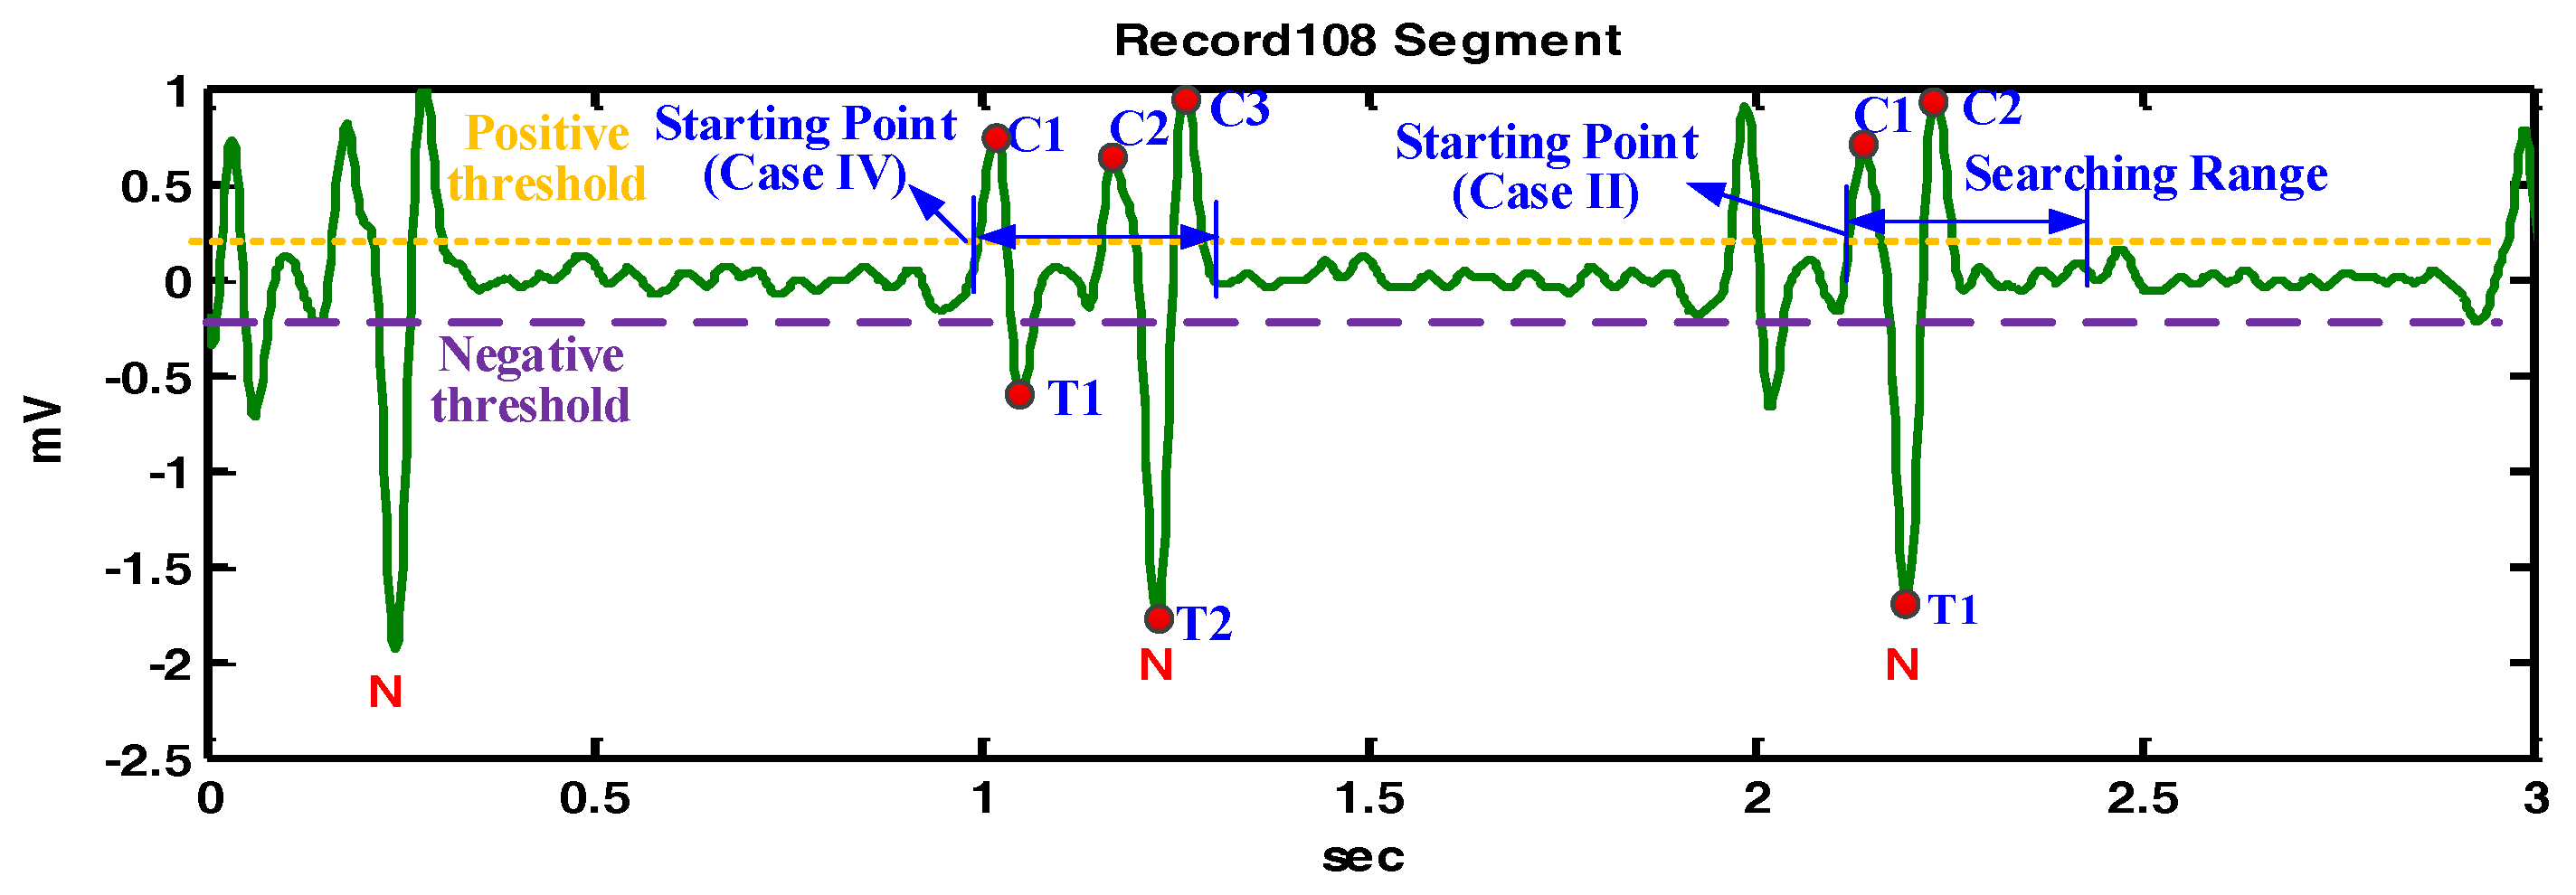
- Case IV (Case otherwise):If it is not case I, case II, or case III, then search for the next starting point corresponding to the next crest.
Figure 8 demonstrates the detailed detection procedures of the example shown in Figure 6b. For the starting point at 338.1 s, there is only one crest and only one trough within the searching range, so the crest is defined as a QRS fiducial point. For the next starting point at 339.5 s, there are two crests within the searching range and one trough exists between the crests, so the trough is defined as the QRS fiducial point.
Figure 9 demonstrates the detailed detection procedures of the example shown in Figure 6d. For the starting point at 1 s, there are three crests and two troughs within the searching range, so that the starting point is redefined as the starting point of the next crest. The detection corresponding to the starting point of the next crest is similar to that of the starting point at 2.1 s. In this example, QRS fiducial points are determined effectively in the QRS segment, even under the influence of big P waves.
Figure 10 demonstrates the detailed detection procedures of the example shown in Figure 6f. For the starting point at the first detected crest at 182.9 s, there is no second crest and no second trough, so the starting point is redefined as the starting point of the next crest. Subsequently, case I will be applied and C2 becomes the QRS fiducial point. A similar case is also illustrated at 183.7 s. It should be noted that the detected QRS fiducial point in the transformed signal may not correspond to the real R point in the ECG signal and an R point recognition procedure is described as the following.
2.4. Recognition of the R Point
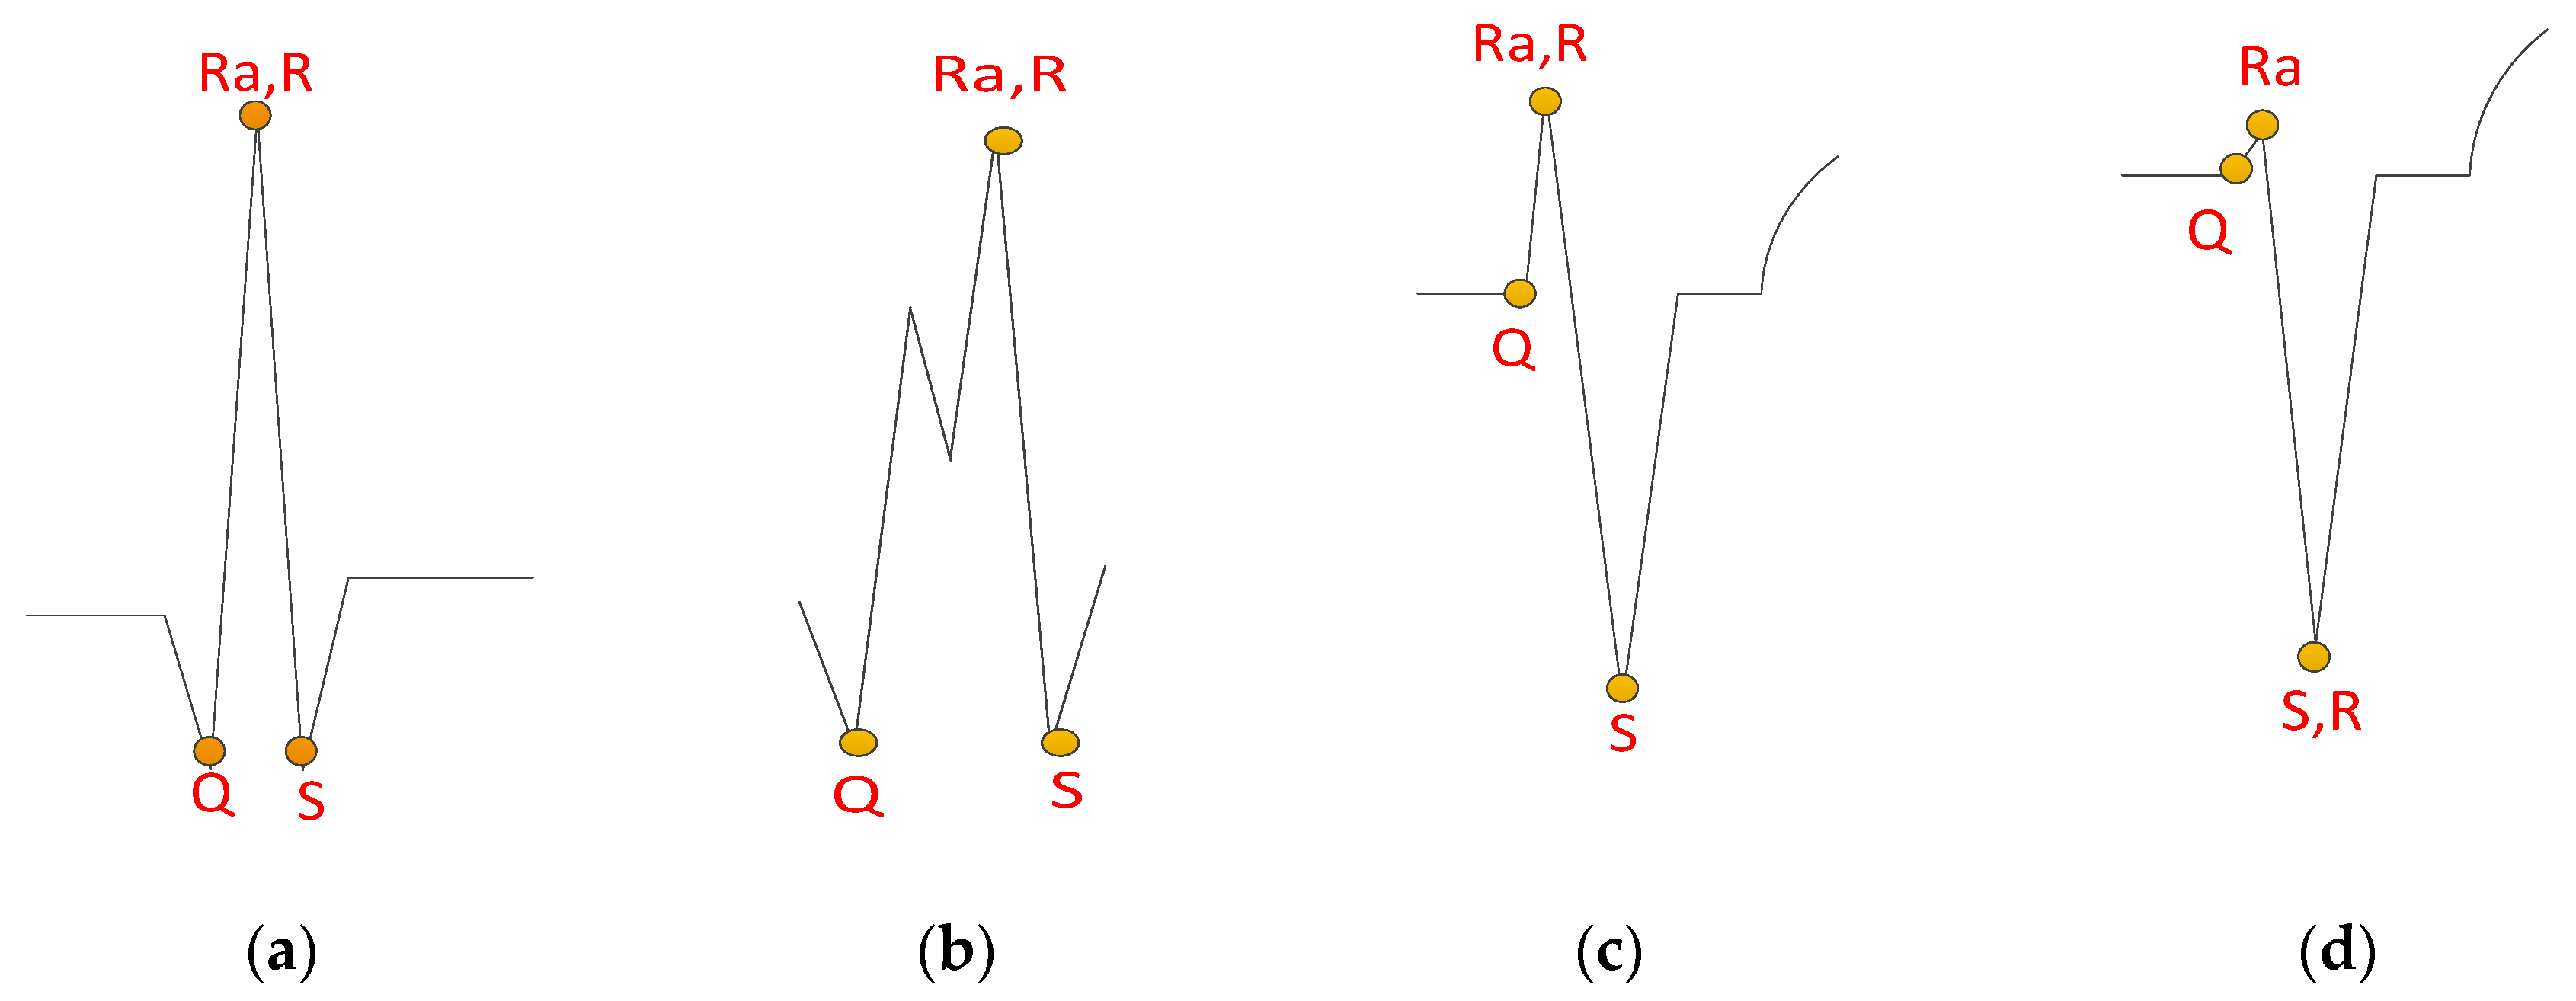
To recognize a reasonable R point according to the detected QRS fiducial point, four QRS waveform templates are proposed, as shown in Figure 11. The strategy of finding those features includes first searching for the S point from the fiducial QRS point, then searching for the Ra, Q, and R points successively, where Ra is the approximate R point, in order to find a reasonable R point. The details of each step are as follows.
2.4.1. S Point Detection
In general, a normal QRS segment range is less than 0.12 s. To identify the corresponding Q, R, and S points for a given QRS fiducial point, it is reasonable to use a searching time interval span of 0.24 s centering at the fiducial point. The S point detection procedure is described as follows:
- Step 1:For a given QRS fiducial point, determine the maximum and average amplitude within the 0.24 s searching span of the ECG signal.
- Step 2:Search a crest of amplitude higher than one half of the maximum amplitude after the QRS fiducial point.
- Step 3:If there is a detected crest, the S start searching point is assigned as the detected crest. Otherwise, the S start searching point is assigned as the QRS fiducial point.
- Step 4:The S point is assigned as the point of amplitude less than the average amplitude with a local minimum slope after the S start searching point.
2.4.2. Ra Point Detection
With a detected S point and its corresponding searching time span, the Ra point is determined according to the following. If there is at least one crest ahead of the detected S point with its amplitude higher than one half of the maximum within the searching range, the Ra point is assigned as the maximum amplitude point. Otherwise, the Ra point is assigned at the same point of S.
2.4.3. Q Point Detection
With a detected Ra point and the corresponding searching time span, the Q point is identified by the following procedure.
- Step 1:Search a crest of amplitude higher than one half of the maximum amplitude ahead of the detected Ra point.
- Step 2:If there is a detected crest, the Q start searching point is assigned as the detected crest. Otherwise, the Q start searching point is assigned as the Ra point.
- Step 3:The Q point is assigned as the point of amplitude less than the average amplitude with a local minimum slope ahead of the Q start searching point.
2.4.4. R Point Detection
With detected Ra and S points, the R point is determined by the following rules:
- Case 1:If the Ra point and the S point are at the same position, then assign the R point at point S.
- Case 2:If the amplitude between the Ra point and the Q point is less than a quarter of the amplitude between Ra and S, then assign the R point at point S.
- Case 3:Otherwise, assign the R point at the Ra point.
3. Result and Discussion
3.1. QRS Detection and R Point Recognition Result
Figure 12 illustrates the detected QRS fiducial points and the recognized feature points (Q, R, and S) of the three examples, based on the four proposed QRS waveform templates, shown in Figure 11. Figure 12a illustrates the correctly detected features defined in Figure 11a,c,d. Figure 12b illustrates the correctly detected features defined in Figure 11d. Figure 12c illustrates the correctly detected features defined in Figure 11c. The results in Figure 12 illustrate that different rhythms can be successfully recognized by the proposed method.
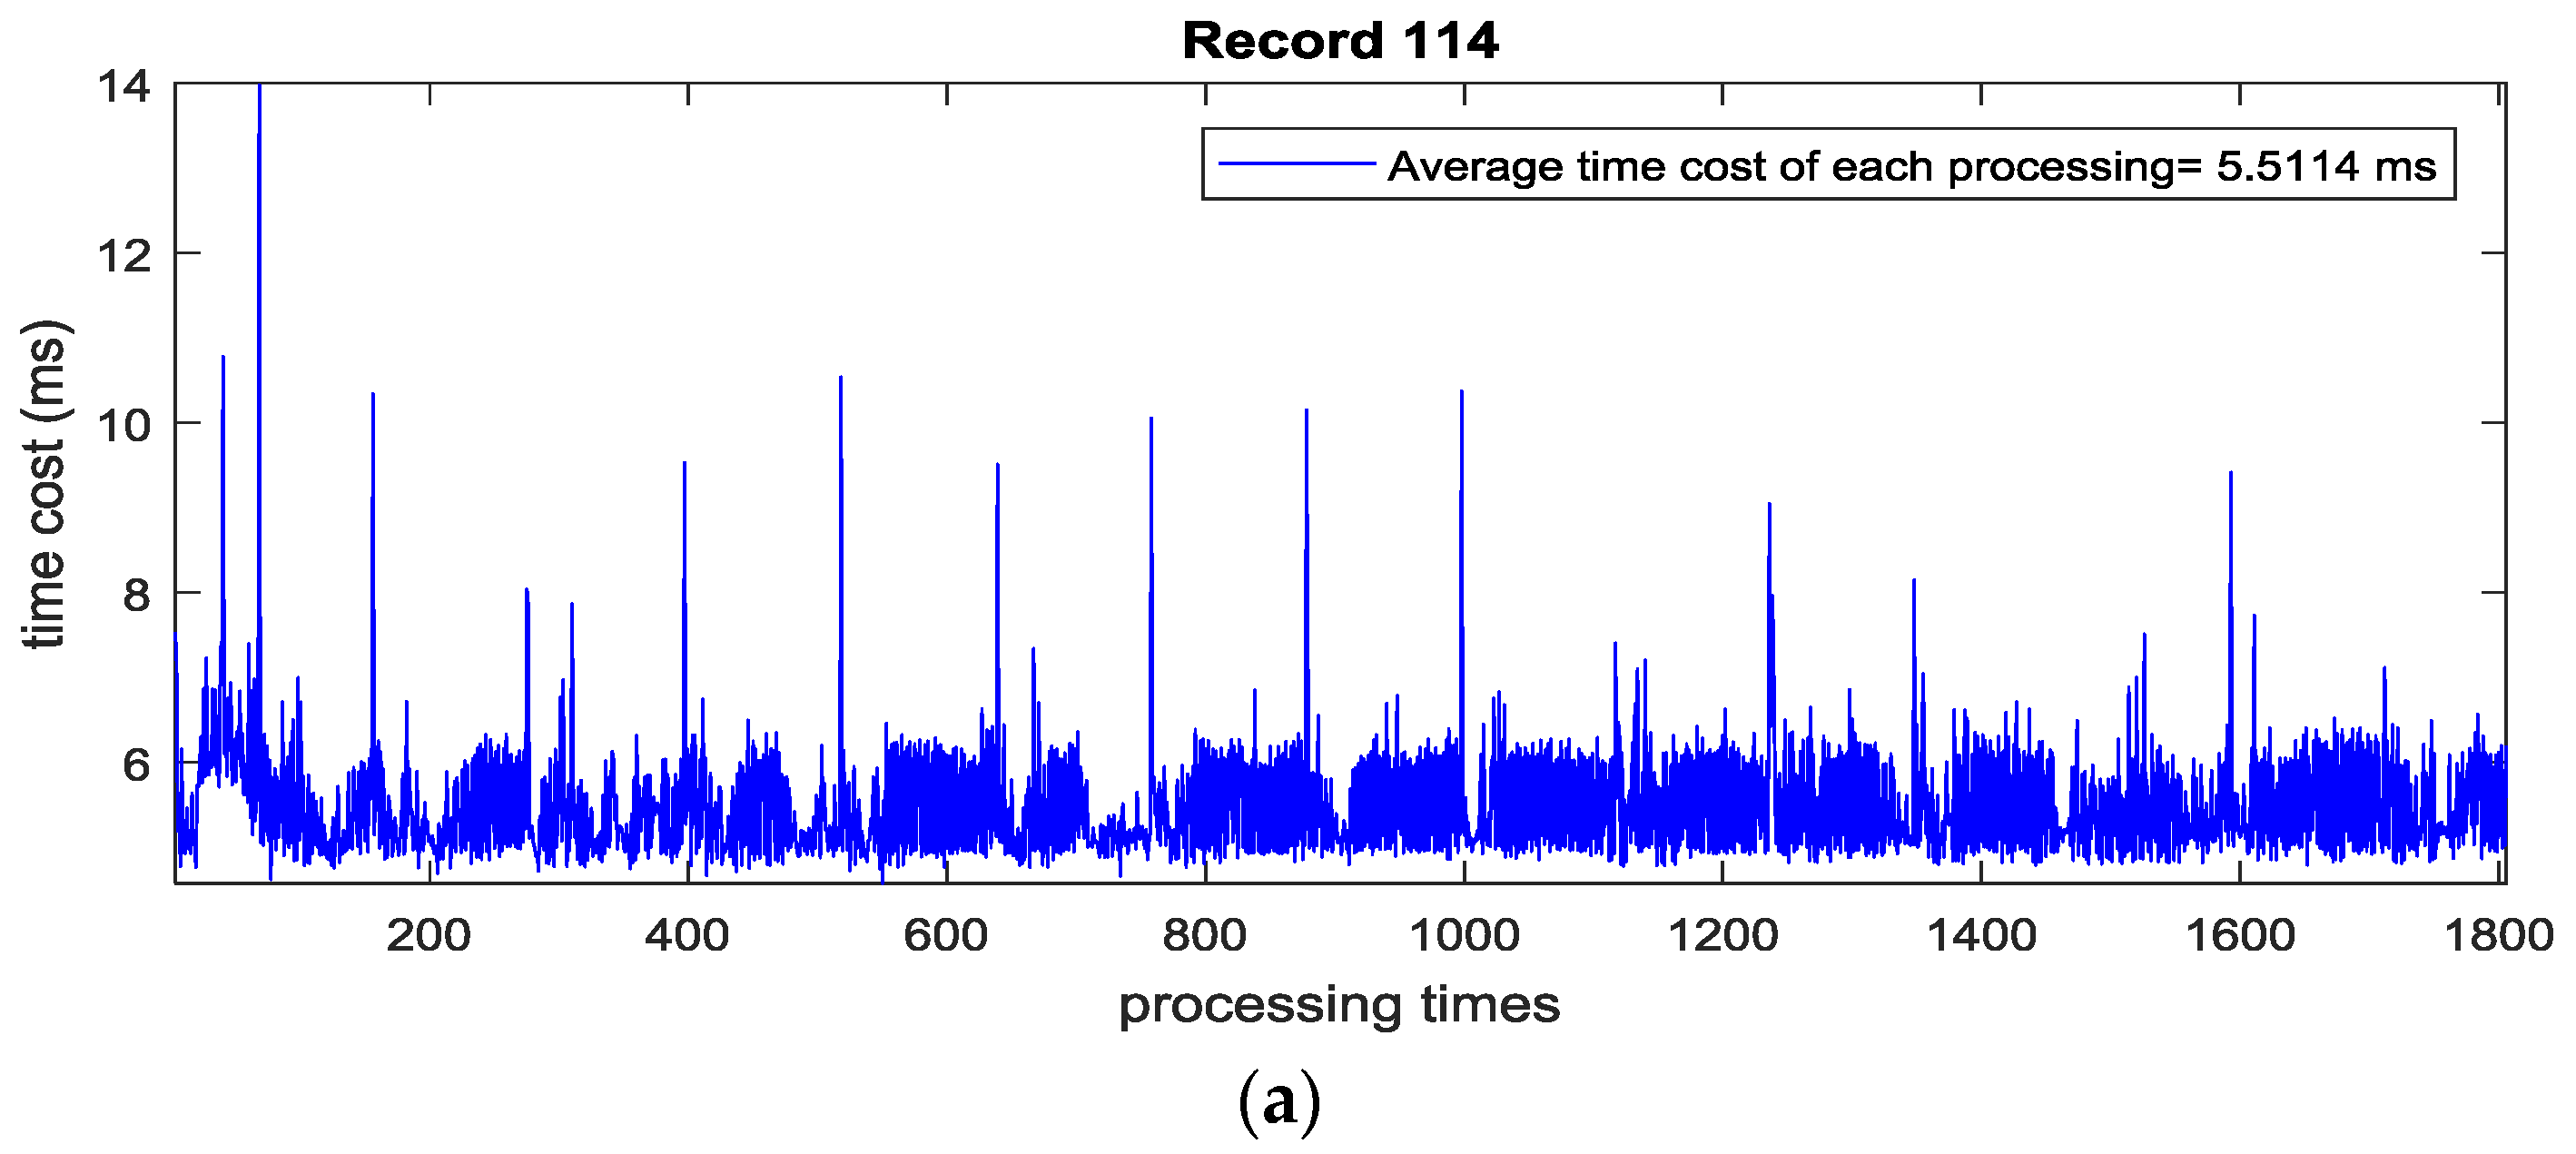
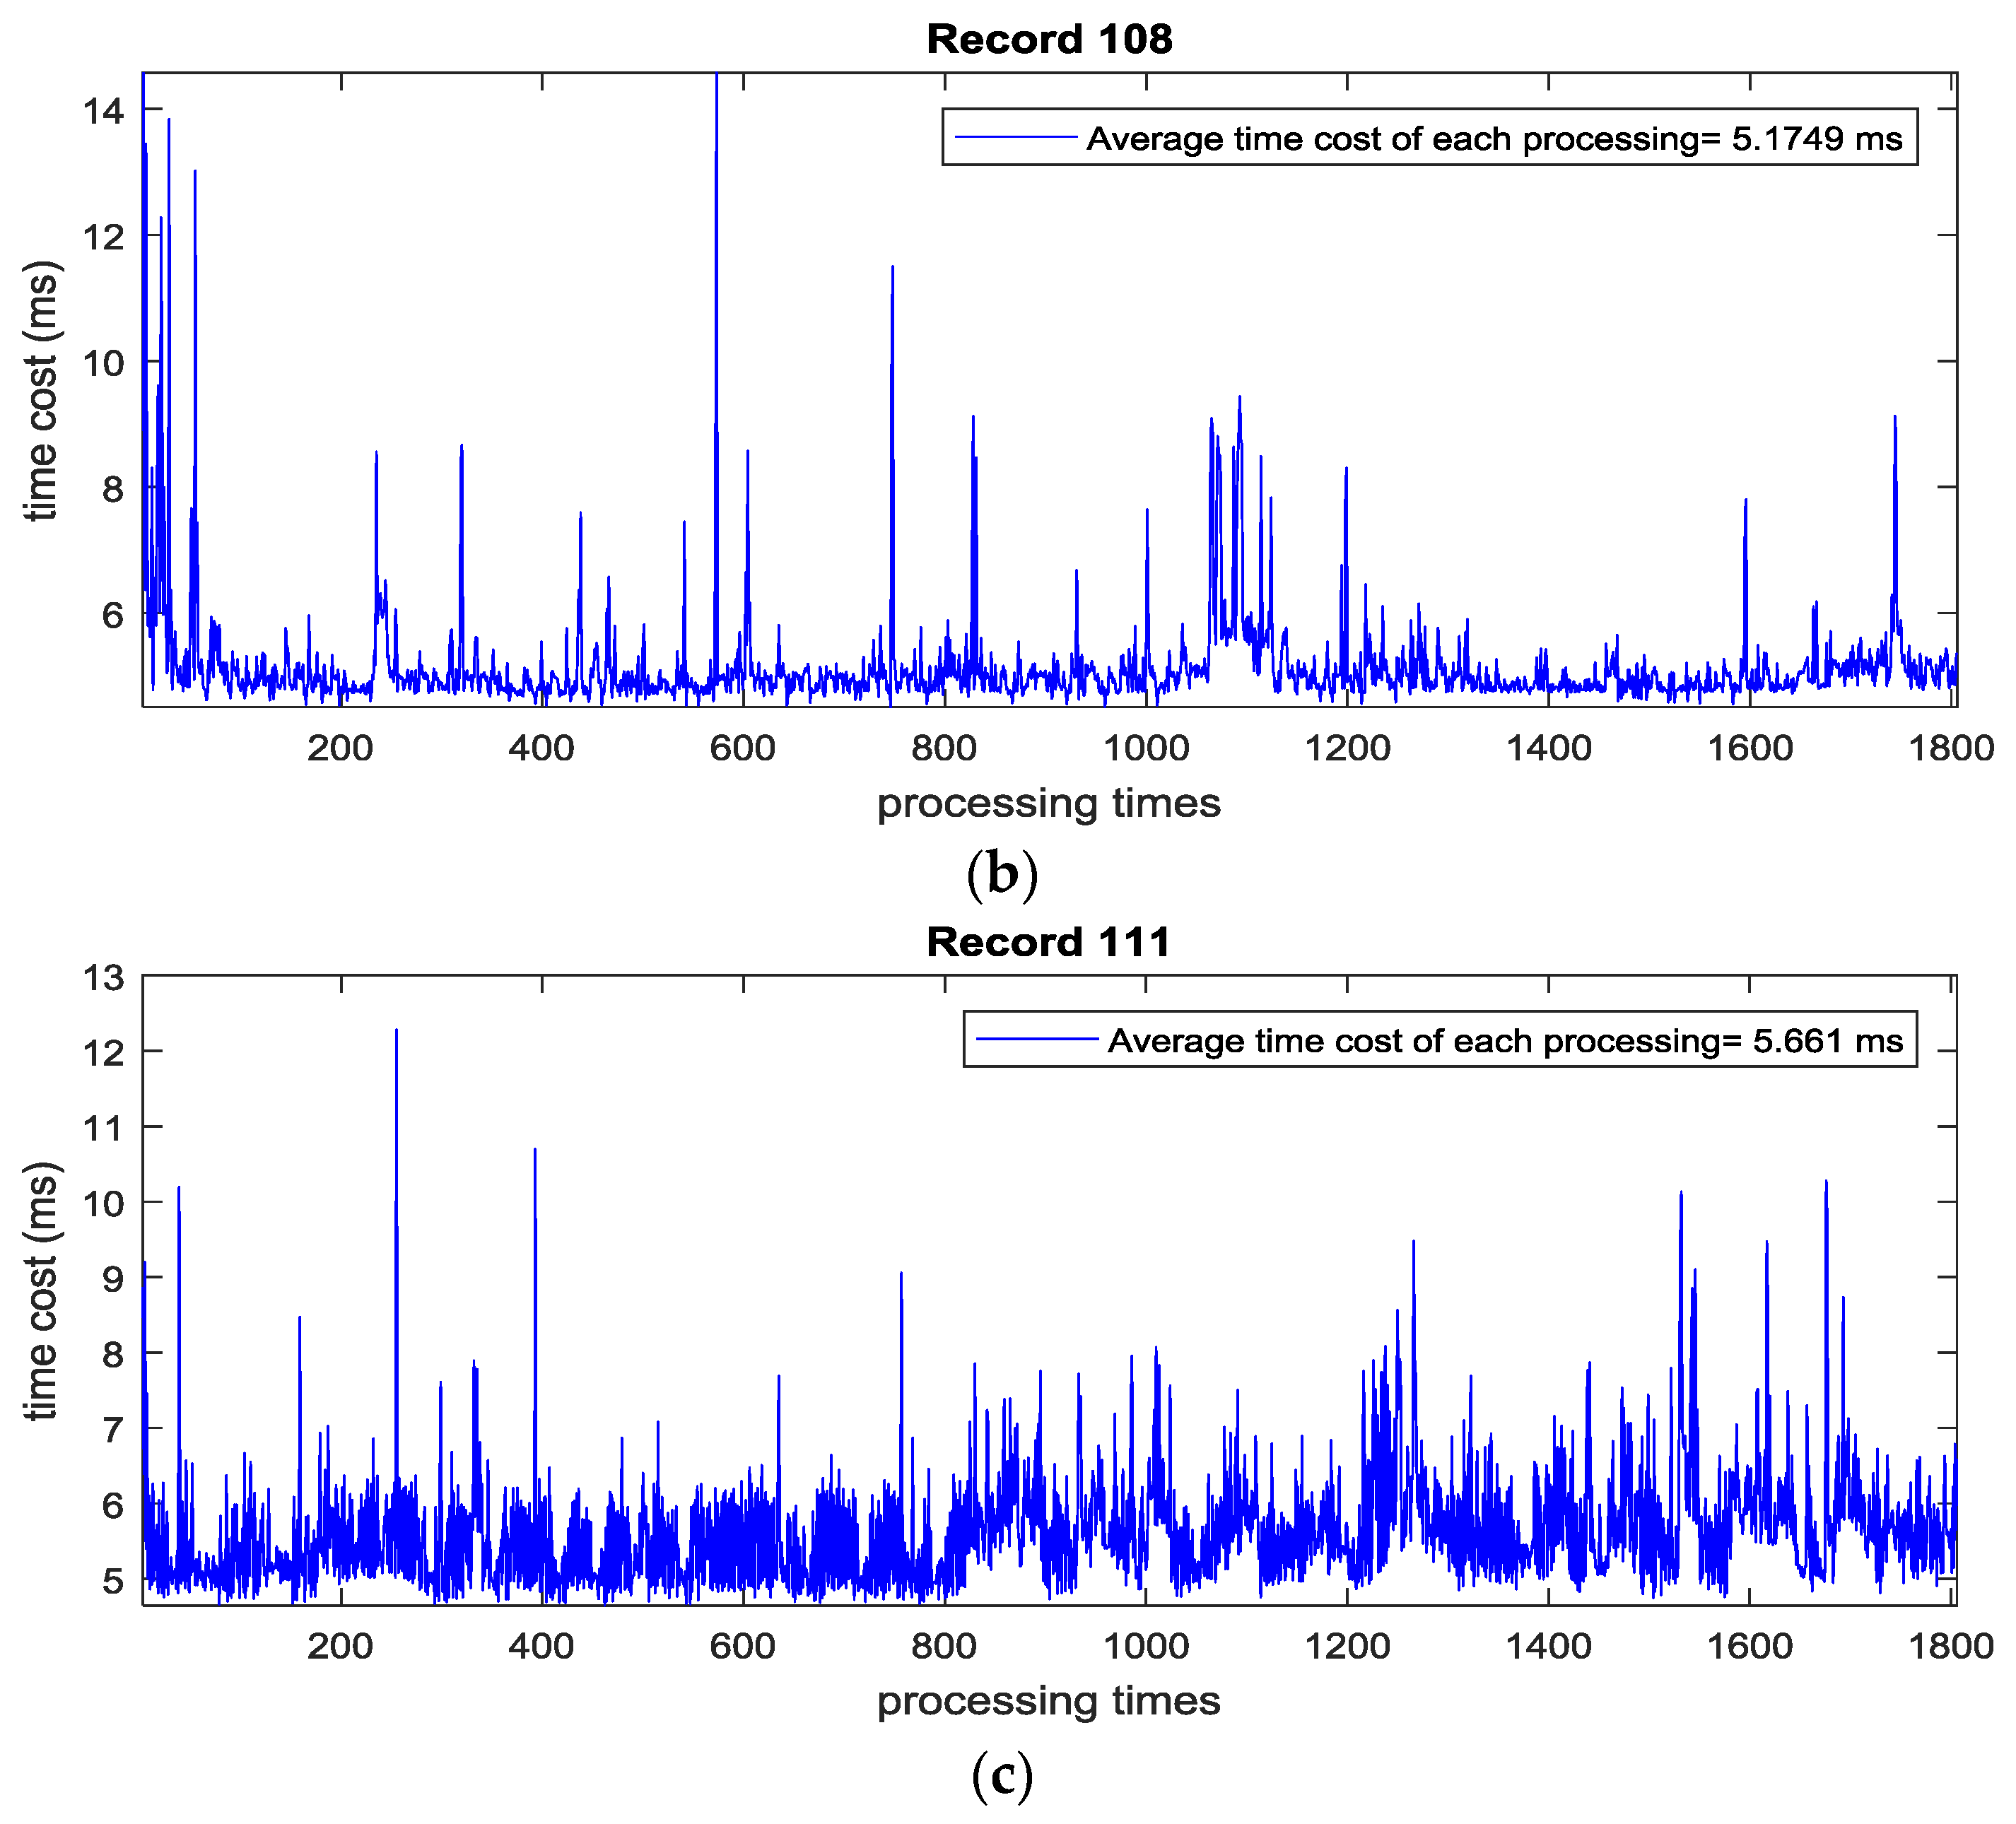
Before implementing the algorithm in an embedded system, the time cost of each processing for the two-second length ECG signal from the MIT-BIH arrhythmia database (360 Hz) is evaluated using Matlab in a Win 7 PC with Intel i5 dual core CPU. Through test runs of the above examples, the maximum time cost of processing once is less than 15 milliseconds and the average time cost of each processing is less than 6 milliseconds, which implies that the algorithm is portable for a real-time embedded system in Figure 13.
3.2. Benchmarking Study Using MIT-BIH Arrhythmia Database
The MIT-BIH arrhythmia database contains 48 half-hour excerpts of two-channel ambulatory ECG recordings. The recordings were digitized at 360 samples per second per channel with an 11-bit resolution over a 10 mV range [22]. The standard of ANSI/AAMI/ISO EC57:1998/(R)2008 claims that the QRS detection algorithm has to supply the reporting of statistics from the MIT-BIH arrhythmia database [23].
To evaluate the performance of the proposed method, the commonly used detector performance measures are applied and defined as follows.
Sensitivity (Se) indicates the fraction of events which are detected:
Positive prediction (+P) represents the fraction of detections, which are events:
And the detection error rate (DER):
where TP is the number of True Positive beats (correctly detected), FN is the number of False Negative beats (erroneously missed), and FP is the number of False Positive beats (erroneously detected) [23].
For comparison, the heart beats information in the annotation file of each recording is read for reference using the WFDB tool [24]. During a beat-by-beat comparison, reference beat labels in the annotation file and detected R points are matched by pairs. A match case is counted where the absolute value of the time difference between the detected R point and the reference is less than 150 ms [23].
Table 1 is the resulting performance of the proposed algorithm tested by the MLII lead and V5 lead of all 48 recordings in the MIT-BIH arrhythmia database. Segments of data in which ventricular flutter or fibrillation (VF) is present are only excluded from beat-by-beat comparisons (for QRS and VEB detection) [23]. A total of 109,443 beats were tested in total and Se is 99.82%, + P is 99.81%, and Der is 0.36% when applying the proposed method. Table 2 reports the performance of the proposed method in different rhythms using the annotation files of the MIT-BIH arrhythmia database. The QRS detection sensitivity of the PVC rhythms is 98.95%, which is sufficient for mobile health applications.
Table 3 reports the function and performance comparison of the proposed method with other methods reported from the original published papers using the MIT-BIH arrhythmia database. As shown in Table 3, five products lead to embedded applications. Among them, the proposed approach is the only product which recognizes four types of point R and is able to provide a preliminary heart rhythm classification in embedded devices. The comparison implies that the proposed real-time method has a high sensitivity (Se) and positive prediction (+P), but low detection error rate (DER). Furthermore, the proposed method not only detects the QRS waves, but also detects the R points in various waveforms with a very low computational effort, which is suitable for wearable device applications and meets the requirement for new generation ECG products.
4. Implementation
4.1. Implementation for a Mobile Phone
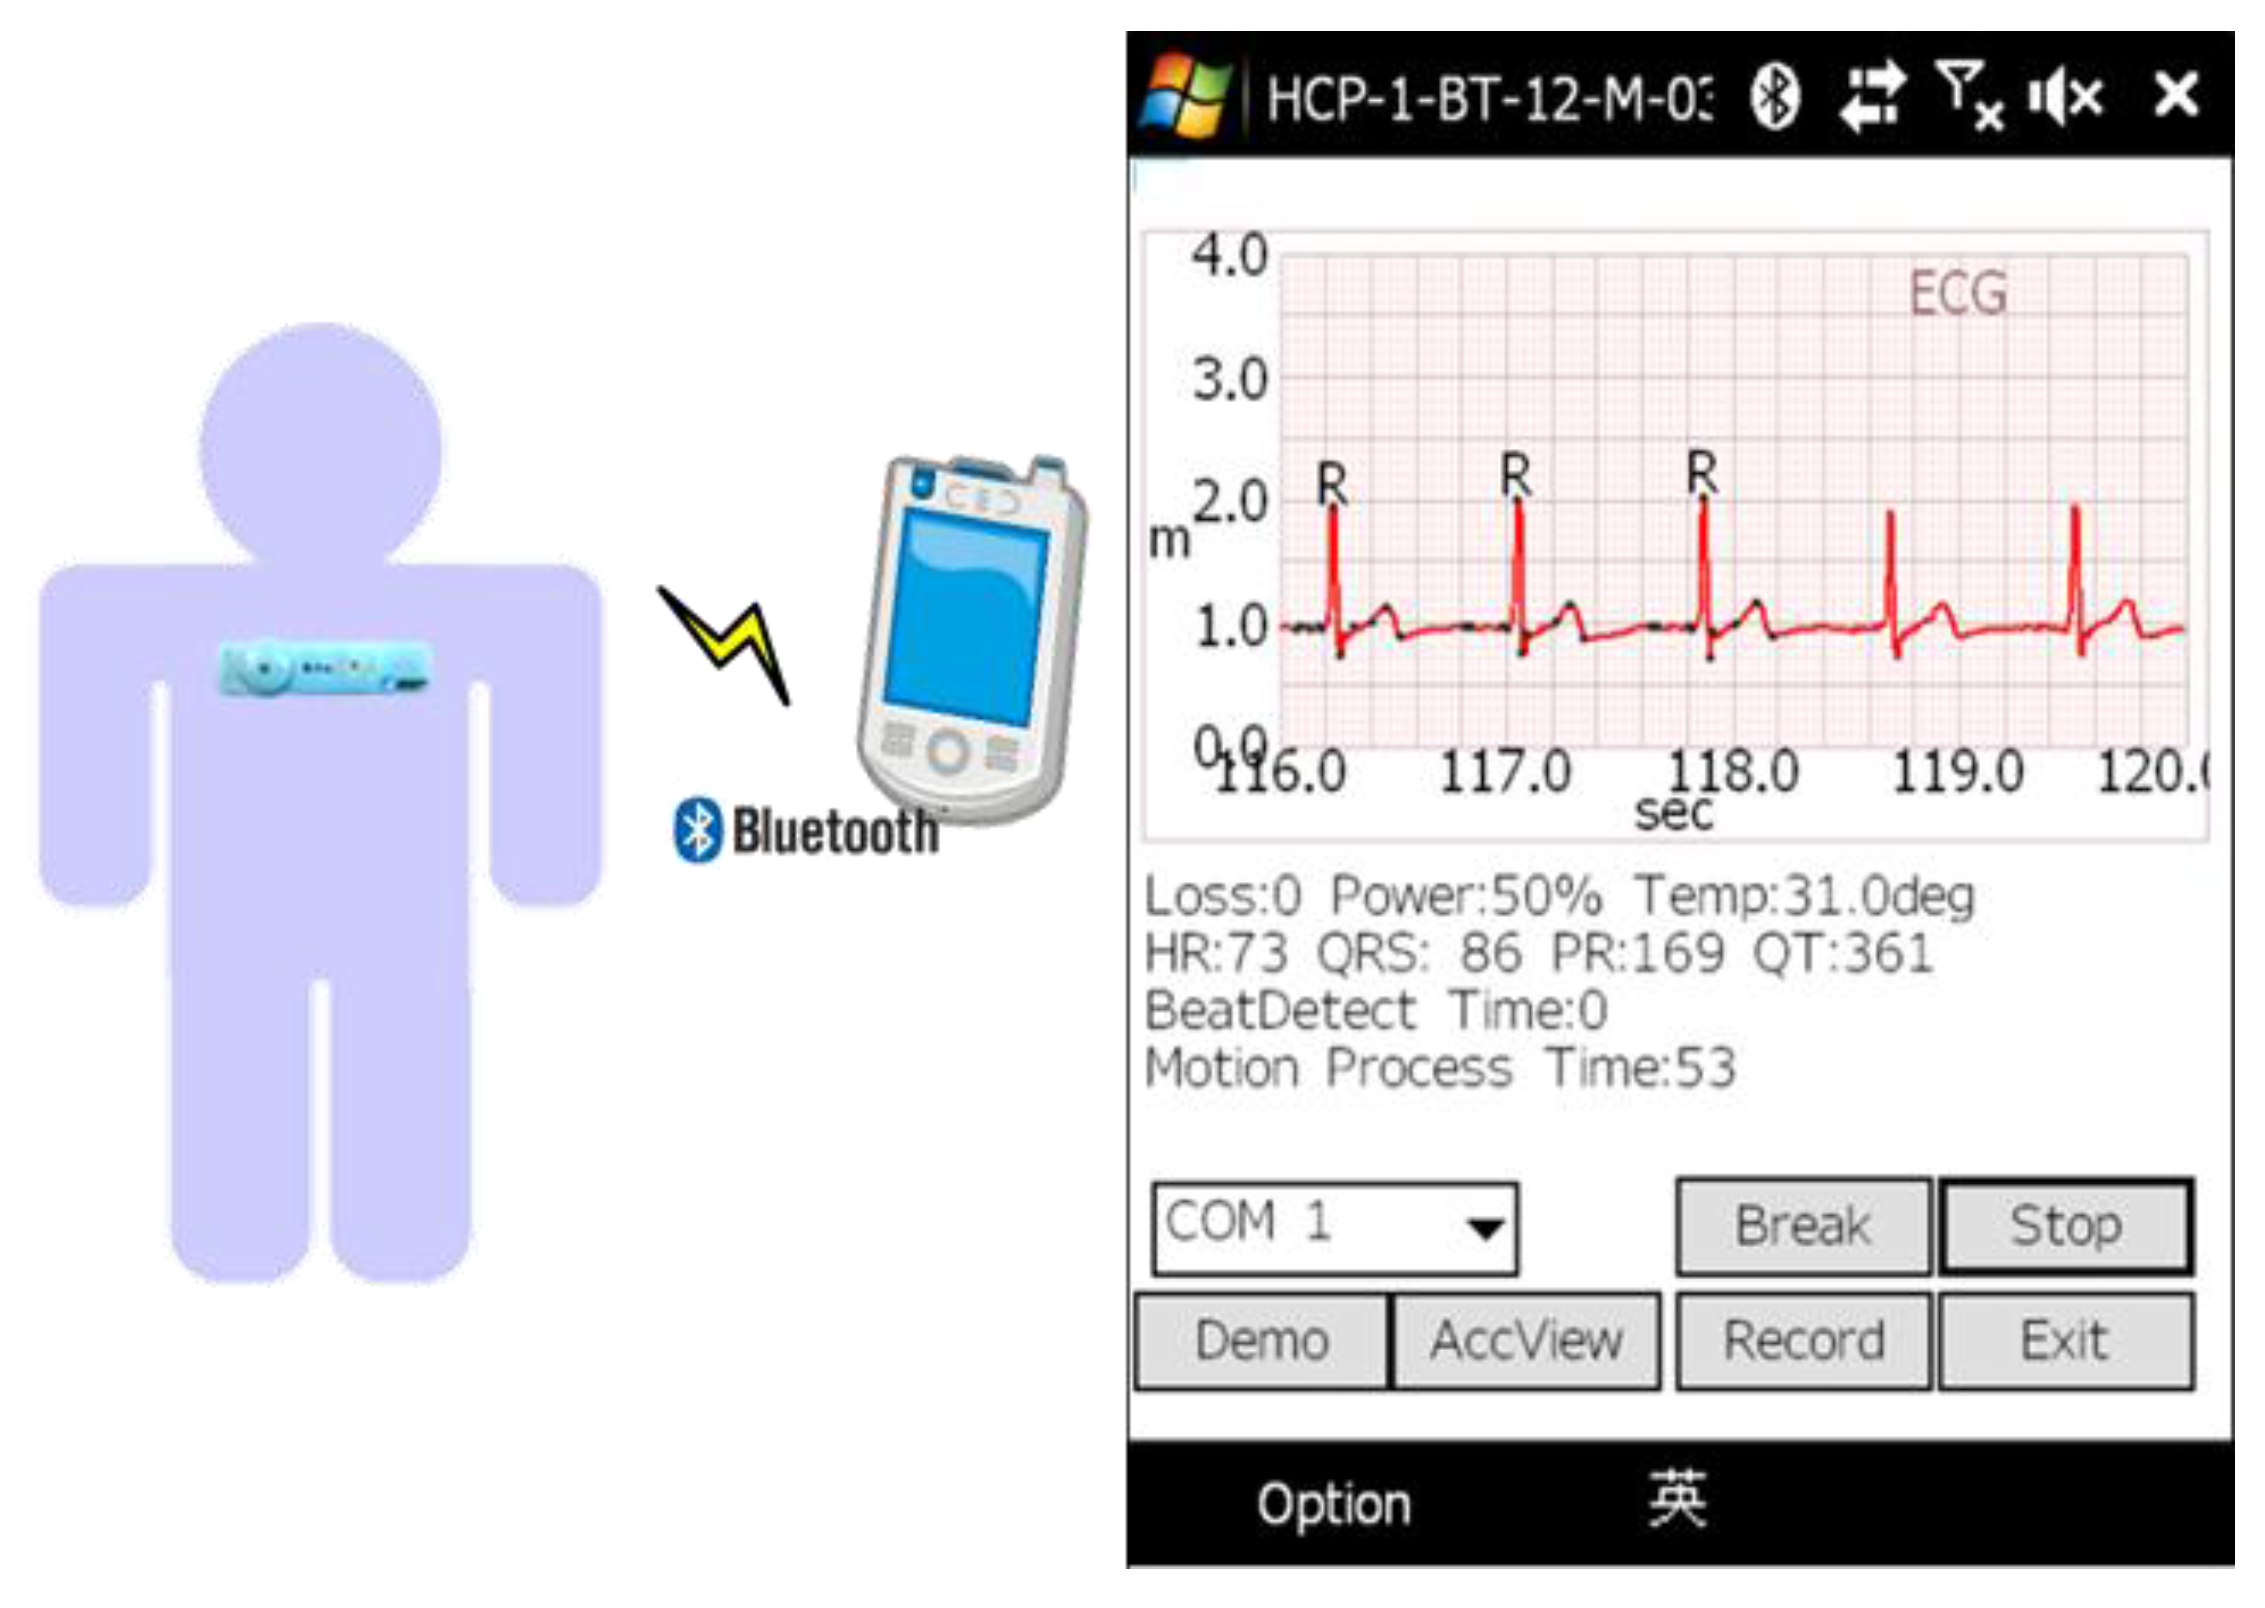
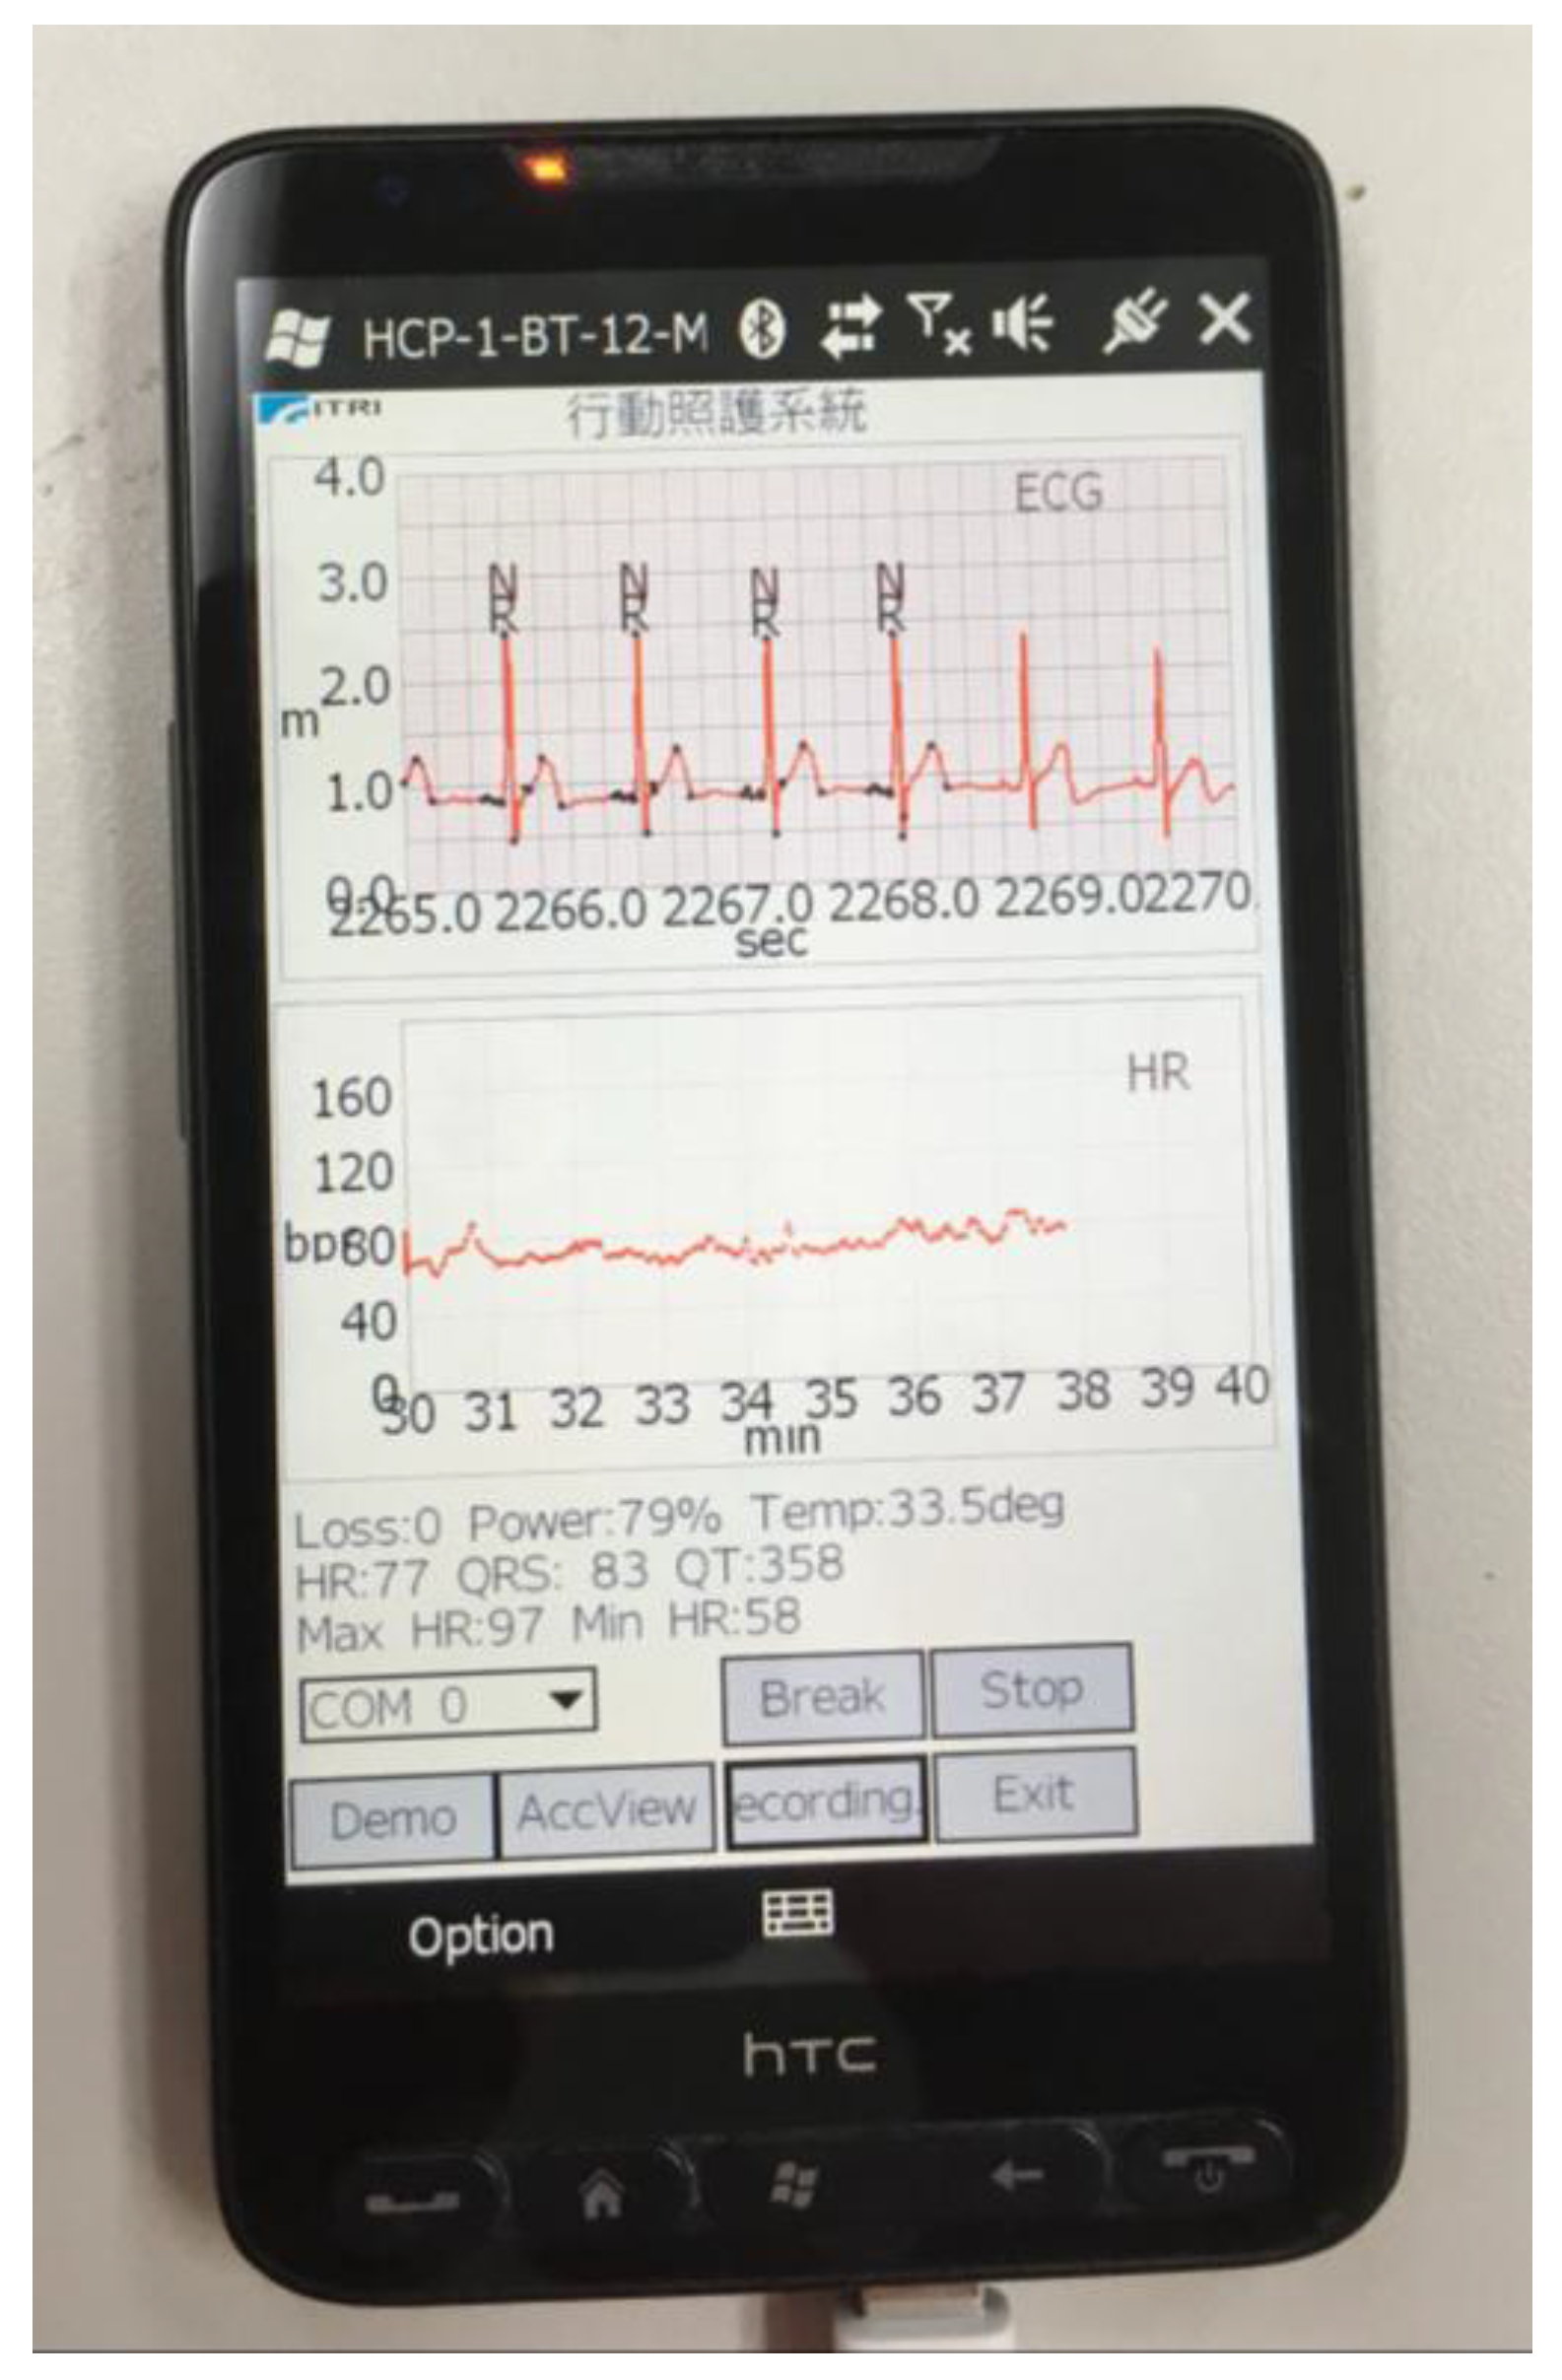
The algorithm has been implemented in a windows mobile phone for a mobile healthcare system and is shown in Figure 14. The mobile phone has a 528 MHz CPU and a Bluetooth module to receive the ECG signal from a wearable ECG patch with a 120 Hz sampling rate, where the ECG patch is developed by the Industrial Technology Research Institute (ITRI). In the system, the graphic user interface (GUI) and proposed algorithm are coded by Microsoft Visual C++. The average time cost of running the proposed algorithm in the mobile phone is less than 1 milliseconds. To verify the stability of the proposed algorithm, the implementation of daily ECG and heartrate monitoring are carried out as shown in Figure 15.
4.2. Implementation in an Embedded System
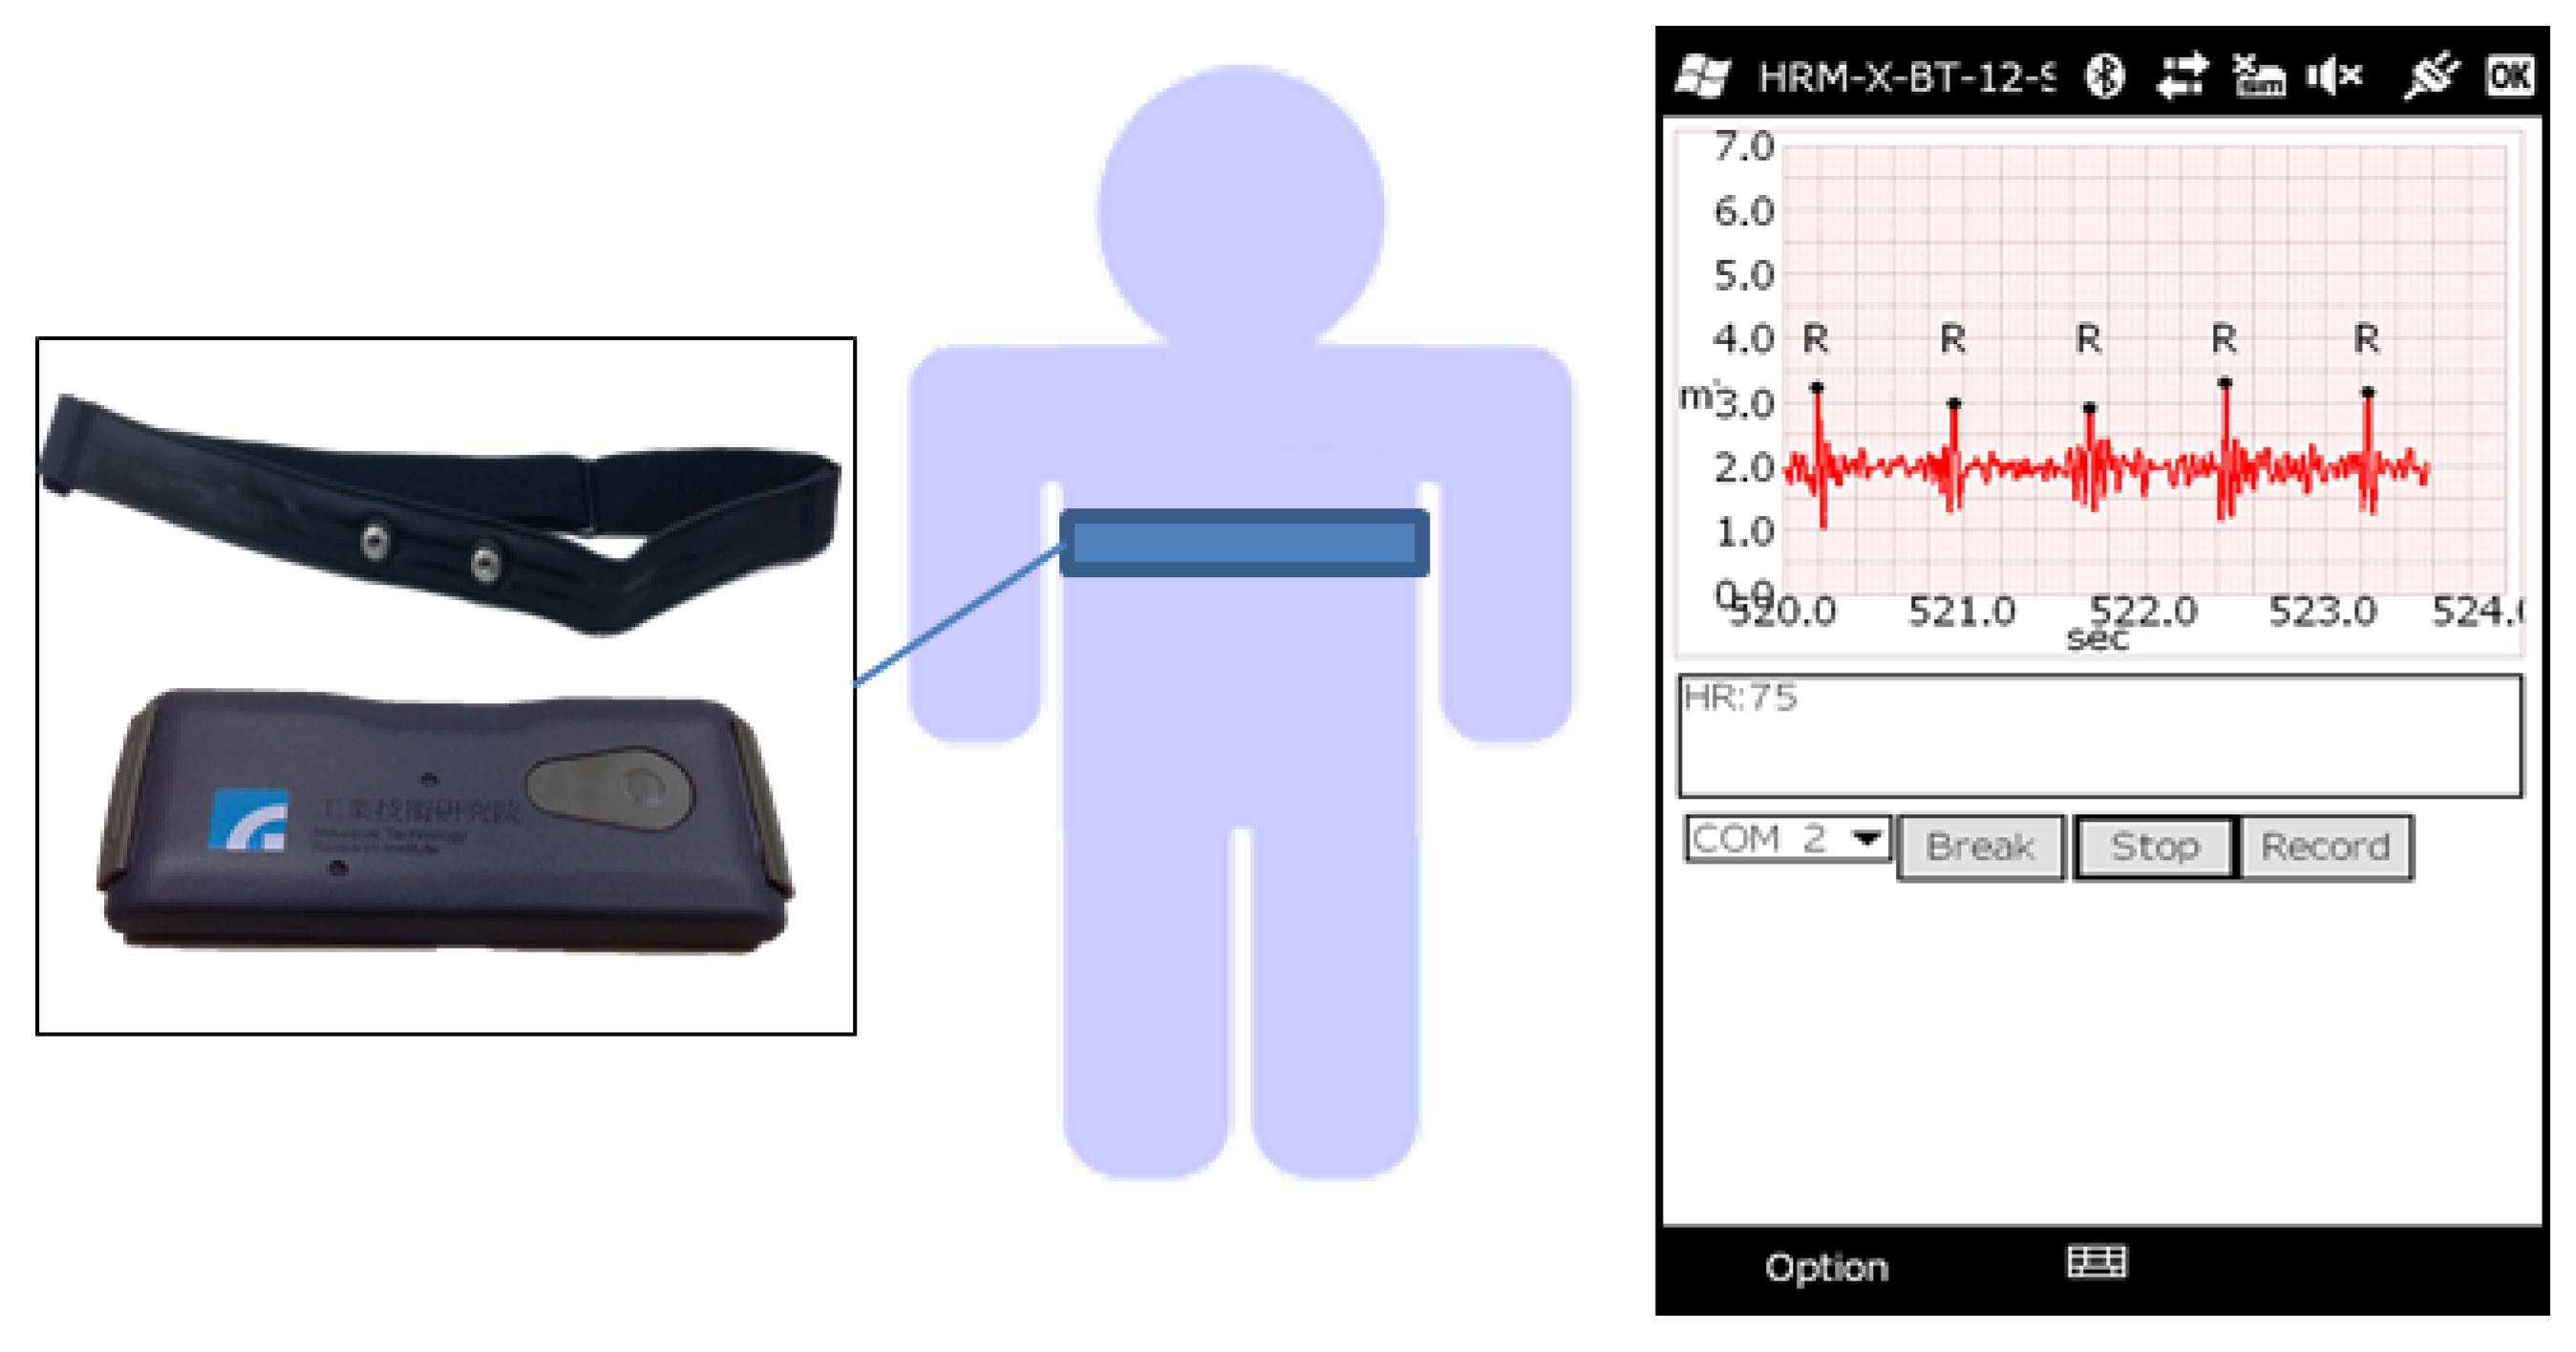
To implement the healthcare IoT system, an efficient and low computational complexity algorithm is necessary to reduce transition envelopes and save storage space. The proposed algorithm is implemented in a wearable heart rate sensor developed by ITRI, shown in Figure 16, which contains a Corex-M3 MCU running at a frequency of 24 MHz. The average time cost of running the proposed algorithm in the Cortex-M3 MCU is less than 10 milliseconds.
To demonstrate the resulting performance in a running activity, a market product of the Polar heart rate sensor [28] is used as an R-R interval (RRI) reference. There are 10 RRI data of 10 different persons running on the treadmill, which are collected by the proposed system and the Polar product at the same time. Figure 17 illustrates a good consistency between the results obtained by both systems. Table 4 shows that the max RRI difference is 2.3 ms and the average RRI difference of the 10 people is less than 1 ms, which demonstrates the flexibility of the proposed method to heart rate real-time detection.
4.3. A Study Case of Walking
The motion artifact issue has been taken into consideration in this study. The testing database, MIT-BIH arrhythmia database, was recorded from an ambulatory ECG device and the testing results using the proposed algorithm have been listed in Table 1 and Table 3. Furthermore, in our clinical study data using the wearable ECG device mentioned in the article, a study case of ‘walking’ is suitable to demonstrate the noise immunity of the proposed method.
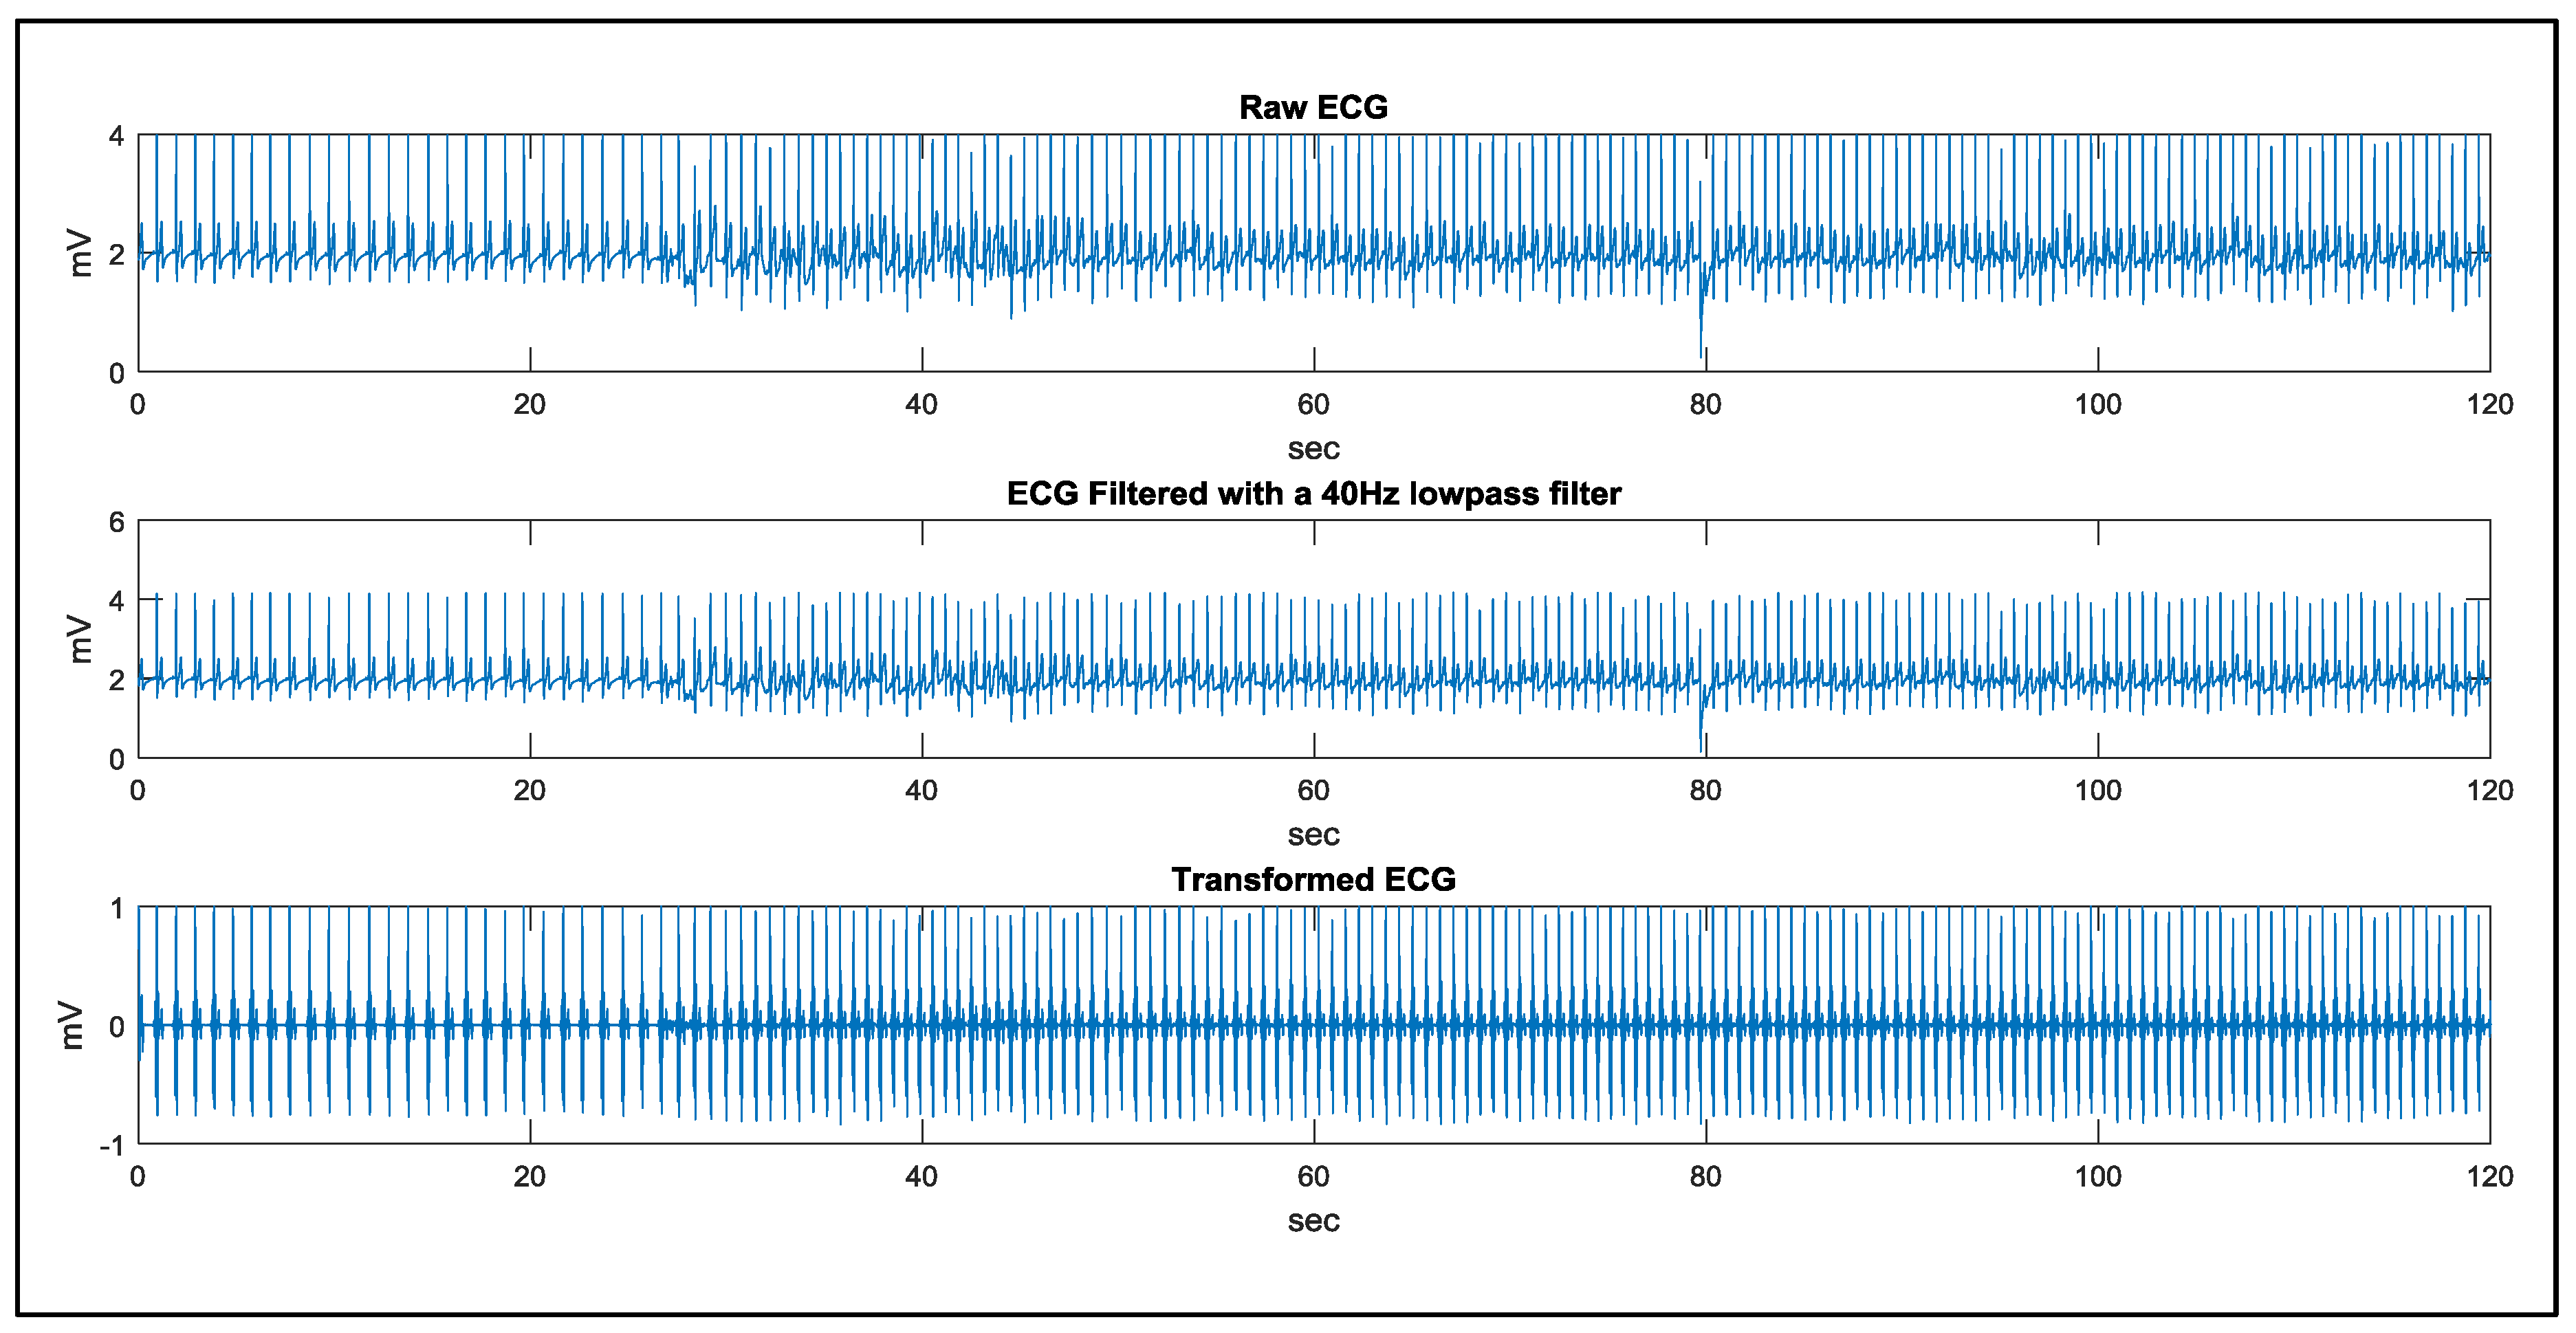
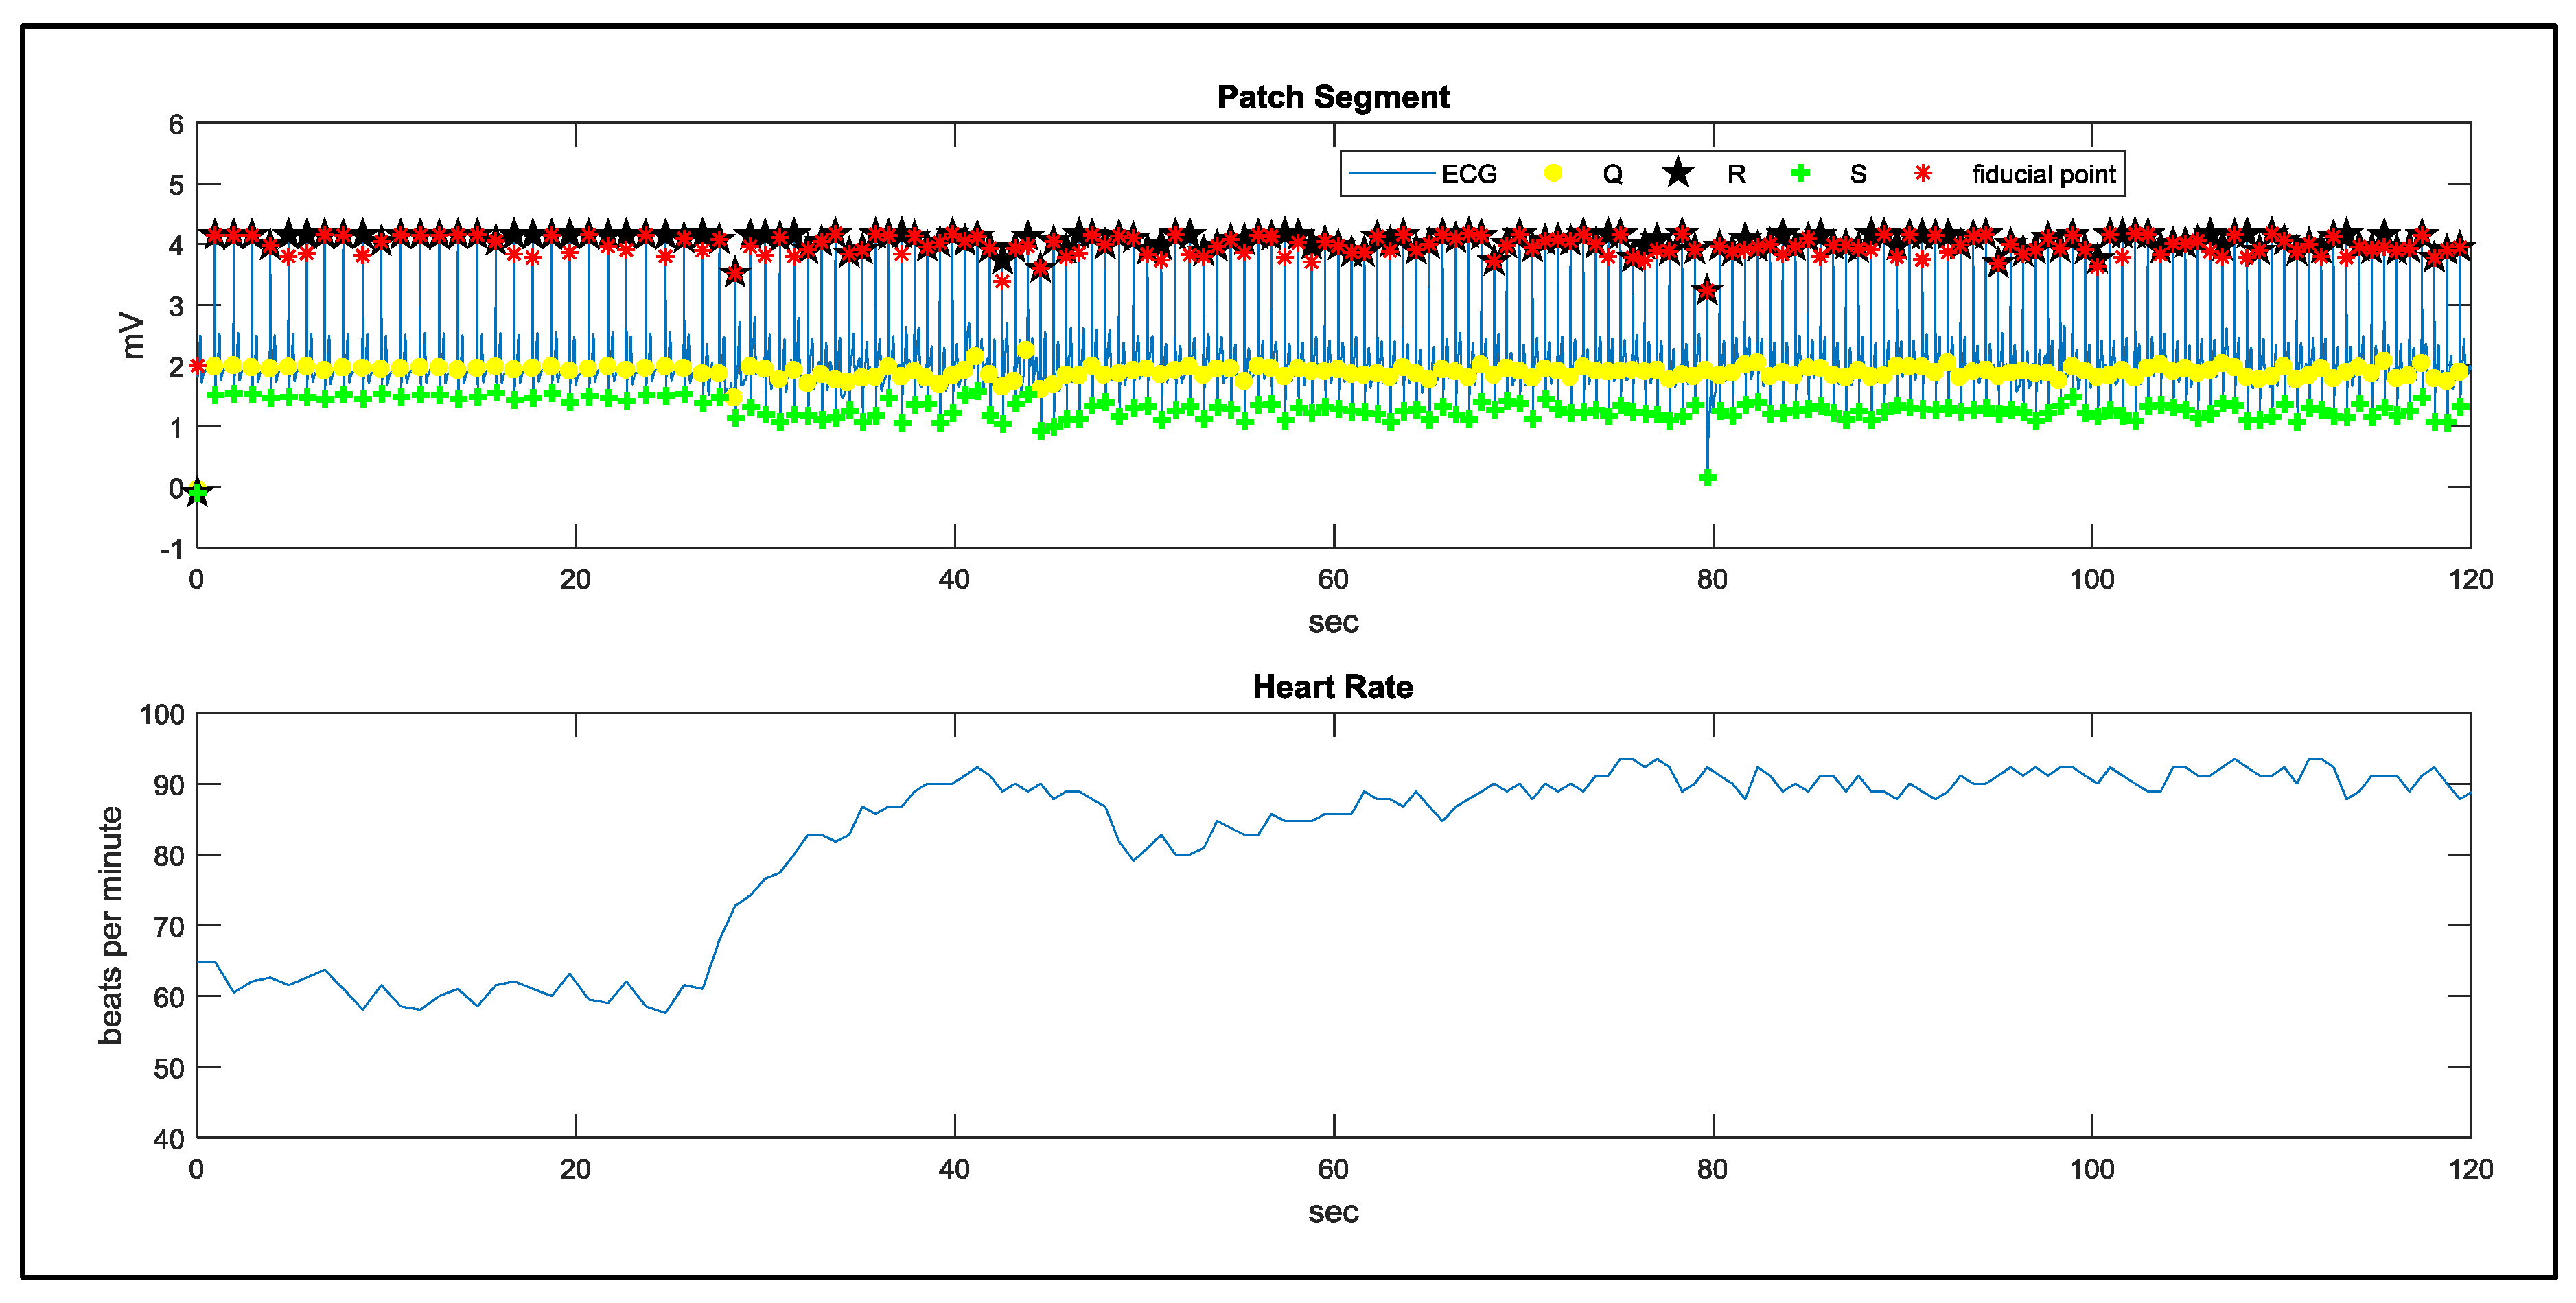
In the study case of walking, a man remains static in the first 20 s and starts walking in the following 100 s. The signal processing results using the proposed method are demonstrated in Figure 18 and Figure 19. The results of QRS detection, R point recognition, and the calculated heart rate curve are demonstrated in Figure 20. In order to evaluate the noise immunity of the proposed method, we have used the SNR improvement measure given by:
where denotes the clean ECG, is the denoised signal, and represents the noisy ECG [29]. In this study, we assign:
- : the filtered signal in static
- : the filtered signal in walking
- : the raw signal in walking
The average SNR improvement is around 3.53 dB. In practice, in order to avoid too much computing effort during the de-noise process, we also use a well-designed fixing mechanism to reduce the motion artifact, and the proposed algorithm is thus sufficient to process signals satisfactory for the 120 test clinical study.
5. Conclusions
A real-time QRS detection and R point recognition method for a wearable single lead ECG device was proposed, which consisted of a signal transform, QRS fiducial point detection, and R point recognition. The proposed method is robust and insensitive to baseline wandering, amplitude variation, and atypical QRS waveforms. Verification using the MIT-BIH arrhythmia benchmark demonstrates that the detected sensitivity (Se), positive prediction (+P), and detection error rate (DER) of the proposed method are as good as those reported during existing approaches. The motion artifact issue has been taken into consideration in this study. The testing database, MIT-BIH arrhythmia database, was recorded from an ambulatory ECG device and testing results using the proposed algorithm have been listed in Table 1 and Table 3. A study case of ‘walking’ is also demonstrated. In practice, in order to avoid too much computing effort during the de-noise process, we also use a well-designed fixing mechanism to reduce the motion artifact, and the proposed algorithm is thus sufficient to process signals satisfactory for the 120 test clinical study. In conclusion, the proposed method meets the requirement of real-time applications on a mobile phone or an embedded system for new-generation ECG devices, owing to its computational simplicity and efficiency. The real time performance of the proposed work is shown in Table 5, where implanted platforms with corresponding processing times are provided in detail. This work is the only one among the references in Table 3 that provides quantitative data as a benchmark for further studies.
Acknowledgments
Part of the work was support by the Ministry of Technology, Taiwan, under the grant No. 106-2218-E-006-004. The authors would also like to thank the Ministry of Economic Affairs (MOEA), Taiwan, for the financial support on this research under the contract B341AB7410 and G301AR1C10.
Author Contributions
Chieh-Li Chen and Chun-Te Chuang designed the algorithm and experiments; Chun-Te Chuang performed the experiments and analyzed the data; Chieh-Li Chen contributed to the algorithm revision. All authors read and approved the final manuscript.
Conflicts of Interest
The authors declare no conflict of interest. The founding sponsors had no role in the design of the study; in the collection, analyses, or interpretation of data; in the writing of the manuscript, and in the decision to publish the results.
References
- Android App for Patient Monitoring. Available online: https://www.amrita.edu/center/awna/research/patient-monitoring-app (accessed on 25 August 2017).
- Chen, H.; Liu, H. A remote electrocardiogram monitoring system with good swiftness and high reliability. Comput. Electr. Eng. 2016, 53, 191–202. [Google Scholar] [CrossRef]
- Madias, J.E. A proposal for monitoring patients with heart failure via “smart phone technology”-based electrocardiograms. J. Electrocardiol. 2016, 49, 699–706. [Google Scholar] [CrossRef] [PubMed]
- Take, Y.; Morita, H. Fragmented QRS: What is the meaning. Indian Pacing Electrophysiol. J. 2012, 12, 213–225. [Google Scholar] [CrossRef]
- Pan, J.; Tompkins, W.J. A real-time QRS detection algorithm. IEEE Trans. Biomed. Eng. 1985, BME-32P, 230–236. [Google Scholar] [CrossRef] [PubMed]
- Hamilton, P.S.; Tompkins, W.J. Quantitative investigation of QRS detection rules using the mit/bih arrhythmia database. IEEE Trans. Biomed. Eng. 1986, BME-33, 1157–1165. [Google Scholar] [CrossRef]
- Farashi, S. A multiresolution time-dependent entropy method for QRS complex detection. Biomed. Signal Process. Control 2016, 24, 63–71. [Google Scholar] [CrossRef]
- Phukpattaranont, P. QRS detection algorithm based on the quadratic filter. Expert Syst. Appli. 2015, 42, 4867–4877. [Google Scholar] [CrossRef]
- Manikandana, M.S.; Somanb, K.P. A novel method for detecting R-peaks in electrocardiogram (ECG) signal. Biomed. Signal Process Control 2012, 7, 118–128. [Google Scholar] [CrossRef]
- Zhu, H.; Dong, J. An R-peak detection method based on peaks of Shannon energy envelope. Biomed. Signal Process. Control 2013, 8, 466–474. [Google Scholar] [CrossRef]
- Yochuma, M.; Renaudb, C.; Jacquira, S. Automatic detection of P, QRS and T patterns in 12 leads ECG signal based on CWT. Biomed. Signal Process. Control 2016, 25, 46–52. [Google Scholar] [CrossRef] [Green Version]
- Meraha, M.; Abdelmalika, T.A.; Larbi, B.H. R-peaks detection based on stationary wavelet transform. Comput. Methods Progr. Biomed. 2015, 121, 149–160. [Google Scholar] [CrossRef] [PubMed]
- Madeiro, J.P.V.; Cortez, P.C.; Marques, J.A.L.; Seisdedos, C.R.V.; Sobrinho, C.R.M.R. An innovative approach of QRS segmentation based on first-derivative, Hilbert and Wavelet Transforms. Med. Eng. Phys. 2012, 34, 1236–1246. [Google Scholar] [CrossRef] [PubMed]
- Christov, I.I. Real time electrocardiogram QRS detection using combined adaptive threshold. Biomed. Eng. OnLine 2004, 3, 1–9. [Google Scholar] [CrossRef] [PubMed] [Green Version]
- Karimipour, A.; Homaeinezhad, M.R. Real-time electrocardiogram P-QRS-T detection–delineation algorithm based on quality-supported analysis of characteristic templates. Comput. Biol. Med. 2014, 52, 153–165. [Google Scholar] [CrossRef] [PubMed]
- Jain, S.; Ahirwal, M.K.; Kumar, A.; Bajaj, V.; Singh, G.K. QRS detection using adaptive filters: A comparative study. ISA Trans. 2017, 66, 362–375. [Google Scholar] [CrossRef]
- Dohare, A.K.; Kumar, V.; Kumar, R. An efficient new method for the detection of QRS in electrocardiogram. Comput. Electr. Eng. 2014, 40, 1717–1730. [Google Scholar] [CrossRef]
- Sharma, L.D.; Sunkaria, R.K. A robust QRS detection using novel pre-processing techniques and kurtosis based enhanced efficiency. Measurement 2016, 87, 194–204. [Google Scholar] [CrossRef]
- Kuzilek, J.; Lhotska, L. Electrocardiogram beat detection enhancement using Independent Component Analysis. Med. Eng. Phys. 2013, 35, 704–711. [Google Scholar] [CrossRef] [PubMed]
- Tafreshi, R.; Jaleel, A.; Lim, J.; Tafreshi, L. Automated analysis of ECG waveforms with atypical QRS complex morphologies. Biomed. Signal Process. Control 2014, 10, 41–49. [Google Scholar] [CrossRef]
- Yazdani, S.; Vesin, J.M. Extraction of QRS fiducial points from the ECG using adaptive mathematical morphology. Digit. Signal Process. 2016, 56, 100–109. [Google Scholar] [CrossRef]
- Moody, G.B.; Mark, R.G. The impact of the MIT-BIH arrhythmia database. IEEE Eng. Med. Biol. Mag. 2001, 20, 45–50. [Google Scholar] [CrossRef] [PubMed]
- American National Standard ANSI/AAMI EC 57:2012, Testing and Reporting Performance Results of Cardiac Rhythm and ST-Segment Measurement Algorithms. Available online: https://webstore.ansi.org/RecordDetail.aspx?sku=CARDIO+MEDICAL+DEVICE+PACKAGE (accessed on 25 August 2017).
- The WFDB Software Package. Available online: https://www.physionet.org/physiotools/wfdb.shtml (accessed on 25 August 2017).
- Castells-Rufas, D.; Carrabina, J. Simple real-time QRS detector with the MaMeMi filter. Biomed. Signal Process. Control 2015, 21, 137–145. [Google Scholar] [CrossRef]
- Kim, J.; Shin, H. Simple and Robust Realtime QRS Detection Algorithm Based on Spatiotemporal CCharacteristic of the QRS Complex. Available online: https://doi.org/10.1371/journal.pone.0150144 (accessed on 25 August 2017).
- Benitez, D.S.; Gaydecki, P.A.; Zaidi, A.; Fitzpatrick, A.P. A New QRS Detection Algorithm Based on the Hilbert Transform. In Proceedings of the Computers in Cardiology 2000, Cambridge, MA, USA, 24–27 September 2000; pp. 379–382. [Google Scholar]
- Polar Heart Rate Sensor. Available online: https://www.polar.com/uken/products/accessories//h10_heart_rate_sensor (accessed on 25 August 2017).
- Moradi, M.H.; Ashoori Rad, M.; Khezerloo, R.B. ECG signal enhancement using adaptive Kalman filter and signal averaging. Int. J. Cardiol. 2014, 173, 553–555. [Google Scholar] [CrossRef] [PubMed]
Figure 1.
Mobile healthcare system.

Figure 2.
Typical ECG waveform of a cardia cycle (normal sinus rhythm in Lead II).

Figure 3.
The procedures of the proposed real-time QRS detection and R point recognition method.
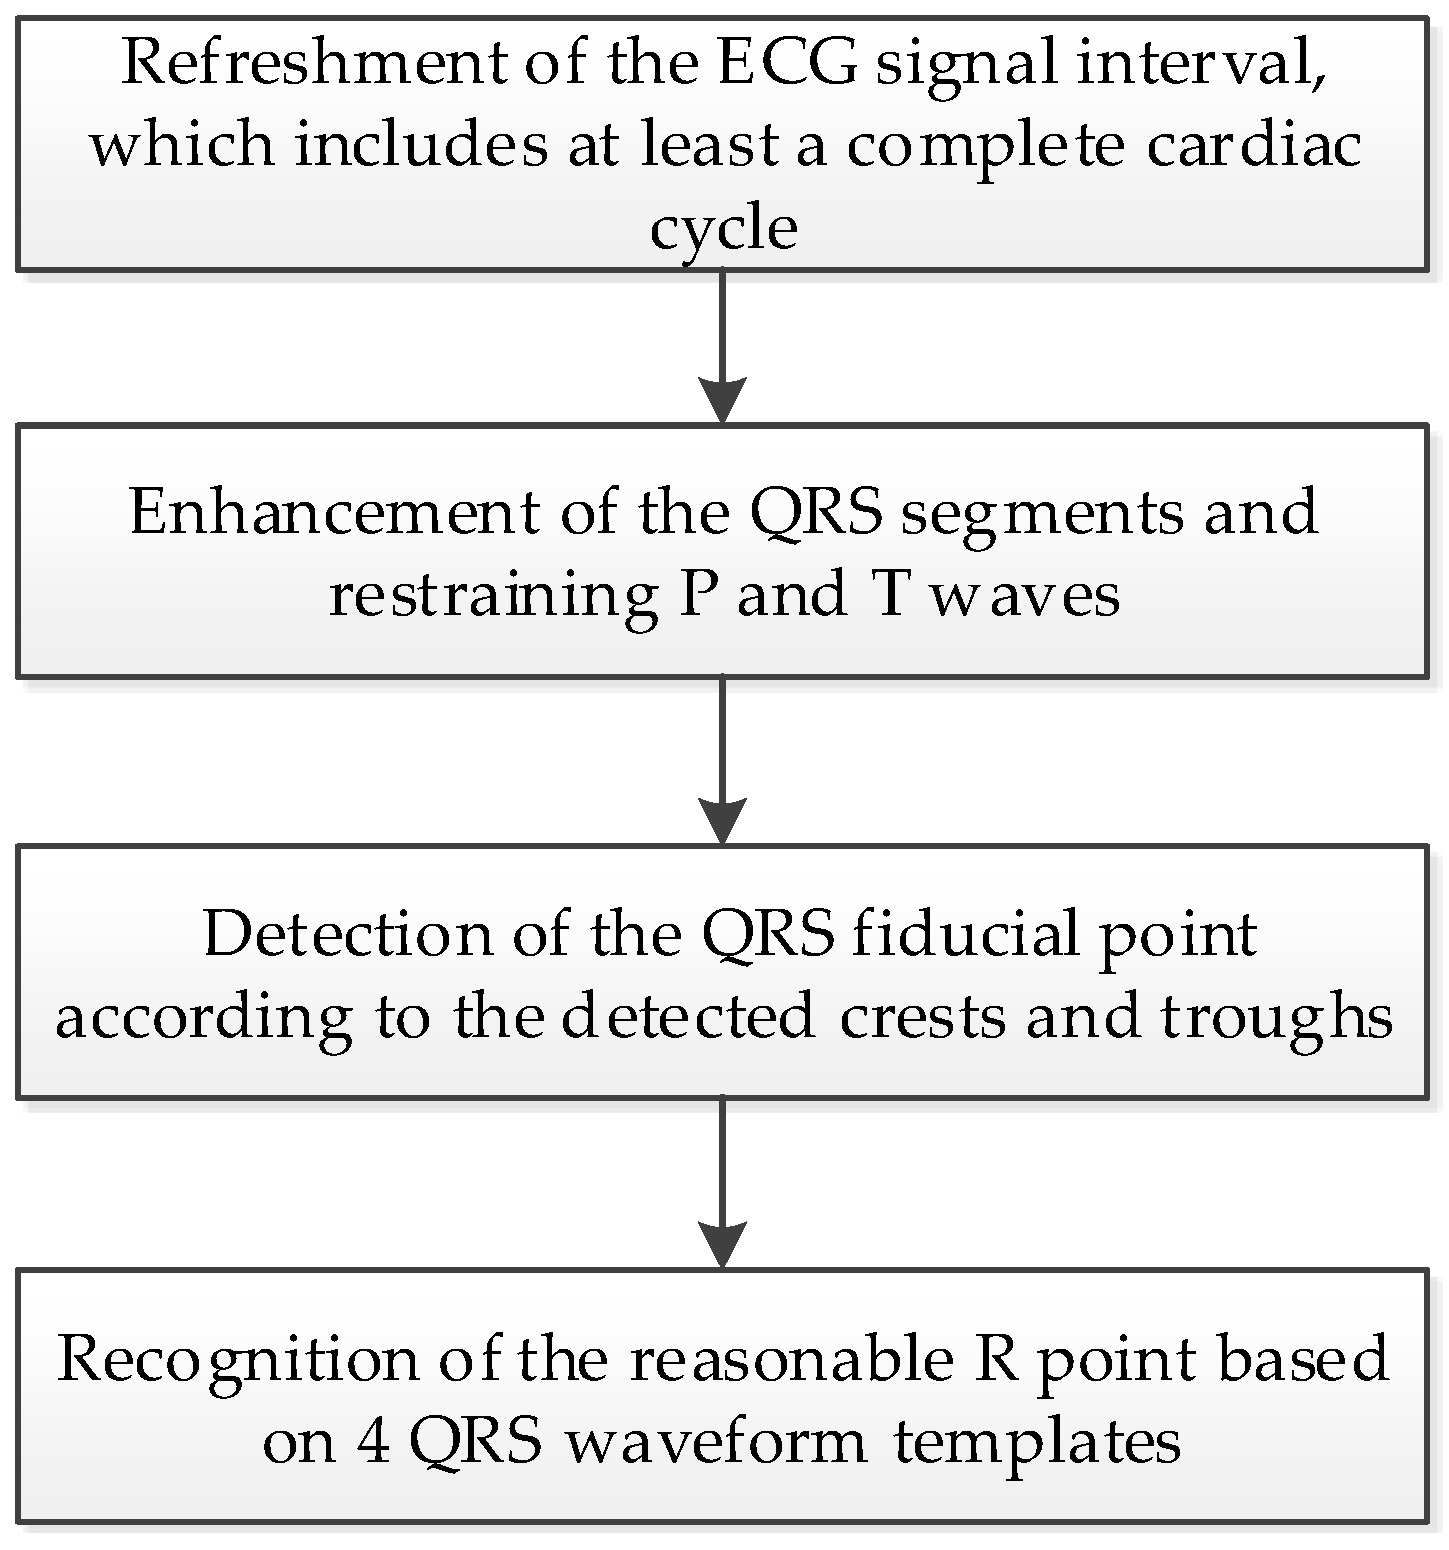
Figure 4.
ECG signal refreshment.

Figure 5.
Signal transform procedure.

Figure 6.
Signal enhancement using the proposed transformation. (a) Filtered ECG signal of the Record 114 segment; (b) Transformed signal of the Record 114 segment by the proposed transformation; (c) Filtered ECG signal of the Record 108 segment; (d) Transformed signal of the Record 108 segment by the proposed transformation; (e) Filtered ECG signal of the Record 111 segment; (f) Transformed signal of the Record 111 segment by the proposed transformation.

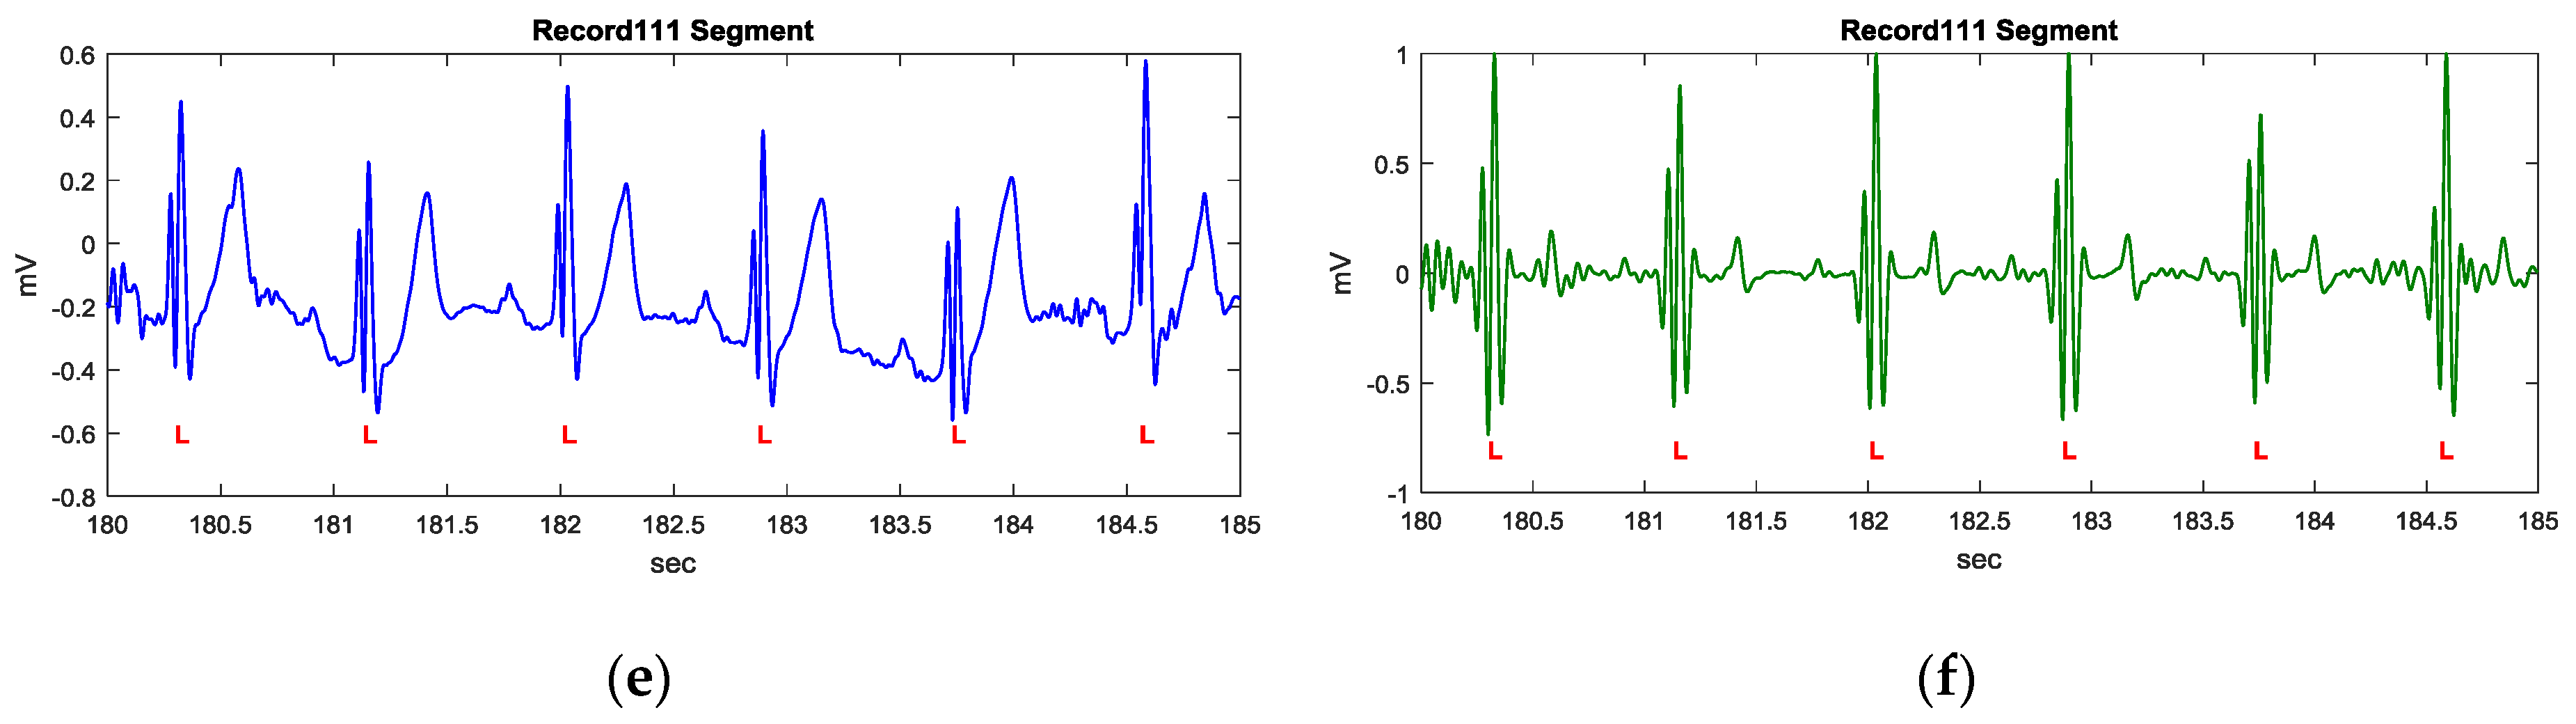
Figure 7.
The proposed procedure of detecting the QRS fiducial point.
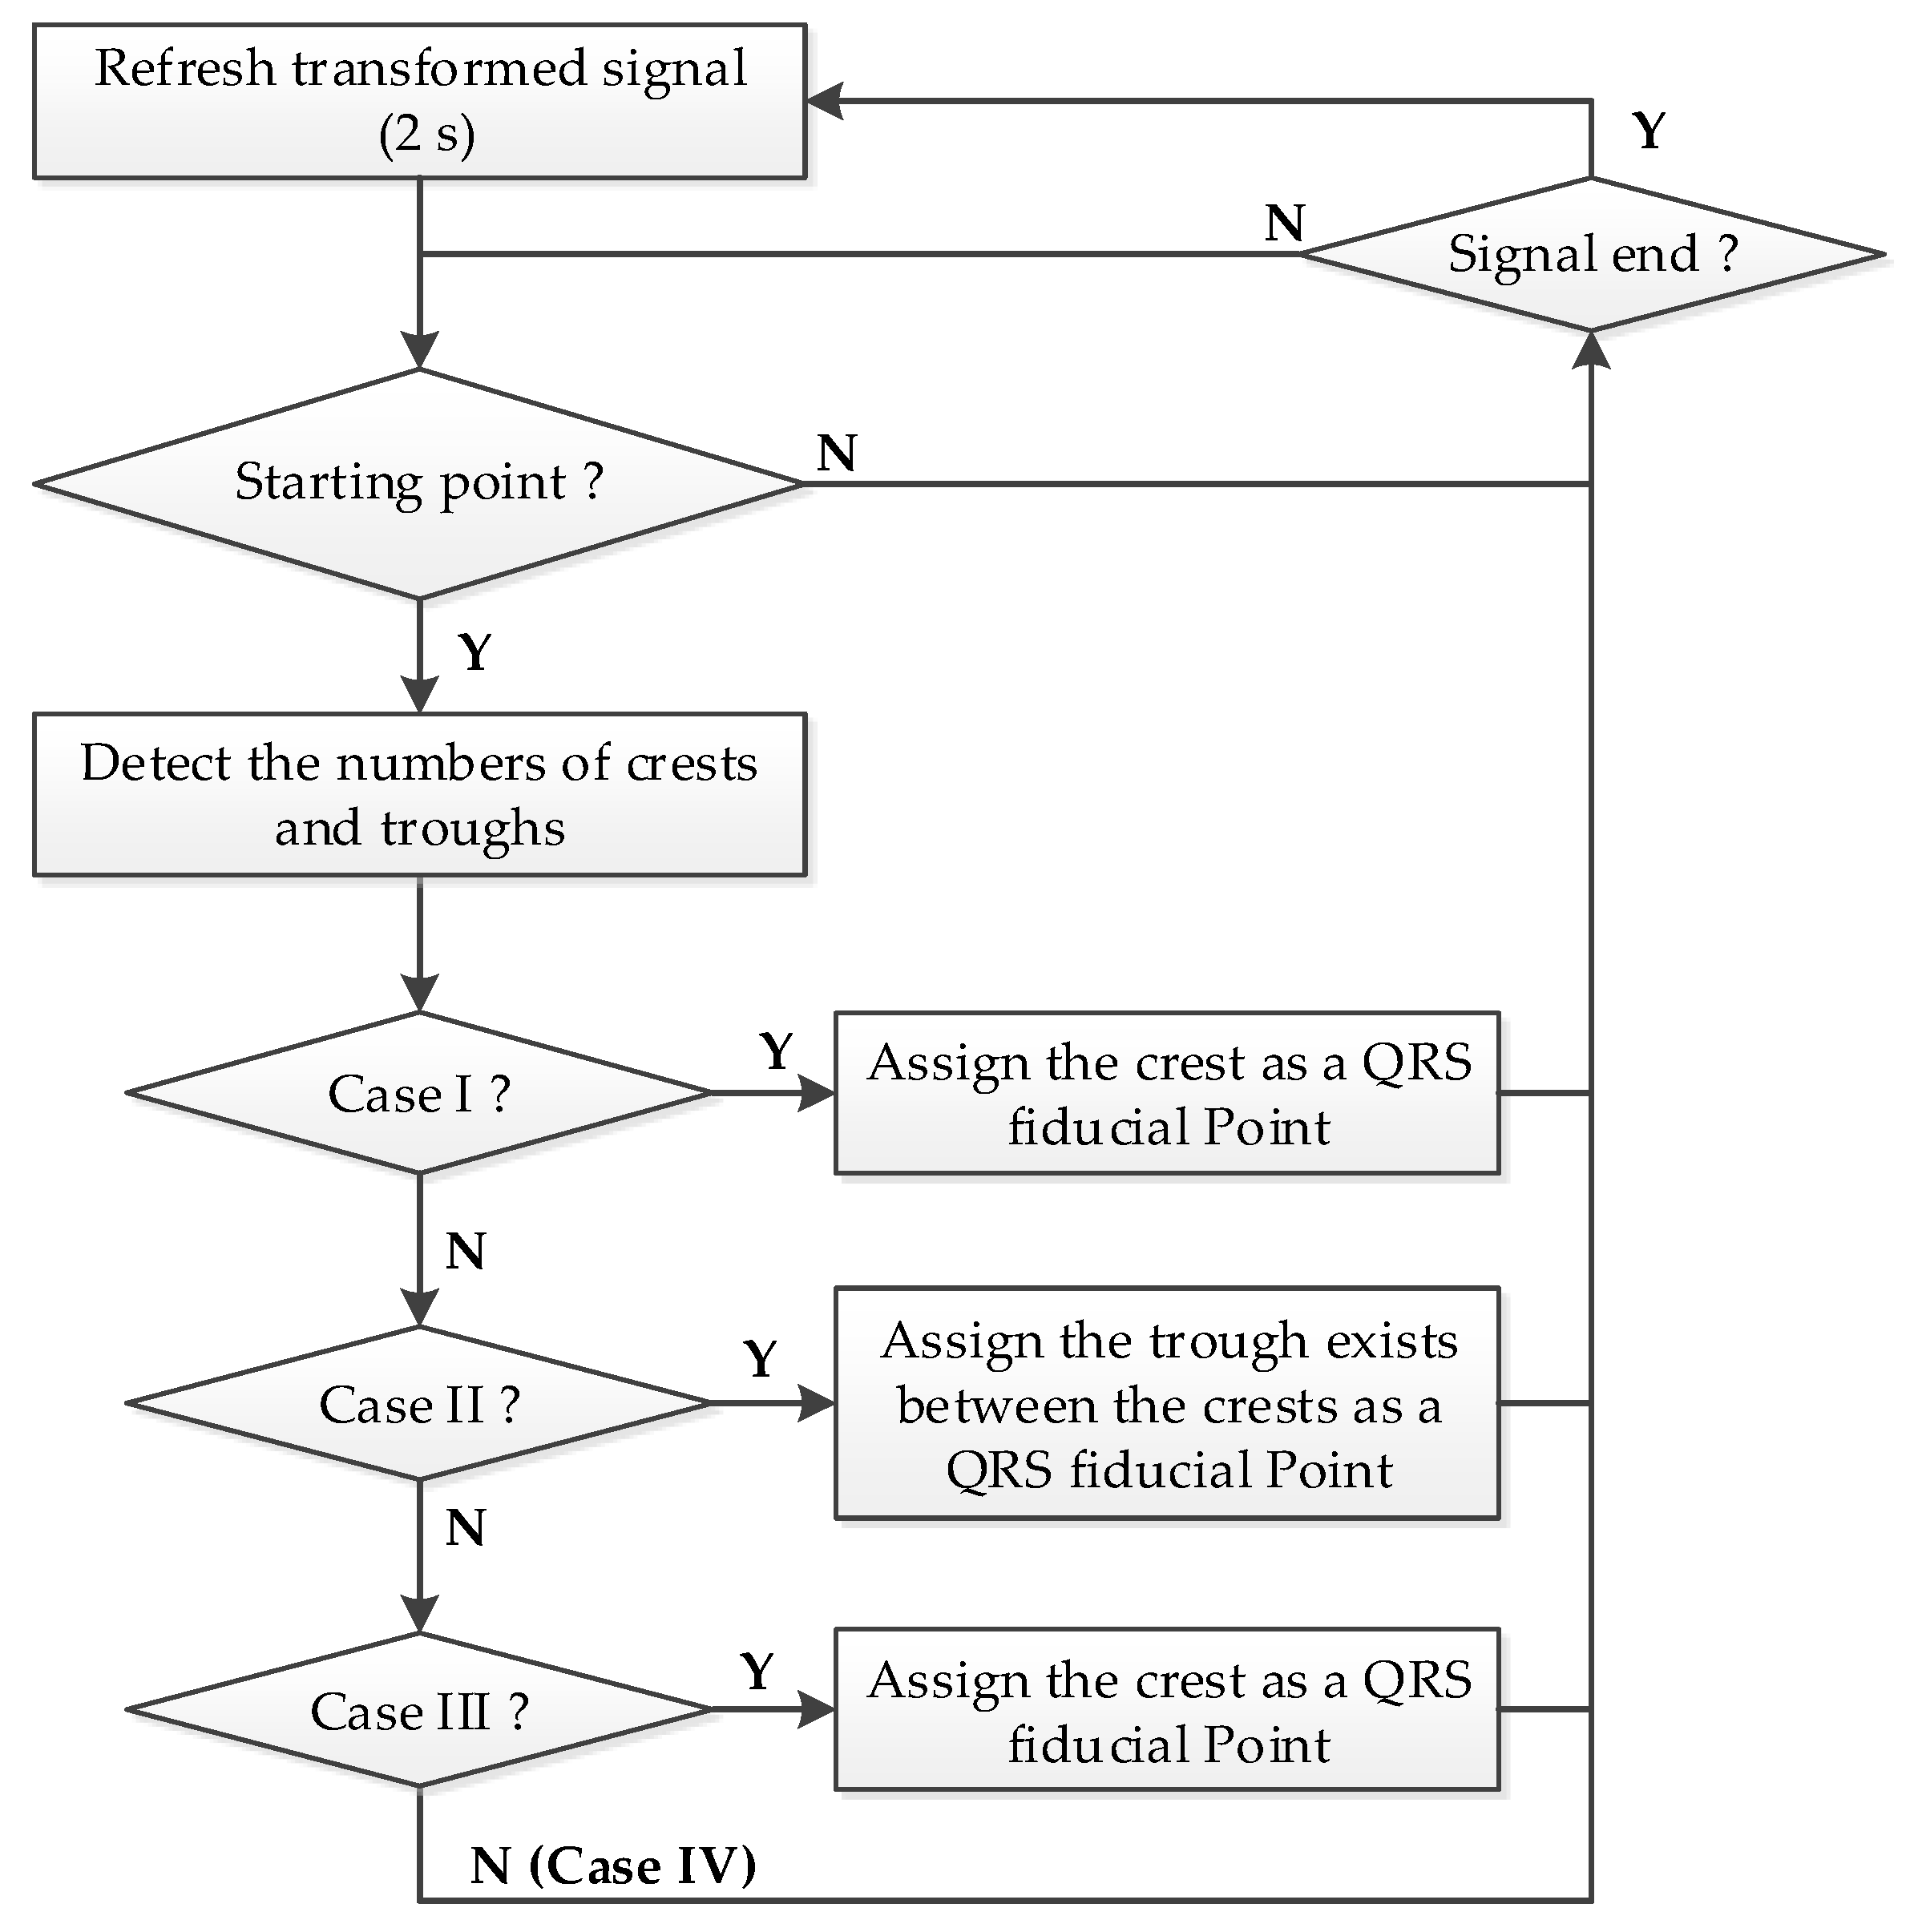
Figure 8.
The demonstration of QRS fiducial point detection for the Record 114 segment.

Figure 9.
The demonstration of QRS fiducial point detection for the Record 108 segment.

Figure 10.
The demonstration of QRS fiducial point detection for the Record 111 segment.

Figure 11.
QRS waveform templates of four desired recognition features: (a) normal QRS waveform; (b) fork-like crests; (c) deep S wave with small R wave; (d) deep S wave with tiny or hidden R wave.
Figure 11.
QRS waveform templates of four desired recognition features: (a) normal QRS waveform; (b) fork-like crests; (c) deep S wave with small R wave; (d) deep S wave with tiny or hidden R wave.

Figure 12.
The detected QRS fiducial points and R points using the proposed method: (a) recognized feature points for the Record 114 segment; (b) recognized feature points for the Record 108 segment; (c) recognized feature points for the Record 111 segment.
Figure 12.
The detected QRS fiducial points and R points using the proposed method: (a) recognized feature points for the Record 114 segment; (b) recognized feature points for the Record 108 segment; (c) recognized feature points for the Record 111 segment.
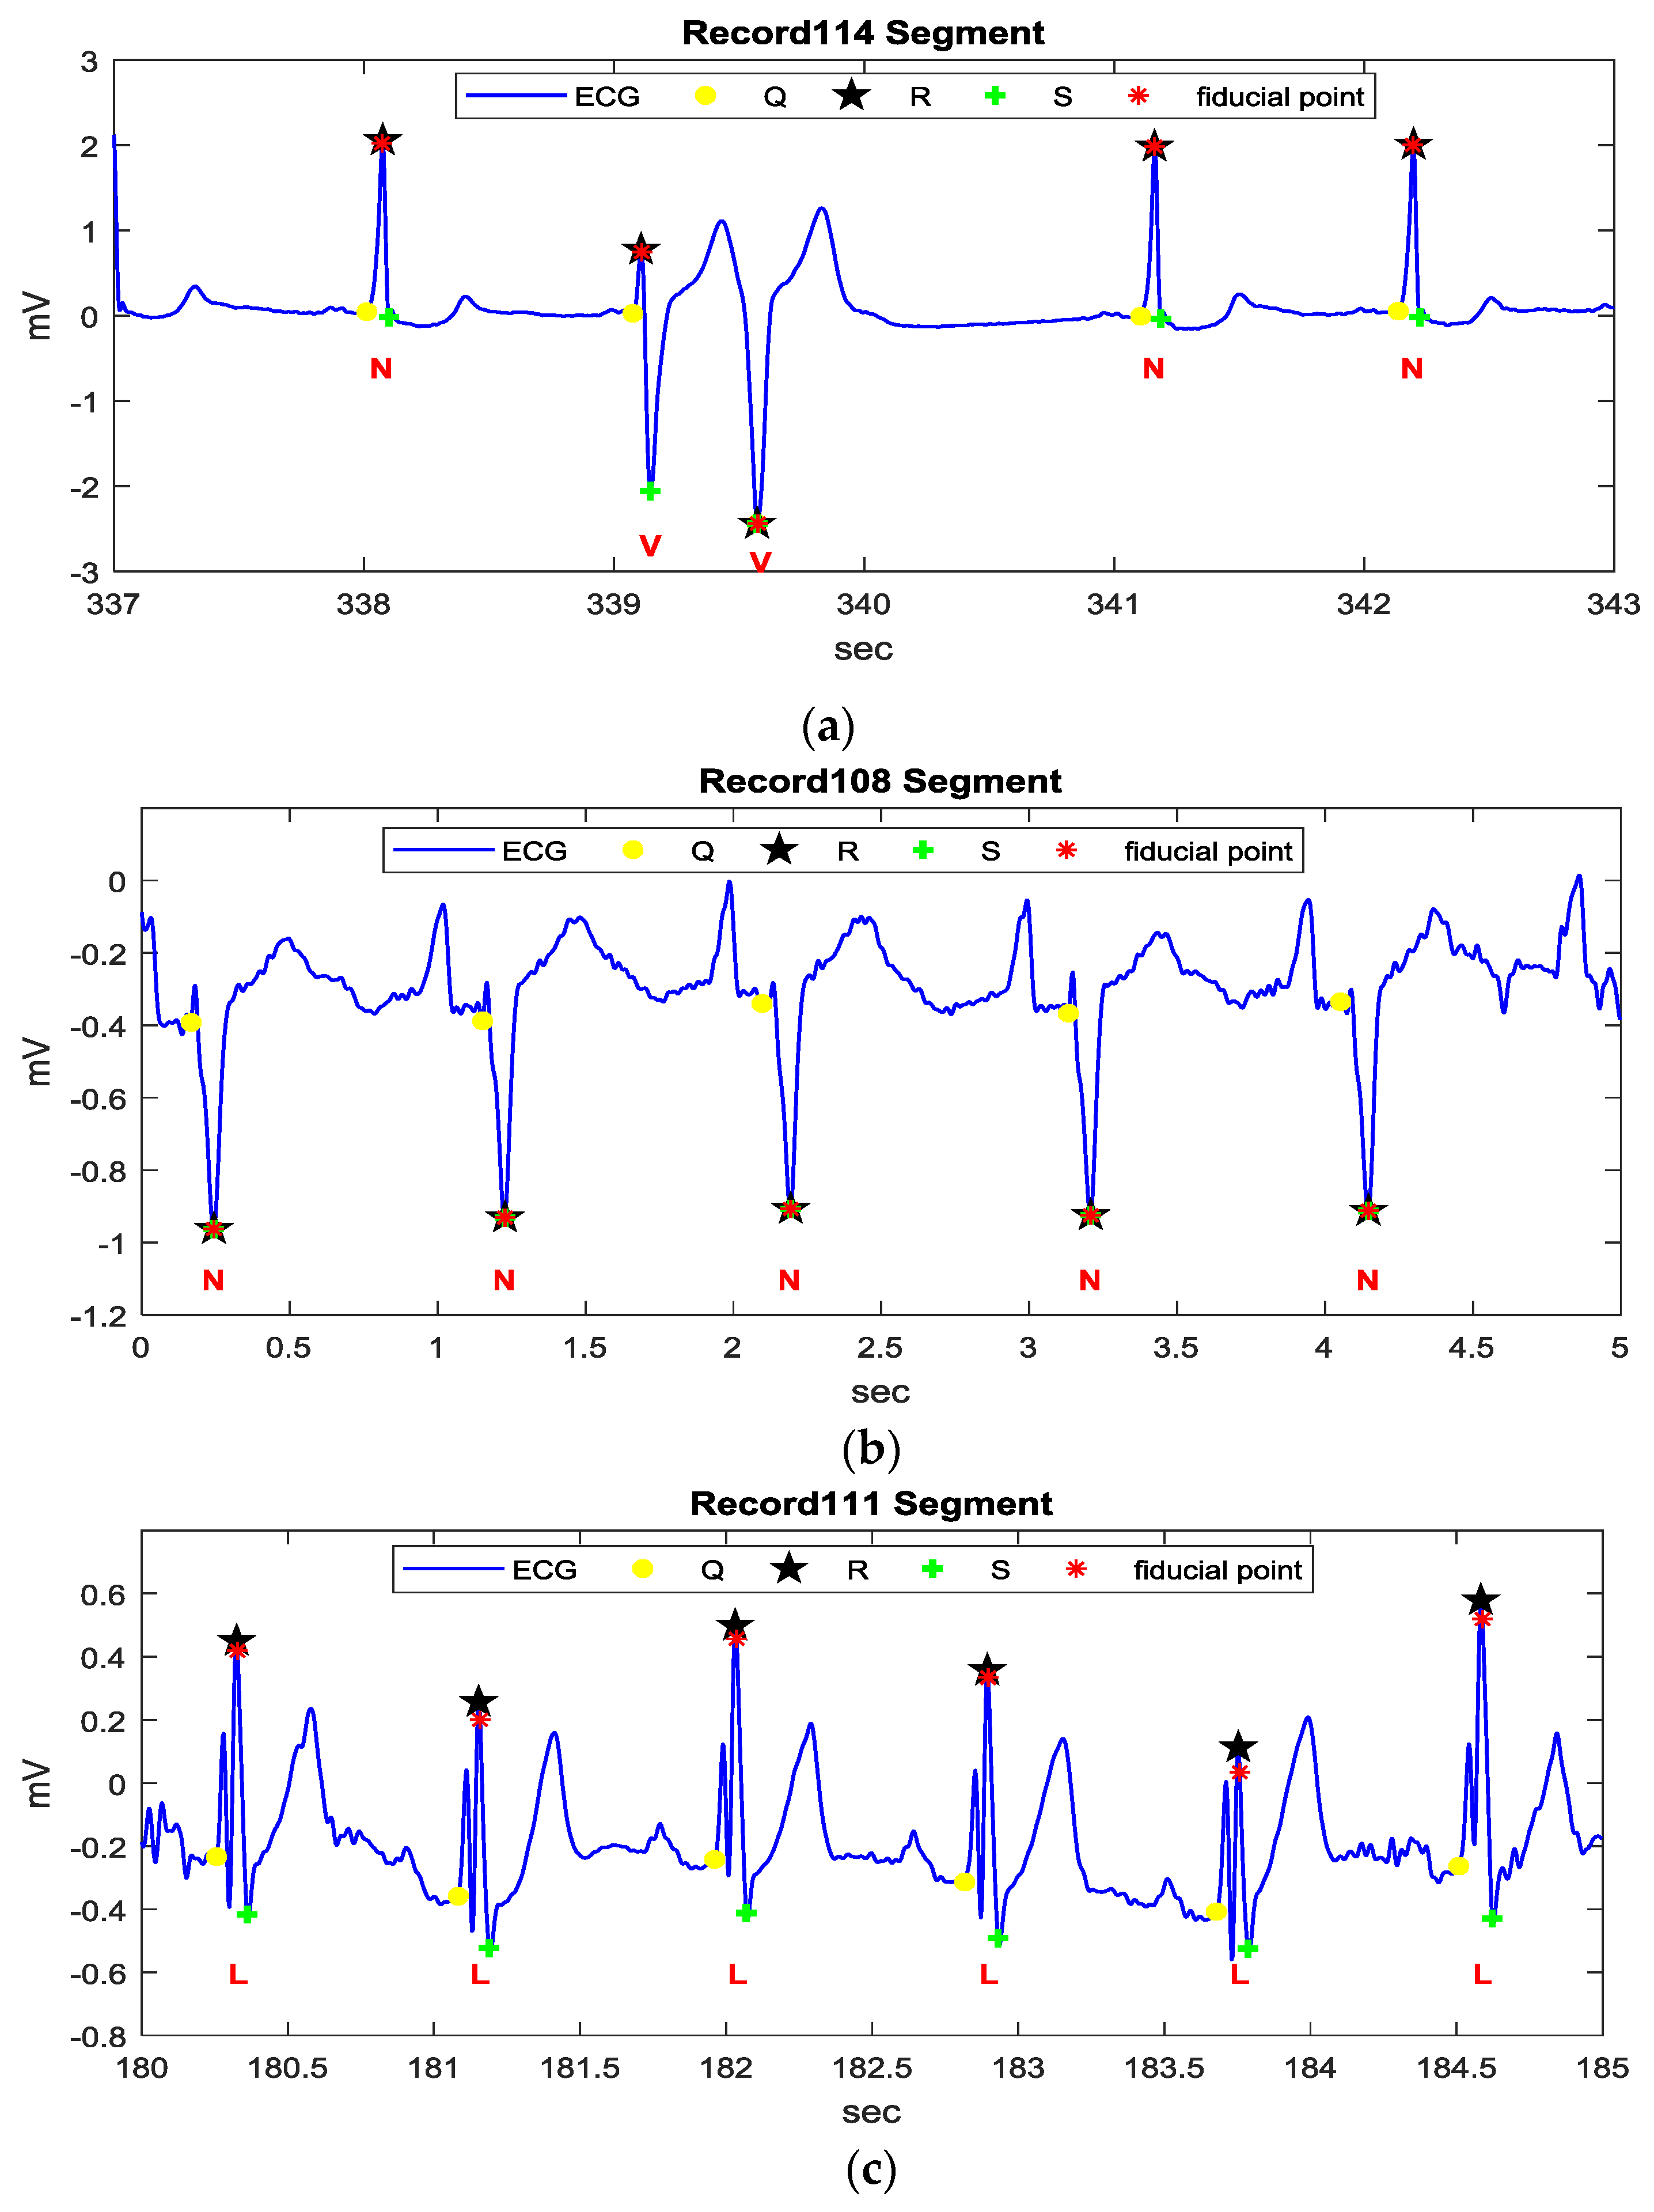
Figure 13.
The time cost for processing each two-second length ECG signal: (a) Time cost of each processing in Record 114; (b) Time cost of each processing in Record 108; (c) Time cost of each processing in Record 111.
Figure 13.
The time cost for processing each two-second length ECG signal: (a) Time cost of each processing in Record 114; (b) Time cost of each processing in Record 108; (c) Time cost of each processing in Record 111.


Figure 14.
The graphic user interface and algorithm implementation for a mobile healthcare system.

Figure 15.
Implementation of daily ECG and heartrate monitoring using the proposed algorithm.

Figure 16.
The algorithm implementation in a wearable heart rate sensor.

Figure 17.
A sample R-R Interval curves.
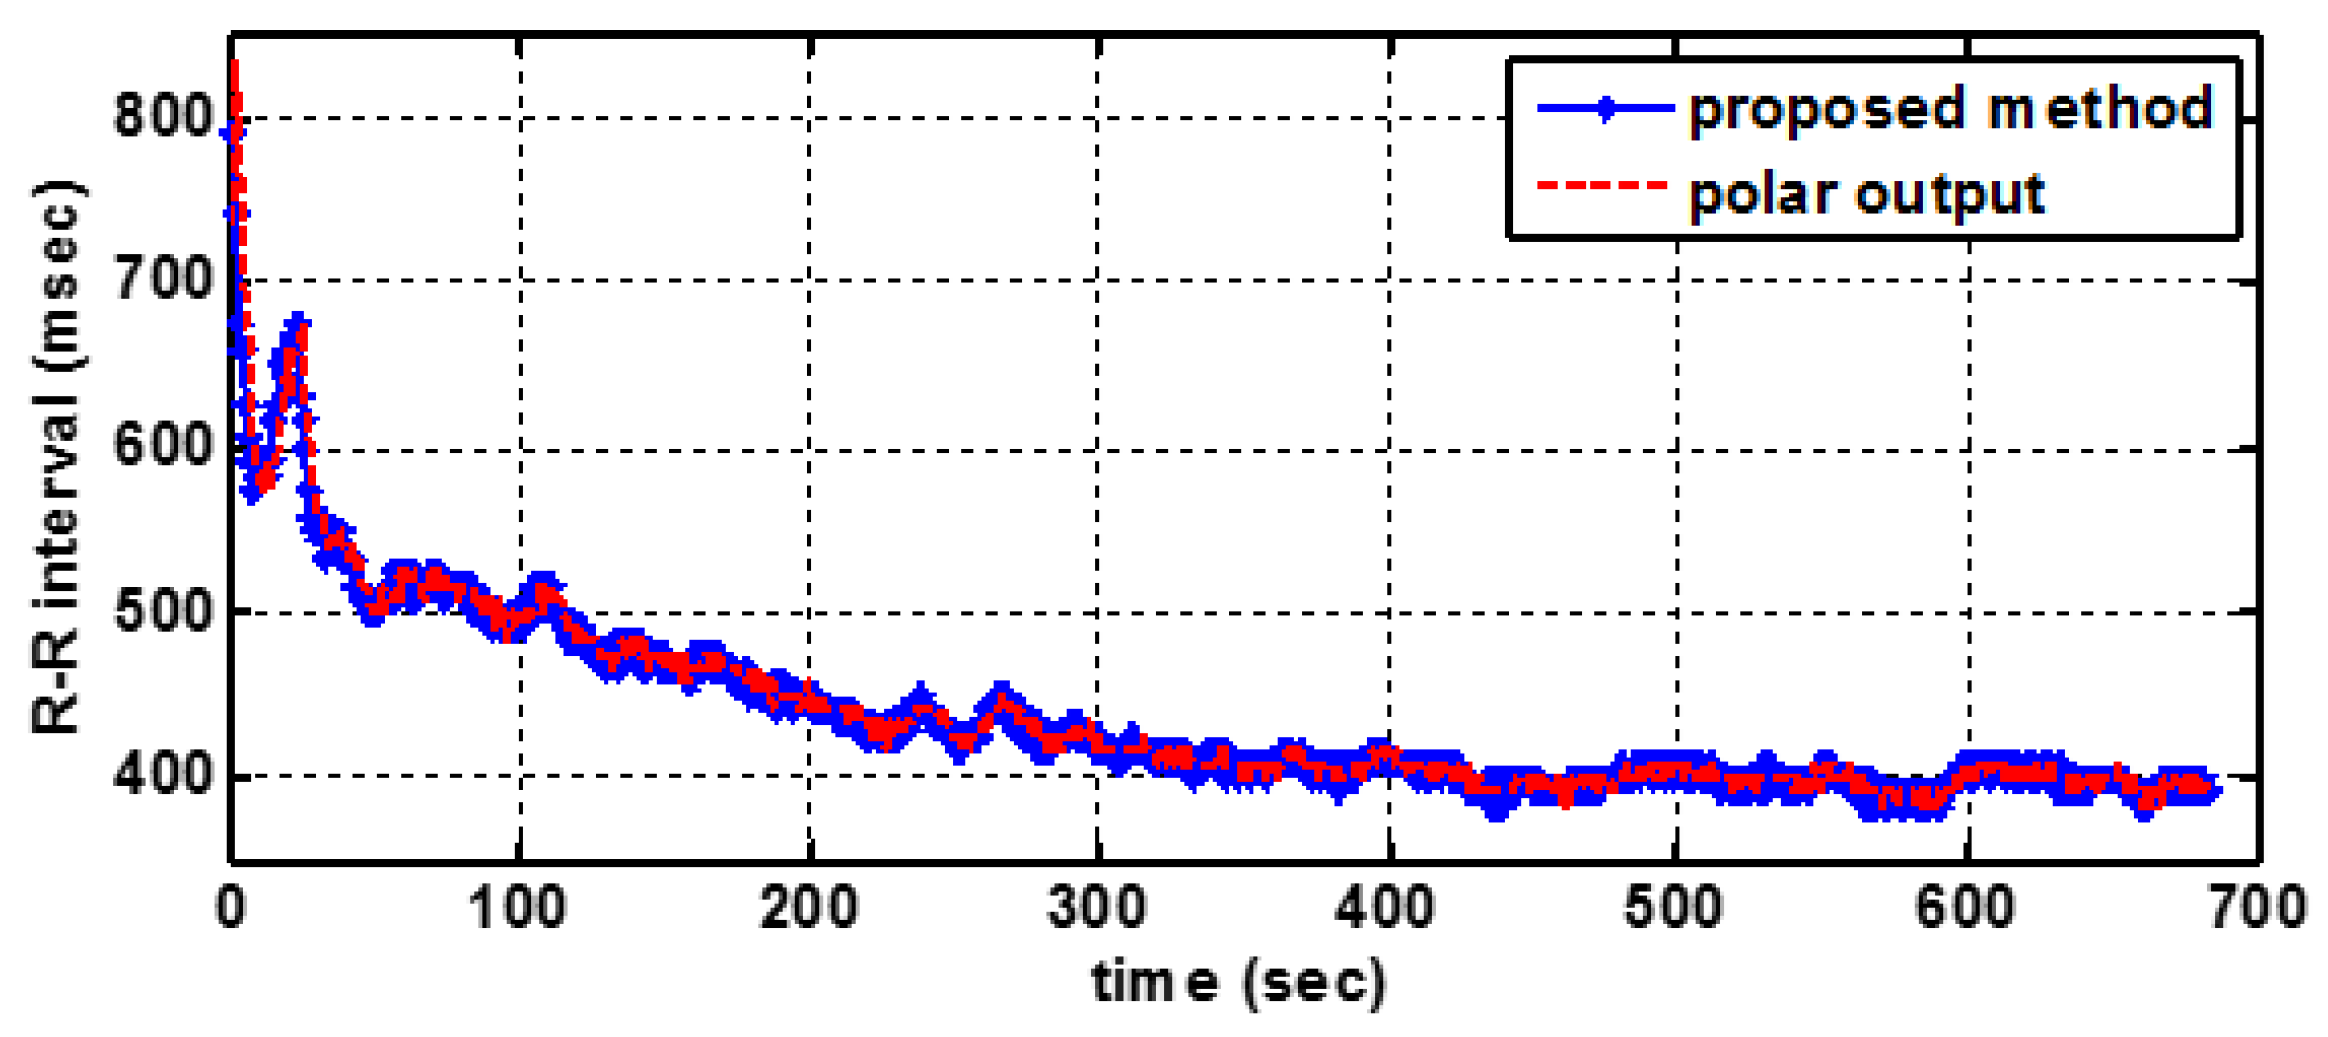
Figure 18.
The algorithm implementation in a wearable heart rate sensor.

Figure 19.
The signal processing results from 15 to 40 s.
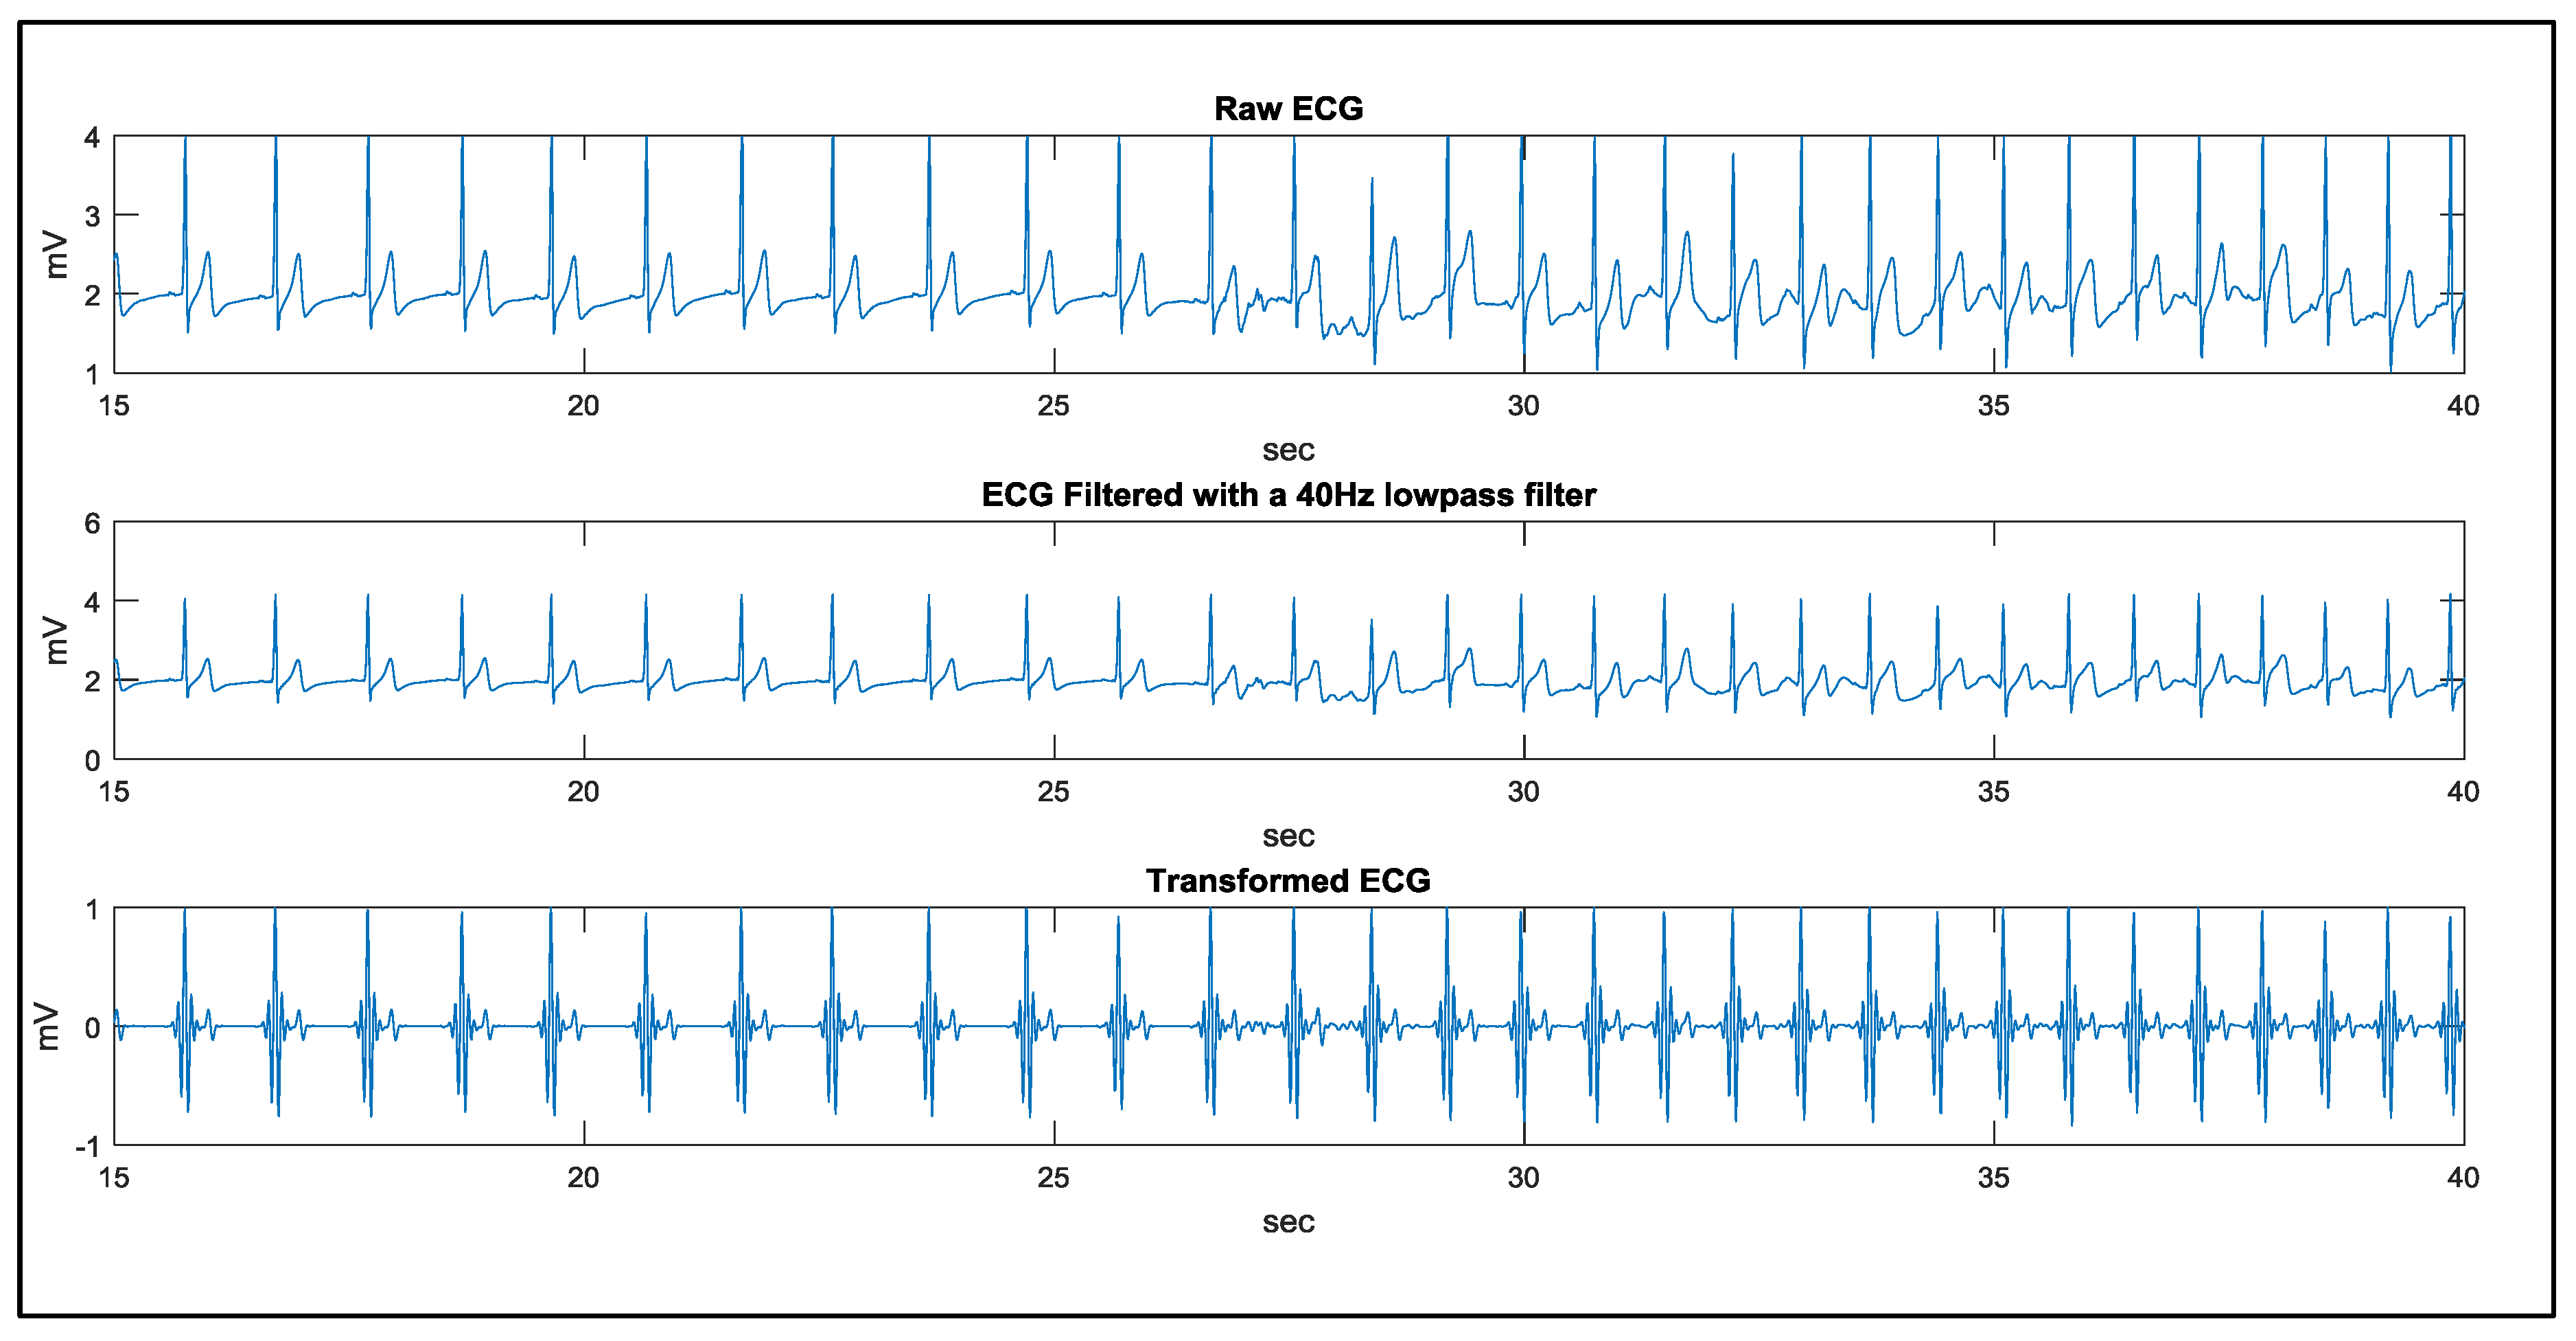
Figure 20.
The results of QRS detection, R point recognition, and heart rate curve.


Table 1.
Performance of the proposed method using the single channel of the MIT-BIH arrhythmia database.
Table 1.
Performance of the proposed method using the single channel of the MIT-BIH arrhythmia database.
| No. | Lead | Se% | +P% | DER% | TB | FN | FP |
|---|---|---|---|---|---|---|---|
| 100 | MLII | 100.00 | 100.00 | 0.00 | 2271 | 0 | 0 |
| 101 | MLII | 99.89 | 99.79 | 0.32 | 1864 | 2 | 4 |
| 102 | V5 | 100.00 | 100.00 | 0.00 | 2186 | 0 | 0 |
| 103 | MLII | 100.00 | 100.00 | 0.00 | 2083 | 0 | 0 |
| 104 | V5 | 99.64 | 99.11 | 1.25 | 2228 | 8 | 20 |
| 105 | MLII | 99.53 | 98.84 | 1.61 | 2571 | 12 | 30 |
| 106 | MLII | 100.00 | 99.95 | 0.05 | 2026 | 0 | 1 |
| 107 | MLII | 99.81 | 100.00 | 0.19 | 2136 | 4 | 0 |
| 108 | MLII | 99.38 | 98.21 | 2.40 | 1762 | 11 | 32 |
| 109 | MLII | 99.92 | 100.00 | 0.08 | 2531 | 2 | 0 |
| 111 | MLII | 99.95 | 99.91 | 0.14 | 2123 | 1 | 2 |
| 112 | MLII | 100.00 | 99.96 | 0.04 | 2538 | 0 | 1 |
| 113 | MLII | 100.00 | 100.00 | 0.00 | 1793 | 0 | 0 |
| 114 | MLII | 100.00 | 100.00 | 0.00 | 1878 | 0 | 0 |
| 115 | MLII | 100.00 | 100.00 | 0.00 | 1952 | 0 | 0 |
| 116 | MLII | 99.38 | 99.75 | 0.87 | 2411 | 15 | 6 |
| 117 | MLII | 100.00 | 100.00 | 0.00 | 1534 | 0 | 0 |
| 118 | MLII | 100.00 | 99.91 | 0.09 | 2277 | 0 | 2 |
| 119 | MLII | 100.00 | 100.00 | 0.00 | 1986 | 0 | 0 |
| 121 | MLII | 99.89 | 100.00 | 0.11 | 1862 | 2 | 0 |
| 122 | MLII | 100.00 | 100.00 | 0.00 | 2475 | 0 | 0 |
| 123 | MLII | 100.00 | 100.00 | 0.00 | 1517 | 0 | 0 |
| 124 | MLII | 100.00 | 100.00 | 0.00 | 1618 | 0 | 0 |
| 200 | MLII | 99.92 | 99.35 | 0.73 | 2600 | 2 | 17 |
| 201 | MLII | 99.29 | 100.00 | 0.71 | 1962 | 14 | 0 |
| 202 | MLII | 99.86 | 99.95 | 0.19 | 2135 | 3 | 1 |
| 203 | MLII | 98.79 | 99.06 | 2.13 | 2979 | 36 | 28 |
| 205 | MLII | 99.74 | 99.96 | 0.30 | 2655 | 7 | 1 |
| 207 | MLII | 99.62 | 99.36 | 1.02 | 1859 | 7 | 12 |
| 208 | MLII | 99.46 | 99.76 | 0.78 | 2954 | 16 | 7 |
| 209 | MLII | 99.97 | 99.93 | 0.10 | 3004 | 1 | 2 |
| 210 | MLII | 98.94 | 99.81 | 1.24 | 2649 | 28 | 5 |
| 212 | MLII | 100.00 | 100.00 | 0.00 | 2747 | 0 | 0 |
| 213 | MLII | 99.91 | 100.00 | 0.09 | 3249 | 3 | 0 |
| 214 | MLII | 99.96 | 99.96 | 0.09 | 2261 | 1 | 1 |
| 215 | MLII | 100.00 | 100.00 | 0.00 | 3362 | 0 | 0 |
| 217 | MLII | 99.91 | 99.95 | 0.14 | 2207 | 2 | 1 |
| 219 | MLII | 100.00 | 99.91 | 0.09 | 2153 | 0 | 2 |
| 220 | MLII | 100.00 | 100.00 | 0.00 | 2047 | 0 | 0 |
| 221 | MLII | 99.84 | 100.00 | 0.16 | 2426 | 4 | 0 |
| 222 | MLII | 99.76 | 100.00 | 0.24 | 2482 | 6 | 0 |
| 223 | MLII | 99.96 | 100.00 | 0.04 | 2604 | 1 | 0 |
| 228 | MLII | 99.81 | 98.99 | 1.21 | 2052 | 4 | 21 |
| 230 | MLII | 100.00 | 99.91 | 0.09 | 2255 | 0 | 2 |
| 231 | MLII | 100.00 | 100.00 | 0.00 | 1570 | 0 | 0 |
| 232 | MLII | 100.00 | 99.72 | 0.28 | 1779 | 0 | 5 |
| 233 | MLII | 99.97 | 100.00 | 0.03 | 3078 | 1 | 0 |
| 234 | MLII | 100.00 | 100.00 | 0.00 | 2752 | 0 | 0 |
| Total | 99.82 | 99.81 | 0.36 | 109,443 | 193 | 203 |
Table 2.
Performance during different rhythms using the MIT-BIH arrhythmia database.
| Rhythm Type | Symbol | TB | TP | FN | Se% |
|---|---|---|---|---|---|
| Normal beat | N | 75,013 | 74,939 | 74 | 99.90 |
| Left bundle branch block beat | L | 8072 | 8067 | 5 | 99.94 |
| Right bundle branch block beat | R | 7256 | 7256 | 0 | 100.00 |
| Atrial premature beat | A | 2544 | 2543 | 1 | 99.96 |
| Aberrated atrial premature beat | A | 150 | 133 | 17 | 88.67 |
| Nodal (junctional) premature beat | J | 83 | 83 | 0 | 100.00 |
| Supraventricular premature beat | S | 2 | 2 | 0 | 100.00 |
| Premature ventricular contraction | V | 7130 | 7055 | 75 | 98.95 |
| Fusion of ventricular and normal beat | F | 803 | 795 | 8 | 99.00 |
| Atrial escape beat | E | 16 | 16 | 0 | 100.00 |
| Nodal (junctional) escape beat | J | 229 | 229 | 0 | 100.00 |
| Ventricular escape beat | E | 106 | 106 | 0 | 100.00 |
| Paced beat | / | 7024 | 7017 | 7 | 99.90 |
| Fusion of paced and normal beat | F | 982 | 981 | 1 | 99.90 |
| Unclassifiable beat | Q | 33 | 28 | 5 | 84.85 |
| Total | 109,443 | 109,250 | 193 | 99.82 |
Table 3.
Comparison of this study with other studies using the MIT-BIH arrhythmia database.
| Method | Types of Point R Recognized | Embed. App. | Se% | +P% | DER% | TB | TP | FN | FP |
|---|---|---|---|---|---|---|---|---|---|
| The proposed approach | 4 | Y | 99.82 | 99.81 | 0.36 | 109,443 | 109,250 | 193 | 203 |
| Pan and Tompkins [5] | * | Y | 99.76 | 99.56 | 0.68 | 116,137 | 115,860 | 277 | 507 |
| Hamilton and Tompkins [6] | * | Y | 99.69 | 99.77 | 0.54 | 109,267 | 108,927 | 340 | 248 |
| Farashi [7] | 2 | N | 99.75 | 99.85 | 0.40 | 109,965 | 109,692 | 273 | 163 |
| Phukpattaranont [8] | 2 | N | 99.82 | 99.81 | 0.38 | 109,483 | 109,281 | 202 | 210 |
| Manikandan and Soman [9] | 1 | N | 99.93 | 99.87 | 0.20 | 109,496 | 109,417 | 79 | 140 |
| Merah et al. [12] | 1 | N | 99.84 | 99.88 | 0.28 | 109,494 | 109,316 | 178 | 126 |
| Cristov [14] (algorithm 2) | * | N | 99.78 | 99.78 | 0.44 | 110,050 | 109,615 | 240 | 239 |
| Karimipour and Homaeinezhad [15] | * | N | 99.81 | 99.70 | 0.43 | 116,137 | 115,945 | 192 | 308 |
| Dohare et al. [17] | 1 | N | 99.21 | 99.34 | 1.45 | 109,966 | 109,096 | 870 | 728 |
| Sharma and Sunkaria [18] | 2 | N | 99.50 | 99.56 | 0.93 | 109,488 | 108,979 | 509 | 428 |
| Yazdani and Vesin [21] | 2 | Y | 99.87 | 99.90 | 0.22 | 109,494 | 109,357 | 137 | 108 |
| Castells-Rufas and Carrabina [25] | * | Y | 99.43 | 99.67 | 0.88 | 109,494 | 108,880 | 614 | 353 |
| Jinkwon Kim and Hangsik Shin [26] | * | N | 99.90 | 99.91 | 0.19 | 109,494 | 109,357 | 107 | 97 |
| DS Benitez et al. [27] | 1 | N | 99.81 | 99.83 | 0.36 | N/A | N/A | 203 | 187 |
* Only QRS complexes detection.
Table 4.
The average R-R interval of 10 test cases.
| ID | (This Study) Average RRI (ms) | (Polar Output) Average RRI (ms) | Difference (ms) |
|---|---|---|---|
| P201009271648 | 488.2 | 489 | 0.8 |
| P201011171707 | 499.6 | 499.6 | 0 |
| P201011161440 | 514.4 | 515 | 0.6 |
| P201011171720 | 457.3 | 457.8 | 0.5 |
| P201011171149 | 425.7 | 428 | 2.3 |
| P201011171731 | 528.7 | 529.4 | 0.7 |
| P201011171742 | 419.8 | 420.4 | 0.6 |
| P201011171805 | 437.9 | 438.9 | 0.9 |
| P201011231627 | 424.1 | 424.6 | 0.5 |
| P201011241604 | 423.1 | 423.6 | 0.5 |
| Average Difference | 0.74 | ||
Table 5.
Implanted platforms with the corresponding processing times demonstrated in this study.
| Functions | Data | Platform | Processing Time | Coding Tool |
|---|---|---|---|---|
| MIT-BIH arrhythmia database (360 Hz) | windows 7 PC with Intel i5 dual core CPU @ 2.5 GHz | Max < 15 ms Average < 6 ms | Matlab (not be optimized) | |
| QRS complex detection, features detection (Q, R, S), 4 types of point R recognition | Real captured ECG signal (120 Hz) | windows mobile phone with 528 MHz CPU | Average < 1 ms | Visual Studio C++ |
| Real captured ECG signal (120 Hz) | ARM Cortex-M3 MCU running in the frequency of 24 MHz | Average < 10 ms | Keil C |
© 2017 by the authors. Licensee MDPI, Basel, Switzerland. This article is an open access article distributed under the terms and conditions of the Creative Commons Attribution (CC BY) license (http://creativecommons.org/licenses/by/4.0/).
Share and Cite
MDPI and ACS Style
Chen, C.-L.; Chuang, C.-T. A QRS Detection and R Point Recognition Method for Wearable Single-Lead ECG Devices. Sensors 2017, 17, 1969. https://doi.org/10.3390/s17091969
AMA Style
Chen C-L, Chuang C-T. A QRS Detection and R Point Recognition Method for Wearable Single-Lead ECG Devices. Sensors. 2017; 17(9):1969. https://doi.org/10.3390/s17091969
Chicago/Turabian StyleChen, Chieh-Li, and Chun-Te Chuang. 2017. "A QRS Detection and R Point Recognition Method for Wearable Single-Lead ECG Devices" Sensors 17, no. 9: 1969. https://doi.org/10.3390/s17091969
Note that from the first issue of 2016, this journal uses article numbers instead of page numbers. See further details here.