Article

A Novel Organic Electrochemical Transistor-Based Platform for Monitoring the Senescent Green Vegetative Phase of Haematococcus pluvialis Cells

1
Shenzhen Key Laboratory of Special Functional Materials & Guangdong Research Center for Interfacial Engineering of Functional Materials, College of Materials Science and Engineering, Shenzhen University, Shenzhen 518060, China
2
Key Laboratory of Optoelectronic Devices and Systems of Ministry of Education and Guangdong Province, College of Optoelectronic Engineering, Shenzhen University, Shenzhen 518060, China
3
Shenzhen Key Laboratory of Marine Bioresource and Eco-environmental Science, Guangdong Engineering Research Center for Marine Algal Biotechnology, College of Life Sciences and Oceanography, Shenzhen University, Shenzhen 518060, China
*
Authors to whom correspondence should be addressed.
These authors contributed equally to this work.
Sensors 2017, 17(9), 1997; https://doi.org/10.3390/s17091997
Submission received: 27 July 2017 / Revised: 23 August 2017 / Accepted: 28 August 2017 / Published: 31 August 2017
(This article belongs to the Special Issue Thin-Film Transistors for Biomedical and Chemical Sensing)

Abstract

:
The freshwater unicellular microalga Haematococcus pluvialis (H. pluvialis) has gained increasing attention because of its high-value metabolite astaxanthin, a super anti-oxidant. For the maximum astaxanthin production, a key problem is how to determine the senescent green vegetative phase of H. pluvialis cells to apply the astaxanthin production inducers. The conventional methods are time-consuming and laborious. In this study, a novel platform based on organic electrochemical transistor (OECT) was produced. A significant channel current change of OECTs caused by settled H. pluvialis cells on the poly(3,4-ethylenedioxythiophene): polystyrene sulfonate (PEDOT: PSS) film was recorded commencing from 75 min and a stationary stage was achieved at 120 min after the combined treatment of blue light irradiation and sodium bicarbonate solution additives, which indicate the onset and maturation of the senescent green vegetative phase, respectively. Therefore, the appropriate time point (120 min after sample loading) to apply astaxanthin production inducers was determined by as-fabricated OECTs. This work may assist to develop a real-time biosensor to indicate the appropriate time to apply inducers for a maximum astaxanthin production of H. pluvialis cells.

1. Introduction

Sensitively and rapidly detecting analytes in solution is a pressing need in areas of biology, chemistry and medicine. Traditional laboratory techniques, such as microscopic observation or secondary fluorescent labels, have great sensitivity and accuracy. However, these experimental processes have significantly high cost and complexity and are incapable of monitoring the real-time interactions between probe and analyte target. Thus, extensive research has been conducted to develop novel sensor platforms which can conveniently and efficiently detect the targets in a real-time manner. Among these devices, organic electrochemical transistor (OECT), a new branch of organic thin-film transistor (OTFT), is gaining increasing attention in biological and chemical detections due to its advantages in fabrication, performance, biocompatibility, expense, and so on. Employing conducting polymer in an electrolyte-gated structure [1], the working mode of OECT is based on the regulation of active layer’s conductivity by the chemical doping of cations from the electrolyte to the channel film under a gate voltage [2]. Therefore, ions [3,4], proteins [5], DNA [6], dopamine [7], lactate [8], and glucose [9,10,11] have been successfully detected by OECT-based sensors. In particular, OECTs have shown promising results in active control of cell growth [12], monitoring the cell morphology changes [13], and recording the tissue activity [14] with high sensitivity and speediness.
Microalgae cells have been broadly studied for a variety of applications, such as the production of high-value metabolites [15] and wastewater treatment [16,17]. Haematococcus pluvialis (Chlorophyceae) is a freshwater unicellular microalga, which produces astaxanthin with 20 times greater antioxidant capacity than that produced by chemical synthesis [18]. Normally, H. pluvialis is studied for its adaptive response under conditions of environmental stress such as nutrient depletion, high salinity, or high light intensities. In favorable or adverse environment, there are two morphologically distinguishable phases in the life cycle of H. pluvialis, green vegetative phase and red non-motile astaxanthin accumulated phase (red cyst phase or aplanospore) [19]. As a large amount of astaxanthin accumulates in cellular lipid droplets in the aplanospore stage, plenty of efforts have been put into maximizing the biomass and astaxanthin production in H. pluvialis for commercial purposes. Many studies focused on optimizing the culture parameters, including nutrient compositions, chemical treatment, light, and so on [19].
A two-stage cultivation of H. pluvialis for producing astaxanthin has commonly been utilized, i.e., growth and production stages. It has been reported that the optimal induction stage for the highest astaxanthin production of H. pluvialis was in senescent green vegetative phase of the growth stage, in which green cells lose the mobility and turn into settled cysts [20]. A critical question is how to determine the appropriate time point to apply the astaxanthin production inducers to transfer cells into the second production stage for maximum astaxanthin production. This determination is required for every batch of astaxanthin production because the different algal statuses among batches of H. pluvialis cells often cause the variation of the appropriate induction time point. However, the current method of determining senescent green vegetative phase, which is based on microscopic observation or optical density measurement, is a time-consuming and laborious process. It is of great necessity to develop novel platforms that allow sensitive and real-time detection of the stage transition of H. pluvialis.
This study presents the first report to apply OECTs in the detection of microalgae H. pluvialis cells. A convenient, efficient, and high-throughput measuring platform based on OECT array was constructed. H. pluvialis cells were real-time monitored from early green vegetative phase and the timeline of the senescent green vegetative phase was determined by the channel current change of OECTs caused by settled H. pluvialis cells on the transistors. These results may assist in developing a real-time sensor to indicate the appropriate time point to apply astaxanthin production triggers for a maximum astaxanthin production in a commercial fermenter.

2. Materials and Methods

2.1. Materials

PEDOT:PSS (Poly(3,4-ethylenedioxythiophene) polystyrene sulfonate) was purchased from Sigma-Aldrich (St Louis, MO, USA). PDMS-Sylgard Elastomer 184 was obtained from Dow Corning (Midland, TX, USA). The recommended ESP Ag culture medium for H. pluvialis cultivation was used, which is composed of KNO3 (0.2 g·L−1), K2HPO4 (0.02 g·L−1), MgSO4 (0.02 g·L−1), soil extract (3%, v/v), micronutrient solution (0.5%, v/v) and proteose-peptone (0.1%, w/v). Sodium bicarbonate and other unspecified general chemicals were purchased from Aladdin (Shanghai, China).

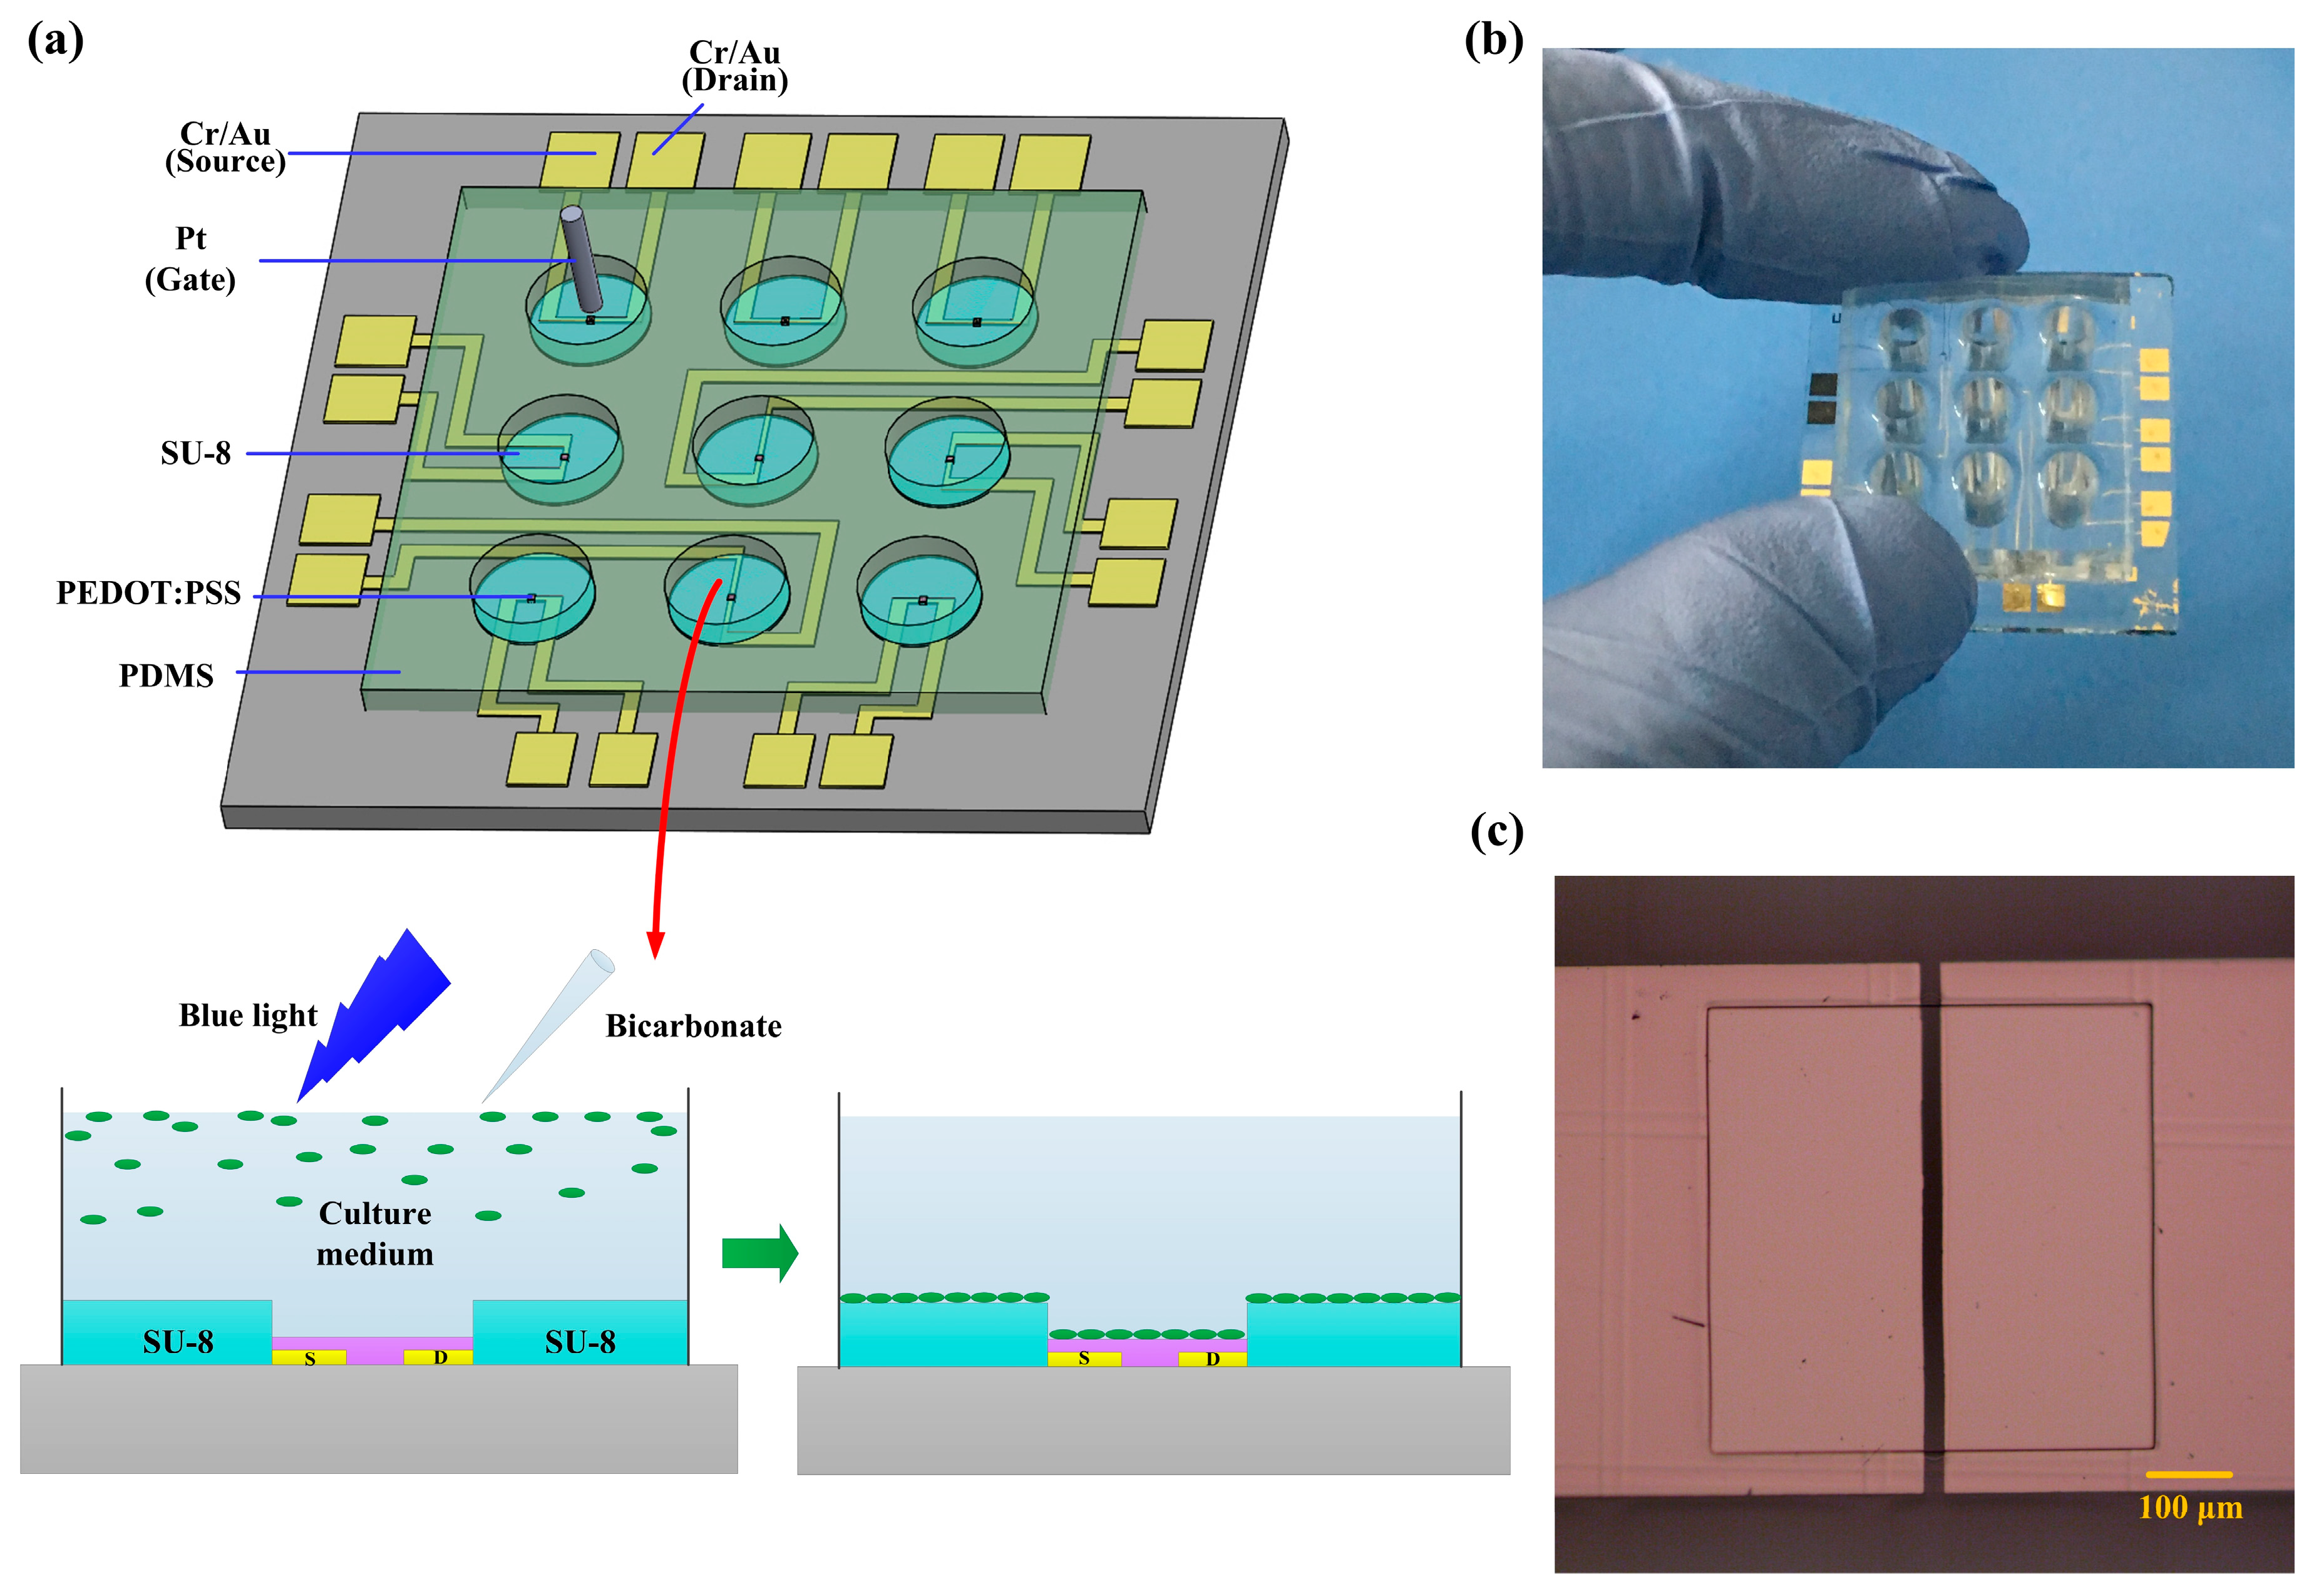
2.2. Device Fabrication

The fabrication process was performed according to the previous report with a slight modification [21]. Briefly, SU-8 was used for patterning the PEDOT:PSS layer, insulating the underlined metal electrodes from electrolytes and trapping the algae cells in confined space, instead of PEG (poly(ethylene glycol)) in the report of Zhang et al. [21] for modification. Firstly, OECT array was fabricated on a glass substrate with a size about 3 cm × 3 cm and a thickness about 0.1 mm. Cr/Au film with 10/100 nm was deposited on the glass substrate through a thermal evaporation (NEXDEP, The AE Inc., Kitchener, ON, Canada) and patterned for source and drain electrodes by lift-off process. The width and length of the channel were 500 and 20 μm, respectively. Then SU-8 microwells were fabricated by photolithography, and a designed size of about 500 μm × 500 μm was achieved. PEDOT:PSS was spin-coated on the surface of SU-8, and the thickness was about 80 nm which was characterized by a scanning probe microscope. Then, PEDOT:PSS was physically delaminated from the surface of SU-8 by scotch tape, leaving only 500 μm × 500 μm patterns in SU-8 microwells. The specimen was then annealed at 180 °C for 1 h in a high-purity N2 filled glove box. Finally, Polydimethylsiloxane (PDMS) walls were fabricated by soft-lithography [22]. PDMS polymer in a ratio of 10:1 was poured into a stainless steel mould with micro pillar array, treated at 85 °C for 1 h in an oven, and then peeled off from the mould. The diameter and depth of the formed PDMS walls were 4 mm and 1 cm, respectively. At last, PDMS walls were bonded with glass substrate after oxygen plasma treatment for 30 s.

2.3. Device Characterization and Image Acquisition

OECT array characteristics (transfer characteristics, output characteristics and the real-time dynamic response) were measured by using a semiconductor parameter analyzer Keithley 4200S. A commercial Pt wire (φ 0.5 mm × 37 mm, Gaoss Union, Wuhan, China) immersed in the electrolyte was used as the gate electrode. The transfer characteristics were obtained by measuring the change of channel current IDS as a function of gate voltage VG when drain voltage VDS was kept at 0.1 V. The output characteristics were obtained by measuring the change of the channel current IDS as a function of drain voltage VDS under a stepped gate voltage VG of 0, 0.2, 0.4, 0.6 and 0.8 V, respectively, leading to different curves of IDS versus VDS. To real-time monitor the settlement of H. pluvialis cells in the senescent green vegetative phase, a dynamic response of IDS versus time t was measured.
The images of settled H. pluvialis cells were taken by a stereomicroscope equipped with a cooled CCD (Charge-coupled Device) camera (Olympus SZX16, Tokyo, Japan) after on-chip assay. The acquired image data were further processed by Adobe Photoshop (Adobe Systems).

2.4. H. pluvialis Preparation

H. pluvialis cells were cultured according to the method described by Zheng [23]. Briefly, Green alga H. pluvialis 192.80 was purchased from the SAG (Sammlung von Algenkulturen Göttingen), Germany. The algal cells were grown in 100 mL ESP Ag culture medium exposed to light with the intensity of 22.5 μmol·photon·m−2·s−1 at 21 °C.
Once H. pluvialis cells reached 7 d green phase, the exposure to blue light with the intensity of 22.5 μmol·photon·m−2·s−1 generated by a home-made fluorescent lamp box and the addition of NaHCO3 (0.5 mM) were both utilized to trigger cells to enter the senescent green vegetative phase. Under this combined treatment, 100 μL H. pluvialis cells were loaded into each as-fabricated OECT to monitor the timeline of the senescent green vegetative phase.

3. Results and Discussion

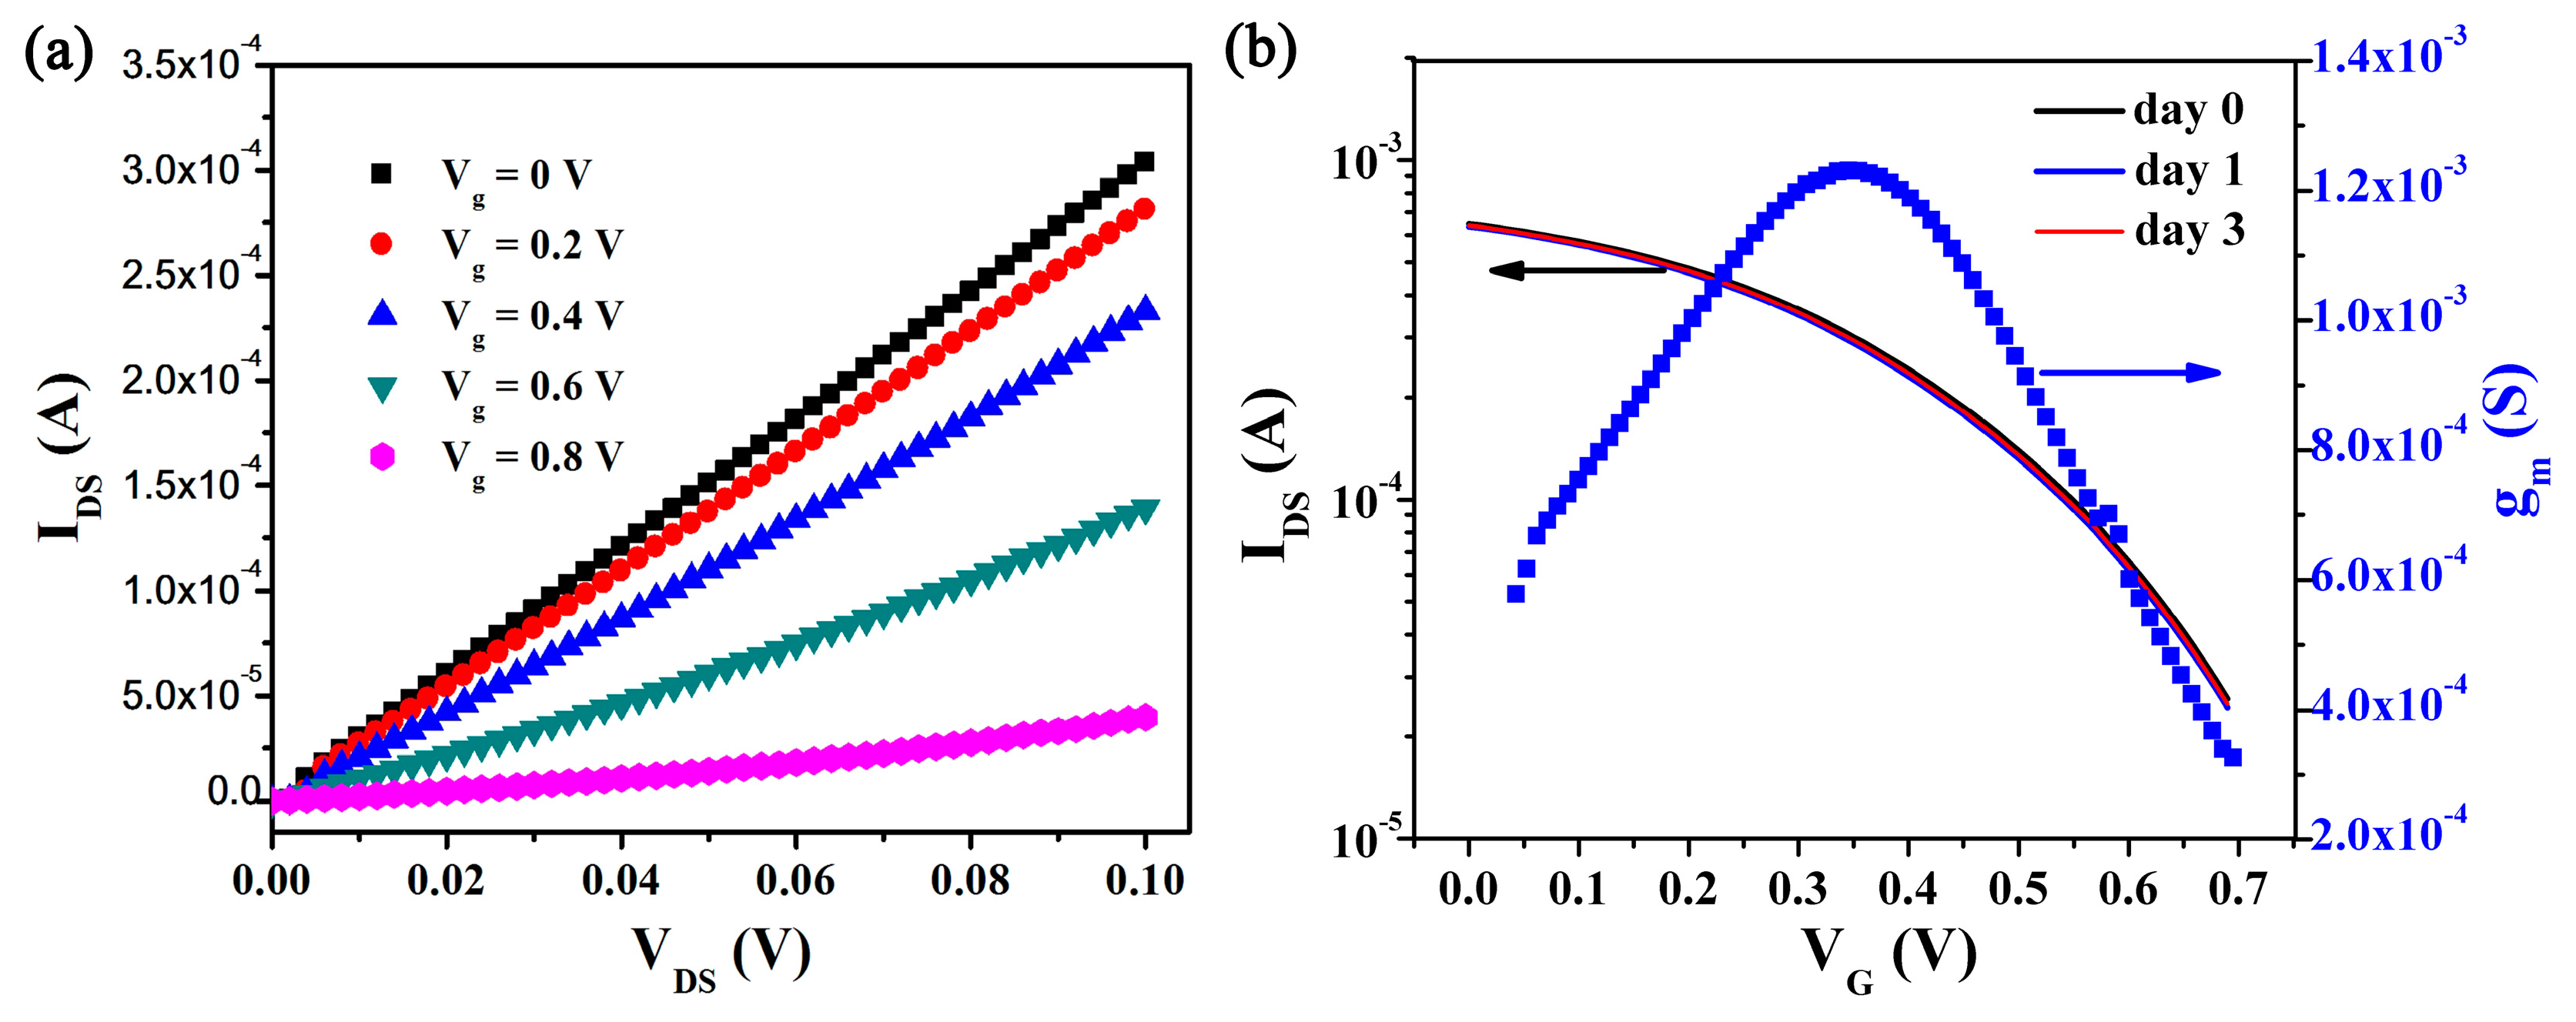
3.1. Preparation and Characterization of OECT Array

Figure 1a described the schematic diagram of OECT array-based measuring platform (a photograph of 3 × 3 OECT array platform fabricated on a glass substrate shown in Figure 1b). PEDOT:PSS film, a kind of conducting polymer with excellent biocompatibility [24], was used as the active layer of OECT device array. The patterned film of Cr/Au served as the source and drain electrodes, insulated from the electrolyte by SU-8 layer. A microscopic image of the SU-8 well was shown in Figure 1c. The culture medium in the PDMS walls was used as the electrolyte, and a commercial Pt wire immersed in the electrolyte was used as the gate electrode. In the lower panel of Figure 1a, it showed the measurement schema. Before treatment, H. pluvialis cells in green vegetative phase were motile in the favorable cultivation. When combined treatment of blue light irradiation and sodium bicarbonate solution additives were applied for 2 h, the green motile algal cells would turn to be non-motile and prone to precipitate in the stressful cultivation. After the precipitated algal cells with electric charges attached on the OECT device, the channel current of OECT would change, suggesting the onset of the senescent green vegetative phase.
The OECT device array in the measuring platform was characterized in culture medium with Pt wire as the gate electrode. Without a gate dielectric layer, the conducting active layer direct interfaced with the electrolyte solution, OECT thus could work in a low-voltage operation (below 1 V), as depicted by output characteristic of the device in Figure 2a. The low working voltage feature is crucial for cell sensing, as it can avoid the detrimental effects induced by water hydrolysis to the cells. The stability of the device in culture medium was also critical for functioning as a cell-based biosensor. The device showed a constant stability during the measuring period (3 days) in culture medium (Figure 2b), which ensured a reliable recording. OECTs operated in a depletion mode since the density of holes in the PEDOT:PSS film was influenced by chemical doping [2]. The channel current IDS had a nearly 2 orders magnitude of modulation at only 0.7 V of gate voltage VG. A maximal transconductance gm of 1.2 ms was obtained at 0.32 V of VG, which means a high gain for transistors in sensing applications, as these OECTs had a high ratio of response output to signal input.

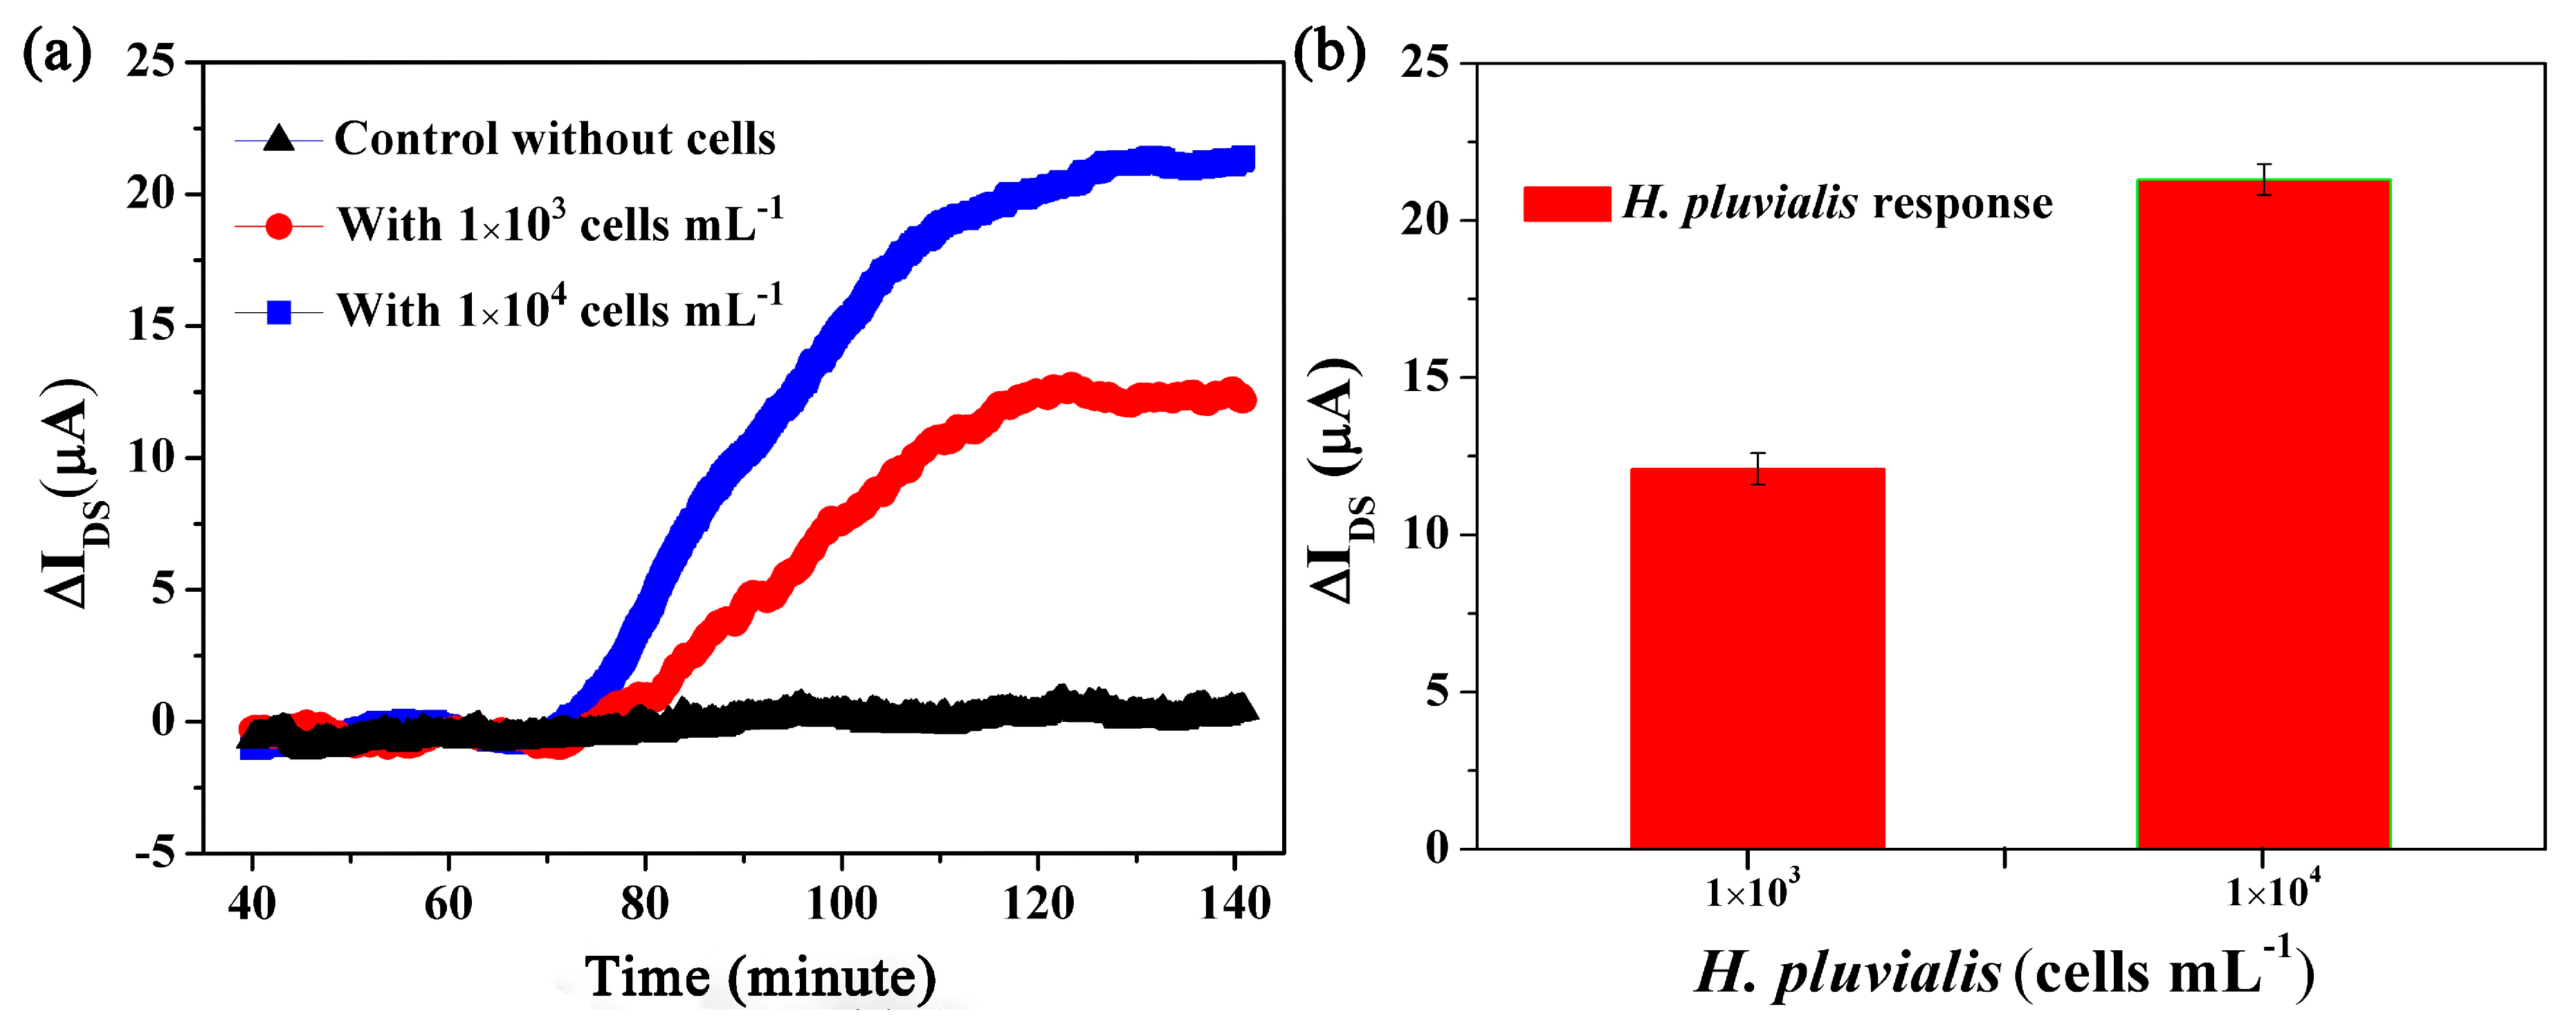
3.2. Real-Time Algal Cells Detection

The application of as-fabricated OECT arrays in the detection of the senescent green vegetative phase was performed into two steps: First, a one-shot test to examine the impact of cell settlement on the device performance by detecting settled H. pluvialis cells in the senescent green vegetative phase (or green cyst phase); Second, a real-time detection of settled H. pluvialis cells in the senescent green vegetative phase after the combined treatment of blue-light and sodium bicarbonate.
In the first test, the correlation between channel current change of as-fabricated OECTs and the precipitation of H. pluvialis cells in green cyst phase was demonstrated, verifying the feasible application of as-fabricated OECTs in detection of cell settlement on the device. Cells in green cyst phase were loaded into the platform, precipitate cells would rapidly settle on PEDOT:PSS film of OECTs. We found that the transfer characteristic shifted to larger gate voltage in a three-minute delay, and then became stable, suggesting that the green cyst cells settled completely in a minute scale. This shift caused by the settled green cyst cells was measured as 54 mV (Figure 3a). As shown in Figure 3b, the settlement of green cyst cells on the OECT channel film was confirmed by stereomicroscope after on-chip test. As the control group, the cell-free culture medium could not change the performance of the OECT device, indicating that the change was indeed induced by cell settlement on the PEDOT:PSS film. Also, this response was detected in a minute scale, suggesting a rapidity of as-fabricated OECT arrays to the settlement of H. pluvialis cells.
To investigate the influence of algal cells settlement on the device performance, it is necessary to investigate the electrical interaction of the algal cell with our OECT device. The channel current IDS of OECT is as follows:
I DS = q μ p 0 t W L V p ( V p V G eff + V DS 2 ) V DS   ( when   | V DS | < < | V p V G eff | ) V p = q p 0 t / c i V G eff = V G + V offset
where q is the charge of electron, μ is the mobility of vacancy, P0 is the initial hole concentration, t is the channel film thickness, L and W are the channel length and width, respectively. Vp represents the pinch-off voltage, and ci is the unit area capacitance of the transistor, which is related to the channel-electrolyte capacitance (Cc) and the gate-electrolyte capacitance (CG) [25]. V G eff is an effective applied gate voltage, and Voffset is the offset voltage, which represents the potential drop at the channel-electrolyte and gate-electrolyte interfaces [11,26]. According to our previous experience [13], ci changed very slightly after cells were cultivated on the PEDOT:PSS film of OECT. Therefore, the change of the offset voltage Voffset was the main reason for the shift of transfer curve.
The analytical potential model before and after cell settlement on an OECT device can be shown in Figure 4. In the first beginning, there was no cell coverage on the device. The applied gate voltage distributed on the two interfaces of channel-electrolyte and gate-electrolyte (the solid line in Figure 4), and the voltage VE-C distributed at the channel-electrolyte interface is given as:
V C - E = V G 1 + γ
where γ = C c / C G . Then, the green cyst H. pluvialis cells precipitated quickly onto the PEDOT:PSS film, so there would be a potential change Δ ψ at the electrolyte/PEDOT:PSS interface [13]. Therefore, the offset voltage change is expressed as:
Δ V offset = ( 1   + γ ) Δ ψ
Since there is nearly no change for ci, γ can approximately be considered as a constant value in this experiment [13,27]. Thus, Δ V offset is only related to the potential change Δ ψ . Δ ψ is normally modulated by the electrostatic interaction between the algal cells and the OECT device [28]. It is reasonable to assume that there is an electric potential drop related to the distance between the cells and PEDOT:PSS film, and the potential drop is called Zeta potential. In cell biology, the Zeta potential is normally related to electrostatic adhesion [28], cell agglutination and biological activation [29]. Then the potential change Δ ψ can be expressed as an average Zeta potential of the settled algal cells, which is given as the following [30,31]:
ζ = Q ε D r 2 × 1 κ
where Q is the surface charge of the algal cell, ε is the electrolyte permittivity, D is the dielectric displacement, r is radius of the algal cell, 1/ κ is the double layer length. Thus, the cell Zeta potential is modulated by the cells surface charge density and the ion types and concentration in the electrolyte.
In our OECT array, γ is about 0.34 as reported previously [27]. Since the offset voltage change was −54 mV, the potential change Δ ψ could be calculated as −40.3 mV from Equation (3). For the zeta potential determination, it was measured by using a Zeta potential analyzer (ZETASIZER NANO, Malvern, UK) (see Figure S1 in the Supplementary Materials). From the measurement, the Zeta potential of the H. pluvialis cells was in the range of −20.7 mV to −32.3 mV. In addition, many other researchers reported the Zeta potential of algal cells with a value from −15 to −40 mV [32,33,34,35]. The measurement and reports were in the similar range of the OECT potential change Δ ψ −40.3 mV.
As mentioned above, the Zeta potential of the H. pluvialis cells is in negative tens of millivolts [28,30]. When algal cells settled on the PEDOT:PSS film, the potential drop VC-E at the channel-electrolyte interface would decrease under a fixed gate voltage VG. Since the VC-E directly induced the modulation of the channel current of the OECT device, it could be considered that the effective gate voltage decreased, as shown in Figure 4 (dashed line). Therefore, it required a larger gate voltage to compensate the reduced effective gate voltage. As a result, the transfer characteristic shifted to a higher value, which was consistent with the results shown in Figure 3a. Furthermore, the algal cells indeed applied an additional voltage of negative tens of millivolts, confirming the above explanation.
As mentioned, for maximum astaxanthin production, the production inducers should be applied in the senescent green vegetative phase of the growth stage of H. pluvialis cells. It is of high significance to determine the timeline of the senescent green vegetative phase. Therefore, in a second test, we performed the real-time detection of the senescent green vegetative phase by using as-fabricated OECTs to determine the appropriate time point to apply astaxanthin production inducers. According to our unpublished results, green motile H. pluvialis cells at Day 7 cultivation were observed by microscopic examination to enter the senescent green vegetative phase within around 1 h after the combined treatment of blue light (22.5 μmol·photon·m−2·s−1) and NaHCO3 (0.5 mM). Under this combined treatment, H. pluvialis cells were able to be completely converted into precipitate green cyst cells within 2 h. In the OECT device tests, cell-free culture medium and two different densities of H. pluvialis cells (1 × 10³ and 1 × 10⁴ cells·mL−1) were assayed as control and experimental groups, respectively. All groups were treated in the home-made fluorescent lamp box with blue light (22.5 μmol photon m−2·s−1) and NaHCO3 (0.5 mM) upon sample loading. Figure 5a depicts a typical dynamic response of OECT after the treatment. In order to eliminate the variations between different devices, the real-time current records were converted into current change ΔIDS, and the current obtained in control groups was fitted to a baseline for uniformity. As shown in Figure 5a, in comparison with the largely unchanged baseline given by cell-free culture medium, the dramatic risings of channel current were observed at about 75 min after sample loading of H. pluvialis cells. This current rising lasted for around 45 min followed by a stationary stage. Notably, the current changes were different, i.e., around 12.1 μA and 21.4 μA (Figure 5b), respectively, as cell densities varied. An explanation for these observations was given as follows. Within 75 min after sample loading, H. pluvialis cells in green vegetative phase gradually lost motility and a small proportion of H. pluvialis cells started to precipitate and attach on the OECT device, thus the channel current of OECT remained largely unchanged or increased very slowly. After about 75 min, more and more cells began to precipitate and attached on the OECT device to cause a significant channel current rising, indicating the onset of the senescent green vegetative phase. The stationary stage starting at around 120 min represented the completion of cell settlement. These results were consistent with the above-mentioned unpublished observation that green motile H. pluvialis cells entered the senescent green vegetative phase within around 1 h and then completely precipitated within 2 h after the combined treatment of blue light (22.5 μmol photon m−2·s−1) and NaHCO3 (0.5 mM). Therefore, under our tested conditions, the appropriate time point (120 min after sample loading) to apply astaxanthin production inducers was determined by as-fabricated OECTs. This may assist in indicating the appropriate time to apply inducers for a maximum astaxanthin production of H. pluvialis cells.

4. Conclusions

In summary, we applied PEDOT:PSS-based OECT array to detect microalgae H. pluvialis cells for the first time. The settlement of H. pluvialis cells in senescent green vegetative phase was successfully monitored by the OECT-based platform for a real-time electrical detection. Under the combined treatment of blue light and NaHCO3 salt, a significant channel current change of OECTs caused by settled H. pluvialis cells on the PEDOT:PSS film was recorded commencing from 75 min and a stationary stage was achieved at 120 min after sample loading, indicating that the onset and maturation of the senescent green vegetative phase occurred at 75 and 120 min after sample loading, respectively. Therefore, the appropriate time point (120 min after sample loading) to apply astaxanthin production inducers has been determined. With the ease of the real-time electrical readout and simple configuration of our device, it has the potential to develop a real-time biosensor to indicate the appropriate time to apply for a maximum astaxanthin production of H. pluvialis cells. In future, a high-throughput assessment on the appropriate application time of different inducers for astaxanthin production by H. pluvialis cells can be easily achieved by OECT arrays. Furthermore, our OECTs can be applied into broad applications of biological studies. For instance, the settlement of the marine biofouling organisms can be real-time monitored and quantified to develop an automatic anti-fouling drug screening platform based on as-fabricated OECT arrays.

Supplementary Materials

The following are available online at https://www.mdpi.com/1424-8220/17/9/1997/s1, Figure S1: The Zeta potential recorded every 10 min for 2 h, Figure S2. Raw current trace data with (red and blue) and without (black) H. pluvialis cells under the light and salt treatment recorded by OECT. VG = 0.3 V, VDS = 0.1 V, Figure S3. (a) Device characteristics in the culture medium without algae before and after addition of sodium bicarbonate and blue light irradiation.; (b) Device characteristics in the culture medium with the attached green cyst cells before and after addition of sodium bicarbonate and blue light irradiation, Figure S4. Device characteristics in the culture medium with the salt and light irradiation with and without algae cells at typical time points of (a) 0 min, (b) 90 min and (c) 120 min, Figure S5. Transfer characteristics of the OECT in the culture medium with sodium bicarbonate initially and at 3 min and 2 h after loading the green cyst H. pluvialis cells, VDS = 0.1 V, Figure S6. In situ OECT response with H. pluvialis cells for 2 h without the light and salt treatment, VG = 0.3 V, VDS = 0.1 V.

Acknowledgments

This work was financially supported by the National Natural Science Foundations of China (Nos. 21405106, 31470431), the Foundation for Distinguished Young Talents in Higher Education of Guangdong, China (No. 2014KQNCX130), the Scientific and Technical Innovation Council of Shenzhen (Nos. JCYJ20150625102622556, JCYJ20170302145633009, JCYJ20170302150244018), Guangdong Natural Science Foundation (Nos. 2014A030310230, 2014A030308017), and the Natural Science Foundation of SZU (Nos. 827-000012, 827-000022).

Author Contributions

W.W., K.X. and M.T. contributed equally in this interdisciplinary study. W.W. fabricated the OECT-based platform and wrote the chip part of this manuscript; K.X. coordinated in experimental design and implementation and wrote the biological part of this manuscript; M.T. prepared algal cells, established biological parameters for on-chip assays, performed microscopic examinations after on-chip assays, and proofread the manuscript. L.N. and D.L. assisted in the OECT fabrication and preliminary tests. S.K. and X.Z. advised on data analyses. Z.H., P.L. and Y.Z. supervised and financially supported this study.

Conflicts of Interest

The authors declare no conflict of interest.

References

  1. Vanmaekelbergh, D.; Houtepen, A.J.; Kelly, J.J. Electrochemical gating: A method to tune and monitor the (opto) electronic properties of functional materials. Electrochem. Acta 2007, 53, 1140–1149. [Google Scholar] [CrossRef]
  2. Bernards, D.A.; Malliaras, G.G. Steady-state and transient behavior of organic electrochemical transistors. Adv. Funct. Mater. 2007, 17, 3538–3544. [Google Scholar] [CrossRef]
  3. Dabke, R.B.; Singh, G.D.; Dhanabalan, A.; Lal, R.; Contractor, A.Q. An ion-activated molecular electronic device. Anal. Chem. 1997, 69, 724–727. [Google Scholar] [CrossRef]
  4. Bernards, D.A.; Malliaras, G.G.; Toombes, G.E.; Gruner, S.M. Gating of an organic transistor through a bilayer lipid membrane with ion channels. Appl. Phys. Lett. 2006, 89, 053505. [Google Scholar] [CrossRef]
  5. Kim, D.J.; Lee, N.E.; Park, J.S.; Park, I.J.; Kim, J.G.; Cho, H.J. Organic electrochemical transistor based immunosensor for prostate specific antigen (PSA) detection using gold nanoparticles for signal amplification. Biosens. Bioelectron. 2010, 25, 2477–2482. [Google Scholar] [CrossRef] [PubMed]
  6. Krishnamoorthy, K.; Gokhale, R.S.; Contractor, A.Q.; Kumar, A. Novel label-free DNA sensors based on poly (3, 4-ethylenedioxythiophene). Chem. Commun. 2004, 7, 820–821. [Google Scholar] [CrossRef] [PubMed]
  7. Tang, H.; Lin, P.; Chan, H.L.; Yan, F. Highly sensitive dopamine biosensors based on organic electrochemical transistors. Biosens. Bioelectron. 2011, 26, 4559–4563. [Google Scholar] [CrossRef] [PubMed]
  8. Khodagholy, D.; Curto, V.F.; Fraser, K.J.; Gurfinkel, M.; Byrne, R.; Diamond, D.; Owens, R.M. Organic electrochemical transistor incorporating an ionogel as a solid state electrolyte for lactate sensing. J. Mater. Chem. 2012, 22, 4440–4443. [Google Scholar] [CrossRef] [Green Version]
  9. Zhu, Z.T.; Mabeck, J.T.; Zhu, C.; Cady, N.C.; Batt, C.A.; Malliaras, G.G. A simple poly (3, 4-ethylene dioxythiophene)/poly (styrene sulfonic acid) transistor for glucose sensing at neutral pH. Chem. Commun. 2004, 13, 1556–1557. [Google Scholar] [CrossRef] [PubMed]
  10. Macaya, D.J.; Nikolou, M.; Takamatsu, S.; Mabeck, J.T.; Owens, R.M.; Malliaras, G.G. Simple glucose sensors with micromolar sensitivity based on organic electrochemical transistors. Sens. Actuators B Chem. 2007, 123, 374–378. [Google Scholar] [CrossRef]
  11. Bernards, D.A.; Macaya, D.J.; Nikolou, M.; DeFranco, J.A.; Takamatsu, S.; Malliaras, G.G. Enzymatic sensing with organic electrochemical transistors. J. Mater. Chem. 2008, 18, 116–120. [Google Scholar] [CrossRef]
  12. Bolin, M.H.; Svennersten, K.; Nilsson, D.; Sawatdee, A.; Jager, E.W.; Richter-Dahlfors, A.; Berggren, M. Active Control of Epithelial Cell-Density Gradients Grown Along the Channel of an Organic Electrochemical Transistor. Adv. Mater. 2009, 21, 4379–4382. [Google Scholar] [CrossRef] [PubMed]
  13. Lin, P.; Yan, F.; Yu, J.; Chan, H.L.; Yang, M. The Application of Organic Electrochemical Transistors in Cell-Based Biosensors. Adv. Mater. 2010, 22, 3655–3660. [Google Scholar] [CrossRef] [PubMed]
  14. Khodagholy, D.; Doublet, T.; Quilichini, P.; Gurfinkel, M.; Leleux, P.; Ghestem, A.; Malliaras, G.G. In vivo recordings of brain activity using organic transistors. Nat. Commun. 2013, 4, 1575. [Google Scholar] [CrossRef] [PubMed]
  15. Glombitza, K.W.; Koch, M. Secondary Metabolites of Pharmaceutical Potential; Cresswell, R.C., Rees, T.A.V., Shah, N., Eds.; Algal and Cyanobacterial Biotechnology, Longman Scientific & Technical: Essex, UK, 1989; pp. 161–238. [Google Scholar]
  16. Jin, E.; Polle, J.E.; Lee, H.K.; Hyun, S.M.; Chang, M. Xanthophylls in microalgae: From biosynthesis to biotechnological mass production and application. J. Microbiol. Biotechnol. 2003, 13, 165–174. [Google Scholar]
  17. Aziz, M.A.; Ng, W.J. Feasibility of wastewater treatment using the activated-algae process. Bioresour. Technol. 1992, 40, 205–208. [Google Scholar] [CrossRef]
  18. Lorenz, R.T.; Cysewski, G.R. Commercial potential for Haematococcus microalgae as a natural source of astaxanthin. Trends biotechnol. 2000, 18, 160–167. [Google Scholar] [CrossRef]
  19. Shah, M.M.; Liang, Y.; Cheng, J.J.; Daroch, M. Astaxanthin-Producing Green Microalga Haematococcus pluvialis: From Single Cell to High Value Commercial Products. Front. Plant. Sci. 2016, 7, 531. [Google Scholar] [CrossRef] [PubMed]
  20. Choi, Y.E.; Yun, Y.S.; Park, J.M.; Yang, J.W. Determination of the time transferring cells for astaxanthin production considering two-stage process of Haematococcus pluvialis cultivation. Bioresour. Technol. 2011, 102, 11249–11253. [Google Scholar] [CrossRef] [PubMed]
  21. Zhang, M.; Lin, P.; Yang, M.; Yan, F. Fabrication of organic electrochemical transistor arrays for biosensing. Biochim. Biophys. Acta Gen. Subj. 2013, 1830, 4402–4406. [Google Scholar] [CrossRef] [PubMed]
  22. Ko, J.S.; Yoon, H.C.; Yang, H.; Pyo, H.B.; Chung, K.H.; Kim, S.J.; Kim, Y.T. A polymer-based microfluidic device for immunosensing biochips. Lab Chip 2003, 3, 106–113. [Google Scholar]
  23. Zheng, Y.H.; Tao, M.; Li, Z.; Hu, Z.L. Cloning and characterization of selenoprotein thioredoxin reductase gene in Haematococcus pluvialis. Algal Res. 2016, 17, 97–104. [Google Scholar] [CrossRef]
  24. Berggren, M.; Richter-Dahlfors, A. Organic bioelectronics. Adv. Mater. 2007, 19, 3201–3213. [Google Scholar] [CrossRef]
  25. Ghosh, S.; Inganäs, O. Conducting polymer hydrogels as 3D electrodes: Applications for supercapacitors. Adv. Mater. 1999, 11, 1214–1218. [Google Scholar] [CrossRef]
  26. Cicoira, F.; Sessolo, M.; Yaghmazadeh, O.; DeFranco, J.A.; Yang, S.Y.; Malliaras, G.G. Influence of device geometry on sensor characteristics of planar organic electrochemical transistors. Adv. Mater. 2010, 22, 1012–1016. [Google Scholar] [CrossRef] [PubMed]
  27. Lin, P.; Yan, F.; Chan, H.L. Ion-sensitive properties of organic electrochemical transistors. ACS Appl. Mater. Interfaces 2010, 2, 1637–1641. [Google Scholar] [CrossRef] [PubMed]
  28. Lin, D.Q.; Zhong, L.N.; Yao, S.J. Zeta potential as a diagnostic tool to evaluate the biomass electrostatic adhesion during ion-exchange expanded bed application. Biotechnol. Bioeng. 2006, 95, 185–191. [Google Scholar] [CrossRef] [PubMed]
  29. Veronesi, B.; de Haar, C.; Lee, L.; Oortgiesen, M. The surface charge of visible particulate matter predicts biological activation in human bronchial epithelial cells. Toxicol. Appl. Pharmacol. 2002, 178, 144–154. [Google Scholar] [CrossRef] [PubMed]
  30. Zhang, Y.; Yang, M.; Park, J.H.; Singelyn, J.; Ma, H.; Sailor, M.J.; Ozkan, C. A Surface-Charge Study on Cellular-Uptake Behavior of F3-Peptide-Conjugated Iron Oxide Nanoparticles. Small 2009, 5, 1990–1996. [Google Scholar] [CrossRef] [PubMed]
  31. Hunter, R.J. Zeta Potential in Colloid Science: Principles and Applications; Academic Press: London, UK, 2013. [Google Scholar]
  32. Rosenhahn, A.; Finlay, J.A.; Pettit, M.E.; Ward, A.; Wirges, W.; Gerhard, R.; Callow, J.A. Zeta potential of motile spores of the green alga Ulva linza and the influence of electrostatic interactions on spore settlement and adhesion strength. Biointerphases 2009, 4, 7–11. [Google Scholar] [CrossRef] [PubMed]
  33. Henderson, R.K.; Parsons, S.A.; Jefferson, B. Successful removal of algae through the control of zeta potential. Sep. Sci. Technol. 2008, 43, 1653–1666. [Google Scholar] [CrossRef]
  34. Sukenik, A.; Shelef, G. Algal autoflocculation—Verification and proposed mechanism. Biotechnol. Bioeng. 1984, 26, 142–147. [Google Scholar] [CrossRef] [PubMed]
  35. Hancock, C.; Flores, M. Zeta Potential: Key to Harvesting Algae for Biofuels and Bioproducts; Utah State University: Logan, UT, USA, 2016. [Google Scholar]
Figure 1. (a) The schematic diagram of an OECT array-based measuring platform. For the platform, the yellow region represented Cr/Au electrodes, the grey pillar represented gate electrode, the blue region represented SU-8, the pink region represented PEDOT:PSS, the green region represented PDMS, and the grey block represented glass substrate, the OECT device was characterized before and after the transition of H. pluvialis from motile to precipitate phase, in which the culture medium served as the electrolyte; (b) Photograph of the OECT array platform; (c) Microscopic image of the SU-8 microwell.
Sensors 17 01997 g001
Figure 2. Characteristics of the OECT device array. (a) Output characteristic of a single OECT measured in culture medium; (b) Transfer characteristic of a single OECT measured in culture medium in 3 days at VDS = 0.1 V and the resulting transconductance gm.
Sensors 17 01997 g002
Figure 3. (a) IDS vs VG (transfer characteristics) of an OECT measured in the culture medium before (0 min) and at 3, 5, 10, 20 and 30 min after loading the green cyst H. pluvialis cells, VDS = 0.1 V; (b) Optical image of the green cyst H. pluvialis cells precipitated on the OECT channel film in the SU-8 microwell.
Sensors 17 01997 g003
Figure 4. Schematic diagram of potential distribution between the gate electrode interface and the channel interface in the presence and absence of the H. pluvialis cells attachment. EDL is representative of electric double layer, including the electric double layer of channel-electrolyte and gate-electrolyte.
Sensors 17 01997 g004
Figure 5. Timeline of the senescent green vegetative phase recorded by OECT. (a) In situ OECT response with (red and blue) and without (black) H. pluvialis cells under the light and salt treatment. The real-time transistor current was converted to current change for uniformity, VG = 0.3 V, VDS = 0.1 V. (b) Recorded current changes in response to different concentrations of H. pluvialis. Each concentration was repeated five times.
Sensors 17 01997 g005

