A Voltammetric Electronic Tongue for the Resolution of Ternary Nitrophenol Mixtures


1
Sensors and Biosensors Group, Department of Chemistry, Universitat Autònoma de Barcelona, Edifici Cn, 08193 Bellaterra, Barcelona, Spain
2
Future Industries Institute, University of South Australia, SA 5095 Adelaide, Australia
*
Author to whom correspondence should be addressed.
Sensors 2018, 18(1), 216; https://doi.org/10.3390/s18010216
Submission received: 15 December 2017
/
Revised: 10 January 2018
/
Accepted: 11 January 2018
/
Published: 13 January 2018
(This article belongs to the Special Issue Electronic Tongues and Electronic Noses)
Abstract
:This work reports the applicability of a voltammetric sensor array able to quantify the content of 2,4-dinitrophenol, 4-nitrophenol, and picric acid in artificial samples using the electronic tongue (ET) principles. The ET is based on cyclic voltammetry signals, obtained from an array of metal disk electrodes and a graphite epoxy composite electrode, compressed using discrete wavelet transform with chemometric tools such as artificial neural networks (ANNs). ANNs were employed to build the quantitative prediction model. In this manner, a set of standards based on a full factorial design, ranging from 0 to 300 mg·L−1, was prepared to build the model; afterward, the model was validated with a completely independent set of standards. The model successfully predicted the concentration of the three considered phenols with a normalized root mean square error of 0.030 and 0.076 for the training and test subsets, respectively, and r ≥ 0.948.
1. Introduction
The analysis of pollutants in wastewater, marine environments, and freshwater aquifers is of great importance to assure that pollutant levels stay within acceptable values. Among the most dangerous pollutants are nitrophenol compounds; these compounds are toxic inhibitors and of a persistent nature. The origin of nitrophenol compounds in the environment is anthropogenic; they originate in the degradation of dyes, pharmaceuticals, and pesticides. Among them, 4-nitrophenol is an especially toxic degradation product of parathion (O,O-diethyl O-(4-nitrophenyl)) phosphorothioate, a pesticide of extreme toxicity considered as hazardous waste and a high-priority toxic pollutant by the US Environmental Protection Agency and the European Chemical Agency [1,2].
Nitrophenols have been found in industrial wastewaters and in freshwater reservoirs and are present in the majority of marine environments. Traditional wastewaters and water purification plants have difficulty eliminating these compounds, as they require specific treatments with long incubation periods due to their high stability and solubility in water [3]. Hence, the development of sensors able to quantify the nitrophenol content in freshwater, wastewater, or marine environments is important.
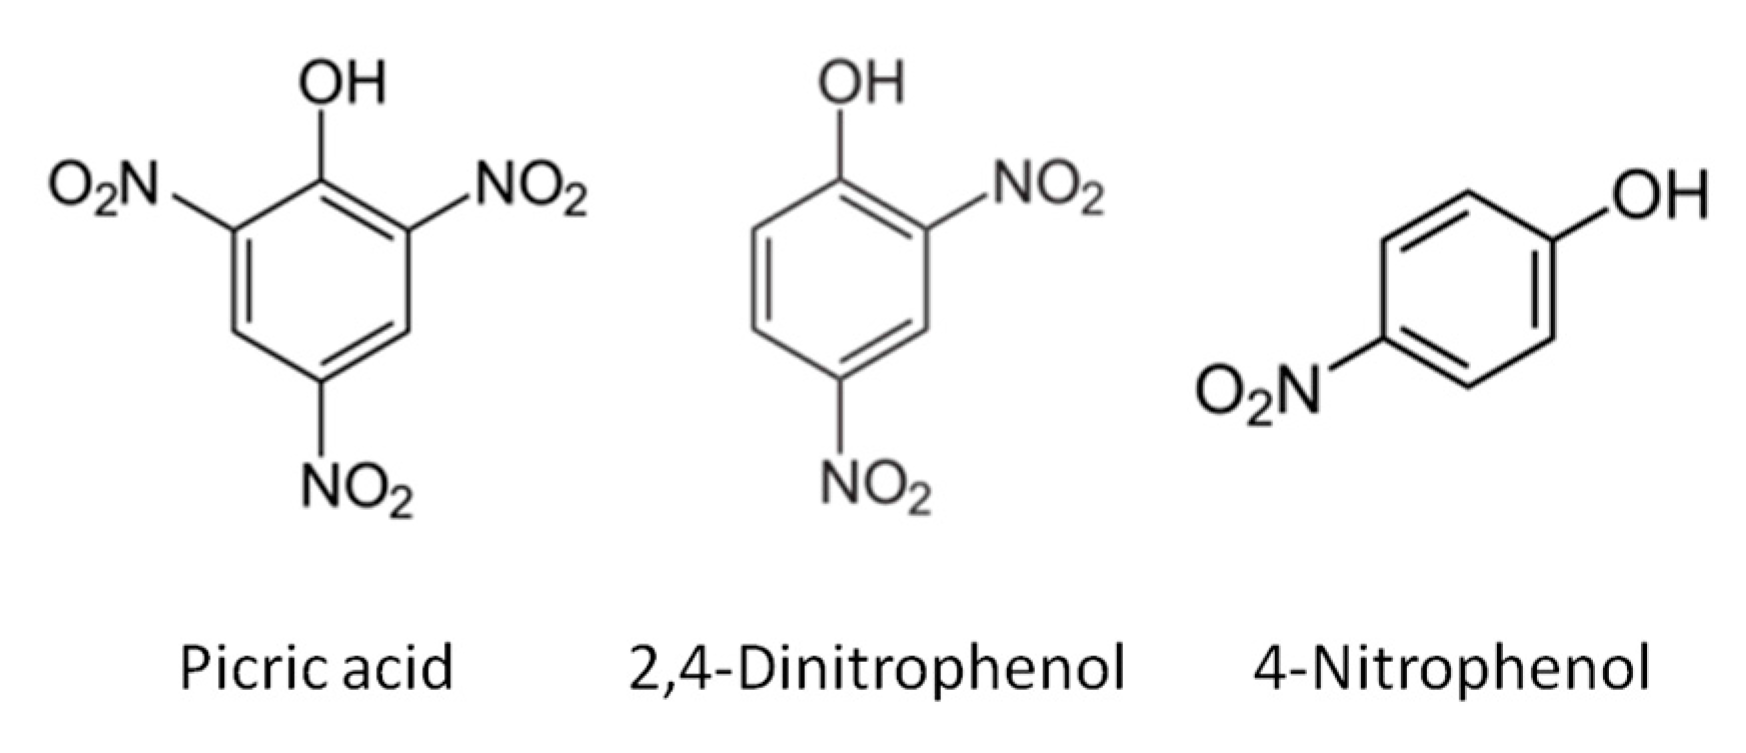
Electrochemical sensors provide an excellent tool for performing on-site analysis at a reasonably cheap price with fast and robust results. Unfortunately, there are factors that hinder the applicability of such sensors in real samples, e.g., matrix effects, interferents, and electrode fouling. Recent reported works have approached the electrochemical detection of different nitrophenol compounds relying on the surface modification of electrodes subsequently used in voltammetry; poly(p-aminobenzene sulfonic acid) films [4], chitosan–ZnO nano-needles [5], and graphene oxide particles modified with chitosan and cyclodextrine [6], among others [7], have been used for this purpose. However, the reported works only focus on the detection of 4-nitrophenol or on the quantification of nitrophenol isomer mixtures. The work presented here will attempt to simultaneously quantify species having multiple and different nitro-groups such as picric acid, 2,4-dinitrophenol, and 4-nitrophenol (Figure 1).
In this context, the approach proposed is the use of an electronic tongue (ET) system [8]. ETs were initially postulated in the early 1990s to overcome limitations of single sensor methodologies and to make extensive use of sensor arrays and chemometric tools [9]. Since then, ETs have been used to resolve individual pollutants present in complex samples [10,11] and to correct interference and/or matrix effects in environmental determinations [12].
However, the use of sensor arrays, especially when sensors are voltammetric, generates highly complex data that cannot be treated by classical means; such data require previous pre-processing in order to extract meaningful information and allow proper modeling. The more common chemometric tools employed to process the chemical data are principal component analysis (PCA), partial least squares (PLS), and artificial neural networks (ANNs) [13]. The resulting approach, a sensor array plus chemometric tools, that forms the basis for ETs [14] is a simple way to tackle qualitative identification problems and quantitative determinations. Due to potential parallelisms with the human sense of taste [15], ETs have been extensively employed in the food and beverage field, with specific applications in wine analysis, such as the determination of its global characteristics, the prediction of the score given by an expert sensory panel, and the detection of adulterations [16,17,18,19]. Other application examples include wastewater monitoring, explosive detection, and discrimination and quantification of phenol isomers [20,21,22]. Using this methodology, it is possible to achieve the simultaneous quantification of different species in a mixture while diminishing effects of potential interfering agents through the use of chemometric data analysis techniques [23,24].
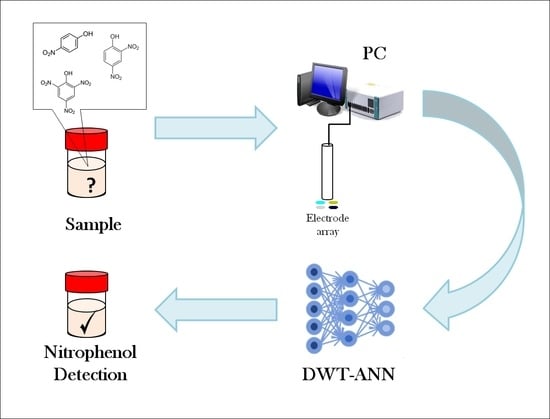
The proposed work performs a combined approach using electrochemical signals provided by a sensor array and chemometric data treatment in order to perform the simultaneous determination of three compounds with overlapped measurements. As shown in Figure 2, the use of cyclic voltammetry responses obtained from an array of epoxy graphite electrode plus metal electrodes is the sensor departure point. Discrete wavelet transform [25] was used to compress the data and to extract the chemically relevant information from original voltammograms, and ANNs were finally employed to build a response model to simultaneously predict the concentrations of picric acid, 4-nitrophenol, and 2,4-dinitrophenol content in aqueous solution mixtures, being the three compounds analytes of environmental concern.
2. Experimental
2.1. Reagents
The reagents used in this work were analytical reagent grade and all solutions were prepared using deionized water from a Milli-Q purification system (Millipore, Billerica, MA, USA). Potassium dihydrogenphosphate, potassium monohydrogenphosphate, picric acid, 2,4-dinitrophenol, and 4-nitrophenol were supplied by Sigma-Aldrich (St. Louis, MO, USA). KCl was supplied by Merck KGaA (Darmstadt, Germany).
2.2. Electronic Tongue
The voltammetric ET was formed by an array of 4 sensors, plus a combined reference Ag/AgCl and Pt counter electrode (Ingold, PT4805-S7/120). The ET approach departs from the signals from an array of electrodes; in this work, we intended to obtain an easy deployable sensor array for on-site situations. Thus, a quatrielectrode with external counter and reference electrodes was proposed. One-millimeter-diameter discs of platinum, silver, gold, and epoxy-graphite were used as working electrodes. The metal electrodes were fabricated from its metal wires, and the epoxy-graphite electrode was prepared from the known epoxy-graphite composite electrode [26] by mixing epoxy resin and carbon; afterwards, the electrodes were encased in inert epoxy resin (Epotek H77, Epoxy Technologies) using a PVC tube with a 6 mm inner diameter as the array body [27].
Electrochemical measurements were performed at room temperature (25 °C), using a 6-channel AUTOLAB PGSTAT20 (Ecochemie, The Netherlands) controlled through its GPES Multichannel 4.7 software package. A complete cyclic voltammogram was recorded for each sample and for each electrode by cycling the potential between −1.0 V and +1.0 V vs. Ag/AgCl with a step potential of 9 mV and a scan rate of 100 mV·s−1.
In order to get stable voltammetric responses and ensure reproducible signals from the array during the study, the electrodes were cycled in a phosphate buffer solution on the beginning of each sample measurement until a stable response was obtained; an electrochemical cleaning step was performed between samples at +1.2 V for 40 s in a cell containing 20 mL of 50 mM saline solution (0.1 M KCl) at pH 10 [28]. Figure 3 schematizes the distribution of the training and test samples in the three analytes considered.
2.3. Sample Preparation
The first step in the construction of the artificial neural network is the response model definition of the training and test subsets. In this case, the chosen experimental design for the train subset was a complete 33 factorial design (27 samples) [29]; meanwhile, the validation of the constructed model was done with an external test set (12 samples), these were distributed randomly within the experimental domain (0 to 300 mg·mL−1 for each nitrophenol).
Samples were prepared in buffer (50 mM phosphate buffer solution at pH 6.5 and 50 mM KCl). Fresh stock solutions of nitrophenols were prepared the same day of the measurements.
2.4. Data Processing
The main objective of the first processing step is to simplify the input signal (4 sensors × 1784 current values at different potentials) without losing relevant chemical information; this step reduces training time, avoids redundancy in the input data, and allows for a model with better generalization ability [13].
The compression of the voltammograms was achieved by means of discrete wavelet transform [25]: each voltammetric vector was compressed using Daubechies 3 mother wavelet and a 4th decomposition level. In this manner, the 1784 currents per sample were compressed to 132 coefficients per sample, achieving a 94.2% compression ratio. Figure 4 shows the reconstructed voltammetric signals for different compression levels.
The statistical treatment and data analysis was performed using routines written by the authors using MATLAB 2016b (MathWorks, Natick, MA, USA) employing its Neural Network and Statistical Toolboxes add-ons; Sigmaplot (Systat Software Inc., San Jose, CA, USA) was used to graphically represent and analyze the results.
3. Results and Discussion
3.1. Voltammetric Array Response
Voltammograms for each of the electrodes towards individual compounds were firstly evaluated to ensure that the generated signals are different enough and the obtained data is sufficiently rich to be the starting point for a multivariate calibration model.
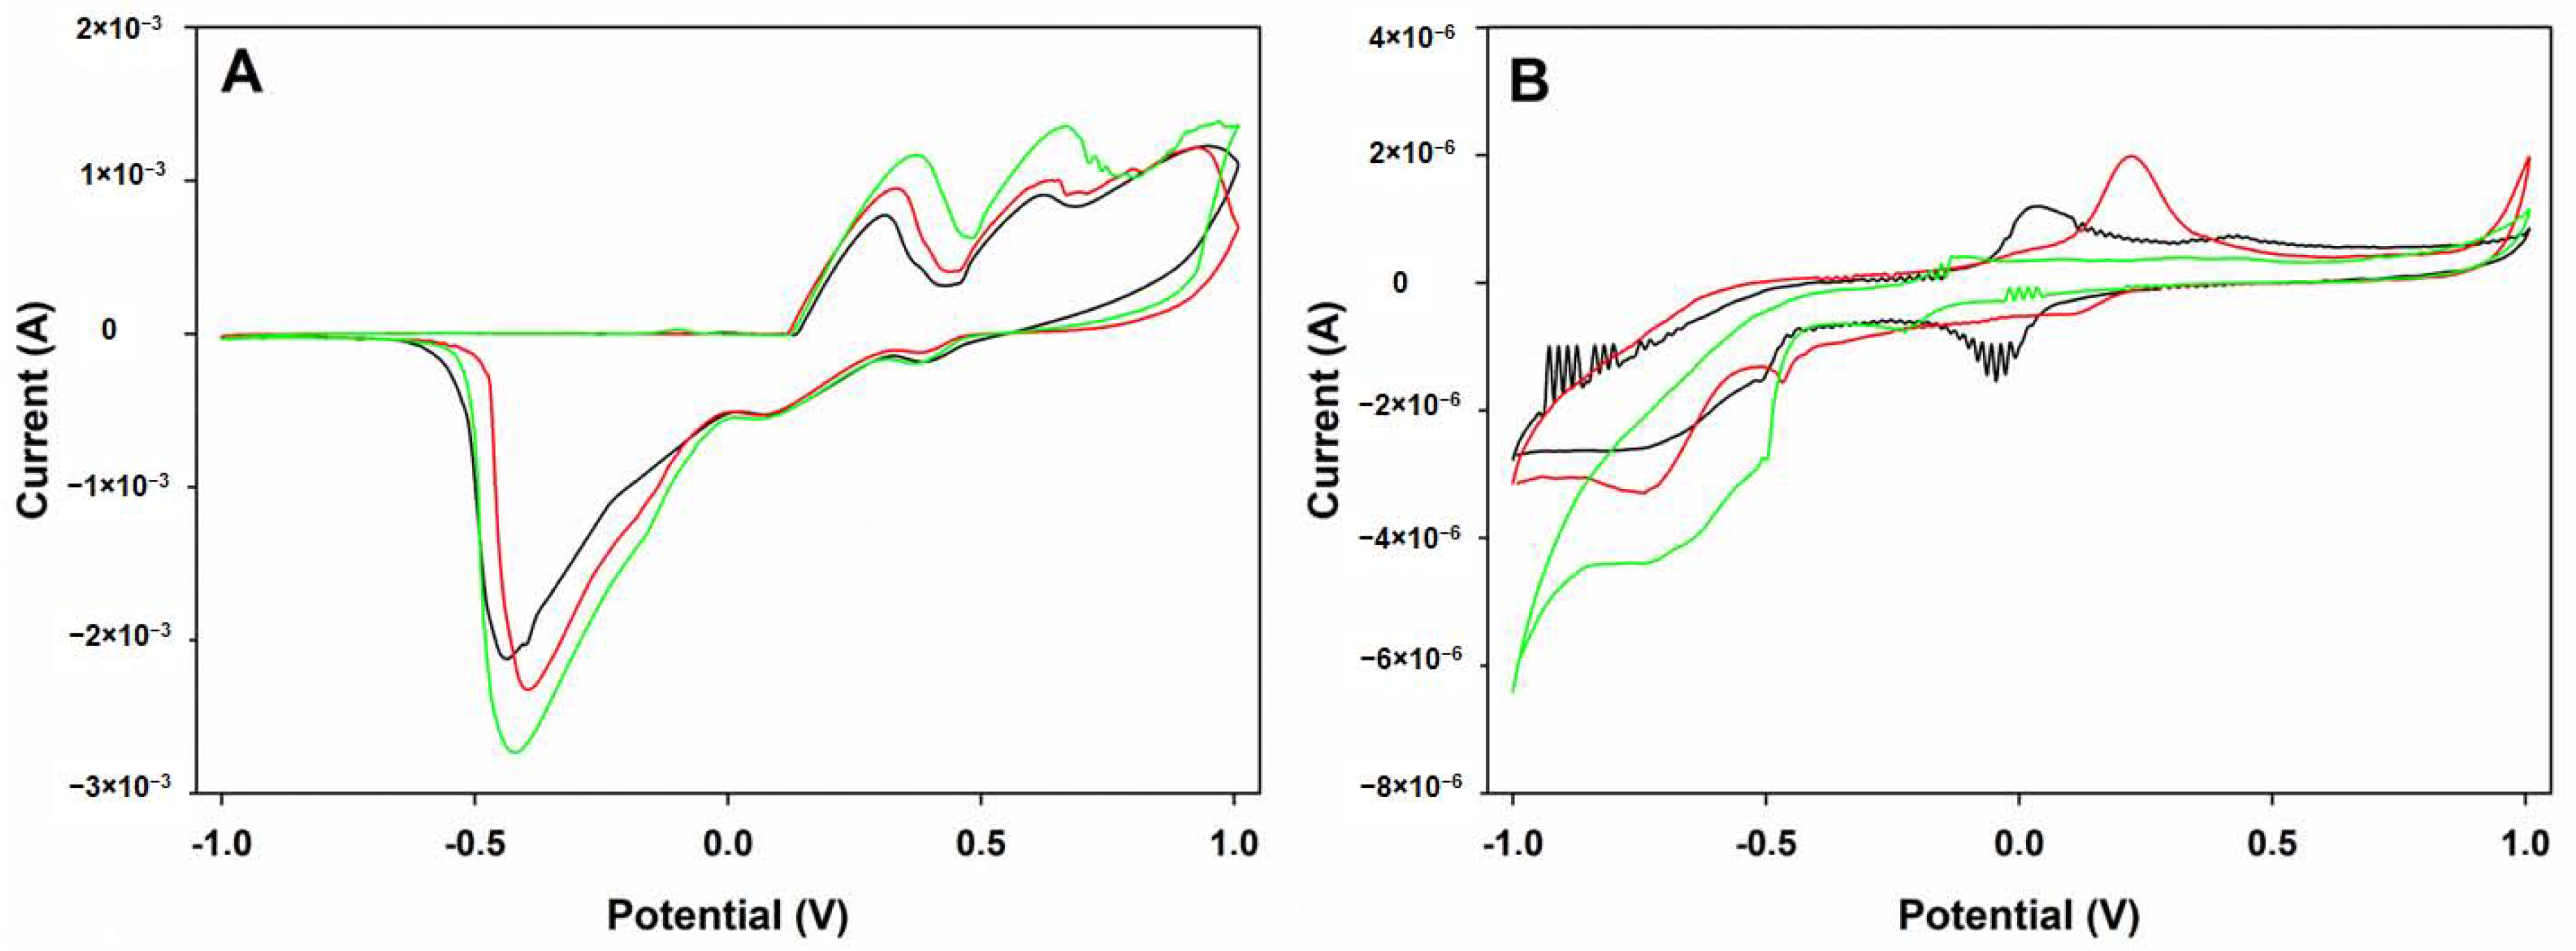
Therefore, following the conditions described in Section 2.2, individual stock solutions of 50 μg·mL−1 ppm of picric acid, 4-nitrophenol, and 2,4-dinitrophenol were analyzed (Figure 5). As a general trend, and as already reported in the literature [30,31], two processes were observed: the reduction of each nitrophenol group to its hydroxoamino form and the reversible redox oxidation of the hydroxoamino group to the nitrosophenol. In addition, slightly different signals were obtained for the different nitrophenol compounds, a necessary condition for an ET study.
Once it was confirmed that the different electrodes presented a differentiated electrochemical behavior towards the different nitrophenols under study, allowing for the differentiation of the three nitrophenols considered, the next step was the design of the proper ANN model architecture.
3.2. ANN Model Design
Once the data from the different subsets was collected, the voltammograms were compressed by use of DWT (compression details already determined), and the reduced dataset was fed to the different ANN models. For this, the next step was to choose the adequate ANN architecture; the habitual protocol to decide the details of an ANN configuration is trial-and-error given the complexity of an ANN and the number of parameters involved (learning strategy, learning parameters, number of layers, number of neurons in the hidden layer, transfer functions used, etc.) [32].
As already mentioned, the training subset samples were used to build the ANN models, and the performance of those models was estimated from the prediction of the analyte concentrations in the test subset samples. As the test subset is an external set that does not intervene in the modeling process, the goodness of fitting values for this subset is an unbiased parameter to evaluate the modeling performance.
After the compression of the obtained responses, the corresponding ANN configuration details were defined. First, it is needed to define which topology is necessary: the number of neurons in the input layer was equal to the number of DWT coefficients and the number of output neurons is determined by the number of compounds to be quantified. Hence, once the numbers of input and output neurons are defined, the number of neurons in the hidden layer and the type of transfer functions that will operate in the hidden and output layers need to be optimized. Normally, the use of a single hidden layer is sufficient to model common situations in analytical chemistry. All of these configuration parameters are optimized based on acquired experience working with ANNs and on a trial and error procedure, where the configuration that leads to the best performance is the one that is chosen [33].
The performance for each generated model was then evaluated with the external test subset by using the predictive abilities of the built model to predict concentrations of the nitrophenols present in the samples.
The main parameter used to evaluate the performance of the different models was the NRMSE (normalized root mean square error). The NRMSE is calculated for each of the configurations (a combination of hidden and output transfer functions and the number of neurons in the hidden layer) according to Equation (1), where Xexpected is the theoretical concentration of the sample, Xpredicted is the predicted concentration, j is the number of analytes considered, N the number of samples, and cmax is the maximum concentration.
Thus, the best topology will be the one that gives the lowest NRMSE value. As can be observed in Figure 6, by plotting the total NRMSE versus the number of neurons, for all combinations assayed, this allows us to easily compare the performance of the models. Moreover, it clearly shows that purelin–purelin combination is the one with the lowest NRMSE. The plot also allows us to select the best number of neurons to use in the hidden layer, in this case architectures between 3 and 10 neurons in its hidden layer, seem to procure equivalent results.
However, the total NRMSE is not the only parameter evaluated. Comparison graphs of obtained vs. expected concentrations for the three quantified nitrophenols were built in order to visualize the predictive ability of the ANN model, separately for the training and the testing subsets, and its best linear fitting line was calculated. Afterwards, the best configuration could be selected taking into account the best results for NRMSE as well as the slope, intercept, and correlation coefficient values (considering that these should provide values as close as possible to ideal values of 1.0, 0.0, and 1.0 in that order).
After the evaluation of different topologies tested (90 different configurations in total), the finally selected ANN architecture was formed by an input layer of 136 neurons (4 sensors × 33 DWT coeffs.), a hidden layer with 7 neurons and purelin transfer function, and an output layer with 3 neurons and purelin transfer function. With this configuration it is possible to simultaneously determine the concentration of the ternary mixture of nitrophenols, picric acid, 2,4-nitrophenol, and 2-nitrophenol.
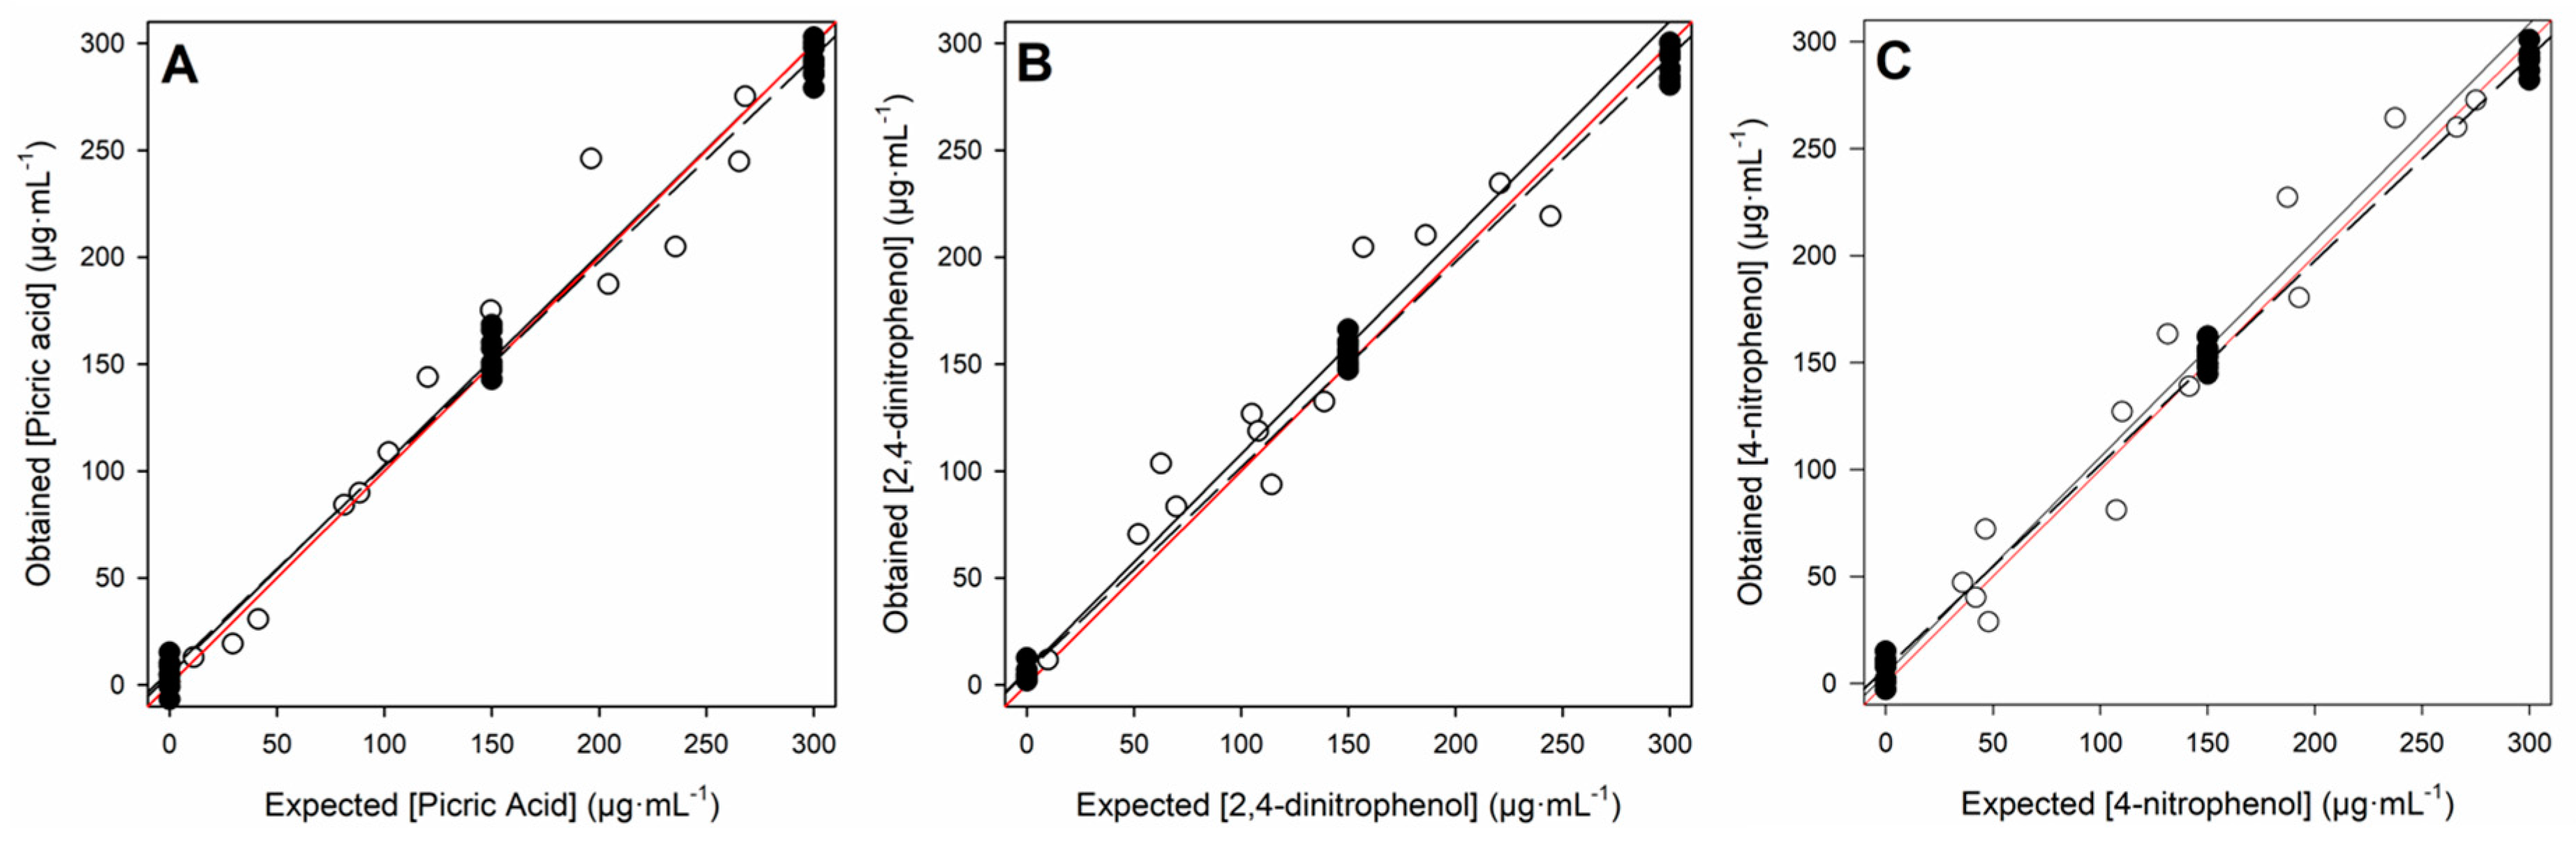
As mentioned, comparison graphs of obtained vs. expected concentrations for the training and testing subsets, separately for each nitrophenol considered, were built to evaluate the predictive ability of the ANN model (see Figure 7). Both subsets provided a satisfactory linear trend, with fitted comparison lines having its parameters very close to the theoretical ones: slope and intercept equal to 1.0 and 0.0, respectively. As normally observed in practice, the training subset had the lowest NRMSE and better correlation coefficients (r ≥ 0.998), clearly improving the test subset (r ≥ 0.948); this was an expected difference as the training subset was the one employed to construct and select different model configurations, so the model was tailored to fit the training data, and the test subset was only used to evaluate the performance in the predictive capabilities of the model as an external subset of samples. The detailed results, described in Table 1, show satisfactory results for the test subset as the global NRSME for the three nitrophenols, which is as low as 0.076.
To verify the correctness of the approach, a detailed numeric comparison of obtained vs. expected concentrations was performed, as summarized in Table 2. In there, the obtained values are listed together with those deduced from a classical single current measuring approach, a situation that will produce large errors if overlapping voltammetric signals occur, as it happens in this case. As can be seen in Table 2, the performance of the ET system clearly outweighs the single sensor approach, yielding values much closer to the theoretical ones, especially in the resolution of highly overlapped signals such as picric acid.
4. Conclusions
The presented work has shown the combination of a voltammetric array of four sensors with advanced chemometric processing, wavelet transform, and artificial neural networks to simultaneously quantify the concentrations of picric acid, 4-nitrophenol, and 2,4-dinitrophenol in aqueous solutions allowing for the resolution of complex mixtures with high overlapping peaks from different compounds. This study case clearly illustrates one of the capabilities of ET systems—the possibility of determining certain analyte counterbalancing any interfering species—but their response needed to be modeled.
The ET strategy allowed for the resolution of overlapping peaks and therefore the quantification of individual concentrations of nitrophenols; definitively, this consists in a very simple methodology that translates the complexity from the reactivity component or sensor component to the data treatment area, a field with increasing possibilities. This fact combined with the advantages of electrochemical sensors for on-field analysis results in a promising tool that could substitute the classical time-consuming methods, i.e., HPLC methodologies, and hopefully provide wastewater and water purification plants with a quick monitoring tool for these hazardous chemicals.
Acknowledgments
Financial support for this work was provided by the Spanish Ministry of Economy and Innovation, MINECO (Madrid) through projects CTQ2013-41577-P and CTQ2016-80170-P. A.G-C thanks Universtitat Autònoma de Barcelona for the PIF fellowship. M.d.V. thanks the support from program ICREA Academia.
Author Contributions
All authors contributed to this work. A.G.-C. and X.C. conducted the laboratory experiments. Data processing was performed by X.C., M.d.V. and X.C. provided guidance and feedback during the research process, performed detailed analysis, and wrote the discussion. M.d.V. was responsible for the general supervision, planning the experiments, and funding the project. A.G.-C. prepared the graphs and wrote the first version of the manuscript.
Conflicts of Interest
The authors declare no conflict of interest.
References
- US Environmental Protection Agency. 4-Nitrophenol, Health and Environmental Effects Profile No. 135; US Environmental Protection Agency: Washington, DC, USA, 1980.
- Council of the European Union. Council Directive 76/464/EEC. Official J. L 1976, 129, 23–29. [Google Scholar]
- Gogate, P.R.; Pandit, A.B. A review of imperative technologies for wastewater treatment I: Oxidation technologies at ambient conditions. Adv. Environ. Res. 2004, 8, 501–551. [Google Scholar] [CrossRef]
- Yao, C.; Sun, H.; Fu, H.-F.; Tan, Z.-C. Sensitive simultaneous determination of nitrophenol isomers at poly(p-aminobenzene sulfonic acid) film modified graphite electrode. Electrochim. Acta 2015, 156, 163–170. [Google Scholar] [CrossRef]
- Thirumalraj, B.; Rajkumar, C.; Chen, S.-M.; Lin, K.-Y. Determination of 4-nitrophenol in water by use of a screen-printed carbon electrode modified with chitosan-crafted ZnO nanoneedles. J. Colloid Interface Sci. 2017, 499, 83–92. [Google Scholar] [CrossRef] [PubMed]
- Li, C.; Wu, Z.; Yang, H.; Deng, L.; Chen, X. Reduced graphene oxide-cyclodextrin-chitosan electrochemical sensor: Effective and simultaneous determination of o- and p-nitrophenols. Sens. Actuators B Chem. 2017, 25, 446–454. [Google Scholar] [CrossRef]
- Hryniewicz, B.M.; Orth, E.S.; Vidotti, M. Enzymeless PEDOT-based electrochemical sensor for the detection of nitrophenols and organophosphates. Sens. Actuators B Chem. 2018, 25, 570–578. [Google Scholar] [CrossRef]
- Del Valle, M. Electronic tongues employing electrochemical sensors. Electroanalysis 2010, 22, 1539–1555. [Google Scholar] [CrossRef]
- Vlasov, Y.; Legin, A.; Rudnitskaya, A.; Di Natale, C.; D’amico, A. Nonspecific sensor arrays (“electronic tongue”) for chemical analysis of liquids (IUPAC Technical Report). Pure Appl. Chem. 2005, 77, 1965–1983. [Google Scholar] [CrossRef]
- Wilson, D.; Abbas, M.N.; Radwan, A.L.A.; del Valle, M. Potentiometric electronic tongue to resolve mixtures of sulfide and perchlorate anions. Sensors 2011, 11, 3214–3226. [Google Scholar] [CrossRef] [PubMed]
- Gutés, A.; Ibanez, A.; Céspedes, F.; Alegret, S.; del Valle, M. Simultaneous determination of phenolic compounds by means of an automated voltammetric “electronic tongue”. Anal. Bioanal. Chem. 2005, 382, 471–476. [Google Scholar] [CrossRef] [PubMed]
- Mimendia, A.; Gutierrez, J.M.; Opalski, L.J.; Ciosek, P.; Wróblewski, W.; Del Valle, M. SIA System employing the transient response from a potentiometric sensor array—Correction of a saline matrix effect. Talanta 2010, 82, 931–938. [Google Scholar] [CrossRef] [PubMed]
- Moreno-Barón, L.; Cartas, R.; Merkoçi, A.; Alegret, S.; Gutiérrez, J.M.; Leija, L.; Hernandez, P.R.; Muñoz, R.; del Valle, M. Data compression for a voltammetric electronic tongue modelled with artificial neural networks. Anal. Lett. 2005, 38, 2189–2206. [Google Scholar] [CrossRef]
- Del Valle, M. Sensor arrays and electronic tongue systems. Int. J. Electrochem. 2012, 2012, 986025. [Google Scholar] [CrossRef]
- Del Valle, M. Bioinspired sensor systems. Sensors 2011, 11, 10180–10186. [Google Scholar] [CrossRef] [PubMed]
- Ni, Y.; Kokot, S. Does chemometrics enhance the performance of electroanalysis? Anal. Chim. Acta 2008, 626, 130–146. [Google Scholar] [CrossRef] [PubMed]
- Cetó, X.; Gutiérrez, J.M.; Gutiérrez, M.; Céspedes, F.; Capdevila, J.; Mínguez, S.; Jiménez-Jorquera, C.; Del Valle, M. Determination of total polyphenol index in wines employing a voltammetric electronic tongue. Anal. Chim. Acta 2012, 732, 172–179. [Google Scholar] [CrossRef] [PubMed]
- Parra, V.; Arrieta, Á.A.; Fernández-Escudero, J.-A.; Rodríguez-Méndez, M.L.; De Saja, J.A. Electronic tongue based on chemically modified electrodes and voltammetry for the detection of adulterations in wines. Sens. Actuators B Chem. 2006, 118, 448–453. [Google Scholar] [CrossRef]
- Cetó, X.; González-Calabuig, A.; Capdevila, J.; Puig-Pujol, A.; del Valle, M. Instrumental measurement of wine sensory descriptors using a voltammetric electronic tongue. Sens. Actuators B Chem. 2015, 207, 1053–1059. [Google Scholar] [CrossRef]
- Cetó, X.; González-Calabuig, A.; del Valle, M. Use of a bioelectronic tongue for the monitoring of the photodegradation of phenolic compounds. Electroanalysis 2015, 27, 225–233. [Google Scholar] [CrossRef]
- Cetó, X.; O’Mahony, A.M.; Wang, J.; del Valle, M. Simultaneous identification and quantification of nitro-containing explosives by advanced chemometric data treatment of cyclic voltammetry at screen-printed electrodes. Talanta 2013, 107, 270–276. [Google Scholar] [CrossRef] [PubMed]
- De Carvalho, R.M.; Mello, C.; Kubota, L.T. Simultaneous determination of phenol isomers in binary mixtures by differential pulse voltammetry using carbon fibre electrode and neural network with pruning as a multivariate calibration tool. Anal. Chim. Acta 2000, 420, 109–121. [Google Scholar] [CrossRef]
- Zeravik, J.; Hlavacek, A.; Lacina, K.; Skládal, P. State of the art in the field of electronic and bioelectronic tongues–towards the analysis of wines. Electroanalysis 2009, 21, 2509–2520. [Google Scholar] [CrossRef]
- Esteban, M.; Ariño, C.; Díaz-Cruz, J. Chemometrics for the analysis of voltammetric data. TrAC Trends in Anal. Chem. 2006, 25, 86–92. [Google Scholar] [CrossRef]
- Mallat, S.G. A theory for multiresolution signal decomposition: The wavelet representation. IEEE Trans. Pattern Anal. Mach. Intell. 1989, 11, 674–693. [Google Scholar] [CrossRef]
- Alegret, S.; Alonso, J.; Bartroli, J.; Céspedes, F.; MartinezFabregas, E.; del Valle, M. Amperometric biosensors based on bulk-modified epoxy graphite biocomposites. Sens. Mater. 1996, 8, 147–153. [Google Scholar]
- Gutés, A.; Calvo, D.; Céspedes, F.; del Valle, M. Automatic sequential injection analysis electronic tongue with integrated reference electrode for the determination of ascorbic acid, uric acid and paracetamol. Microchim. Acta 2007, 157, 1–6. [Google Scholar] [CrossRef]
- Cetó, X.; Gutiérrez, J.M.; Moreno-Barón, L.; Alegret, S.; del Valle, M. Voltammetric electronic tongue in the analysis of cava wines. Electroanalysis 2011, 23, 72–78. [Google Scholar] [CrossRef]
- Cetó, X.; Céspedes, F.; Pividori, M.I.; Gutiérrez, J.M.; del Valle, M. Resolution of phenolic antioxidant mixtures employing a voltammetric bio-electronic tongue. Analyst 2012, 137, 349–356. [Google Scholar] [CrossRef] [PubMed]
- Enache, T.A.; Oliveira-Brett, A.M. Phenol and para-substituted phenols electrochemical oxidation pathways. J. Electroanal. Chem. 2011, 655, 9–16. [Google Scholar] [CrossRef]
- El Mhammedi, M.; Achak, M.; Bakasse, M.; Chtaini, A. Electrochemical determination of para-nitrophenol at apatite-modified carbon paste electrode: Application in river water samples. J. Hazard. Mater. 2009, 163, 323–328. [Google Scholar] [CrossRef] [PubMed]
- Despagne, F.; Massart, D.L. Neural networks in multivariate calibration. Analyst 1998, 123, 157R–178R. [Google Scholar] [CrossRef] [PubMed]
- Hanrahan, G. Computational neural networks driving complex analytical problem solving. Anal. Chem. 2010, 82, 4307–4313. [Google Scholar] [CrossRef] [PubMed]
Figure 1.
Chemical structures of picric acid, 2,4-dinitrophenol, and 4-nitrophenol.

Figure 2.
Scheme of the strategy followed in the resolution of nitrophenol-related compounds.
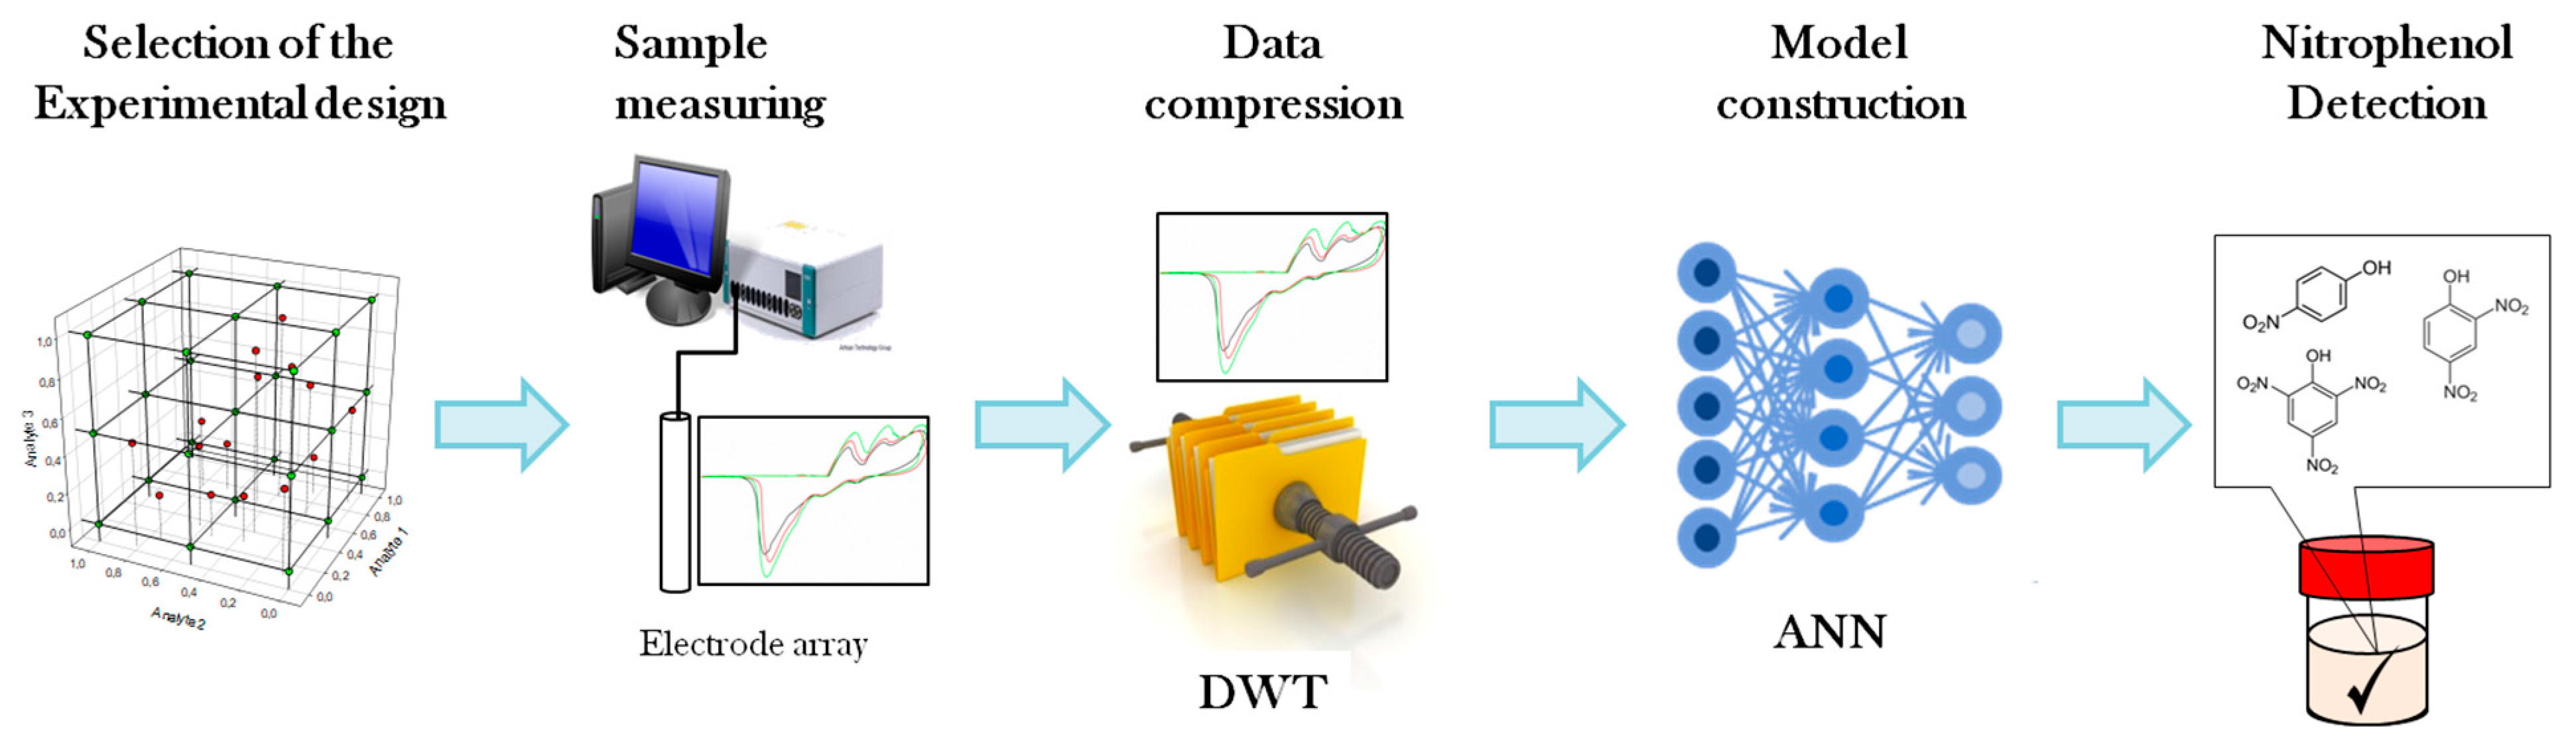
Figure 3.
Representation of the full factorial experimental design employed, training samples (●, red circles), and test samples (●, green circles).
Figure 3.
Representation of the full factorial experimental design employed, training samples (●, red circles), and test samples (●, green circles).
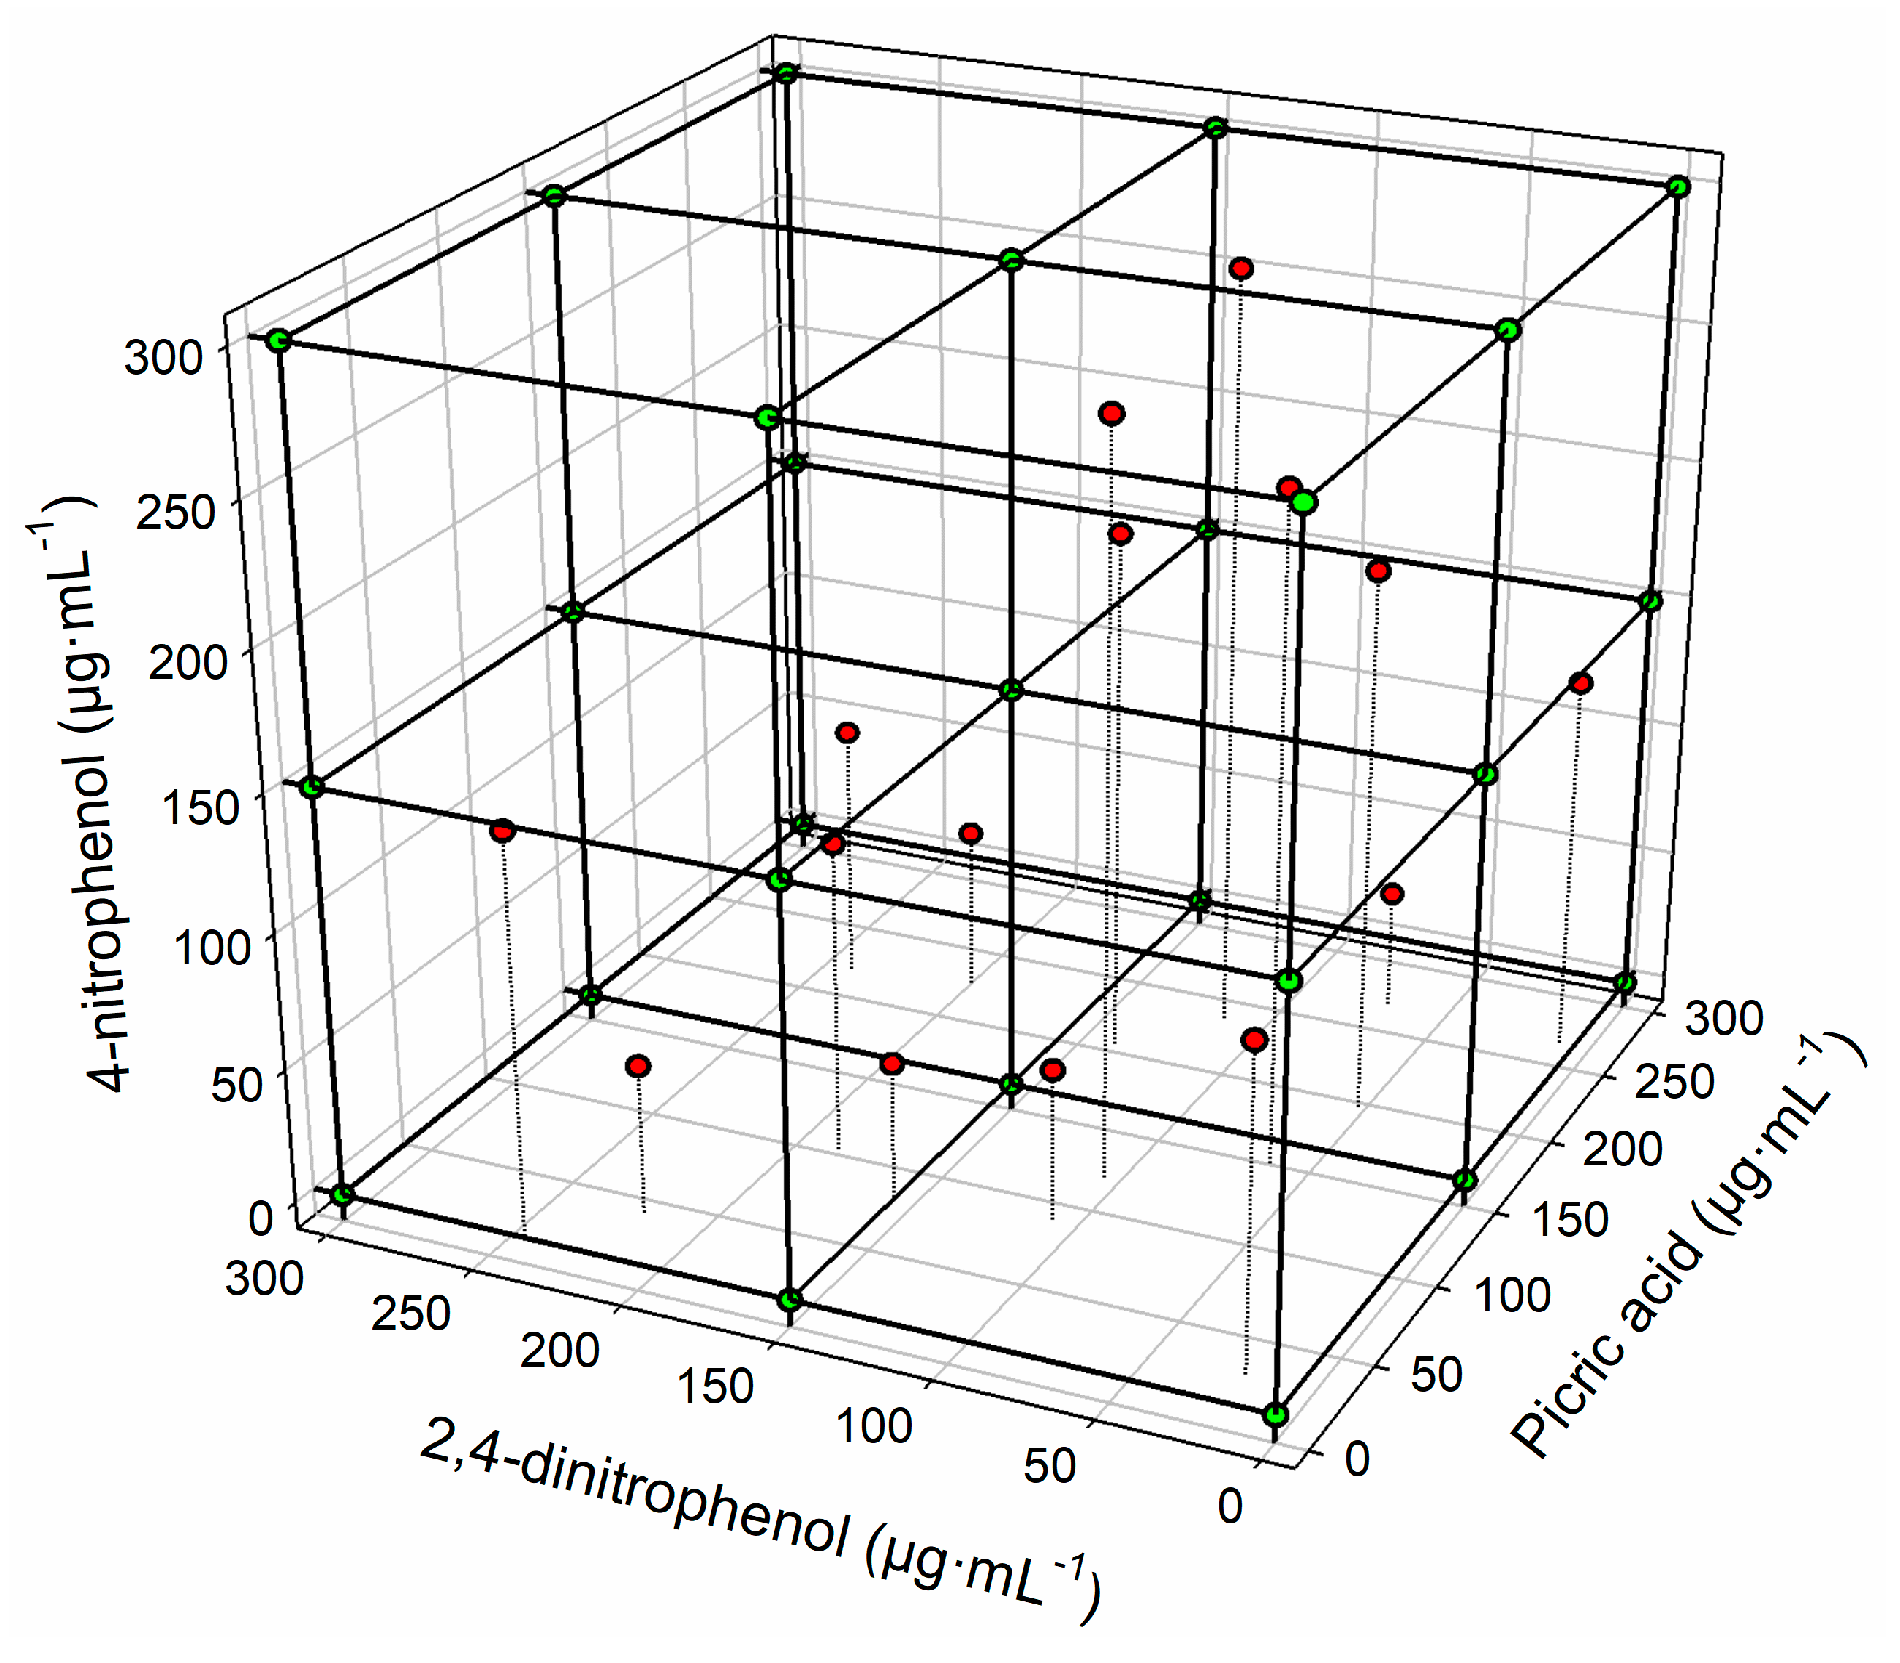
Figure 4.
Reconstruction of the first 5 compression levels versus the original signal for cyclic voltammogram measured with the Ag electrode.
Figure 4.
Reconstruction of the first 5 compression levels versus the original signal for cyclic voltammogram measured with the Ag electrode.
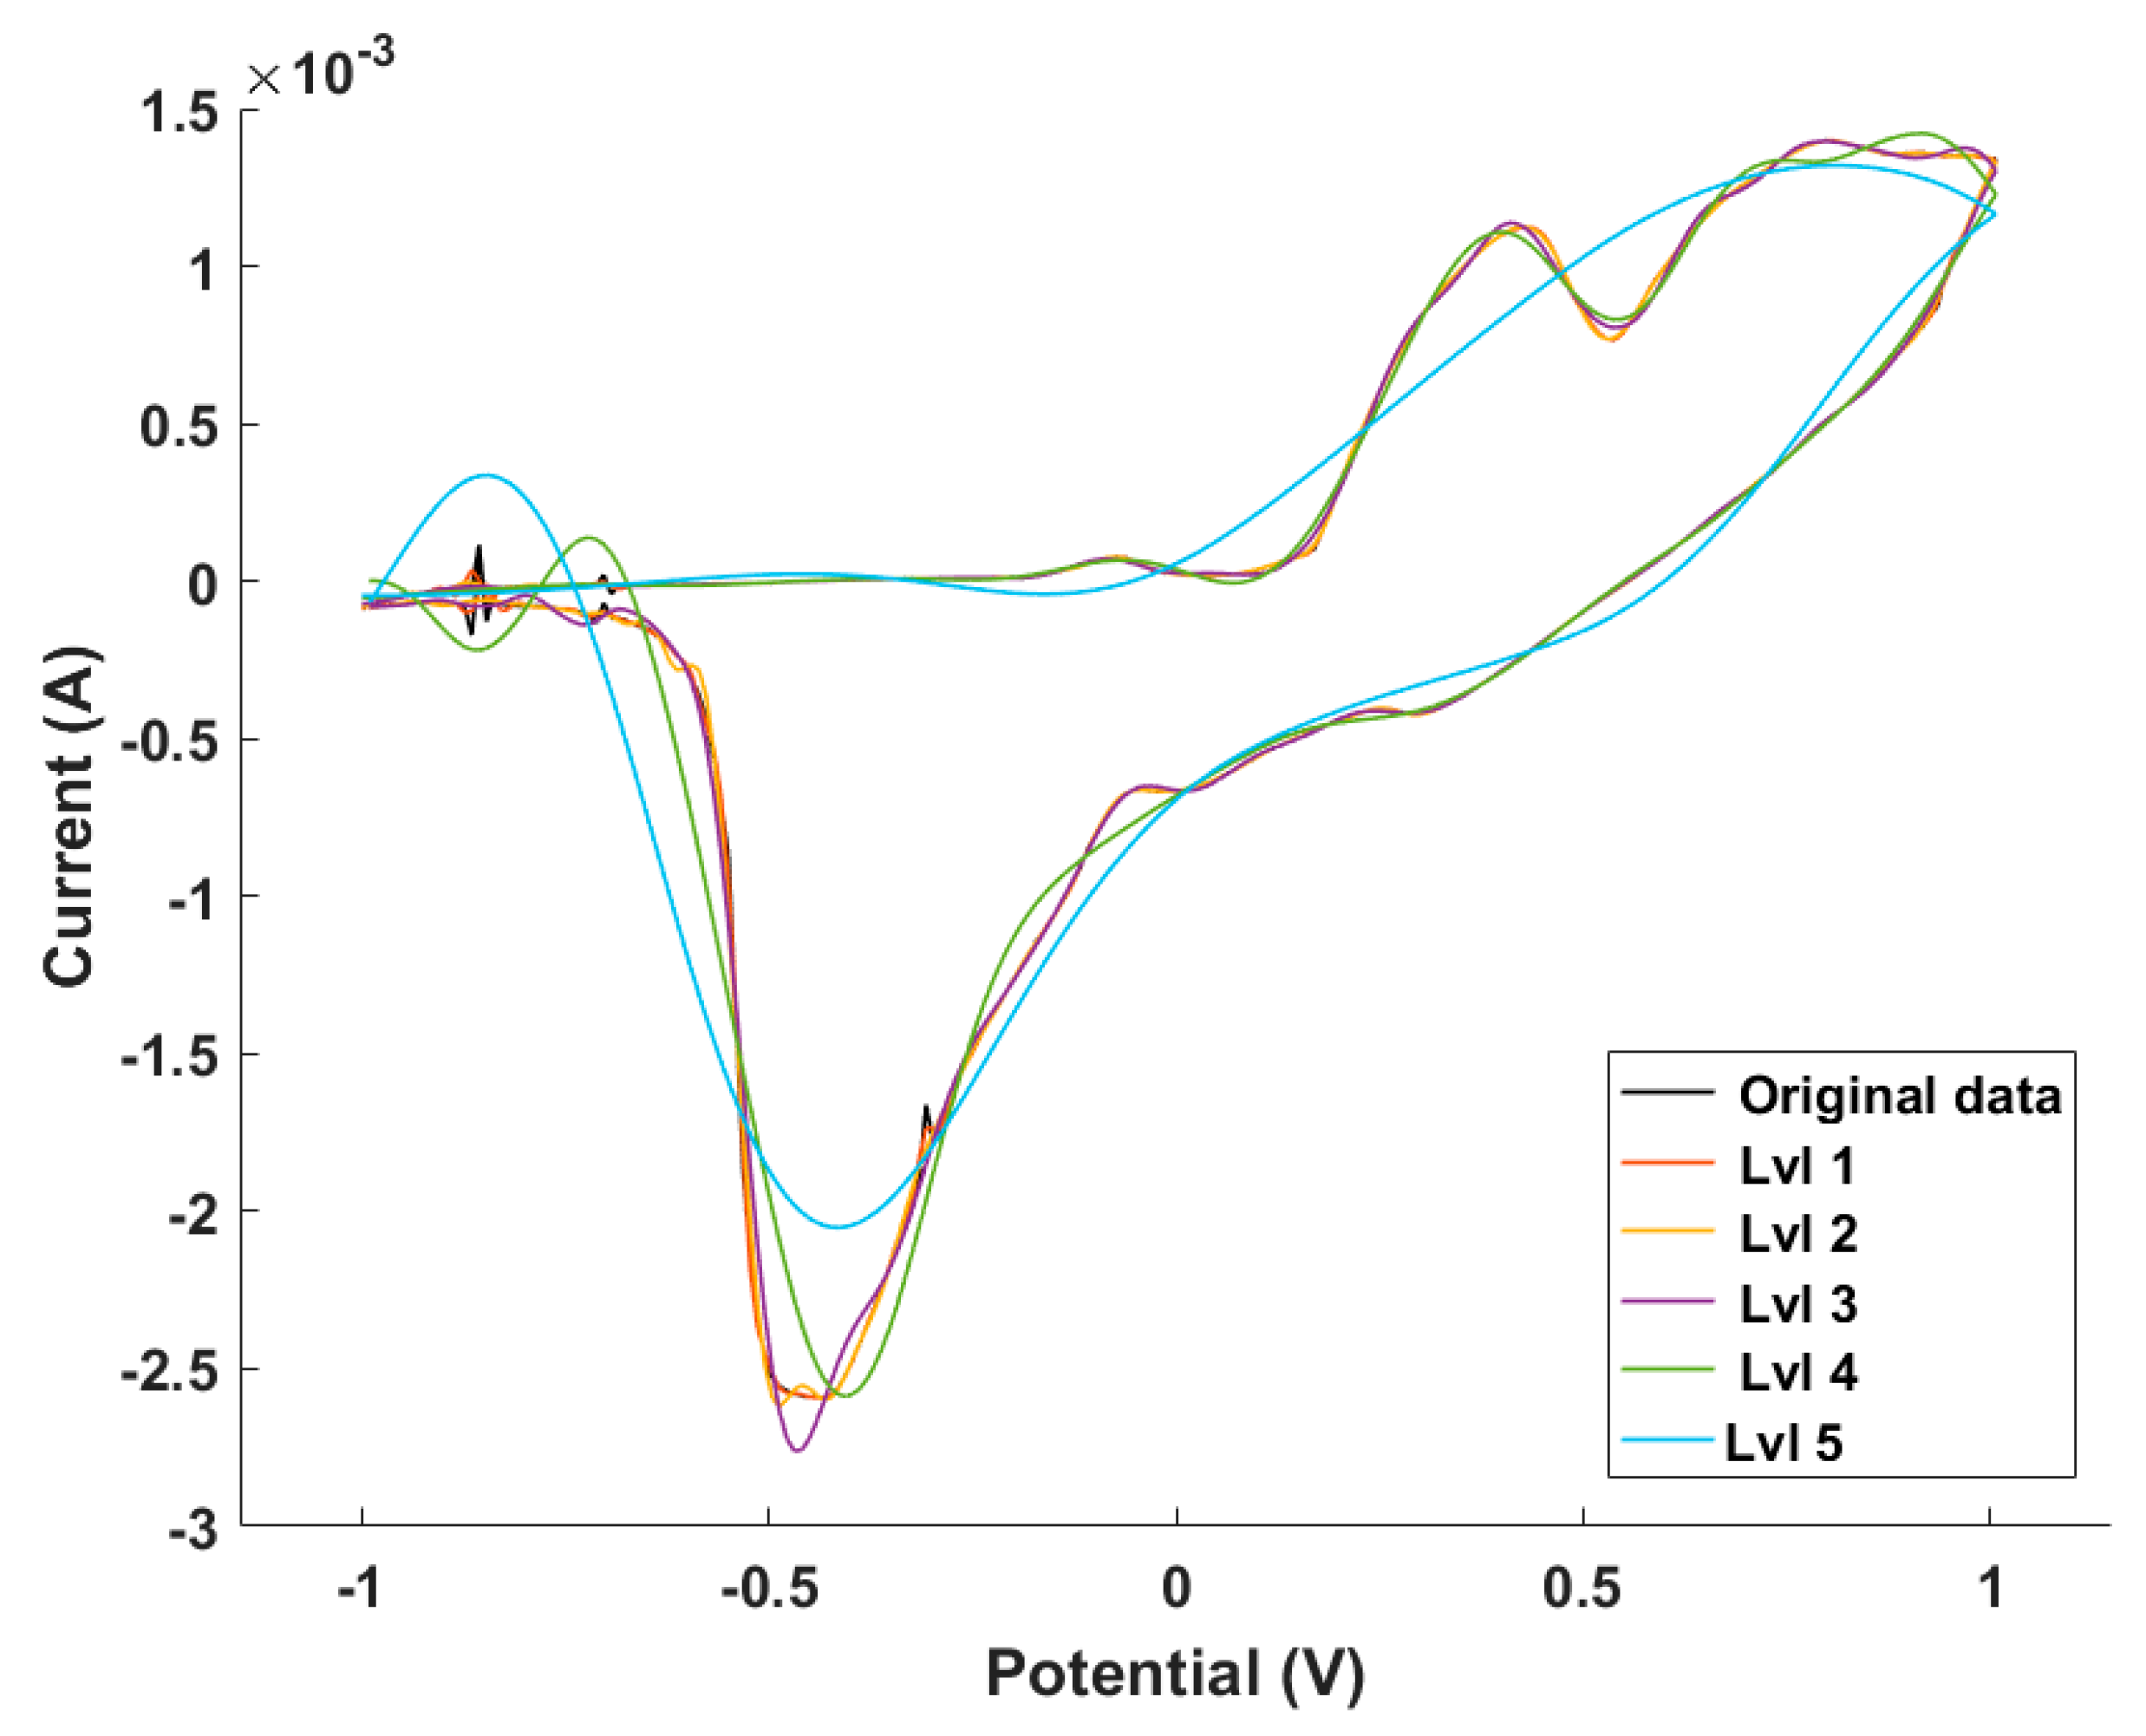
Figure 5.
Cyclic voltammograms of picric acid (green), 2,4-dinitrophenol (black), and 4-nitrophenol (red), 50 μg·mL−1 individual solutions with (A) Ag electrode; (B) epoxy graphite electrode; (C) gold electrode; and (D) platinum electrode.
Figure 5.
Cyclic voltammograms of picric acid (green), 2,4-dinitrophenol (black), and 4-nitrophenol (red), 50 μg·mL−1 individual solutions with (A) Ag electrode; (B) epoxy graphite electrode; (C) gold electrode; and (D) platinum electrode.

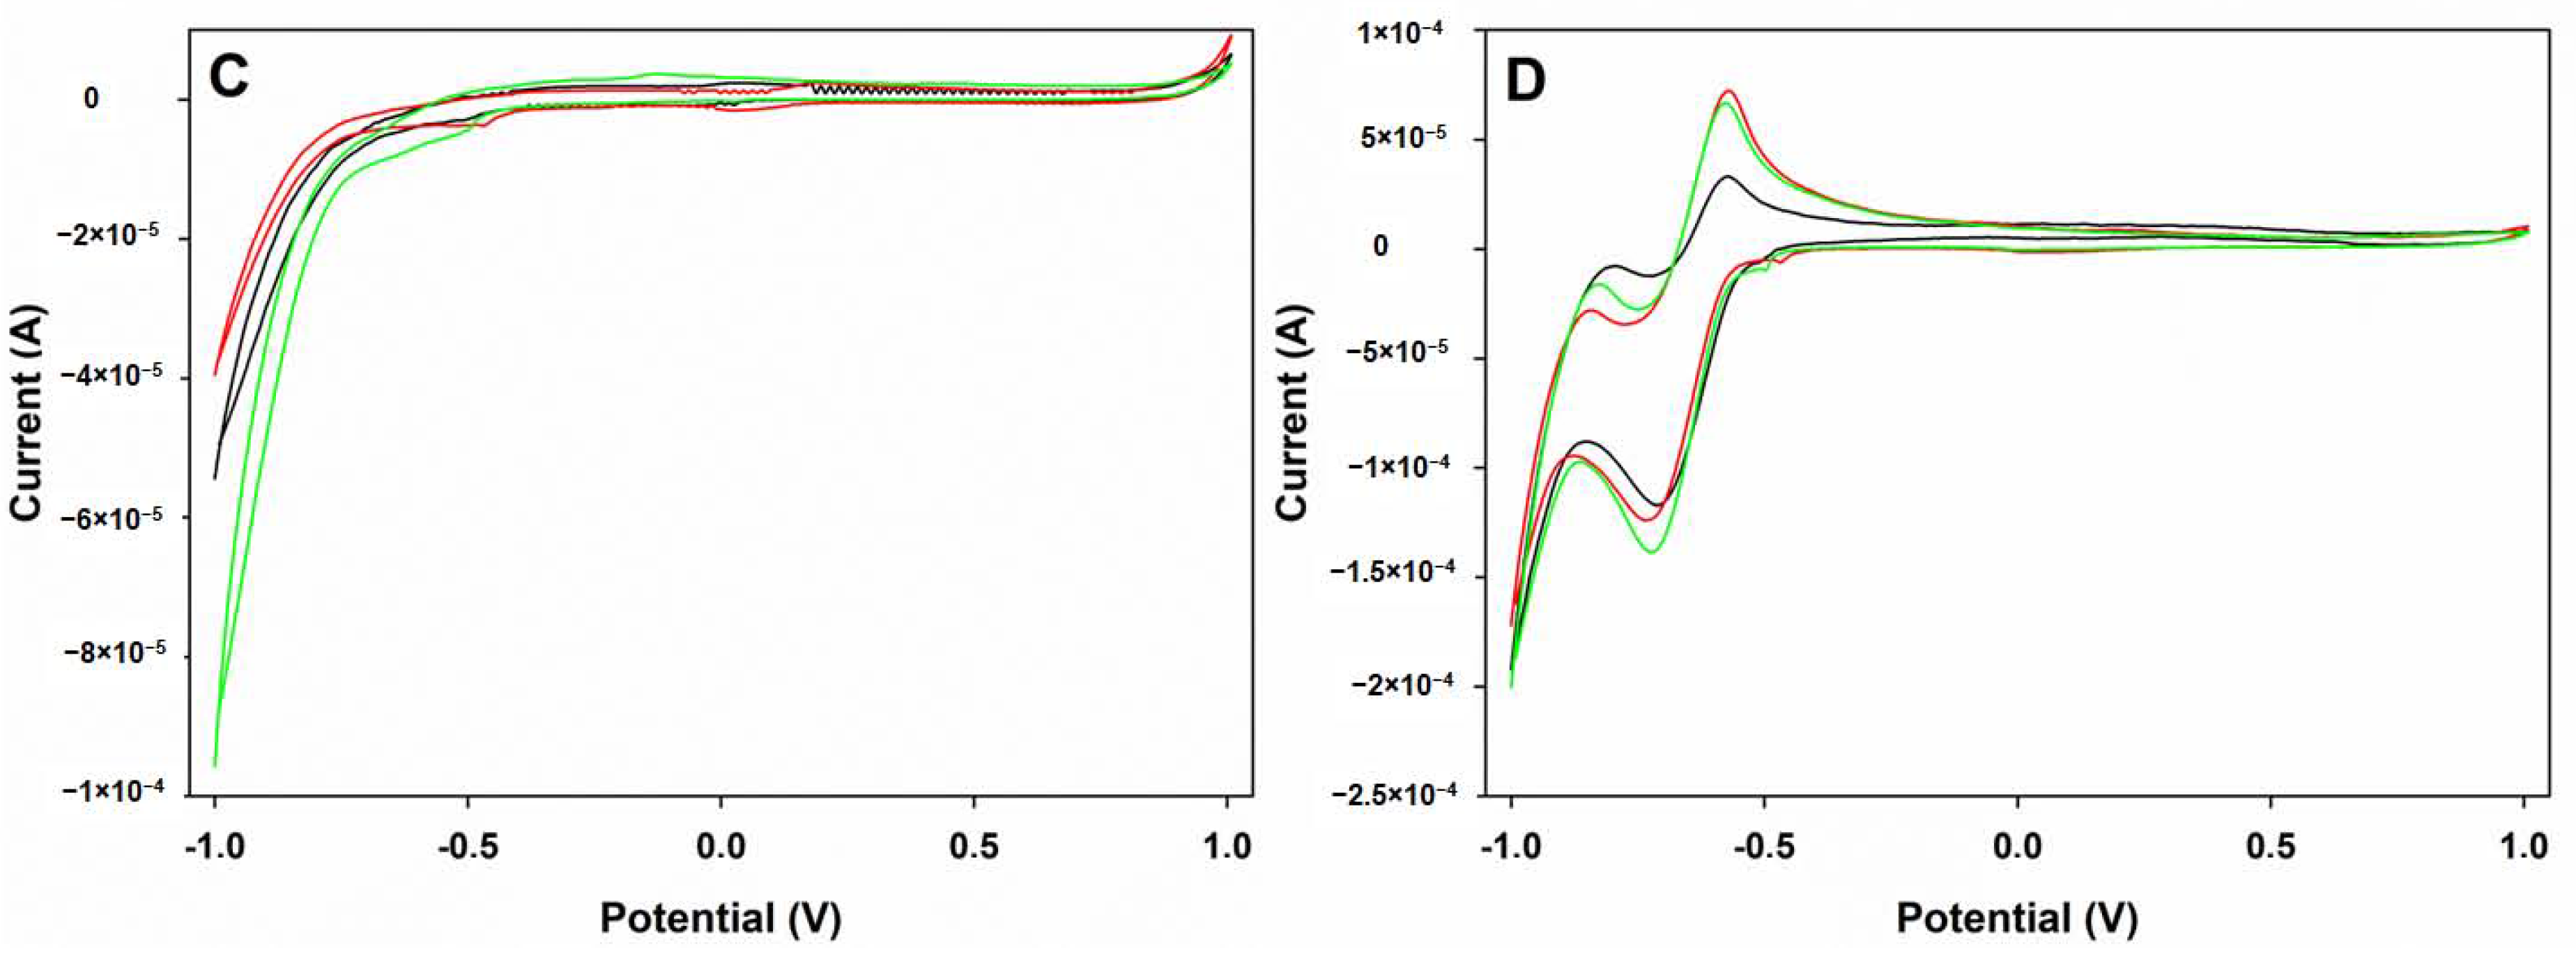
Figure 6.
Normalized root mean square error (NRMSE) obtained for each transfer function combination and neurons in the hidden layer.
Figure 6.
Normalized root mean square error (NRMSE) obtained for each transfer function combination and neurons in the hidden layer.
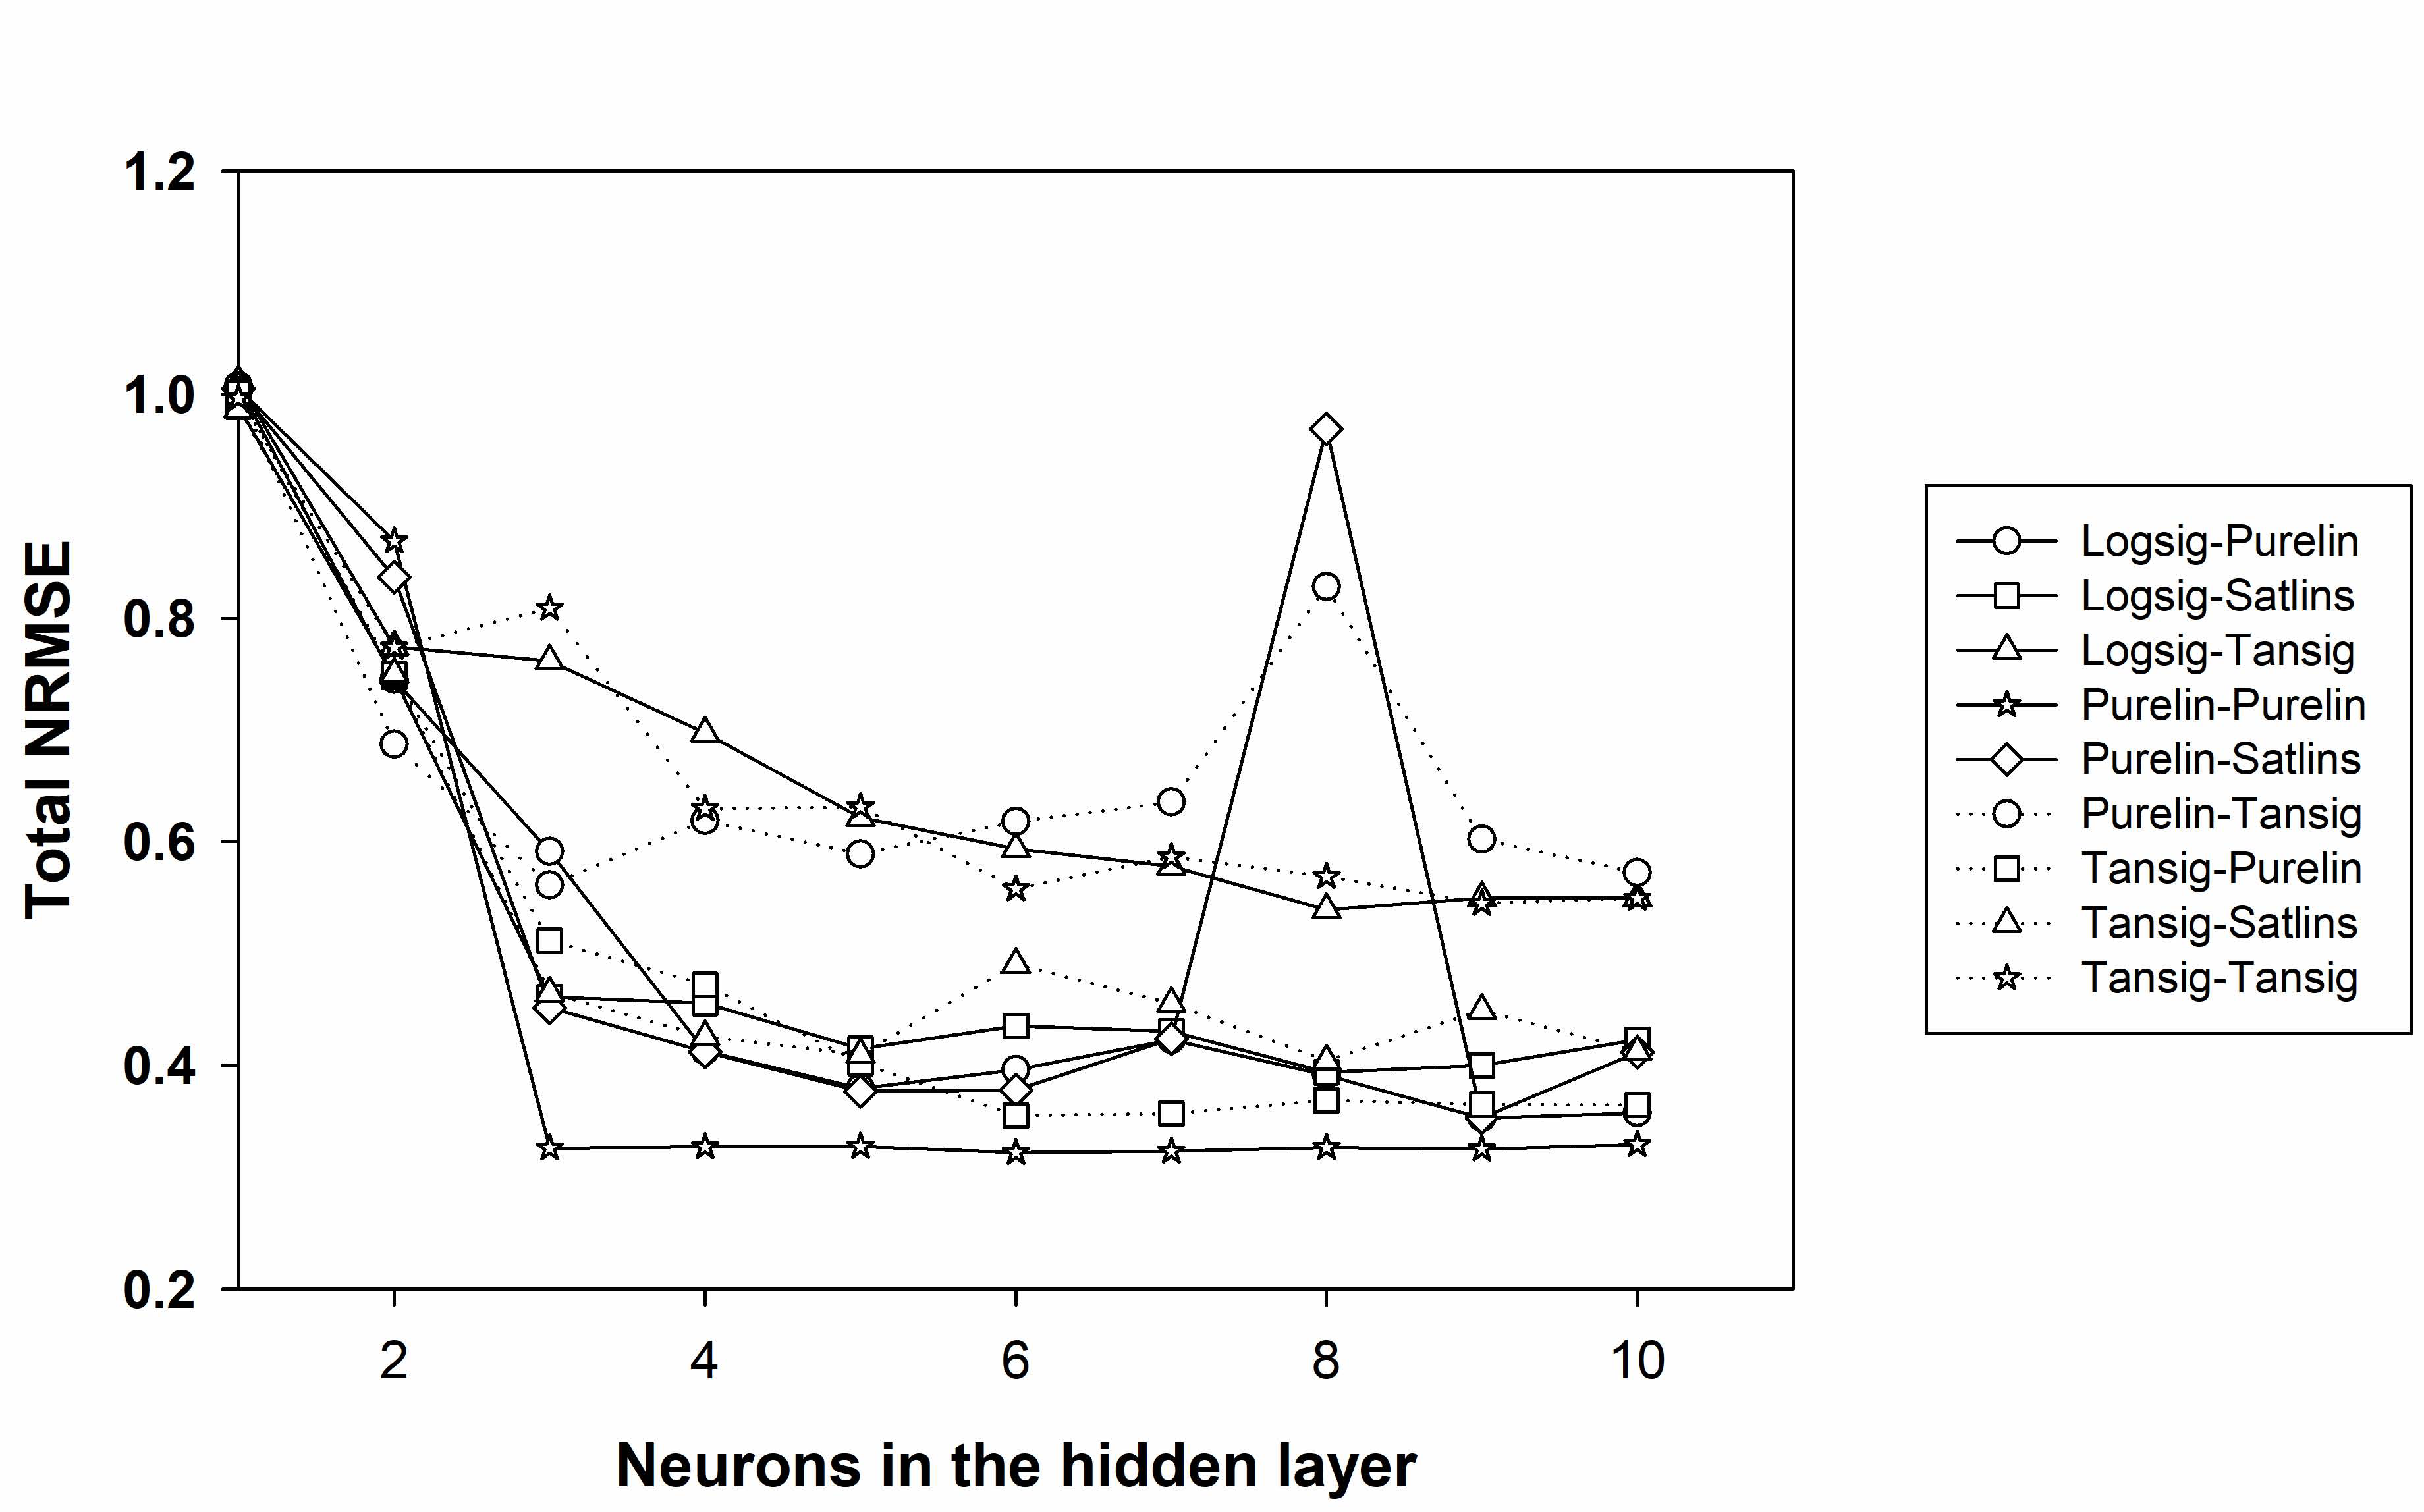
Figure 7.
Obtained vs. expected concentrations plots for the training set (black points and dashed line) and the testing set (white points and solid line) for (A) picric acid; (B) 2,4-dinitrophenol; and (C) 4-nitrophenol.
Figure 7.
Obtained vs. expected concentrations plots for the training set (black points and dashed line) and the testing set (white points and solid line) for (A) picric acid; (B) 2,4-dinitrophenol; and (C) 4-nitrophenol.

Table 1.
Results of the fitted regression curves for obtained vs. expected values, for the training and testing subsets of samples and the three considered nitrophenols (intervals calculated at the 95% confidence level).
Table 1.
Results of the fitted regression curves for obtained vs. expected values, for the training and testing subsets of samples and the three considered nitrophenols (intervals calculated at the 95% confidence level).
| Set | Analyte | r | Slope | Intercept (mg·L−1) | NRMSE | Total NRMSE |
|---|---|---|---|---|---|---|
| Training Set | picric acid | 0.998 | 0.959 ± 0.027 | 6.3 ± 5.2 | 0.032 | 0.030 |
| 2,4-dinitrophenol | 0.998 | 0.961 ± 0.027 | 5.8 ± 10.4 | 0.032 | ||
| 4-nitrophenol | 0.998 | 0.952 ± 0.021 | 7.1 ± 4.0 | 0.029 | ||
| Testing Set | picric acid | 0.983 | 0.983 ± 0.161 | 4.6 ± 26.0 | 0.073 | 0.076 |
| 2,4-dinitrophenol | 0.948 | 1.012 ± 0.222 | 6.7 ± 30.2 | 0.087 | ||
| 4-nitrophenol | 0.973 | 1.013 ± 0.160 | 4.4 ± 26.0 | 0.073 |
NRMSE: normalized root mean square error.
Table 2.
Compound concentrations found using the graphite epoxy composite electrode (single sensor approach) and the ET model for 5 water samples.
Table 2.
Compound concentrations found using the graphite epoxy composite electrode (single sensor approach) and the ET model for 5 water samples.
| Sample | Expected Concentration (μg·mL−1) | Single Sensor Concentration (μg·mL−1) | ET Concentration (μg·mL−1) | ||||||
|---|---|---|---|---|---|---|---|---|---|
| picric acid | 2,4-dinitro-phenol | 4-nitro-phenol | picric acid | 2,4-dinitro-phenol | 4-nitro-phenol | picric acid | 2,4-dinitro-phenol | 4-nitro-phenol | |
| 1 | 102 | 186 | 107 | 275 | 151 | 110 | 109 | 210 | 81 |
| 2 | 11.1 | 244 | 141 | 392 | 222 | 26 | 12.9 | 219 | 139 |
| 3 | 265 | 9.9 | 131 | 208 | 67 | 8.1 | 245 | 11.7 | 163 |
| 4 | 204 | 138 | 187 | 362 | 196 | 73 | 187 | 132 | 227 |
| 5 | 81 | 157 | 42 | 270 | 148 | 49 | 84 | 205 | 40 |
© 2018 by the authors. Licensee MDPI, Basel, Switzerland. This article is an open access article distributed under the terms and conditions of the Creative Commons Attribution (CC BY) license (http://creativecommons.org/licenses/by/4.0/).
Share and Cite
MDPI and ACS Style
González-Calabuig, A.; Cetó, X.; Del Valle, M. A Voltammetric Electronic Tongue for the Resolution of Ternary Nitrophenol Mixtures. Sensors 2018, 18, 216. https://doi.org/10.3390/s18010216
AMA Style
González-Calabuig A, Cetó X, Del Valle M. A Voltammetric Electronic Tongue for the Resolution of Ternary Nitrophenol Mixtures. Sensors. 2018; 18(1):216. https://doi.org/10.3390/s18010216
Chicago/Turabian StyleGonzález-Calabuig, Andreu, Xavier Cetó, and Manel Del Valle. 2018. "A Voltammetric Electronic Tongue for the Resolution of Ternary Nitrophenol Mixtures" Sensors 18, no. 1: 216. https://doi.org/10.3390/s18010216
Note that from the first issue of 2016, this journal uses article numbers instead of page numbers. See further details here.