Detection of Ultrasonic Stress Waves in Structures Using 3D Shaped Optic Fiber Based on a Mach–Zehnder Interferometer


1
School of Civil and Resource Engineering, University of Science & Technology Beijing, Beijing 100083, China
2
Key Lab of Structures Dynamic Behavior and Control of the Ministry of Education, Harbin Institute of Technology, Harbin 150090, China
3
Key Lab of Smart Prevention and Mitigation of Civil Engineering Disasters of the Ministry of Industry and Information Technology, Harbin Institute of Technology, Harbin 150090, China
4
School of Civil Engineering, Harbin Institute of Technology, Harbin 150090, China
*
Author to whom correspondence should be addressed.
Sensors 2018, 18(4), 1218; https://doi.org/10.3390/s18041218
Submission received: 18 March 2018
/
Revised: 11 April 2018
/
Accepted: 13 April 2018
/
Published: 16 April 2018
(This article belongs to the Special Issue Ultrasonic Sensors 2018)
Abstract
:This work proposes a 3D shaped optic fiber sensor for ultrasonic stress waves detection based on the principle of a Mach–Zehnder interferometer. This sensor can be used to receive acoustic emission signals in the passive damage detection methods and other types of ultrasonic signals propagating in the active damage detection methods, such as guided wave-based methods. The sensitivity of an ultrasonic fiber sensor based on the Mach–Zehnder interferometer mainly depends on the length of the sensing optical fiber; therefore, the proposed sensor achieves the maximum possible sensitivity by wrapping an optical fiber on a hollow cylinder with a base. The deformation of the optical fiber is produced by the displacement field of guided waves in the hollow cylinder. The sensor was first analyzed using the finite element method, which demonstrated its basic sensing capacity, and the simulation signals have the same characteristics in the frequency domain as the excitation signal. Subsequently, the primary investigations were conducted via a series of experiments. The sensor was used to detect guided wave signals excited by a piezoelectric wafer in an aluminum plate, and subsequently it was tested on a reinforced concrete beam, which produced acoustic emission signals via impact loading and crack extension when it was loaded to failure. The signals obtained from a piezoelectric acoustic emission sensor were used for comparison, and the results indicated that the proposed 3D fiber optic sensor can detect ultrasonic signals in the specific frequency response range.
1. Introduction
Ultrasonic stress waves, either passive acoustic emission signals or active guided waves, propagating in a structure can be employed to interpret the structural status, especially to detect small structural damage, such as debonding, lamination, crack, corrosion, etc. Over the past few decades, the corresponding methods and techniques have also been proven effective and promising in a variety of metal, composite, concrete and other materials and structures [1,2,3,4,5,6,7,8]. Ultrasonic stress waves, generated by either transducers or a rapid release of energy within a stressed material, are often at a fairly high frequency, from several tens of kHz to approximately several MHz. These waves are captured usually by ultrasonic transducers, including piezoelectric wafers [7,9,10], magnetostrictive sensors [11,12], electromagnetic acoustic transducers (EMAT) [13], macro-fiber composites [14,15], etc. The aforementioned ultrasonic transducers are used to convert mechanical energy into electric or magnetic energy; therefore, they are more easily affected by electromagnetic interference. Moreover, they also suffer from distinct disadvantages, such as a larger footprint, and a lack of capability for continuous or long-term performance monitoring, such as corrosion-resistant and electrical stability. Recently, the developments in fiber optic sensors (FOSs) have provided an excellent substitution because optical fiber sensors have very small dimensions and are lightweight; they can be embedded unobtrusively within structures; they have a wide range of operating temperatures and are capable of transmitting a signal over a long distance; significantly, they resist the corrosion and are immune to electromagnetic interference [16].
A variety of optical sensing technologies have been developed over the years [17,18,19,20,21,22], and conventional FOSs are generally used to measure single-point or distributed strain [23] and temperature in the low frequency range, which is often lower than kHz. However, by using phase demodulation methods, FOSs can detect an ultrasonic signal with fairly high frequency, which is from several kHz to several MHz. This frequency range is usually used by ultrasonic guided waves based or acoustic emission methods for damage detection in civil, mechanical or aerospace structures. In 1977, Bucaro et al. [24] of the U.S. Naval Research Laboratory demonstrated the possibility of using an optical fiber to sense an acoustic field, which was produced by exciting a piezoelectric plate with a sinusoidal signal in a water-filled tank. Experiments were carried out over the 40–400 kHz frequency range. Gachagan et al. [25,26] proposed a condition monitoring system that used a fiber-optic sensor. Two groups of optical fibers were embedded across the composite plate, and a 633 nm Mach–Zehnder interferometer was used to demodulate the acoustic signal, which was a Lamb wave propagating in the plate. Using this system, a delamination through the thickness of the composite plate was localized by analyzing reflected Lamb waves successfully in the laboratory. These experimental results can be considered as a fundamental basis for structure health monitoring using the Mach–Zehnder interferometer-based ultrasonic FOSs (UFOSs). The fiber-optic sensor based on Mach–Zehnder can be also the distributed one [27], which has been used to detect leakage in the long pipeline. In addition, using a Mach–Zehnder interferometer on different structures, other demodulation techniques are also employed for detecting ultrasonic elastic signals [28], such as Michelson interferometers [29,30], Fabry–Perot interferometers [31,32], Sagnac interferometers [33], and Fiber Bragg Grating [34], or methods based on the Doppler effect of light wave transmission in an optical fiber [35,36]. It should be noted that a considerable part of the sensors above were used to detect acoustic emission signals.
In the aforementioned modulation techniques, the sensitivity of the UFOSs is closely related to the effective length of the UFOS; the larger the L, the larger the sensitivity. In early experiments, an optical fiber was attached to the structural surface or embedded within the structure along the whole dimension as a line. This layout first leads to the directionality of UFOSs; second, it cannot be used to estimate the source location even if two optical fibers were used, since they measure a line rather the the single point. Another method is the use of the circular loop UFOS, which can obtain higher sensitivity with a smaller area [36,37]. Its sensitivity can be controlled by changing the radius and number of turns, and the circular UFOS is not directional. However, in order to achieve further improved sensitivity, the circular UFOS will require a significantly large footprint. Additionally, in engineering practices, especially for the civil engineering structures, the sensor should be attached to the structural surface, which is often not well-prepared for reliable measurement. Recently, a fiber-optic ring sensor was presented by Wei et al. [38]. The optical fiber was around the acrylic cylindrical skeleton. It can be analyzed that the resonant frequency of the sensor is related to the resonant frequency of the skeleton, which is high for the solid one. In addition, this work was demonstrated on only a small aluminum plate for acoustic emission detection.
In this work, a 3D shaped optic fiber sensor, which is a hollow metal cylinder wrapped in optical fibers, is proposed to detect the ultrasonic stress waves. The metal hollow cylinder will be attached to the testing surface using different couplants, such as grease or superglue. In this case, removing the sensor from the structural surface will not damage the optical fiber. Moreover, this sensor may be designed by changing the geometric parameters and material, and provides the lesser and designable resonant frequency range.
In the remaining part of this paper, the basic working principle of a Mach–Zehnder interferometer will be presented first. Subsequently, a finite element analysis with thin aluminum plates using the proposed sensor is performed in detail to examine the feasibility of ultrasonic signal measurement. Finally, in order to explore the characteristics of the proposed sensor further, it is applied on the aluminum and reinforced concrete beam, respectively. The setups and results of the experimental test program will be presented and discussed. The damage progress in a concrete beam was monitored during a four-point bending test and acoustic emissions were detected using the proposed sensor and a piezoelectric (PZT) wafer for comparison.
2. Mach–Zehnder Interferometer and the Fiber Optic Sensor
2.1. The Principle of Mach–Zehnder Interferometers
The pressure of the ultrasonic stress signal may induce optical phase modulation within the optical fiber sensor bonded or embedded in the structures. The phase change can be demodulated using a Mach–Zehnder interferometer, whose principle is presented schematically in Figure 1. It is used to determine the relative phase shift variations between two light beams in two optical fibers, which are derived by splitting light from the same light source and, thus, they have exactly the same initial phase. In case the light propagating in one optical fiber is disturbed by the ultrasonic stress signal, the phase change can be converted by the photodetector and then collected using a digital oscilloscope. It should be noted that a polarization controller and variable optical attenuator are not included on the reference arm, which would be useful to maximize a detector’s sensitivity, since this is a demonstration only.
The strain induced by the ultrasonic stress waves will lead to an optical phase shift in the sensing arm. In general, the relative phase change can be expressed using three strain components [39]:
where is the propagation constant of a single mode, , is a free-space propagation constant, and n is the core index of the optical fiber. Furthermore, L is the length of the optical fiber; is the strain in the direction of light propagation, i.e., the longitudinal direction of the optical fiber; and are the transverse strain, i.e., the radial direction of the optical fiber; , , and are the elements of the strain-optic tensor for a homogeneous isotropic material. When the sensing arm is bonded onto the surface of the structure by an adhesive, the sensitivity of the phase change to these strains is expressed as [37]:
where v is the Poisson’s ratio of the optical fiber.
2.2. The 3D Shaped Ultrasonic Fiber Optic Sensor
The aforementioned equations demonstrate that the sensitivity of the UFOSs based on a Mach–Zehnder interferometer is highly dependent on the length of the optical fiber. In this work, to obtain as large a response from the sensor as possible, the optical fiber is wrapped around a hollow cylinder with a base, as shown in Figure 2. With this shape, the sensor sensitivity increases, while its coverage is kept constant.
In this sensor, the optical fiber is not exposed to the structure directly, but receives the ultrasonic signals through the coupling between the hollow cylinder and the object structure, as indicated in Figure 3, which shows the guided wave case. Actually, in the object structure, ultrasonic stress waves can be not only guided waves but also bulk waves, surface waves , etc. In the interface between the hollow cylinder and the object structure, ultrasonic stress waves can be considered as asymmetric displacements applied on the hollow cylinder, even if they are the symmetric mode in the plate. Along the axial direction of the hollow cylinder, there are three guided wave modes, i.e. longitudinal mode (L mode), torsional mode (T mode), and flexural mode (F mode) [40]. The first two modes can be excited by the symmetric loading. In this work, guided waves propagating in the hollow cylinder will be F mode, since the excitation is asymmetric. The hollow cylinder is very short, and then the F mode guided waves reflect repeatedly. The displacement field on the surface of the hollow cylinder complies with the analytic wave equations of guided wave along the axial direction. Similarly, the deformation of the coiled optical fiber is produced due to the coupling between the fiber and the surface of the hollow cylinder. According to the theory of ultrasonic guided waves in the hollow cylinder, the displacement components related to the deformation of the optical fiber are the radial and circumferential ones, and , which can be obtained analytically for the single guided wave mode. The length change for single loop can be obtained through the curvilinear integral. Thus, the total relative phase change of the optical fiber with m loops is
However, in case of multiple wave reflections, this problem is difficult to analyze theoretically. However, it can still be concluded that the energy into the hollow cylinder is dependent on the diameter of the hollow cylinder and the wavelength. A smaller stiffness of the cylinder wall results in a lower resonant frequency and a larger response; therefore, the response of the optical fiber is also dependent on the stiffness of the cylinder wall. Notably, when the optical fiber bends too much, there will be a large optical power less; therefore, a small diameter of the hollow cylinder is avoided. An appropriate diameter is used in this work.
In addition, in regard to the signal characteristics in the frequency domain, the ultrasonic signals are reflected repeatedly within the hollow cylinder, which results in complicated overlapping signals; however, it is fairly easy to demonstrate that the main frequency characteristic is not affected significantly, as shown in Equations (4) and (5):
where is a narrow-band signal, which is used widely in guided ultrasonic wave applications. is the amplitude in the frequency domain:
where is the scale factor of the amplitude, and is the time delay for each ultrasonic signal. The sum in the above equation indicates the superposition of all signals, which have different amplitudes and different arrival time, in the time domain. Equation (5) gives the amplitude in the frequency domain of the overlapping signal. It shows that has a similar predominant frequency to .
3. Feasibility Analysis Using the Finite Element Model
Finite element analyses were first conducted on a metallic plate to explore the basic sensing ability of the proposed sensor. A plate (200 mm × 160 mm × 1.6 mm) was modeled as aluminum material using a SOLID185 element with ANSYS. Two square-shaped piezoelectric wafers (4 mm × 4 mm), modeled using a SOLID5 element, were bonded onto both the upper and lower surfaces and the exact same position, working as actuators, which can generate a single mode Lamb wave propagating in the plate by applying symmetric or anti-symmetric electric fields. An aluminum hollow cylinder with a base, an outer radius of 5 mm, and an inner radius of 4.6 mm represents the proposed sensor, which was only used to demonstrate the wave scattering; therefore, there is no optical fiber surrounding it. The proposed sensor was placed 60 mm away from the actuator. Figure 4 shows the size of the plate and the layout of the piezoelectric actuator and the proposed sensor.
The narrow-band excitation signal was a 5-cycle sinusoid tone burst, defined by Equation (6), with a fixed center frequency of 160 kHz, as shown in Figure 5.
where A is the amplitude, Heaviside step function, the center frequency of the wave, and is the number of the signal cycles, and in this work. With two piezoelectric actuators applying an anti-symmetric electric field, only the omnidirectional mode of a Lamb wave was generated. This can reduce complexity of the guided waves propagating in the plate. Figure 6 shows the in-plane displacement component u contour on the surfaces of the plate and the round tube at the time 40 μs. The guided waves scattering from the plate through the strong coupling between them and propagating on the round tube are clearly visible in Figure 6b. Behind the sensor, most of the energy continues to propagate towards the plate edge.
For the mode of a Lamb wave, the out-of-plane displacement component w in the z-direction is dominant, so the values of displacement components w on the surface of the small tube are extracted and plotted in Figure 7a. The arrival time of the guided wave signal fits well with the value calculated according to the theoretical value, which is shown as a dotted red line in Figure 7a. Owing to the multiple reflections and mode conversions of the ultrasonic waves in the small round tube, after the first major wave packet, the other wave packets cannot be recognized individually. Thus, the single wave packet of a Lamb wave is hardly recognized. From this point of view, the signals received by this UFOS do not reflect the actual shape of the ultrasonic stress waves. However, according to Equation (5), the superposition of multiple packets does not change the frequency characteristic of signals. Figure 7b shows the frequency spectra of the excitation signal and the signal received by UFOS. It can be observed that the signal received by the UFOS can be still considered as the narrow-band, and the main frequency components are contained within the frequency spectrum of the excitation signal. All results obtained from finite element analysis indicate the mechanism and feasibility of the proposed sensor.
4. Experimental Investigations on the Specimens
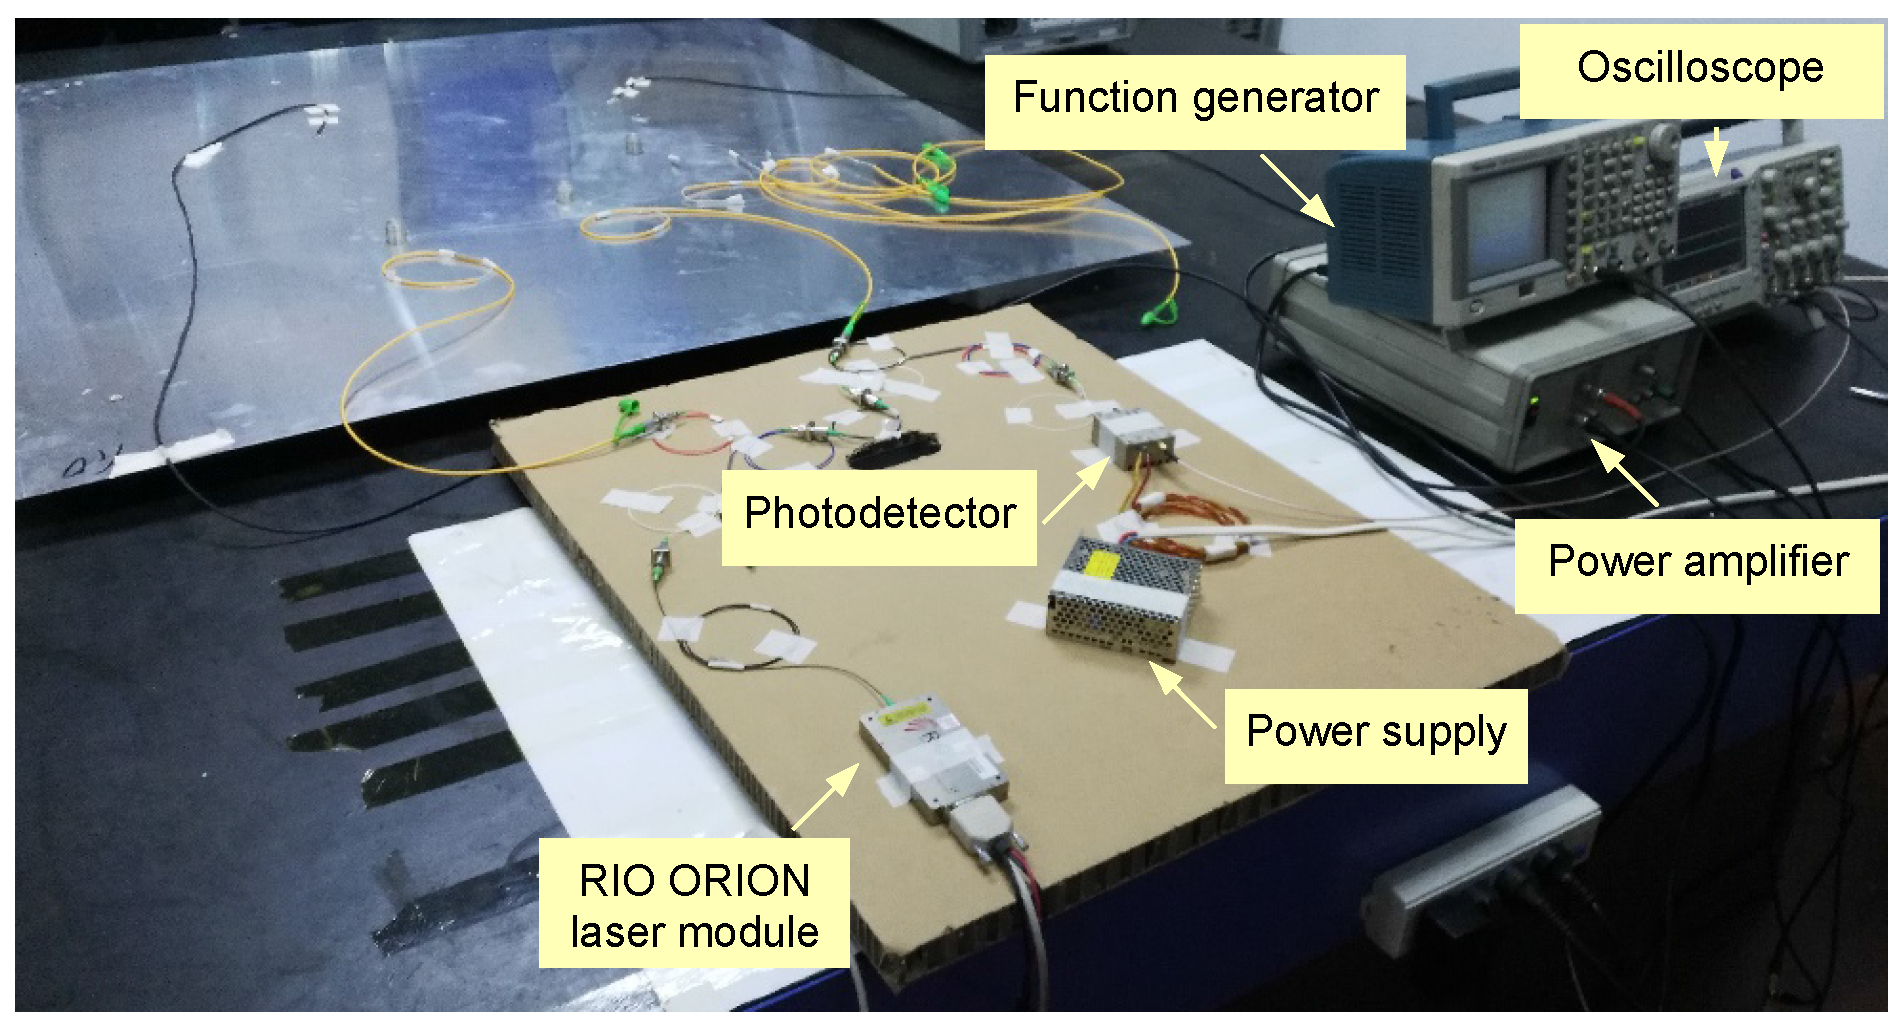
In the following experimental investigations, the proposed UFOS was used to detect Lamb waves propagating in an aluminum plate and receive acoustic emission signals produced in a reinforced concrete beam. The former applications are often found in guided wave based structural health monitoring methods, whereas the latter applications are often found in acoustic emission non-destructive evaluation techniques. In both groups of experiments, the ultrasonic signals were detected by a Mach–Zehnder interferometer, which consisted of a RIO ORION laser module (RIO0175-5-01-3) (Redfern Integrated Optics Inc., Santa Clara, CA, USA), which is a modulation laser source, and a Thorlabs FPD510 photodetector (MenloSystems GmbH, Martinsried, Bavaria, Germany), which converts light signals into electric signals. The output voltage signals from the photodetector were collected at a 2 GHz sampling rate using the digital oscilloscope Tektronix DPO 2024 (Tektronix, Beaverton, OR, USA).
4.1. Experiments on the Aluminum Plate
The aluminum plate is a representative waveguide frequently used in Lamb wave related experiments. In this work, the proposed sensors were also demonstrated on an aluminum plate with dimensions of 1200 mm × 1200 mm × 1 mm. The Lamb wave was excited by a piezoelectric wafer, which was driven by a function generator Tektronix AFG3252 (Tektronix, Beaverton, OR, USA) and a power amplifier TEGAM 2350 (TEGAM, Geneva, OH, USA), and received by two UFOSs and a piezoelectric wafer for the purpose of comparison. Figure 8 shows the dispersion curves of Lamb wave in the aluminum plate. The diameter and thickness of the piezoelectric wafers are 10 mm and 1 mm, respectively. They were connected with the digital oscilloscope with 2 GHz sampling rate. The different dimensions of the two UFOSs are listed in Table 1. The optical fiber wrapped around the tube with superglue is single-mode and the length is approximately 1.88 m (30 loops). The layout and location are shown in Figure 9. The distance between the actuator and sensors is approximately 40 cm. All of the actuator and sensors were attached onto the surface of the plate by superglue, which can be considered as strong coupling. The experimental setup was shown in Figure 10.
The Lamb waves were generated from a low frequency of 30 kHz to a high frequency of 240 kHz in increments of 10 kHz, in order to determine the sensitivities to different frequencies. Figure 11 and Figure 12 show the signals received by all the sensors at 70 kHz and 140 kHz, respectively. In all figures, the arrival time of and modes is marked by the dotted red lines according to the group velocity shown in Figure 8. In Figure 11, the first arrival wave packet is mode Lamb wave for both UFOSs and the piezoelectric sensor. In the latter, and modes may be distinguished, whereas, in the former, these two modes are overlapping owing to the multiple reflections within the sensor body. Nevertheless, if there is a sufficient time interval, these two modes can still be separated until mode signal attenuates. The large response of UFOS after 260 μs results from the reflections on all the edges, since their arrival times are similar.
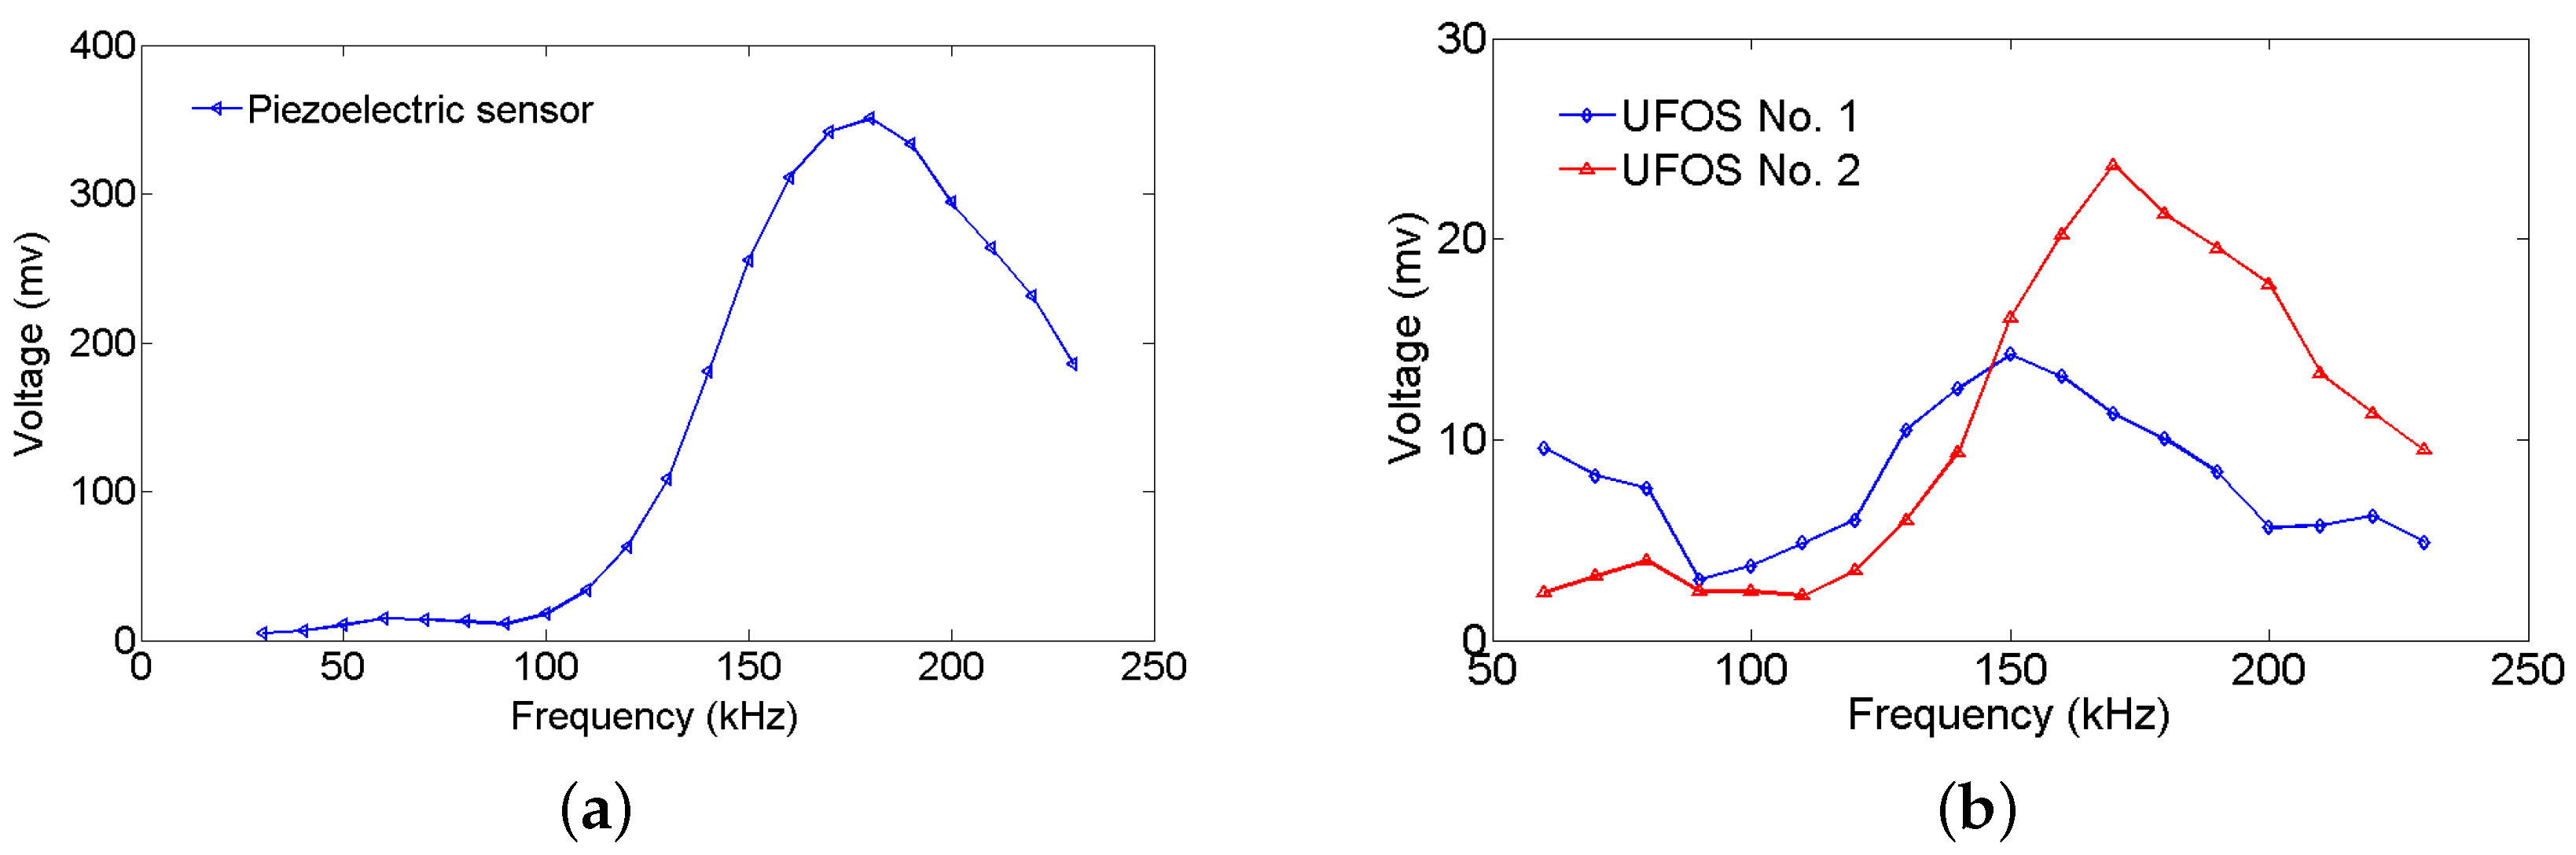
In Figure 12, which is the higher frequency case, the piezoelectric sensor exhibits a larger response, which is also observed in Figure 13. The maximum values of the first wave packet in both the piezoelectric sensor and UFOSs are selected and plotted in this figure. These are the “tuning frequency curves” (for mode only in this case), which demonstrate that the piezoelectric sensor has a lower sensitivity at low frequency, whereas the UFOSs exhibit high sensitivity at both low and high frequencies. Specifically, the UFOS with a thinner wall exhibits higher sensitivity in the low frequency range, but lower sensitivity in the high frequency range, whereas the opposite is true for the UFOS with a thicker wall. This can be attributed to the smaller structural stiffness of the UFOS with a thinner wall, which results in a lower resonant frequency and a larger response. Finally, although the sensitivity of the UFOS is lower than that of the piezoelectric sensor, it can be increased further by using a longer optical fiber. Moreover, the tuning frequency curve of the proposed sensor is related to the mode coupling effects, interferometer drift, etc.
4.2. Experiments on the Reinforced Concrete Beam
Reinforced concrete is the most common civil engineering material. The acoustic emission technique is one of the most effective methods for the crack monitoring of reinforced concrete structures [41,42,43]. In this work, a reinforced concrete beam with width 150 mm, depth 250 mm, and length 2000 mm was cast. The beam contained three tensile reinforcing bars with a diameter of 14 mm. The tested beams were instrumented with one UFOS and one piezoelectric sensor placed at approximately the mid span for the purpose of comparison. Figure 14 shows the sketch of experimental setup. The DiSP-4/PCI system, a product of the Physical Acoustic Corporation (Princeton Junction, NJ, USA), was used in this work to collect the signals from the piezoelectric acoustic emission sensor. This sensor is model R15. The preamplifier used in the DiSP-4/PCI system has a gain of 40 dB. Moreover, the sampling rate for the piezoelectric sensor is 5 MHz. In the following tests, the UFOS with a wall and base thickness of 0.5 mm was used. The Mach–Zehnder interferometer used in this test is the same as the above. Acoustic emission signals were produced via two methods: striking the beam with a steel bar first and subsequently producing cracks by static loading.
Since the noise affected the signals in both time and frequency domains, the noise signals were collected by a data acquisition system and their frequency spectra were analyzed before the tests, such that they can be distinguished from the acoustic emission signals. As shown in Figure 15, the noise in the piezoelectric sensor is very faint, whereas, in the UFOS, there is high noise at the frequency of approximately 114 kHz, which appeared in the frequency spectrum of the piezoelectric sensor signal. The noise was not isolated from the acoustic emission signals in the following tests, but this figure provides the useful information for understanding the following signals.
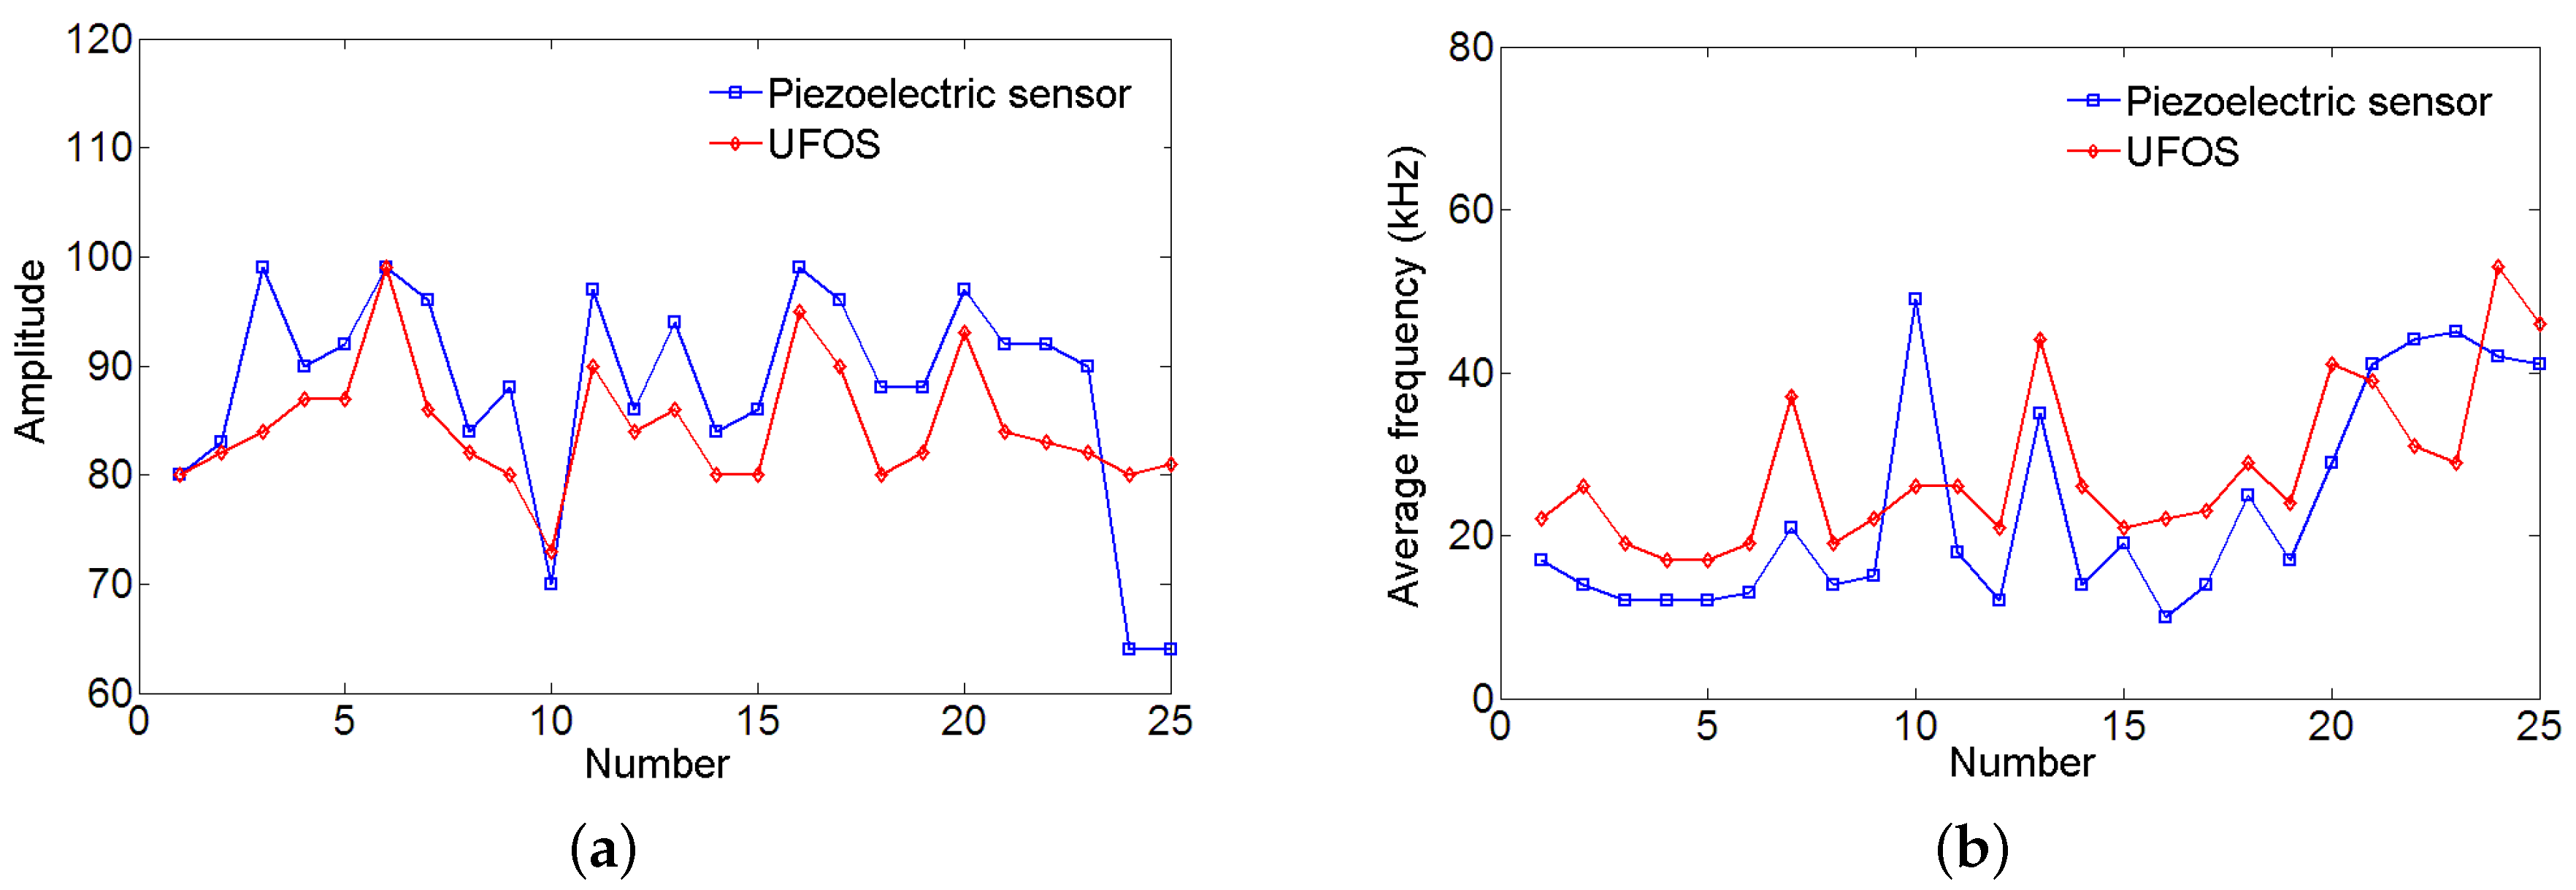
The surface of the reinforced concrete beam was struck using a steel bar for two times, and the acoustic emission signals were collected and shown in Figure 16a,b. The proposed UFOS detected acoustic emission signals successfully, but the amplitudes are a little less than those of the piezoelectric acoustic emission sensor. Since the signals in the time domain are hard to compare, the frequency spectra are given in Figure 16c,d for both signals. From the curves in the frequency domain, it can be observed that the UFOS has similar frequency components as the piezoelectric sensor in the low frequency range, but slightly more components in the high frequency range. Figure 17 further shows that the acoustic emission signals detected by the UFOS have lower amplitude but higher average frequency. In this figure, the x-axis denotes the number of acoustic emission events.
Furthermore, the reinforced concrete beam was tested under four-point loading. The loading was applied manually by a 320 kN jack and the displacement speed was relatively constant, as shown in Figure 18. The load was recorded by a load cell, and the displacement in the middle section of the beam was measured using a linear variable differential transformer (LVDT). The load versus displacement curve is illustrated in Figure 18. The following figures (Figure 19) show two groups of acoustic emission signals, which are obtained during the failure process of the reinforced concrete beam. The rough area, where the signals in Figure 19 were obtained, is shown as a red dotted oval in Figure 18. The other frequency components show that both sensors can catch the signal emitting from the tensile cracks below approximately 100 kHz, which is the typical frequency range of the tensile cracks of concrete materials. While the detailed frequency is different between the UFOS and piezoelectric sensor, this can be attributed to the differences in their detailed sensitivity curves. Figure 20 demonstrates that the characteristics of acoustic emission signals from both sensors are similar, as shown previously.
It is known that piezoelectric acoustic emission sensors cannot measure the accurate structural deformation, such as the structural strain, according to their working principles. Similarly, for the UFOS proposed in this work, the voltage amplitudes of signals do not have a simple relationship with the structural strain or deformation, but the signals collected by them can be used to evaluate the structural damage certainly. Thus, the proposed sensor is more suitable to detect acoustic emission events.
5. Conclusions
In this paper, a 3D shaped UFOS is proposed to sense ultrasonic stress waves, including guided waves in the active damage detection methods and acoustic emission signals, which are collected usually in the passive damage detection methods. Based on the principle of a Mach–Zehnder interferometer, the UFOS is obtained by wrapping an optical fiber on a hollow cylinder with a base. By being attached onto the surfaces of structures, the UFOS can catch the wave signals through strong coupling and wave scattering.
First, an analytical model was developed for the proposed UFOS. The sensitivity of the 3D UFOS also depends on its sensing length, and it can be realized with relatively limited space and long optical fiber (up to several meters). Subsequently, its feasibility for the detection of guided ultrasonic waves was demonstrated using finite element analyses. The results showed that the frequency characteristics of the detected signals were affected slightly, as indicated by the formula. Experiments conducted on the plate indicated that the UFOSs used in this work exhibit smaller responses than the piezoelectric sensor, but they can be improved by increasing the optical fiber length. Moreover, the UFOS with a thinner wall has higher sensitivity in the low frequency range as compared to the UFOS with a thicker wall. Experiments conducted on the reinforced concrete beam further indicate that the UFOS can detect the acoustic emission signals with a reasonable arrival time and frequency range in comparison with the results from the piezoelectric sensor.
Acknowledgments
This work was supported by the National Key Research and Development Program of China (Grant No. 2016YFC0802400), the National Science Foundation of China (Grant Nos. 51578191, 51478039), and the Beijing Nova Program (Grant No. Z151100000315053).
Author Contributions
Wensong Zhou conceived and designed the sensor; Chengming Lan and Wensong Zhou conceived and designed the experiments; Yawen Xie performed the experiments; Chengming Lan analyzed the data; and Chengming Lan and Wensong Zhou wrote the paper.
Conflicts of Interest
The authors declare no conflict of interest.
Abbreviations
The following abbreviations are used in this manuscript:
| AE | Acoustic emission |
| EMAT | Electromagnetic acoustic transducer |
| FOS | Fiber optic sensor |
| UFOS | Ultrasonic fiber optic sensor |
| LVDT | Linear variable differential transformer |
References
- Rokhlin, S. Diffraction of Lamb waves by a finite crack in an elastic layer. J. Acoust. Soc. Am. 1980, 67, 1157–1165. [Google Scholar] [CrossRef]
- Alleyne, D.; Cawley, P. The interaction of Lamb waves with defects. IEEE Trans. Ultrason. Ferroelectr. Freq. Control 1992, 39, 381–397. [Google Scholar] [CrossRef] [PubMed]
- Cawley, P.; Alleyne, D. The use of Lamb waves for the long range inspection of large structures. Ultrasonics 1996, 34, 287–290. [Google Scholar] [CrossRef]
- He, J.; Yuan, F. Damage identification for composite structures using a cross-correlation reverse-time migration technique. Struct. Health Monit. 2015, 14, 558–570. [Google Scholar] [CrossRef]
- He, J.; Yuan, F. Lamb wave-based subwavelength damage imaging using the DORT-MUSIC technique in metallic plates. Struct. Health Monit. 2016, 15, 65–80. [Google Scholar] [CrossRef]
- He, J.; Yuan, F.G. A quantitative damage imaging technique based on enhanced CCRTM for composite plates using 2D scan. Smart Mater. Struct. 2016, 25, 105022. [Google Scholar] [CrossRef]
- Zhang, G.; Gao, W.; Song, G.; Song, Y. An imaging algorithm for damage detection with dispersion compensation using piezoceramic induced lamb waves. Smart Mater. Struct. 2016, 26, 025017. [Google Scholar] [CrossRef]
- Mitra, M.; Gopalakrishnan, S. Guided wave based structural health monitoring: A review. Smart Mater. Struct. 2016, 25, 053001. [Google Scholar] [CrossRef]
- Wang, L.; Yuan, F.G. Damage identification in a composite plate using prestack reverse-time migration technique. Struct. Health Monit. 2005, 4, 195–211. [Google Scholar] [CrossRef]
- Lin, X.; Yuan, F.G. Experimental study applying a migration technique in structural health monitoring. Struct. Health Monit. 2005, 4, 341–353. [Google Scholar] [CrossRef]
- Kwun, H.; Teller, C. Magnetostrictive generation and detection of longitudinal, torsional, and flexural waves in a steel rod. J. Acoust. Soc. Am. 1994, 96, 1202–1204. [Google Scholar] [CrossRef]
- Light, G.; Kwun, H.; Kim, S.; Spinks, R.J. Health monitoring of piping and plate using the Magnetostrictive Sensor (MsS) guided-wave technology. In Proceedings of the Second Middle East Nondestructive Testing Conference and Exhibition, Jubail, Saudi Arabia, 8–10 December 2003. [Google Scholar]
- Gao, H.; Ali, S.; Lopez, B. Efficient detection of delamination in multilayered structures using ultrasonic guided wave EMATs. NDT E Int. 2010, 43, 316–322. [Google Scholar] [CrossRef]
- Matt, H.M.; di Scalea, F.L. Macro-fiber composite piezoelectric rosettes for acoustic source location in complex structures. Smart Mater. Struct. 2007, 16, 1489–1499. [Google Scholar] [CrossRef]
- Glushkov, E.; Glushkova, N.; Kvasha, O.; Kern, D.; Seemann, W. Guided wave generation and sensing in an elastic beam using MFC piezoelectric elements: theory and experiment. J. Intell. Mater. Syst. Struct. 2010, 21, 1617–1625. [Google Scholar] [CrossRef]
- Sorazu, B.; Thursby, G.; Culshaw, B.; Dong, F.; Pierce, S.; Yang, Y.; Betz, D. Optical generation and detection of ultrasound. Strain 2003, 39, 111–114. [Google Scholar] [CrossRef]
- Lau, K.; Chan, C.; Zhou, L.; Jin, W. Strain monitoring in composite-strengthened concrete structures using optical fibre sensors. Compos. Pt. B-Eng. 2001, 32, 33–45. [Google Scholar] [CrossRef]
- Inaudi, D.; Ruefenacht, A.; von Arx, B.; Noher, H.; Vurpillot, S.; Glisic, B. Monitoring of a concrete arch bridge during construction. Smart Structures and Materials 2002: Smart Systems for Bridges, Structures, and Highways. In Proceedings of the SPIE’s 9th Annual International Symposium on Smart Structures and Materials, San Diego, CA, USA, 17–21 March 2002; Volume 4696, pp. 146–153. [Google Scholar]
- Pinet, E.; Hamel, C.; Glisic, B.; Inaudi, D.; Miron, N. Health monitoring with optical fiber sensors: From human body to civil structures. In Proceedings of the SPIE—The International Society for Optical Engineering, San Diego, CA, USA, 18–22 March 2007; Volume 6532. [Google Scholar]
- Kim, T.; Kim, D.H.; Kim, M.; Lim, Y. Fiber Bragg grating-based long-gauge fiber optic sensor for monitoring of a 60 m full-scale prestressed concrete girder during lifting and loading. Sens. Actuator A Phys. 2016, 252, 134–145. [Google Scholar] [CrossRef]
- Khalil, A.; Nader, V.; Paul, R.; Lydia, L.; Oleg, S. Strain based FBG sensor for real-time corrosion rate monitoring in pre-stressed structures. Sens. Actuator B Chem. 2016, 236, 276–285. [Google Scholar]
- Lawson, N.; Correia, R.; James, S.; Partridge, M.; Staines, S.; Gautrey, J.; Garry, K.; Holt, J.; Tatam, R. Development and application of optical fibre strain and pressure sensors for in-flight measurements. Meas. Sci. Technol. 2016, 27, 104001. [Google Scholar] [CrossRef]
- Ravet, F.; Zou, L.; Bao, X.; Ozbakkaloglu, T.; Saatcioglu, M.; Zhou, J. Distributed Brillouin sensor for structural health monitoring. Can. J. Civ. Eng. 2007, 34, 291–297. [Google Scholar] [CrossRef]
- Bucaro, J.; Dardy, H.; Carome, E. Optical fiber acoustic sensor. Appl. Opt. 1977, 16, 1761–1762. [Google Scholar] [CrossRef] [PubMed]
- Gachagan, A.; Pierce, S.; Philp, W.; Mcnab, A.; Hayward, G.; Culshaw, B. Detection of ultrasoncis Lamb waves in composite plates using optical-fibers. In Proceedings of the IEEE Ultrasoncis Symposium, Seattle, WA, USA, 7–10 November 1995; pp. 803–806. [Google Scholar]
- Gachagan, A.; Hayward, G.; McNab, A.; Reynolds, P.; Pierce, S.; Philp, W.; Culshaw, B. Generation and reception of ultrasonic guided waves in composite plates using conformable piezoelectric transmitters and optical-fiber detectors. IEEE Trans. Ultrason. Ferroelectr. Freq. Control 1999, 46, 72–81. [Google Scholar] [CrossRef] [PubMed]
- Zhou, Y.; Jin, S.; Qu, Z. Study on the distributed optical fiber sensing technology for pipeline leakage detection. In Advanced Laser Technologies 2005; Society of Photo-Optical Instrumentation Engineers (SPIE): Tianjin, China, 2005; Volume 6344. [Google Scholar]
- Culshaw, B.; Dakin, J. Optical Fiber Sensors: Systems and Applications; Artech House: Norwood, MA, USA, 1989; Volume 2. [Google Scholar]
- Dong, F.; Atherton, K.; Pierce, G.; Culshaw, B. Measurement of in-plane and out-of-plane displacement for ultrasonic flaw detection. In Proceedings of the 5th European Conference on Smart Structures and Materials, Glasgow, UK, 21–25 May 2000; Volume 4073. [Google Scholar]
- Liang, Y.; Qu, D.; Deng, H. Based on optical fiber Michelson interferometer for acoustic emission detection experimental research. In Proceedings of the International Symposium on Photoelectronic Detection and Imaging 2013: Fiber Optic Sensors and Optical Coherence Tomography (SPIE), Beijing, China, 25–27 June 2013; Volume 8914. [Google Scholar]
- Alcoz, J.; Lee, C.; Taylor, H. Embedded fiber-optic fabry-perot ultrasound sensor. IEEE Trans. Ultrason. Ferroelectr. 1990, 37, 302–306. [Google Scholar] [CrossRef] [PubMed]
- Oliveira, R.; Ramos, C.; Marques, A. Health monitoring of composite structures by embedded FBG and interferometric Fabry–Pérot sensors. Comput. Struct. 2008, 86, 340–346. [Google Scholar] [CrossRef]
- Fomitchov, P.; Kromine, A.; Krishnaswamy, S.; Achenbach, J. Sagnac-type fiber-optic array sensor for detection of bulk ultrasonic waves. IEEE Trans. Ultrason. Ferroelectr. Freq. Control 2000, 47, 584–590. [Google Scholar] [CrossRef] [PubMed]
- Harish, A.; Varghese, B.; Rao, B.; Balasubramaniam, K.; Srinivasan, B. Dynamic interrogator for elastic wave sensing using Fabry Perot filters based on fiber Bragg gratings. Ultrasonics 2015, 60, 103–108. [Google Scholar] [CrossRef] [PubMed]
- Kageyama, K.; Murayama, H.; Ohsawa, I.; Kanai, M.; Nagata, K.; Machijima, Y.; Matsumura, F. Acoustic emission monitoring of a reinforced concrete structure by applying new fiber-optic sensors. Smart Mater. Struct. 2005, 14, S52–S59. [Google Scholar] [CrossRef]
- Li, F.; Murayama, H.; Kageyama, K.; Shirai, T. Doppler effect-based fiber-optic sensor and its application in ultrasonic detection. Opt. Fiber Technol. 2009, 15, 296–303. [Google Scholar] [CrossRef]
- Zhou, W.; Li, H.; Dong, Y.; Wang, A. Sensing properties of optical fiber sensor to ultrasonic guided waves. Smart Struct. Syst. 2016, 18, 471–484. [Google Scholar] [CrossRef]
- Wei, P.; Han, X.; Xia, D.; Liu, T.; Lang, H. Novel fiber-optic ring acoustic emission sensor. Sensors 2018, 18, 215. [Google Scholar]
- Hocker, G. Fiber-optic sensing of pressure and temperature. Appl. Opt. 1979, 18, 1445–1448. [Google Scholar] [CrossRef] [PubMed]
- Rose, J.L. Ultrasonic Guided Waves in Solid Media; Cambridge University Press: Cambridge, UK, 2014. [Google Scholar]
- Ohno, K.; Ohstu, M. Crack classification in concrete based on acoustic emission. Constr. Build. Mater. 2010, 24, 2339–2346. [Google Scholar] [CrossRef]
- Aldahdooh, M.; Bunnori, N.; Johari, M. Damage evaluation of reinforced concrete beams with varying thickness using the acoustic emission technique. Constr. Build. Mater. 2013, 44, 812–821. [Google Scholar] [CrossRef]
- Kocur, G.; Saenger, E.; Grosse, C.; Vogel, T. Time reverse modeling of acoustic emissions in a reinforced concrete beam. Ultrasonics 2016, 65, 96–104. [Google Scholar] [CrossRef] [PubMed]
Figure 1.
Schematic of a Mach–Zehnder interferometer.

Figure 2.
The 3D shaped optical fiber ultrasonic sensor: (a) sketch; (b) photo.
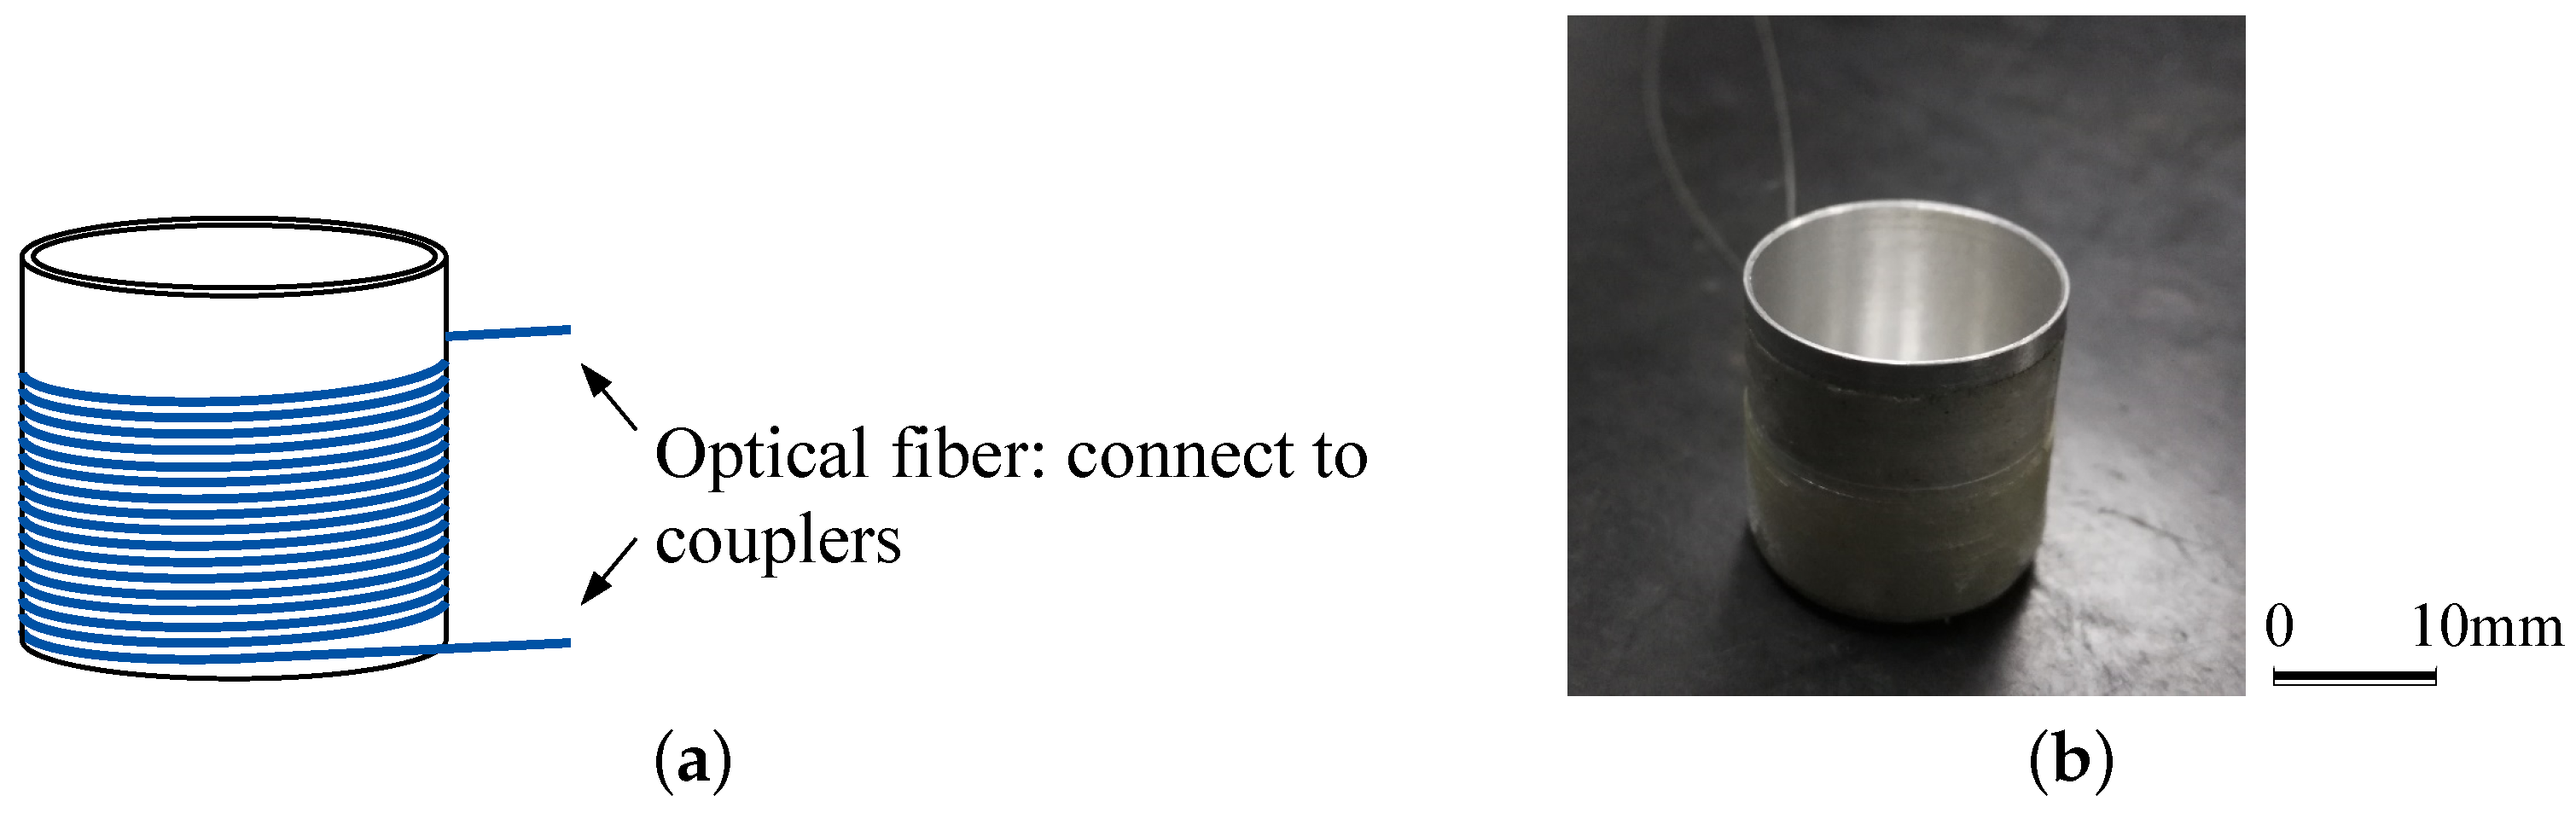
Figure 3.
Propagating of ultrasonic waves from the structure to the sensor.

Figure 4.
Layout of the piezoelectric actuator and the proposed sensor in the finite element model.
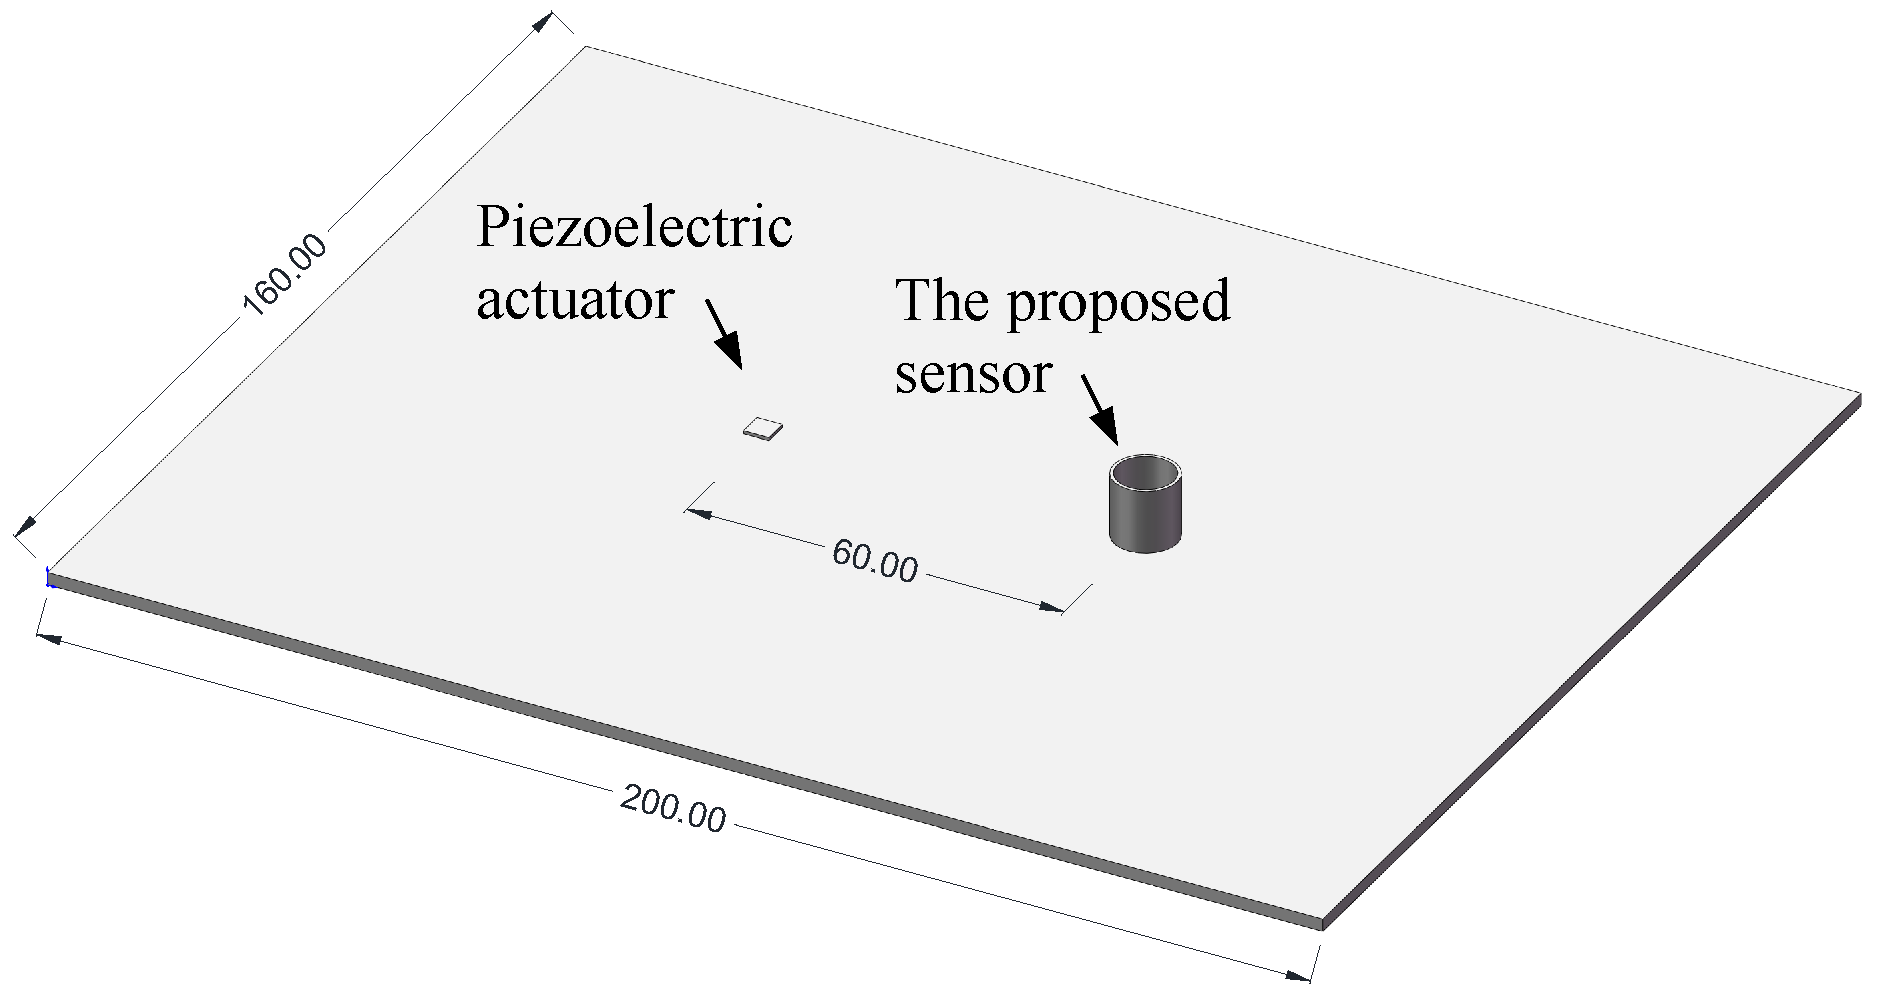
Figure 5.
The voltage signal for Lamb waves excitation.
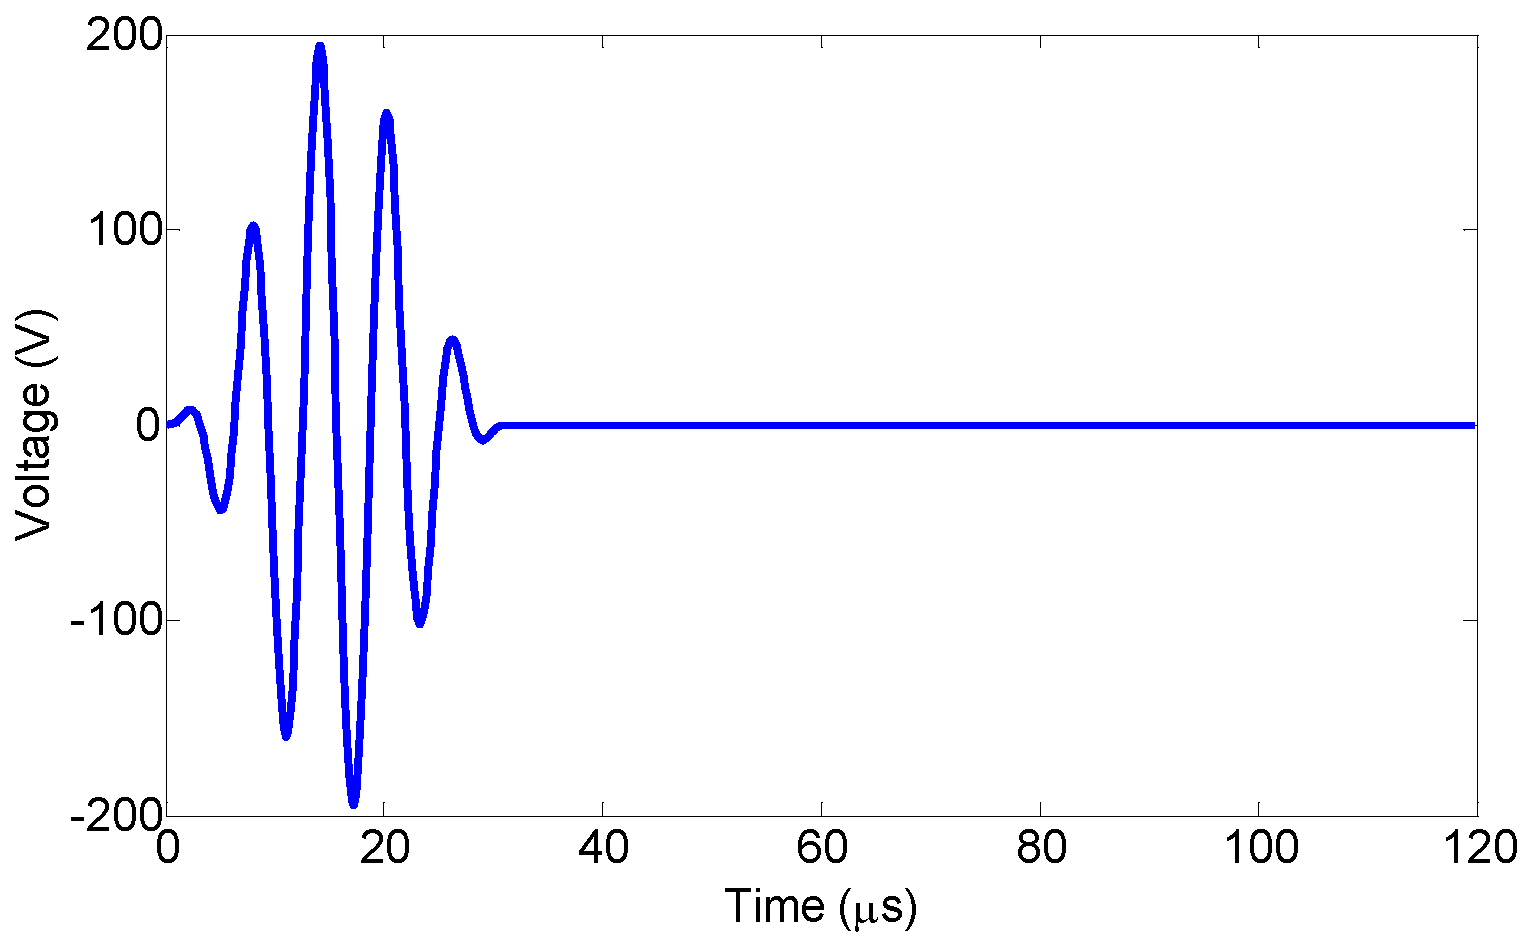
Figure 6.
Propagation and scattering of Lamb waves in the aluminum tube: (a) top view; (b) axonometric view; (c,d) the corresponding enlarged views.
Figure 6.
Propagation and scattering of Lamb waves in the aluminum tube: (a) top view; (b) axonometric view; (c,d) the corresponding enlarged views.

Figure 7.
Lamb wave signals and their frequency spectra: (a) the displacement component w; (b) the frequency spectra of the excitation signal and the displacement component w, respectively.
Figure 7.
Lamb wave signals and their frequency spectra: (a) the displacement component w; (b) the frequency spectra of the excitation signal and the displacement component w, respectively.

Figure 8.
The dispersion curves for the aluminum plate: (a) phase velocity vs. frequency; (b) group velocity vs. frequency.
Figure 8.
The dispersion curves for the aluminum plate: (a) phase velocity vs. frequency; (b) group velocity vs. frequency.
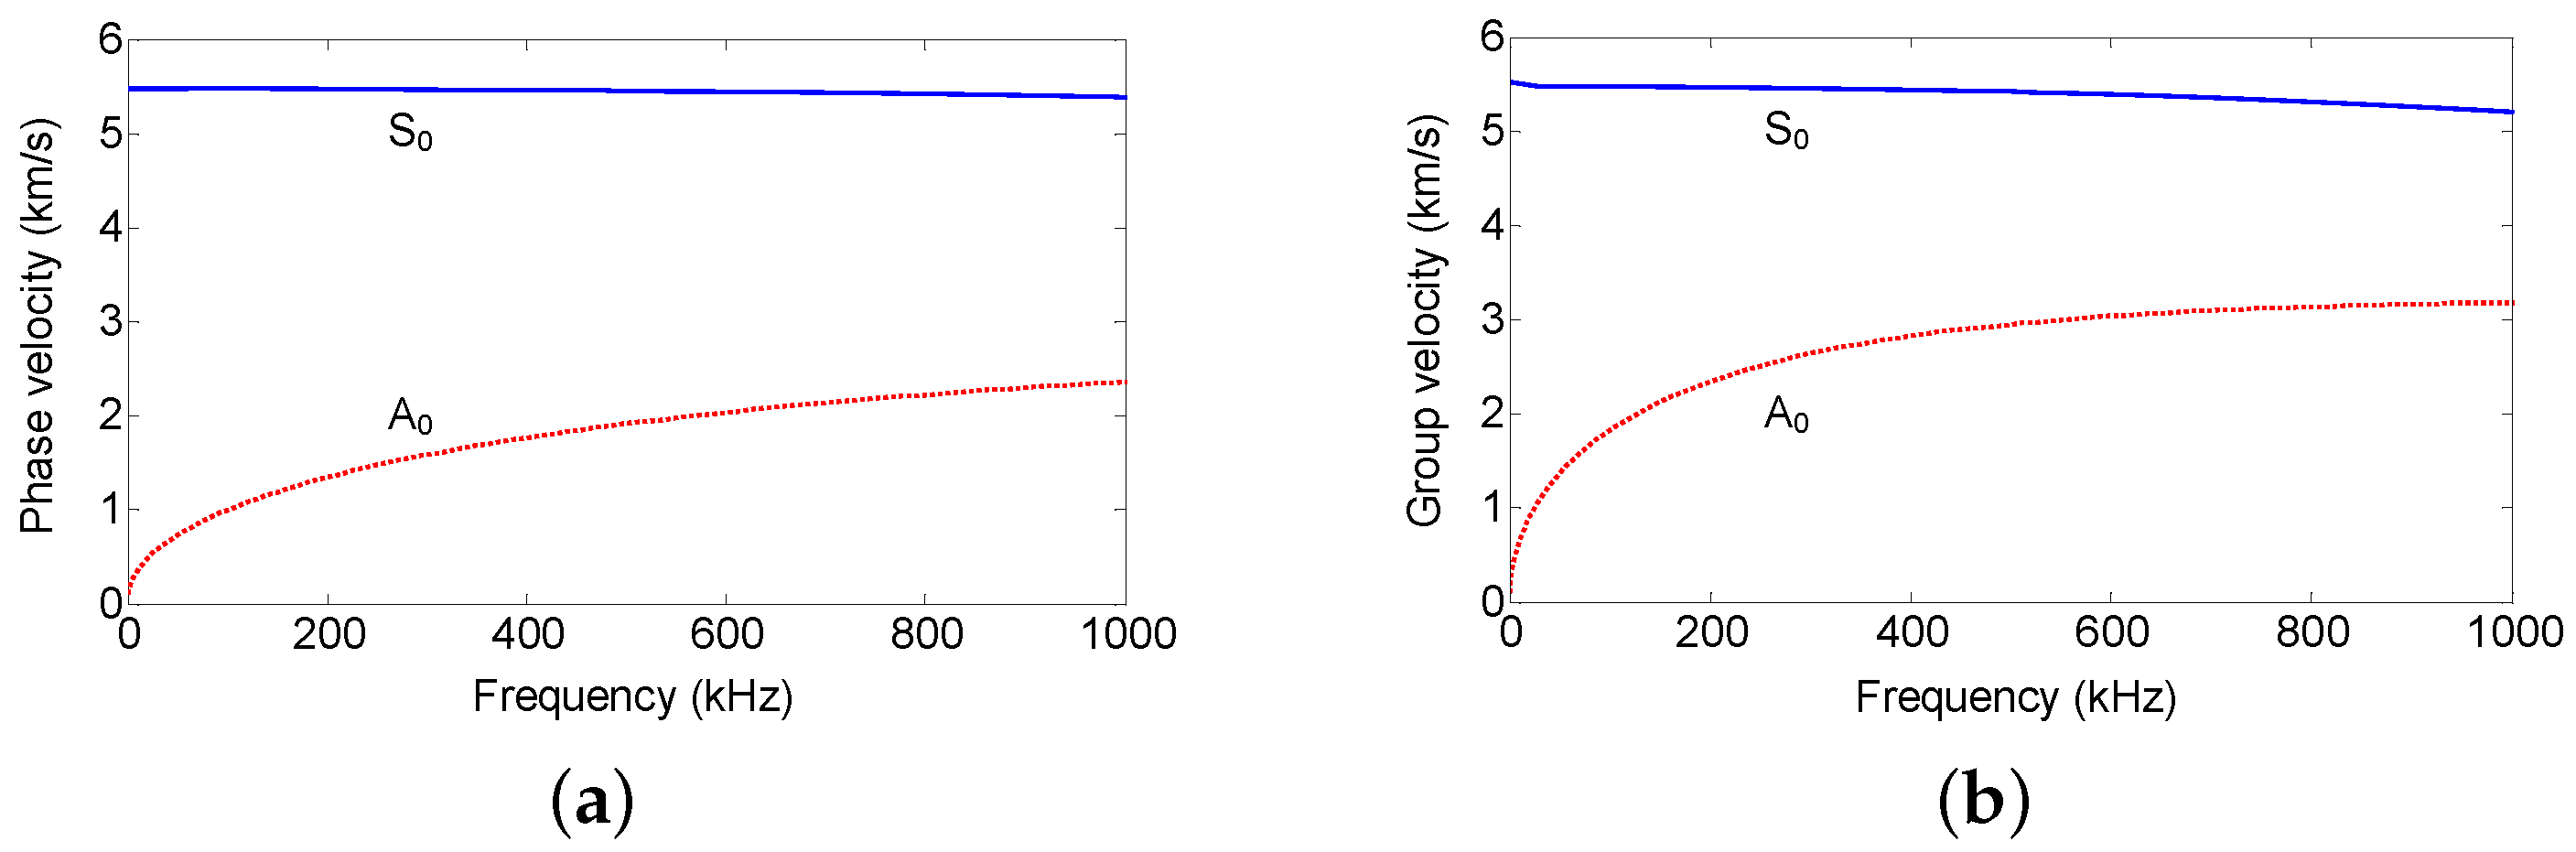
Figure 9.
Layout of the actuator and sensors on the aluminum plate in the experimental investigations (unit: mm).
Figure 9.
Layout of the actuator and sensors on the aluminum plate in the experimental investigations (unit: mm).
Figure 10.
Experimental setup for Lamb waves generation and reception with UFOSs and the piezoelectric wafers.
Figure 10.
Experimental setup for Lamb waves generation and reception with UFOSs and the piezoelectric wafers.

Figure 11.
Lamb wave signals from different UFOSs and piezoelectric wafer at 70 kHz for: (a) UFOS No. 1; (b) UFOS No. 2; (c) the piezoelectric sensor.
Figure 11.
Lamb wave signals from different UFOSs and piezoelectric wafer at 70 kHz for: (a) UFOS No. 1; (b) UFOS No. 2; (c) the piezoelectric sensor.
Figure 12.
Lamb wave signals from different UFOSs and piezoelectric wafer at 140 kHz for: (a) UFOS No. 1; (b) UFOS No. 2; (c) the piezoelectric sensor.
Figure 12.
Lamb wave signals from different UFOSs and piezoelectric wafer at 140 kHz for: (a) UFOS No. 1; (b) UFOS No. 2; (c) the piezoelectric sensor.
Figure 13.
Tuning frequency curves for: (a) the piezoelectric sensor; (b) UFOSs No.1 and No. 2.

Figure 14.
Experimental setup for acoustic emission tests on the reinforced concrete beam.
Figure 15.
The frequency spectra of noise during the acoustic emission tests for: (a) the piezoelectric sensor; (b) UFOS.
Figure 15.
The frequency spectra of noise during the acoustic emission tests for: (a) the piezoelectric sensor; (b) UFOS.
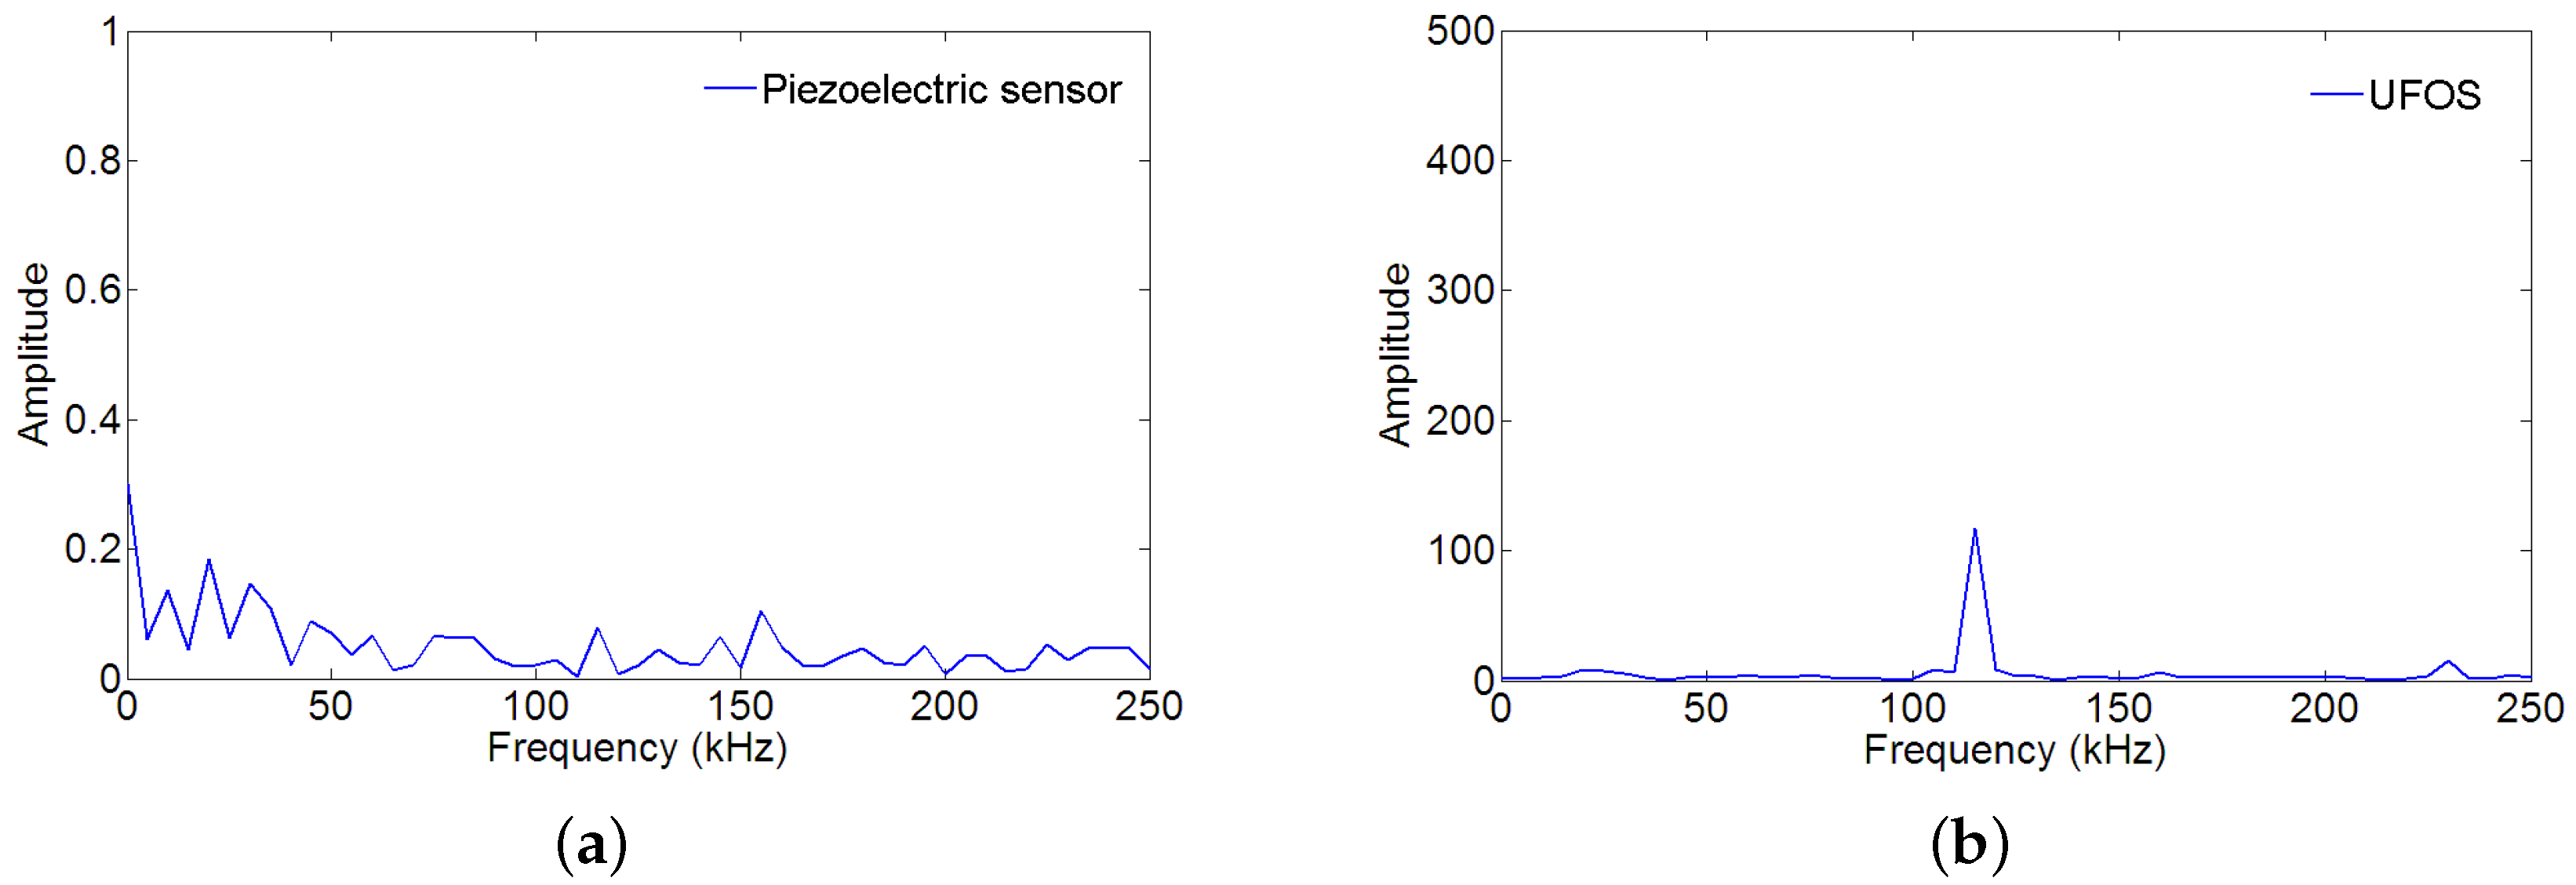
Figure 16.
Acoustic emission signals produced by striking the reinforced concrete beam: (a,b) the acoustic emission signals for two times; (c,d) the corresponding Fourier spectra.
Figure 16.
Acoustic emission signals produced by striking the reinforced concrete beam: (a,b) the acoustic emission signals for two times; (c,d) the corresponding Fourier spectra.
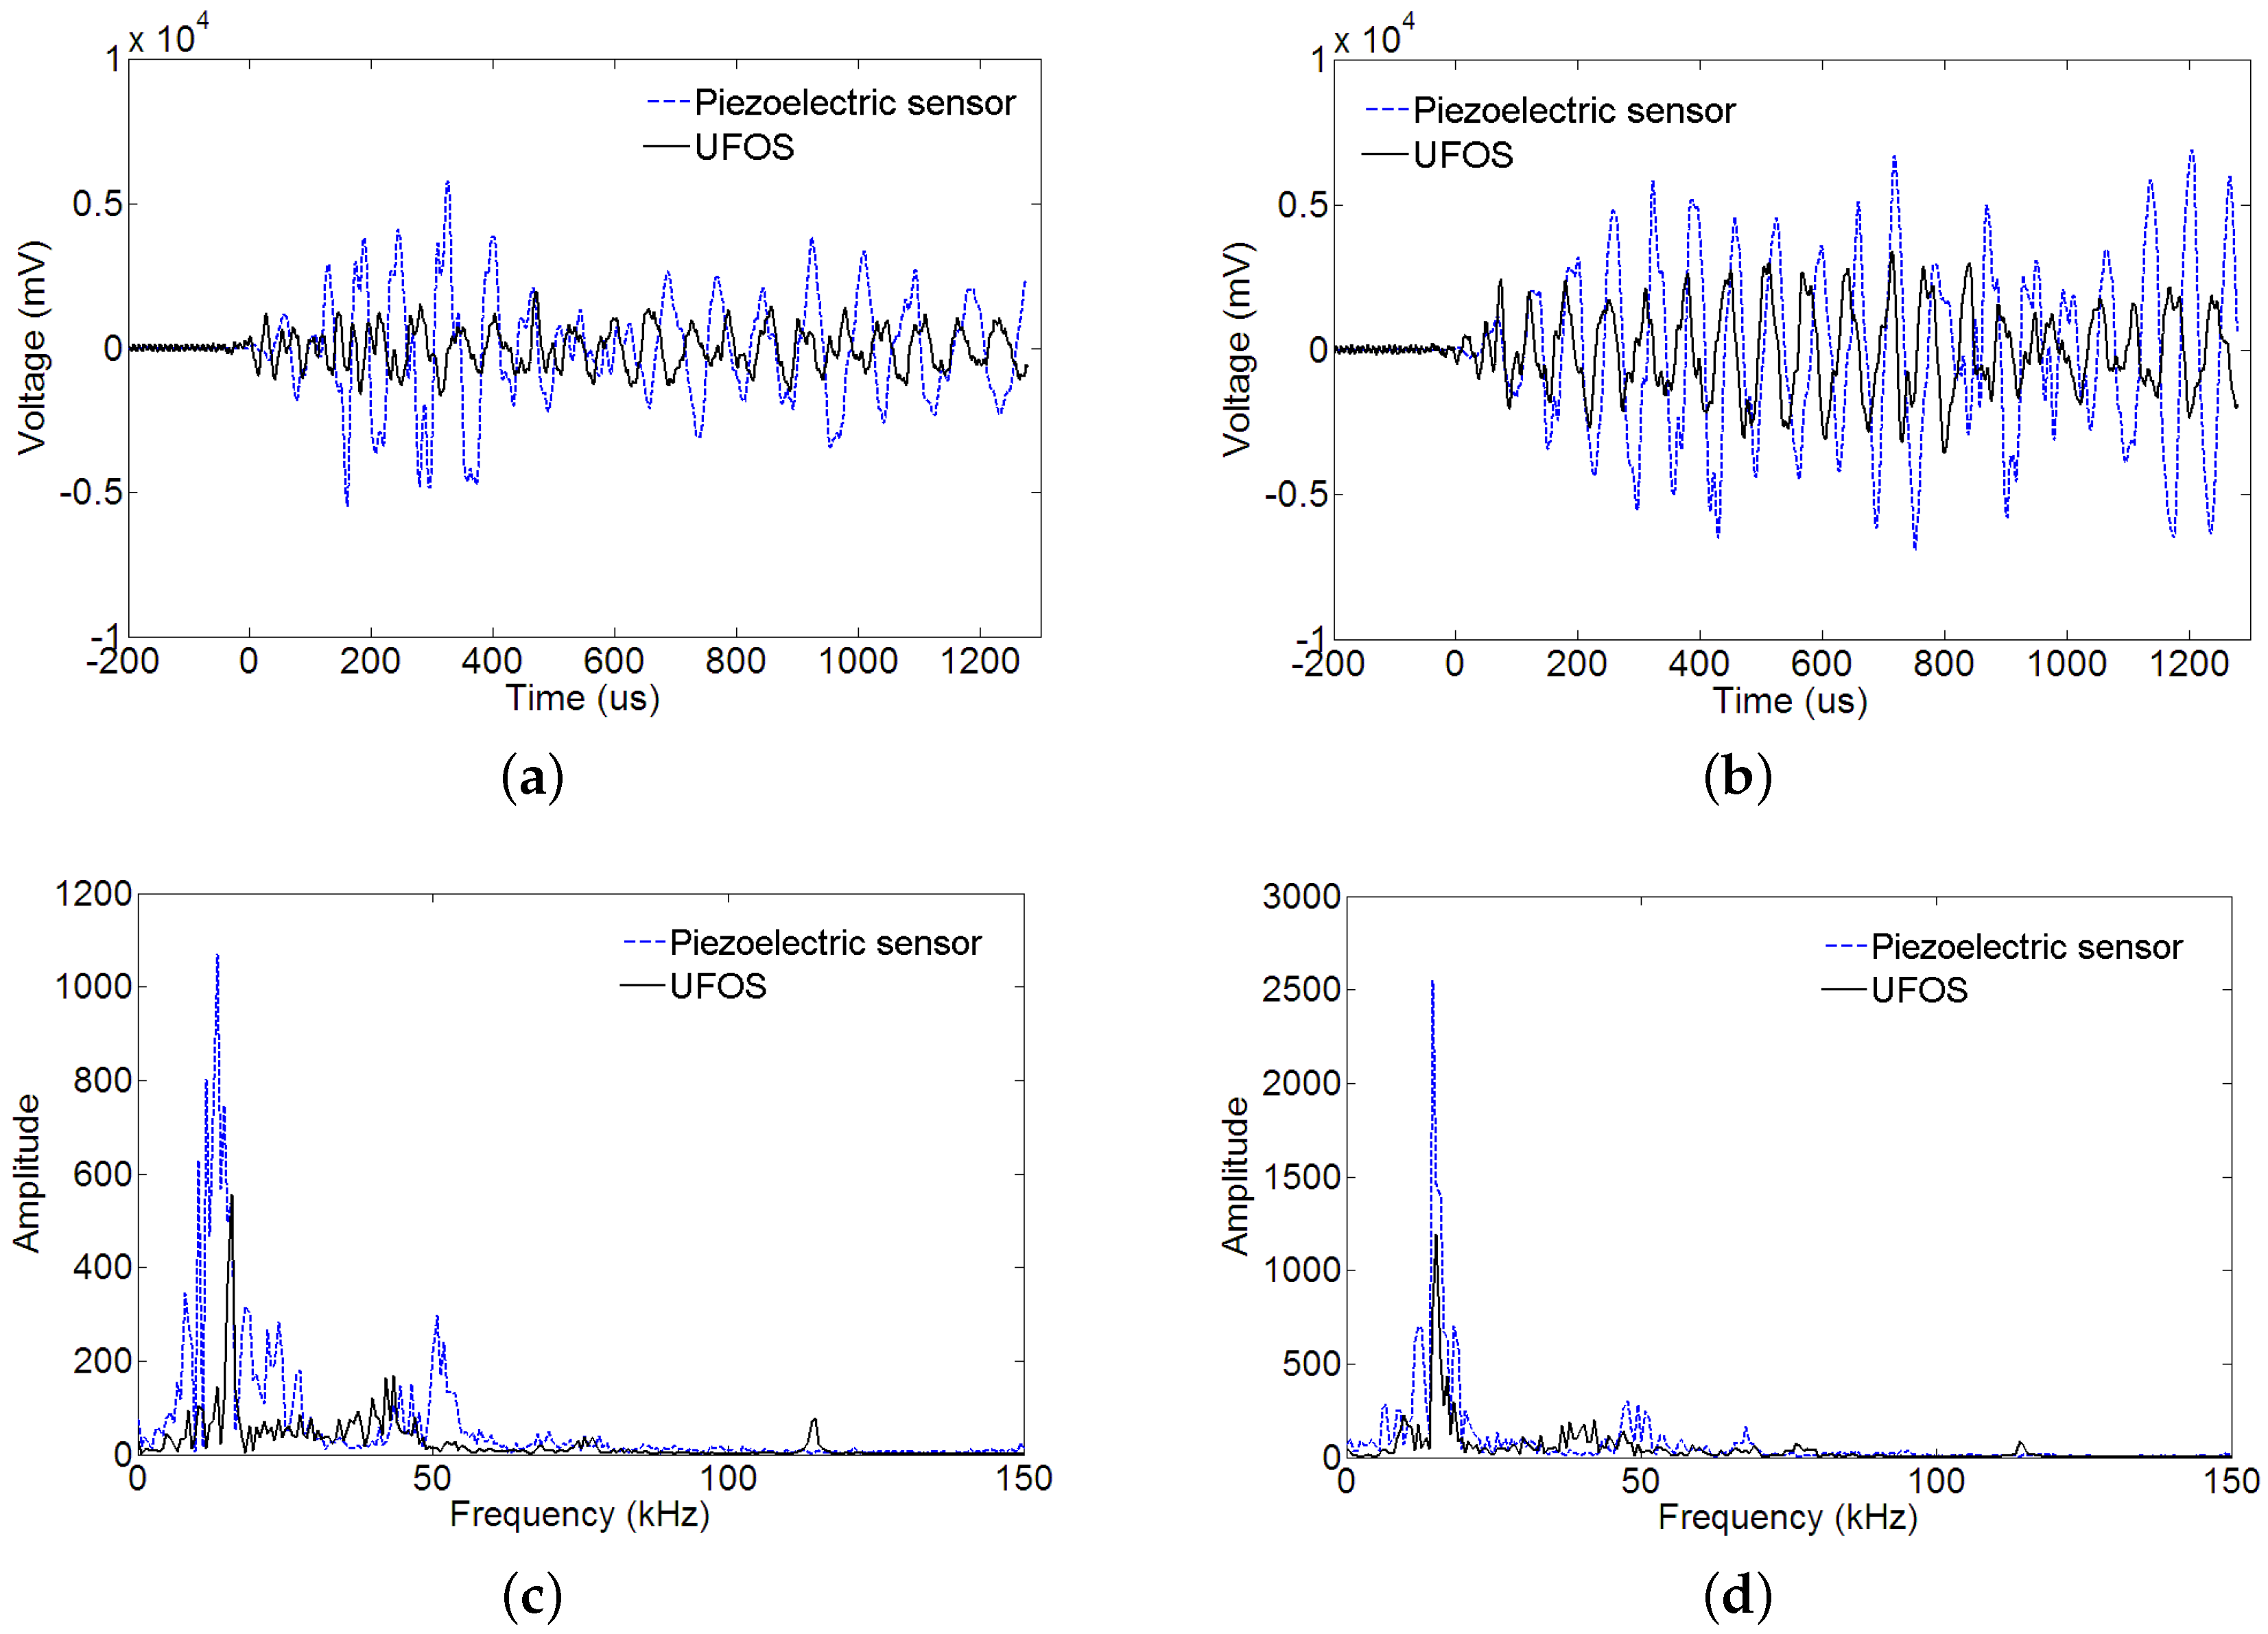
Figure 17.
The characteristics of acoustic emission signals for both sensors during striking the beam: (a) amplitude vs. number; (b) average frequency vs. number.
Figure 17.
The characteristics of acoustic emission signals for both sensors during striking the beam: (a) amplitude vs. number; (b) average frequency vs. number.
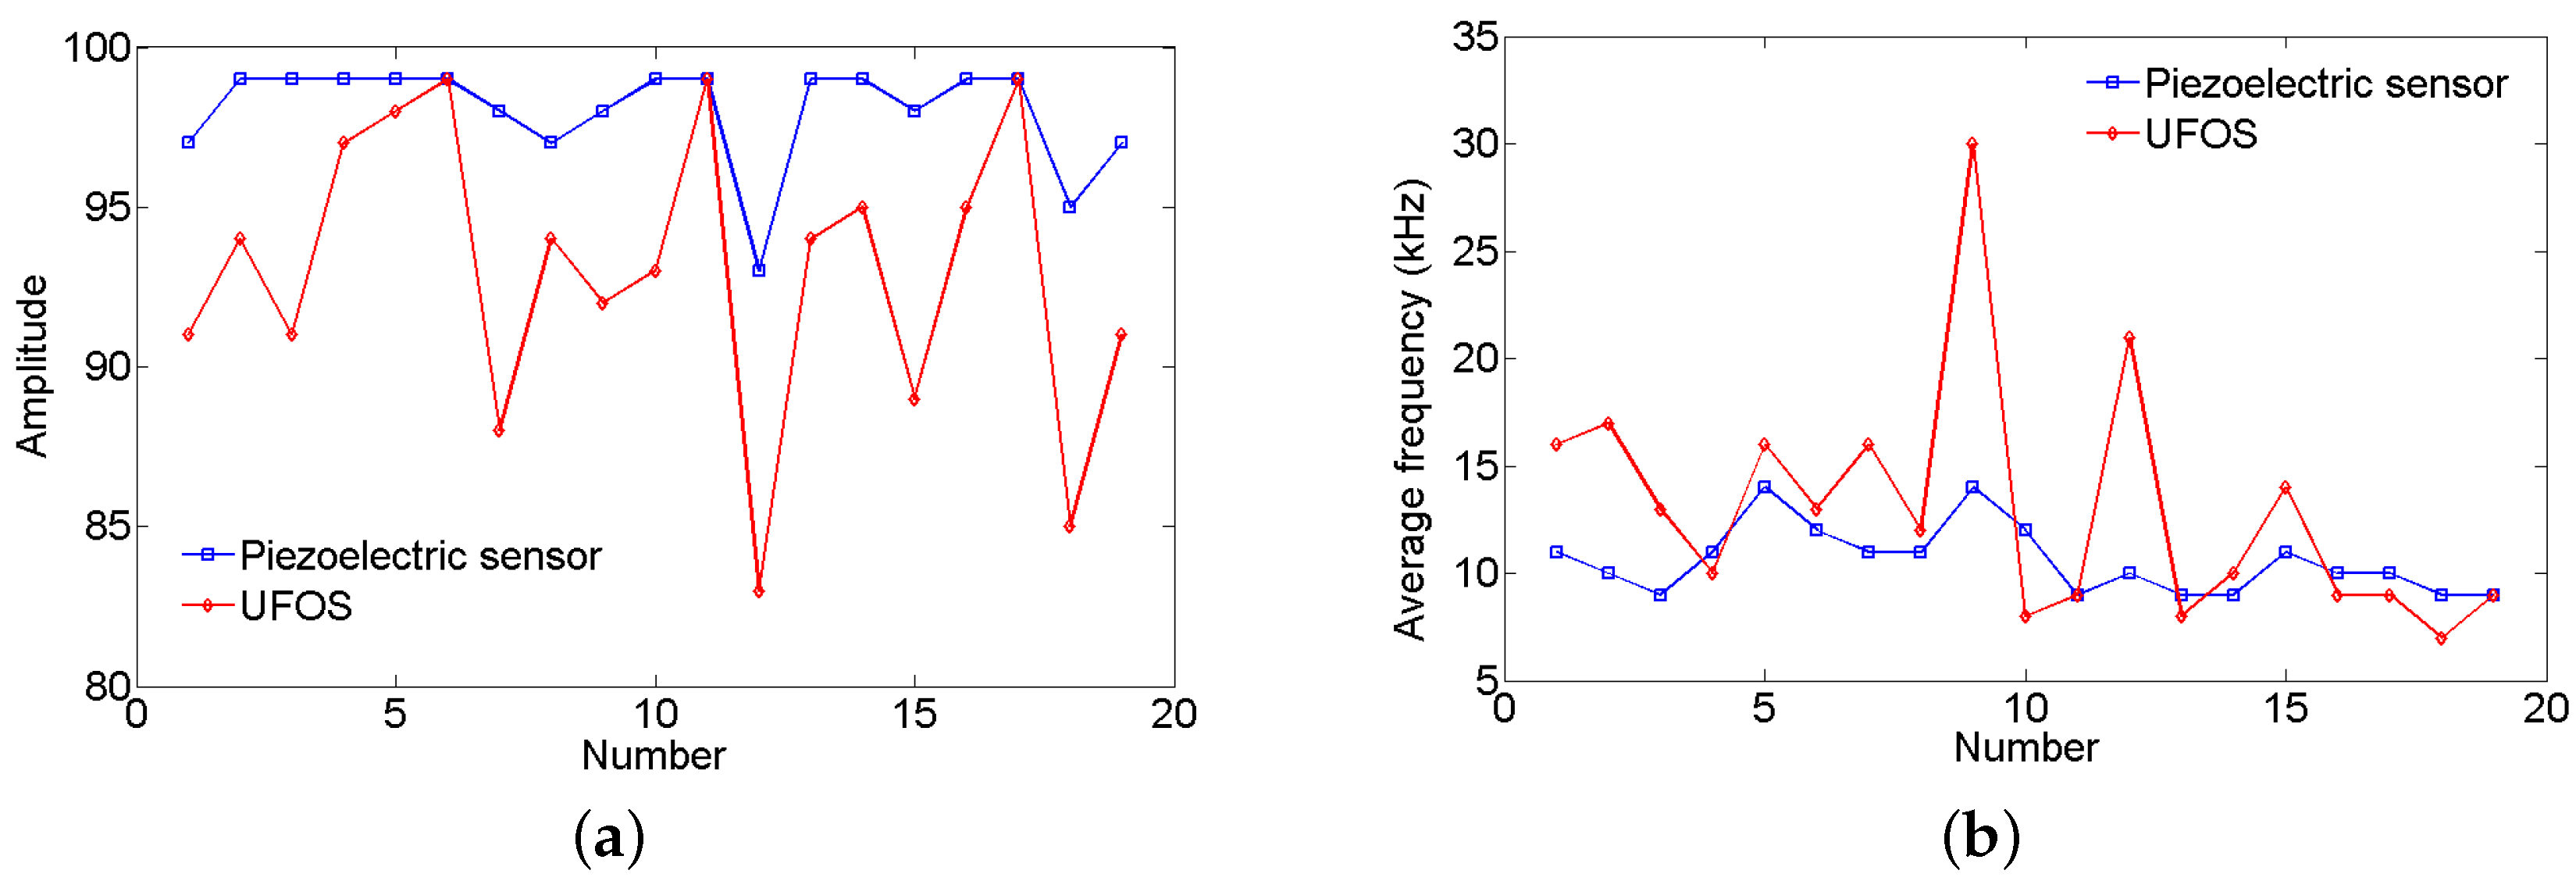
Figure 18.
Load–displacement behavior of the reinforced concrete beam.
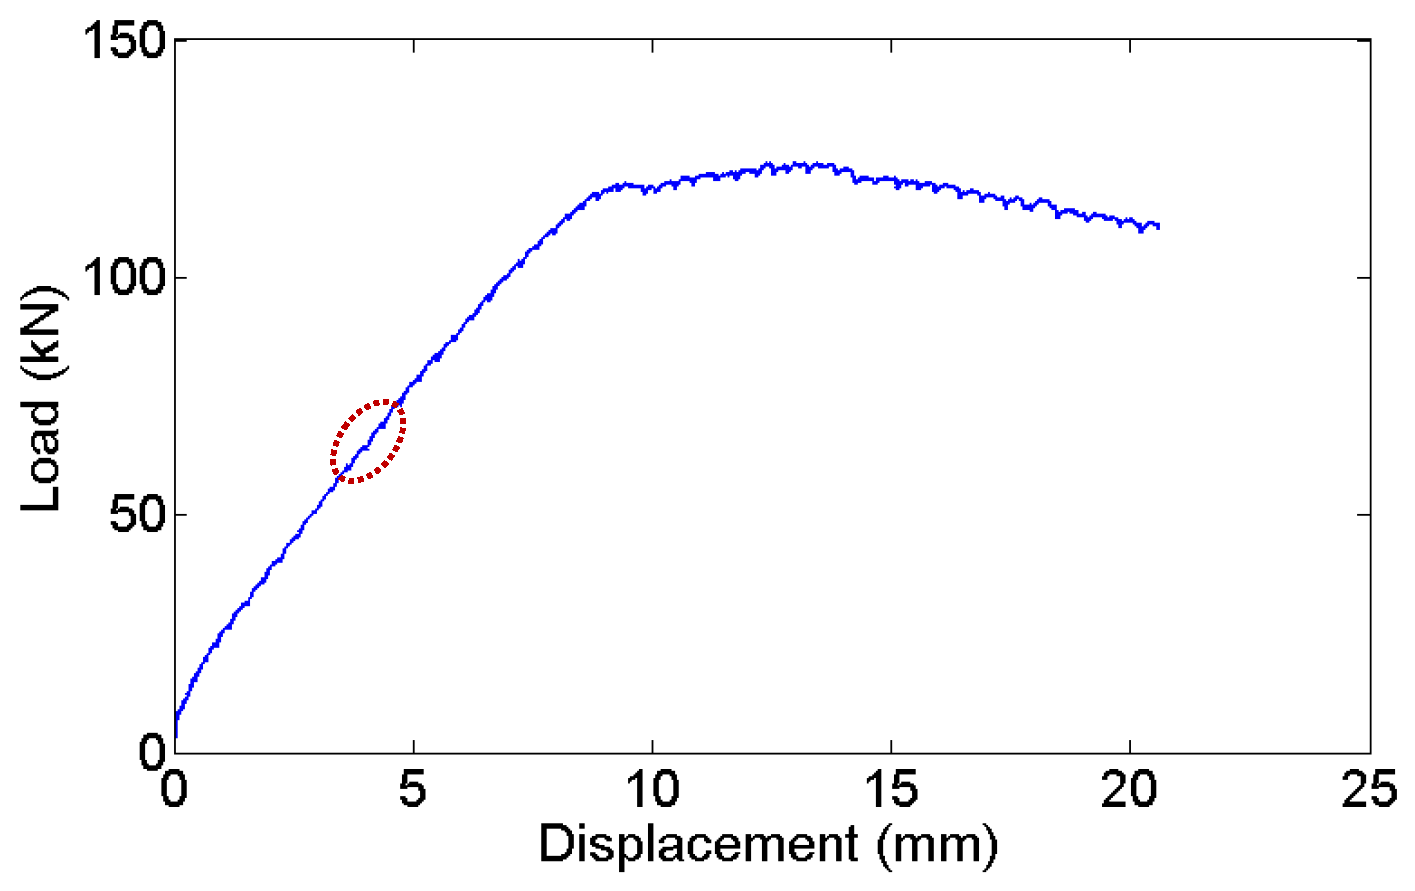
Figure 19.
Acoustic emission signals produced by cracks extension: (a,b) the acoustic emission signals and their Fourier spectra for crack 1; (c,d) the acoustic emission signals and their Fourier spectra for crack 2.
Figure 19.
Acoustic emission signals produced by cracks extension: (a,b) the acoustic emission signals and their Fourier spectra for crack 1; (c,d) the acoustic emission signals and their Fourier spectra for crack 2.

Figure 20.
The characteristics of acoustic emission signals for both sensors due to cracks’ extension: (a) amplitude vs. number; (b) average frequency vs. number.
Figure 20.
The characteristics of acoustic emission signals for both sensors due to cracks’ extension: (a) amplitude vs. number; (b) average frequency vs. number.


Table 1.
Dimensions of UFOSs (unit: mm).
| Sensor No. | Outside Diameter | Height | Wall Thickness | Base Thickness |
|---|---|---|---|---|
| 1 | 20 | 20 | 0.5 | 1.0 |
| 2 | 20 | 1.0 | 1.0 |
© 2018 by the authors. Licensee MDPI, Basel, Switzerland. This article is an open access article distributed under the terms and conditions of the Creative Commons Attribution (CC BY) license (http://creativecommons.org/licenses/by/4.0/).
Share and Cite
MDPI and ACS Style
Lan, C.; Zhou, W.; Xie, Y. Detection of Ultrasonic Stress Waves in Structures Using 3D Shaped Optic Fiber Based on a Mach–Zehnder Interferometer. Sensors 2018, 18, 1218. https://doi.org/10.3390/s18041218
AMA Style
Lan C, Zhou W, Xie Y. Detection of Ultrasonic Stress Waves in Structures Using 3D Shaped Optic Fiber Based on a Mach–Zehnder Interferometer. Sensors. 2018; 18(4):1218. https://doi.org/10.3390/s18041218
Chicago/Turabian StyleLan, Chengming, Wensong Zhou, and Yawen Xie. 2018. "Detection of Ultrasonic Stress Waves in Structures Using 3D Shaped Optic Fiber Based on a Mach–Zehnder Interferometer" Sensors 18, no. 4: 1218. https://doi.org/10.3390/s18041218
Note that from the first issue of 2016, this journal uses article numbers instead of page numbers. See further details here.