Voltammetric Determination of Carcinogenic Nitrobiphenyls at a Hanging Mercury Drop Electrode

1
UNESCO Laboratory of Environmental Electrochemistry, Department of Analytical Chemistry, Charles University, 128 43 Prague 2, Czech Republic
2
Center for Ecology, Toxicology and Analysis, Research Institute for Organic Syntheses, 532 18 Pardubice-Rybitví, Czech Republic
*
Author to whom correspondence should be addressed.
Sensors 2003, 3(3), 43-60; https://doi.org/10.3390/s30300043
Submission received: 7 February 2003
/
Accepted: 14 February 2003
/
Published: 20 February 2003
Abstract
:Differential pulse voltammetry (DPV) and adsorptive stripping voltammetry (AdSV) at a hanging mercury drop electrode (HMDE) was used for the determination of trace amounts of carcinogenic nitrobiphenyls, namely 2-nitrobiphenyl (2-NBP), 3-nitrobiphenyl (3-NBP) and 4-nitrobiphenyl (4-NBP) within the concentration range from 2.10−8 to 1.10−5 mol·L−1 for DPV and from 2.10−9 to 1.10−7 mol·L−1 for AdSV using a Britton-Robinson buffer – methanol (1:1) mixture with resulting pH 12 as a base electrolyte. The practical applicability of newly developed methods was verified using model samples of drinking and river water and liquid-liquid extraction for a preliminary separation and preconcentration.
Introduction
Nitrated polycyclic aromatic hydrocarbons (NPAH) are well known chemical carcinogens [1,2], which are often found in the industrial and general environment. Therefore, there is an ever-increasing demand for the determination of trace amounts of these substances. So far, mostly chromatographic methods, such as GC-MS or HPLC with fluorimetric detection are used for these purposes [3]. However, these methods are characterized by high investment and running costs. Modern electroanalytical methods, especially differential pulse voltammetry (DPV) and adsorptive stripping voltammetry (AdSV) at a hanging mercury drop electrode (HMDE) [4,5] satisfy even the highest demands on sensitivity required for the determination of extremely dangerous chemical carcinogens, their main advantage being much lower investment and running costs. HMDE, which was introduced by Kemula nearly 50 years ago [6], is still among the best sensors for voltammetric determination which combines ideal properties of mercury as an electrode material (broad potential window in cathodic region, homogenous, easily renewable, uniform and atomically smooth surface) with the possibility to increase the sensitivity of the voltammetric determination via electrochemical or adsorptive accumulation of the analyte on its surface. User friendliness of modern computer driven HMDEs makes them very useful sensors for voltammetric trace analysis [7]. In spite of this, systematic investigation of possible applications of modern voltammetric methods for the determination of traces of chemical carcinogens started relatively recently [8]. NPAH are very promising candidates for a successful adsorptive stripping voltammetric determination at HMDE because of their easy electrochemical reducibility [9] and extensive aromatic system enabling their strong adsorption at a HMDE surface. Therefore, in this paper we devoted attention to DPV and AdSV determination of nanomolar concentrations of 2-nitrobiphenyl (2-NBP), 3-nitrobiphenyl (3-NBP) and 4-nitrobiphenyl (4-NBP), which are potential occupational carcinogens [10].
Experimental
Reagents
The stock solutions (1.10−3 mol L−1) of 2-NBP (C.A.S. Name: [1,1′-biphenyl], 2-nitro, C.A.S. Registry Number: 86-00-0), 3-NBP (C.A.S. Name: [1,1′-biphenyl], 3-nitro, C.A.S. Registry Number: 2113-58-8), and 4-NBP (C.A.S. Name: [1,1′-biphenyl], 4-nitro, C.A.S. Registry Number: 92-93-3) were prepared by dissolving 0.0199 g of the pure substance (Aldrich) in 100 mL of methanol. The purity of the substance was controlled by HPLC [11]. More diluted solutions were prepared by exact dilution of the stock solution with methanol. All the solutions were stored in the dark. It followed from a spectrophotometric study of the stability of the stock solutions [11] that the solutions in methanol are stable for at least 90 days. Methanol was of analytical grade purity (Lachema, Brno, Czech Republic). Hexane for trace analysis (Merck) was used for liquid-liquid (LLE) extractions. Chemicals for the preparation of the Britton-Robinson buffers were obtained from Sigma. Britton-Robinson buffers were prepared in a usual way, i.e. by mixing a solution of 0.04 mol·L−1 in phosphoric acid, 0.04 mol L−1 in acetic acid and 0.04 mol L−1 in boric acid with the appropriate amount of 0.2 mol L−1 sodium hydroxide solution. De-ionized water was produced by Milli-Q Plus system, Millipore.
Apparatus
Measurements were carried out using a computer driven AUTOLAB analyzer controlled by PGSTAT 10 with GPES ver. 4.3 software (all Eco-Chemie, The Netherlands) running under operation system Windows 3.11. A pneumatically controlled HMDE of the MME type 6.1246.020 and VA STAND 663 (both Metrohm, Switzerland) with glassy carbon rod auxiliary electrode and Ag/AgCl reference electrode (to which all the potential values are referred) were used. Where not stated otherwise, the medium drop size 2 at VA STAND 663, a polarization rate of 10 mV s−1, and the modulation amplitude of -50 mV were used. Oxygen was removed by passing nitrogen through measured solution for 5 minutes, and a pre-bubbler containing mixture of water and methanol in the same ratio as in measured solution was placed before polarographic vessel. pH was measured using Conductivity&pH meter Jenway 4330 (Jenway, England).
Procedures
The general procedure to obtain polarograms or voltammograms was as follows: A required amount of the stock solution of the test substance in methanol was placed in a 10 mL volumetric flask, an appropriate volume of methanol was added and the system was diluted to volume with a Britton - Robinson buffer of the required pH. (A different order of mixing the solutions resulted in a precipitation of the test substance). The solution was transferred into a polarographic vessel, oxygen was removed from the measured solutions by bubbling with nitrogen for five minutes and the voltammogram was recorded. The procedure for voltammetric determination of 3-NBP in drinking or river water after liquid-liquid extraction was as follows: 100 mL of model sample of drinking water containing (2-10)·10−9 mol L−1 of added 3-NBP was extracted with 5 mL of hexane, the organic phase was evaporated under decreased pressure to dryness using rotary vacuum evaporator, the residue was dissolved in 1 mL of methanol using sonication, 1 mL of Britton-Robinson buffer, pH 12 was added and DP voltammogram was recorded. Calibration curves were measured in triplicate and their statistical parameters (e.g. slope, intercept, limit of decision, limit of detection, limit of determination) were calculated according to Oppenhelmer [12], Schwartz [13], and Ebel [14] using statistic software Adstat ver. 2.0 (Trilobyte, Czech Republic).
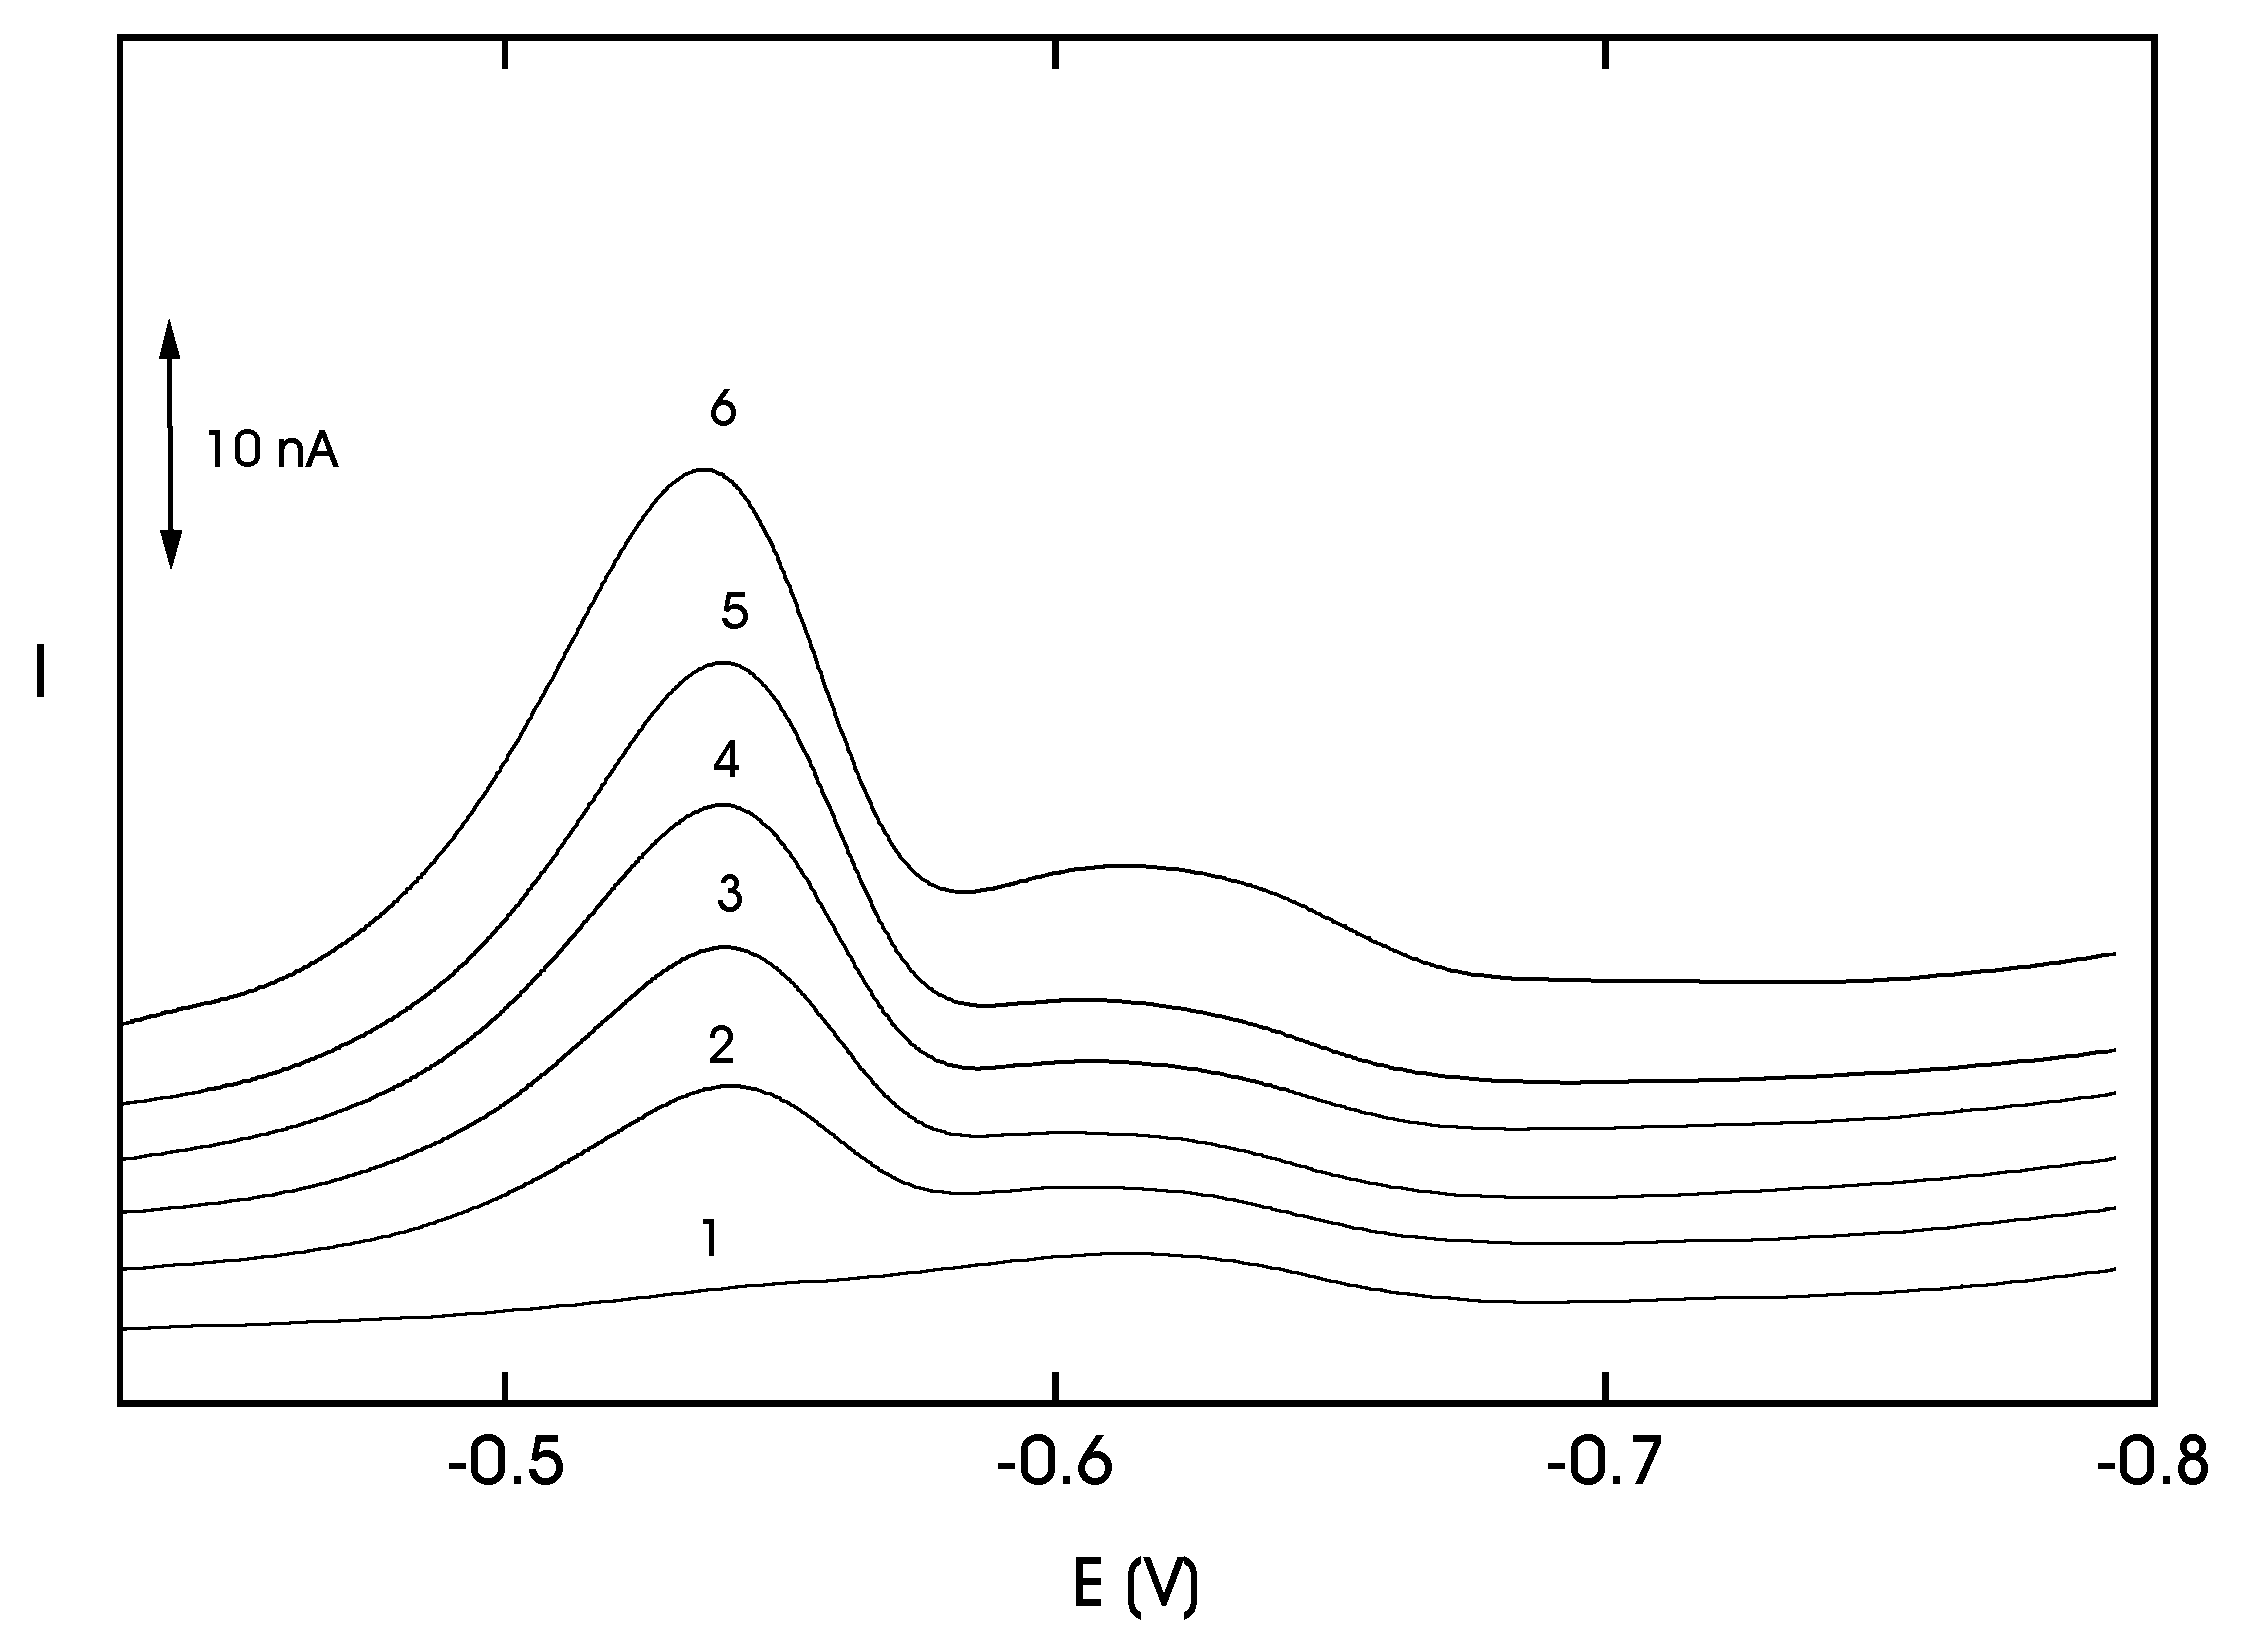
Figure 1.
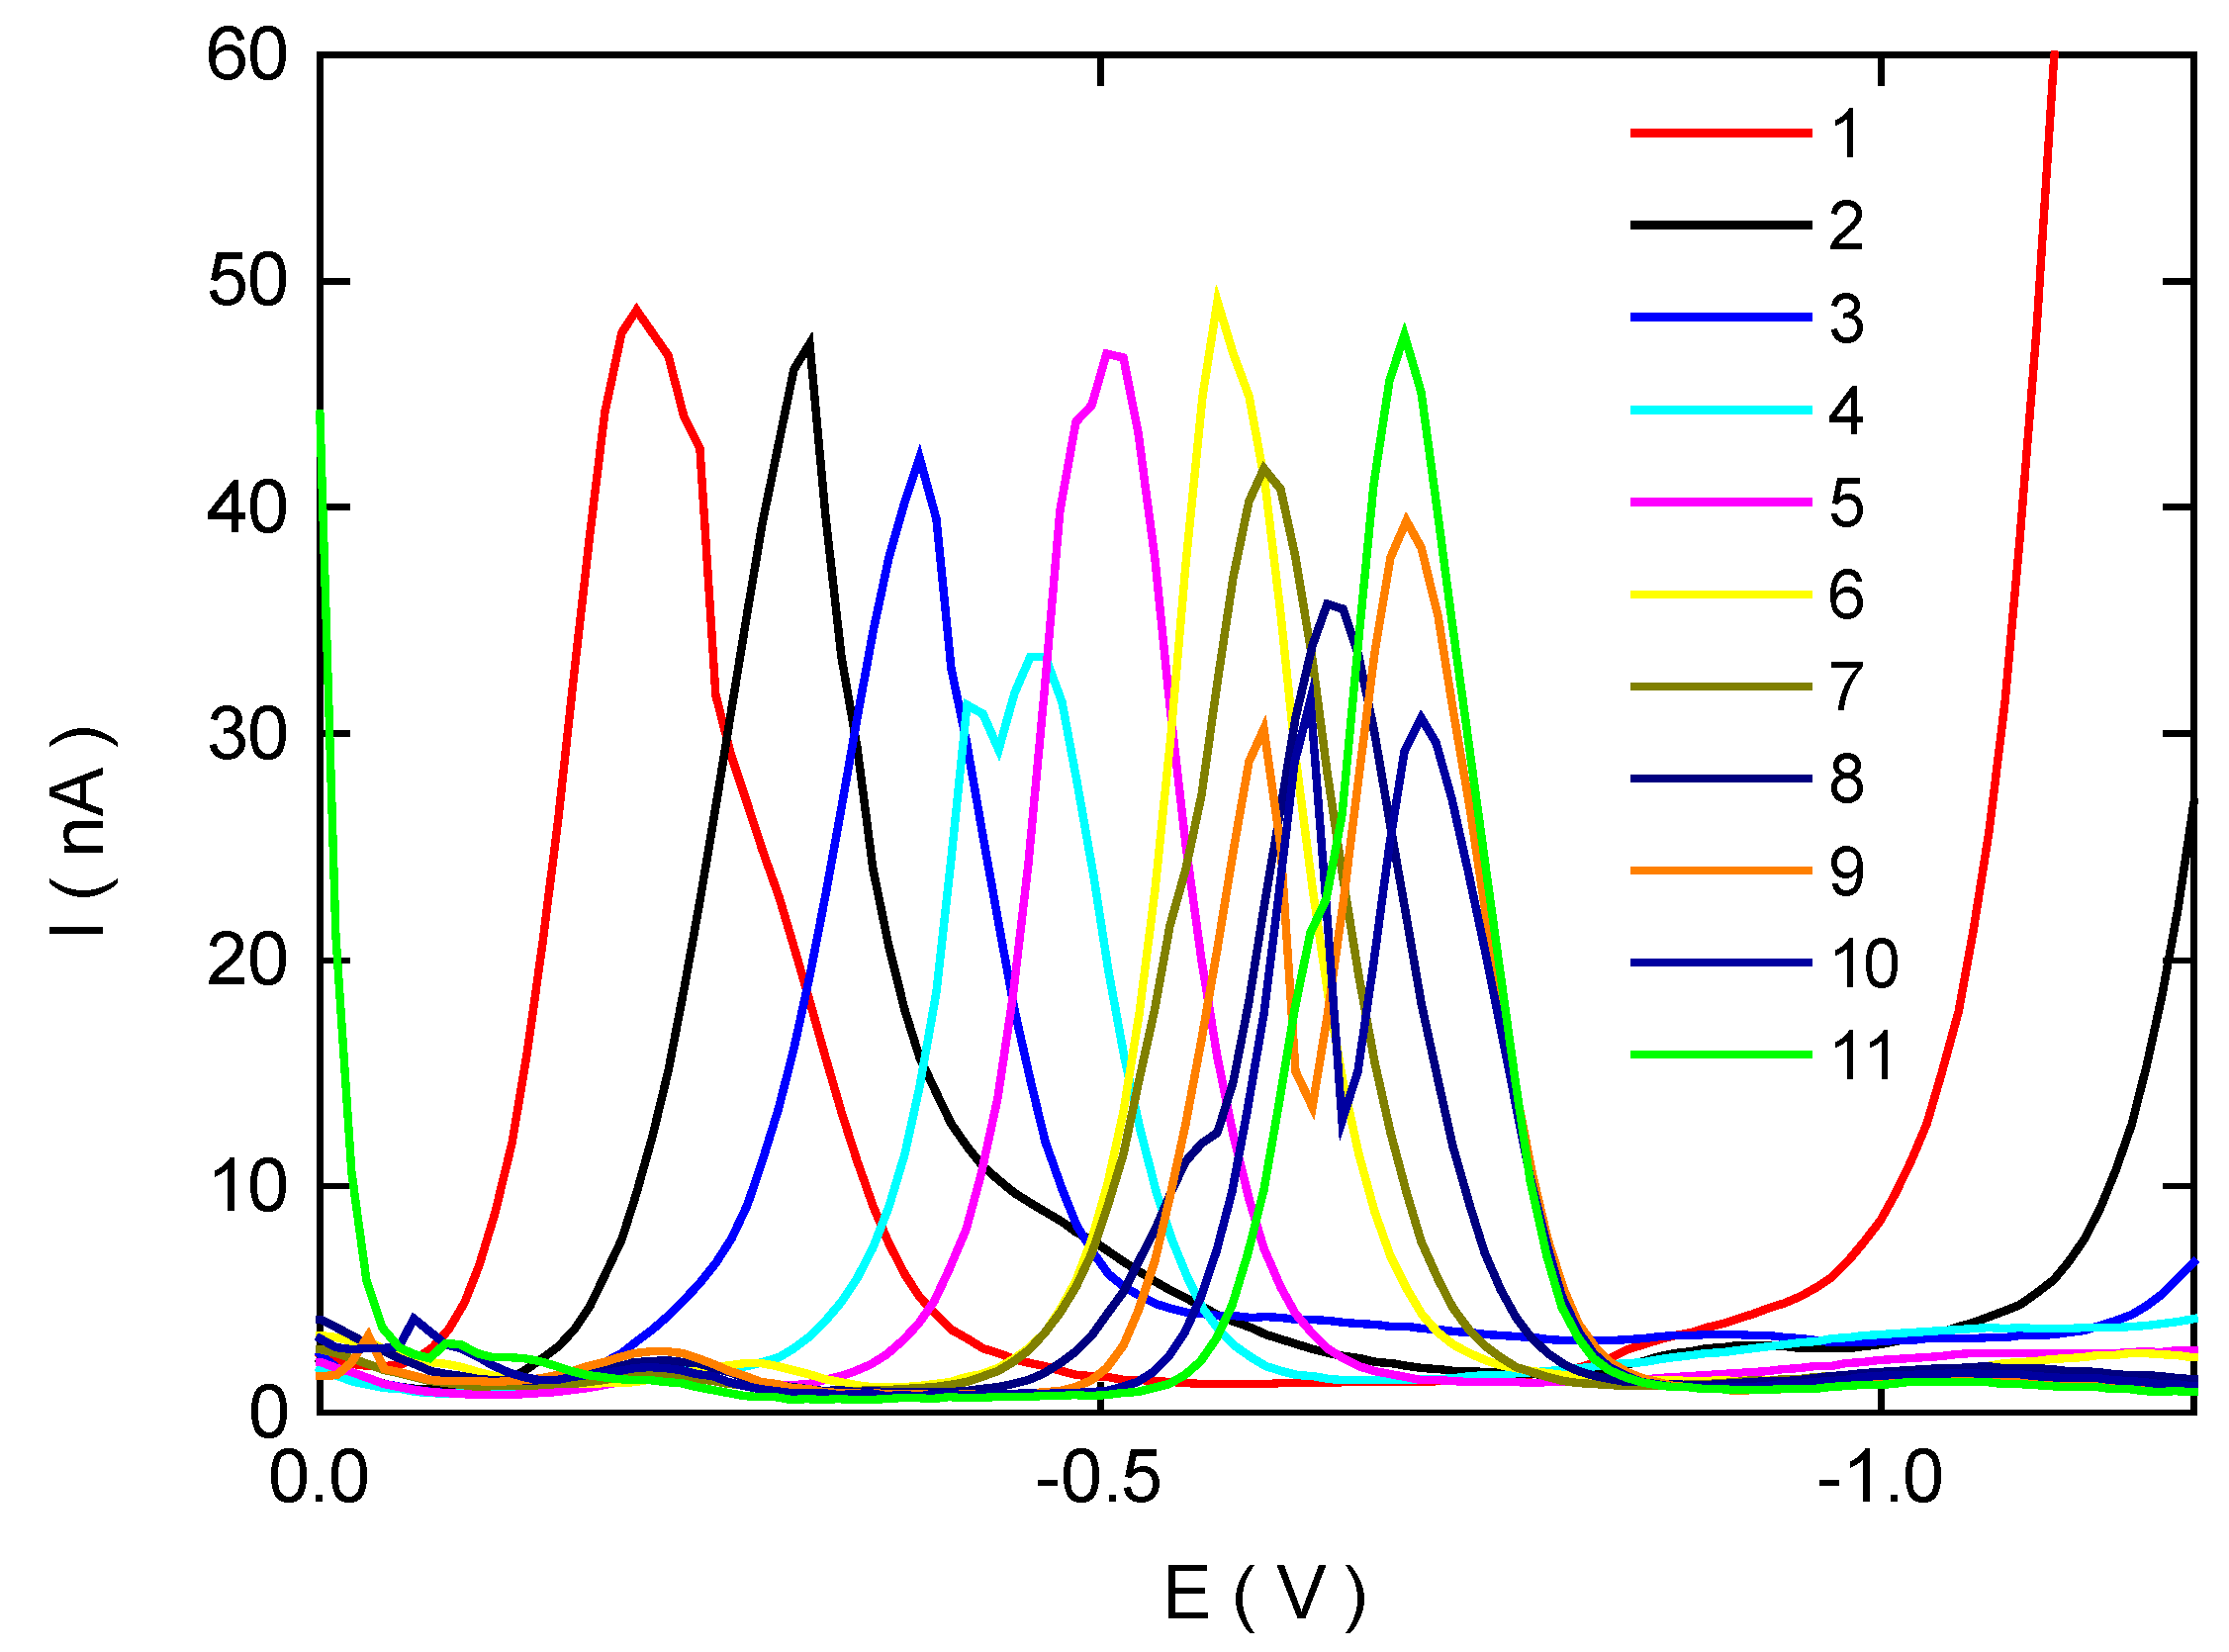
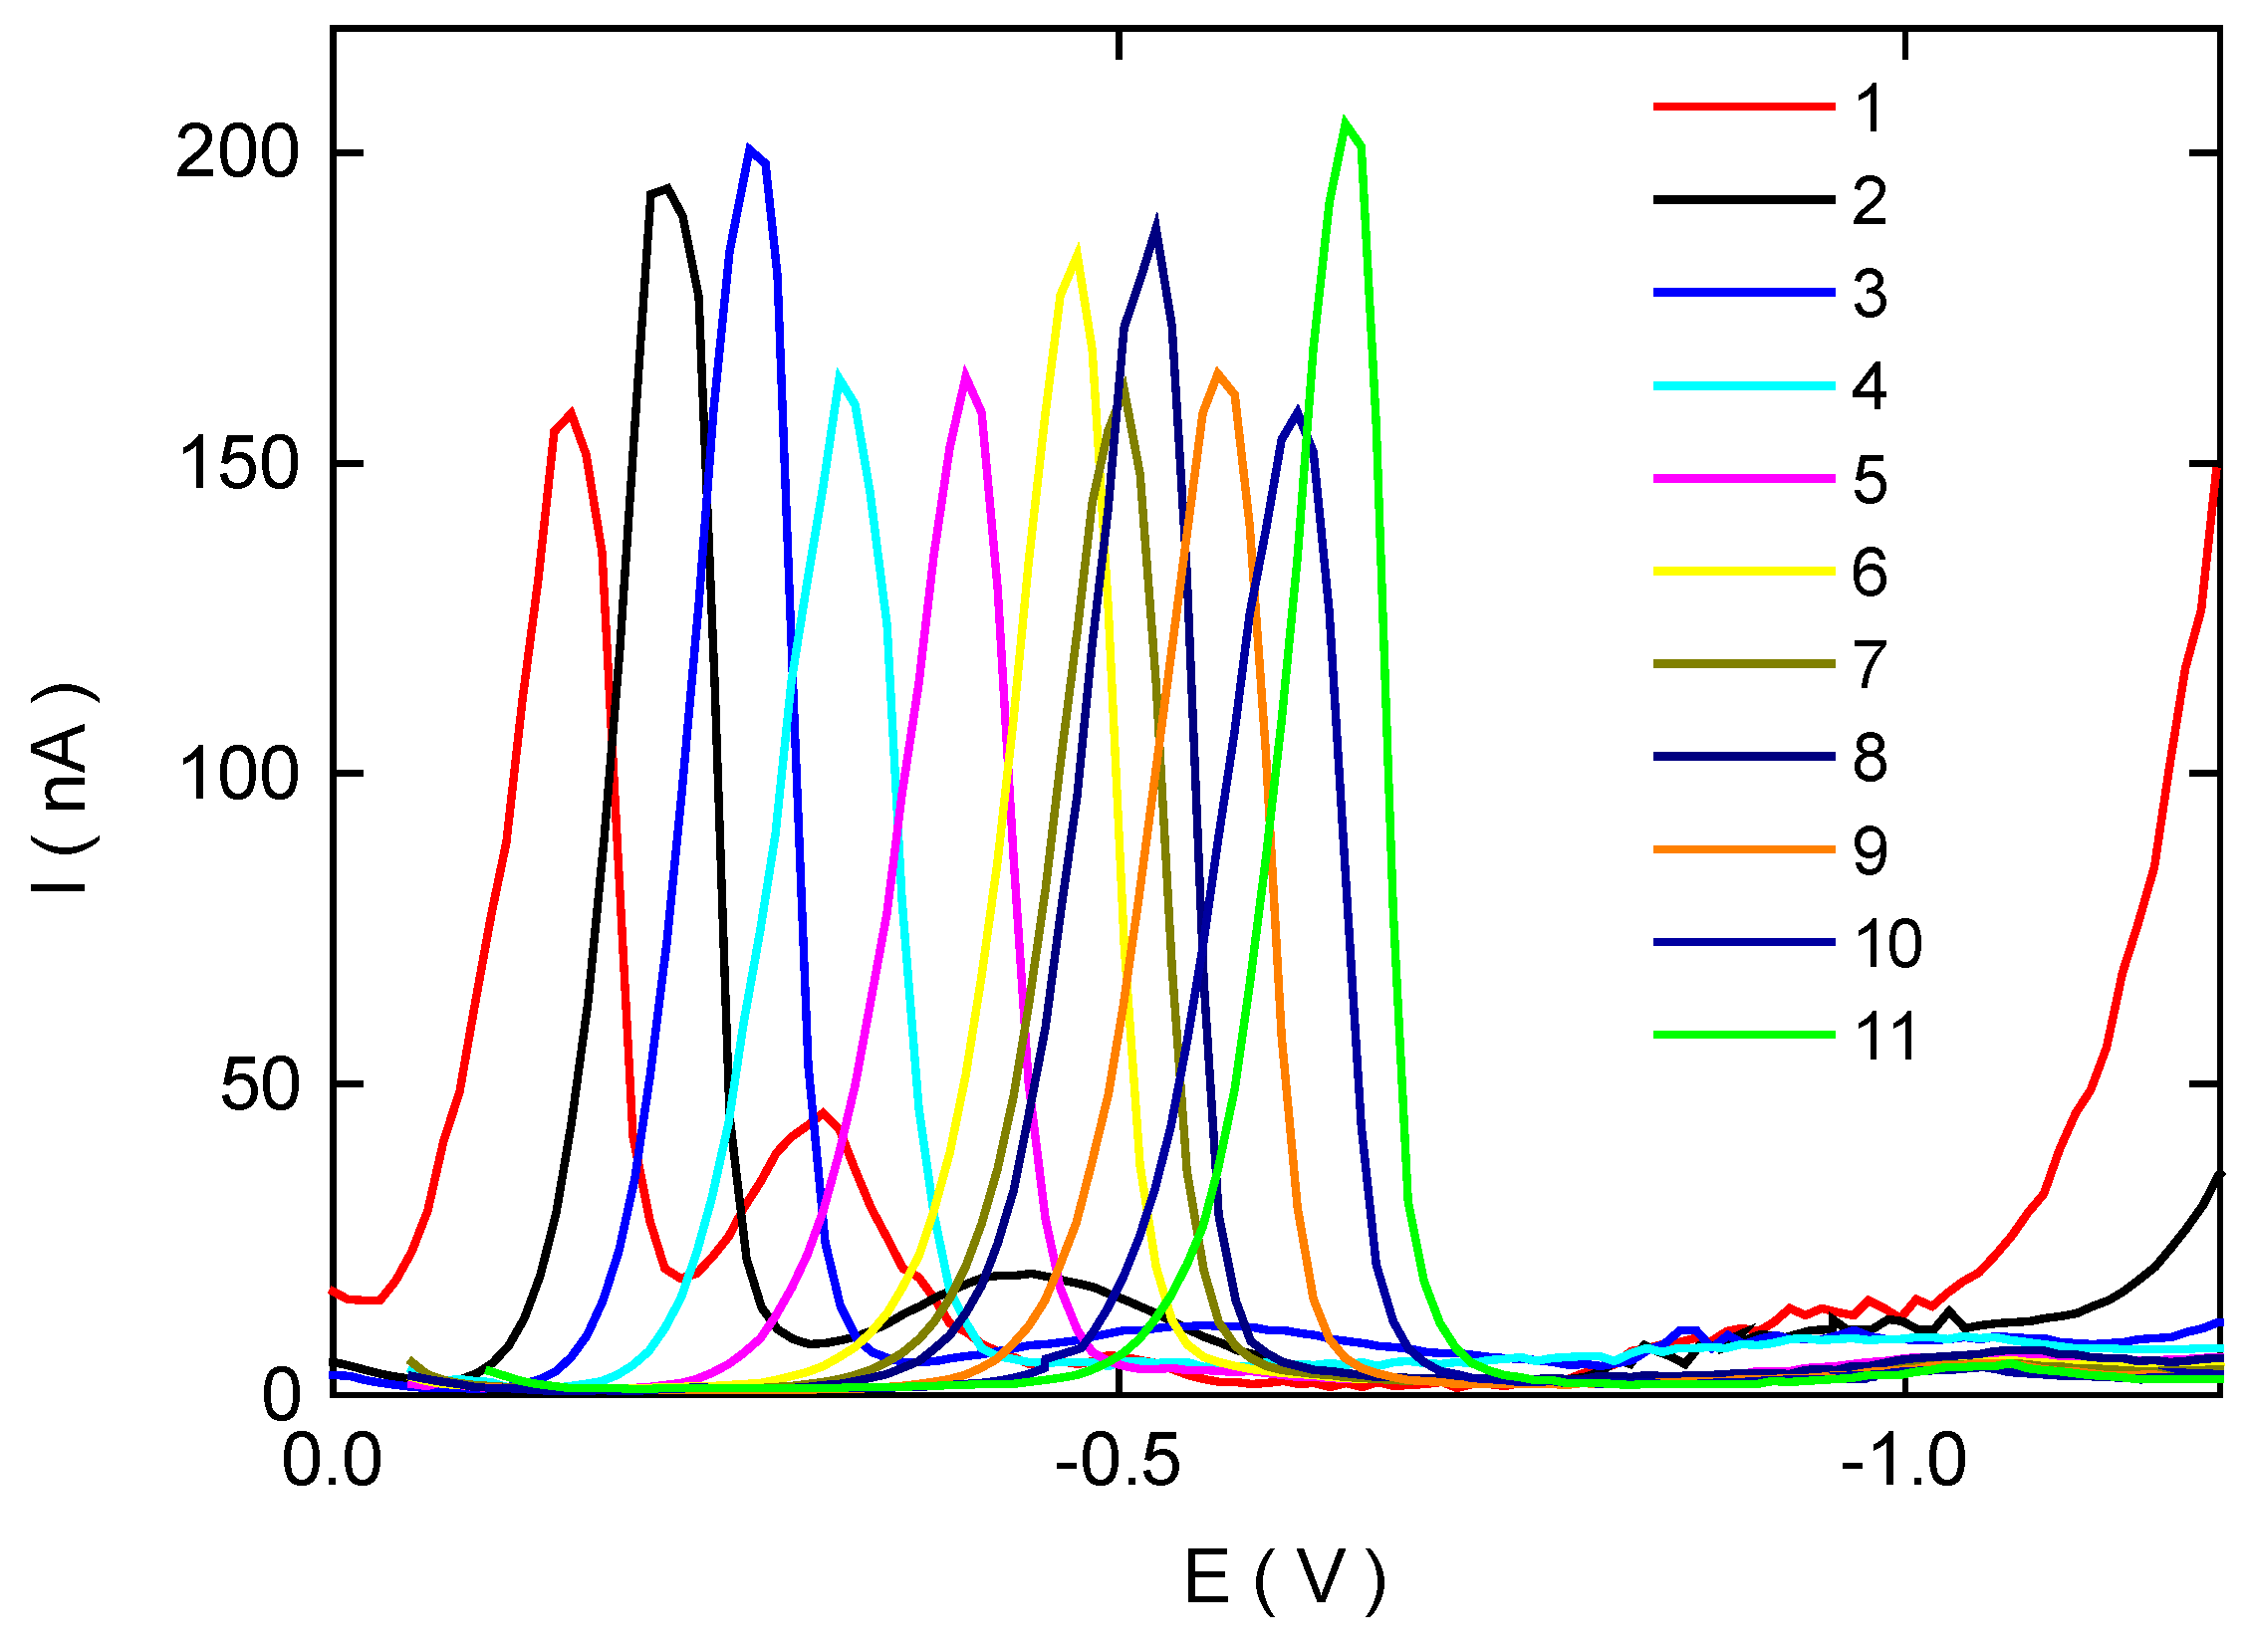
DP voltammograms of 1·10−5 mol·L−1 2-NBP at HMDE in the mixed Britton-Robinson buffer – methanol (1:1) medium at resulting pHm 2.6 (1), 3.9 (2), 4.9 (3), 5.9 (4), 7.1 (5), 8.1 (6), 8.7 (7), 9.3 (8), 10.2 (9), 11.2 (10), 12.0 (11).
Figure 1.
DP voltammograms of 1·10−5 mol·L−1 2-NBP at HMDE in the mixed Britton-Robinson buffer – methanol (1:1) medium at resulting pHm 2.6 (1), 3.9 (2), 4.9 (3), 5.9 (4), 7.1 (5), 8.1 (6), 8.7 (7), 9.3 (8), 10.2 (9), 11.2 (10), 12.0 (11).

Results and Discussion
Differential Pulse Voltammetry of 2-Nitrobiphenyl at HMDE
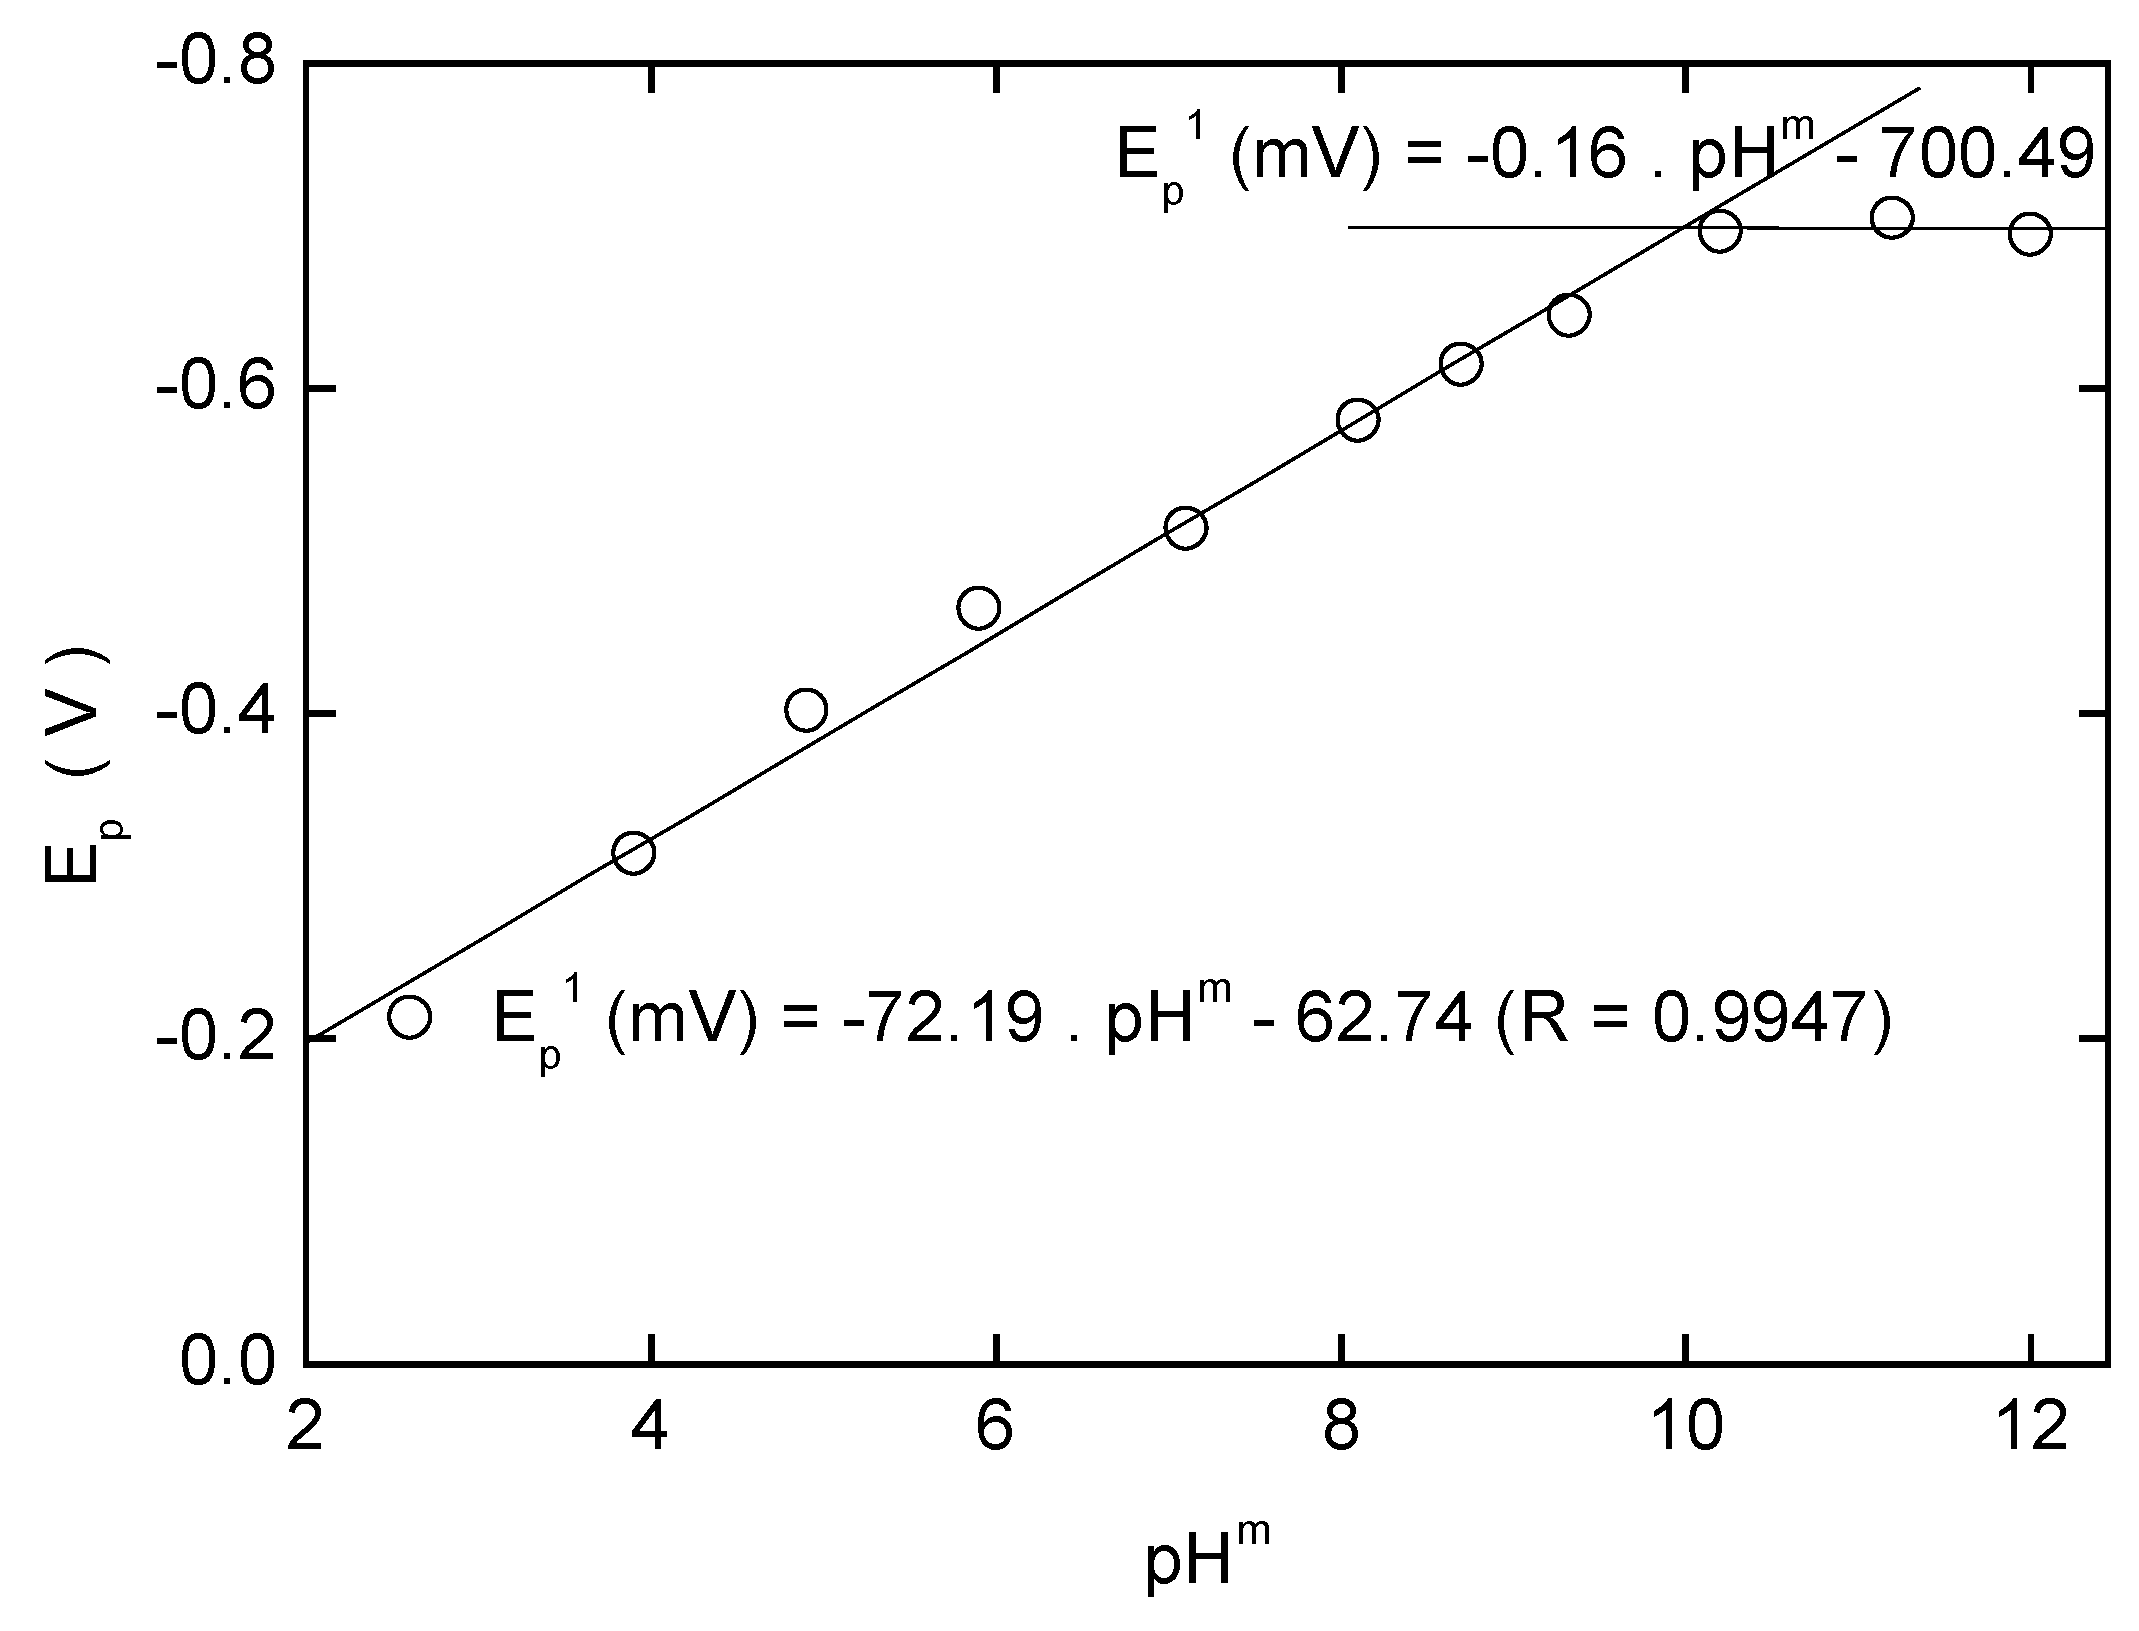
The effect of pH on differential pulse voltammograms of 2-NBP was investigated in the mixture of Britton-Robinson buffer and methanol (1:1) (see Fig. 1). It was found that the substance gives one, well developed peak shifting towards more negative potentials with increasing resulting pH of the mixture (further denoted as pHm ) (see Fig. 2). At pHm 5.9, 10.2 and 11.2 the peak was splitted (see Table 1). The highest, best-developed and most easily evaluated peak was obtained at pH 12 (see Fig. 1). The height of the peak was measured from the straight line connecting the minima before and after the peak.
Figure 2.
The dependence of the first peak potential Ep 1 of 2-NBP (c = 1·10−5 mol·L−1) at HMDE on the resulting pHm of the Britton-Robinson buffer – methanol (1:1) mixture.
Figure 2.
The dependence of the first peak potential Ep 1 of 2-NBP (c = 1·10−5 mol·L−1) at HMDE on the resulting pHm of the Britton-Robinson buffer – methanol (1:1) mixture.

Figure 3.
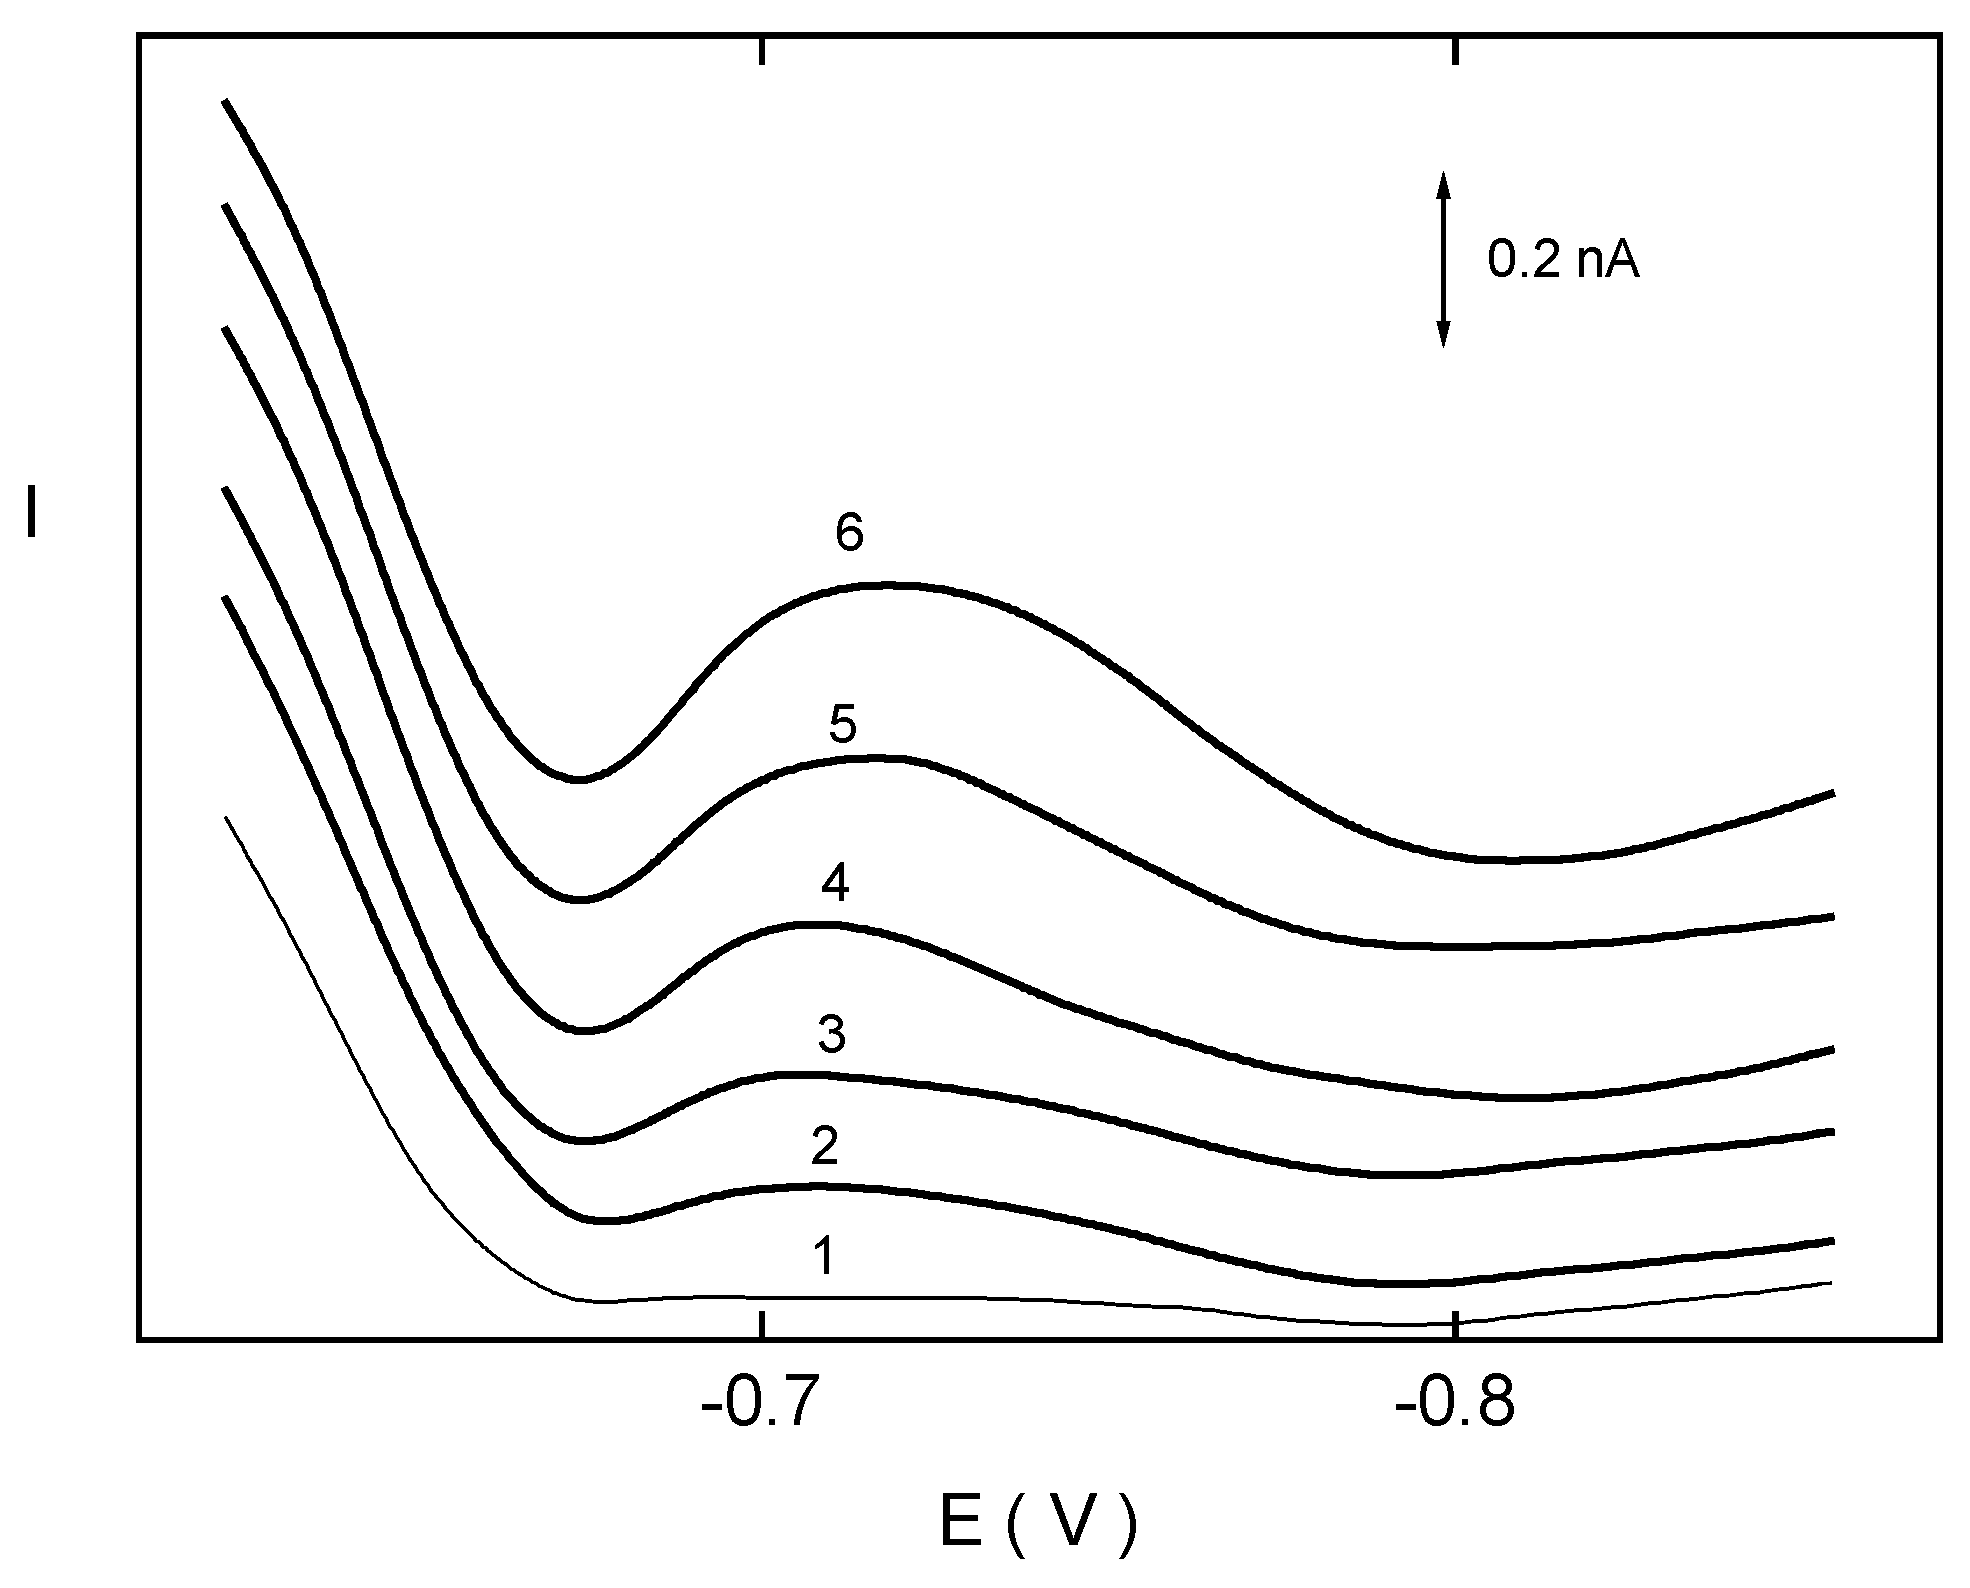
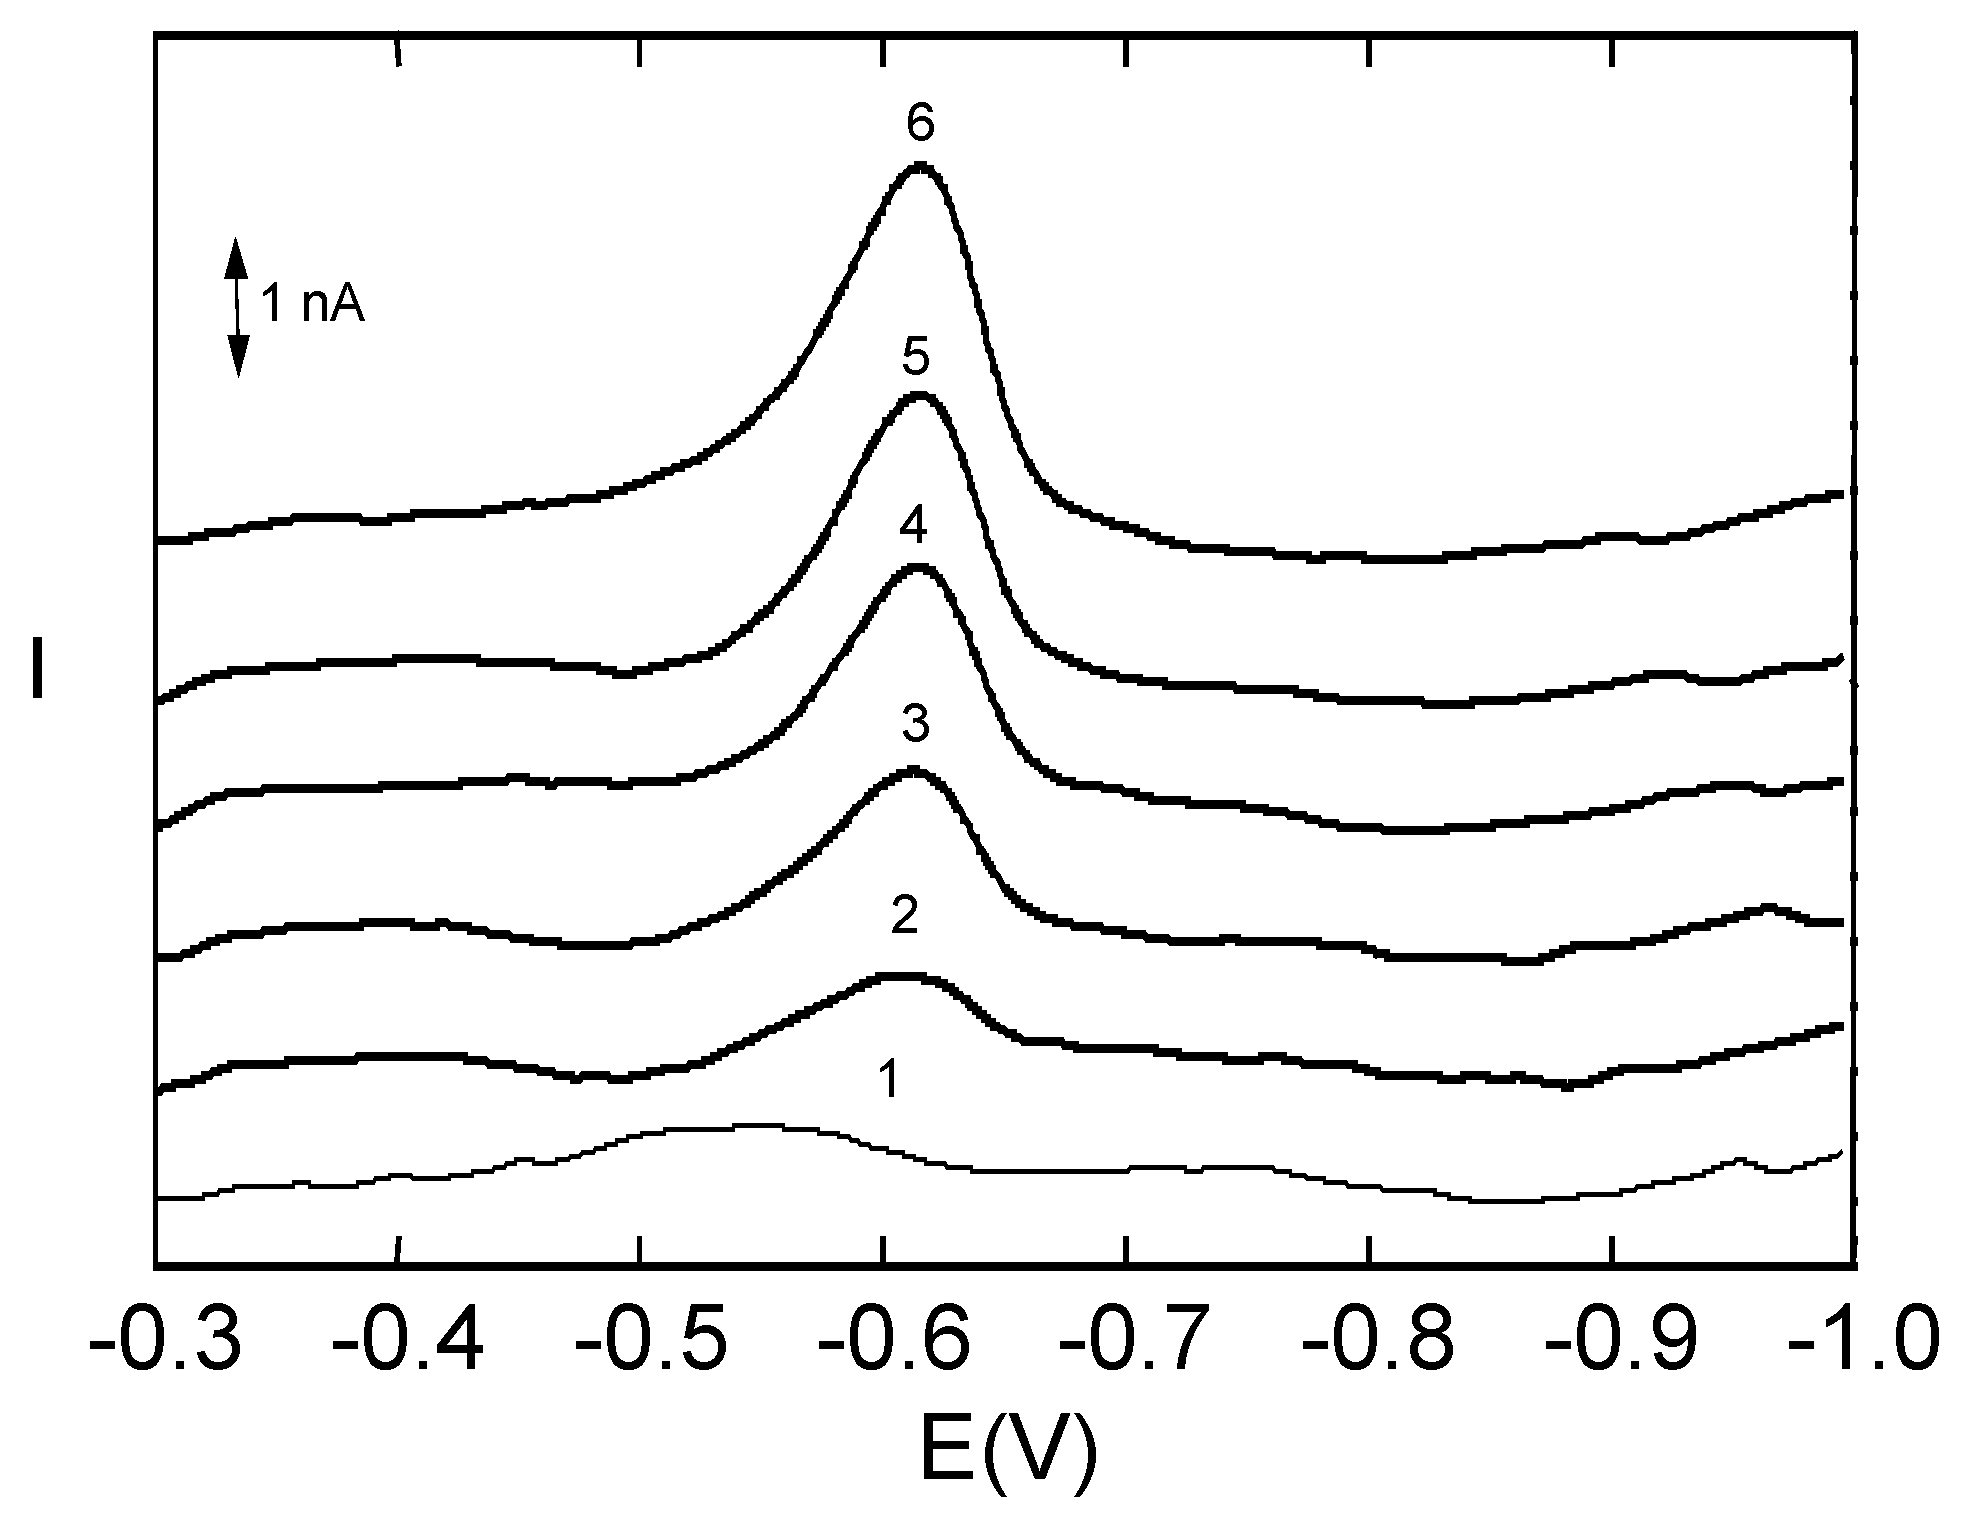
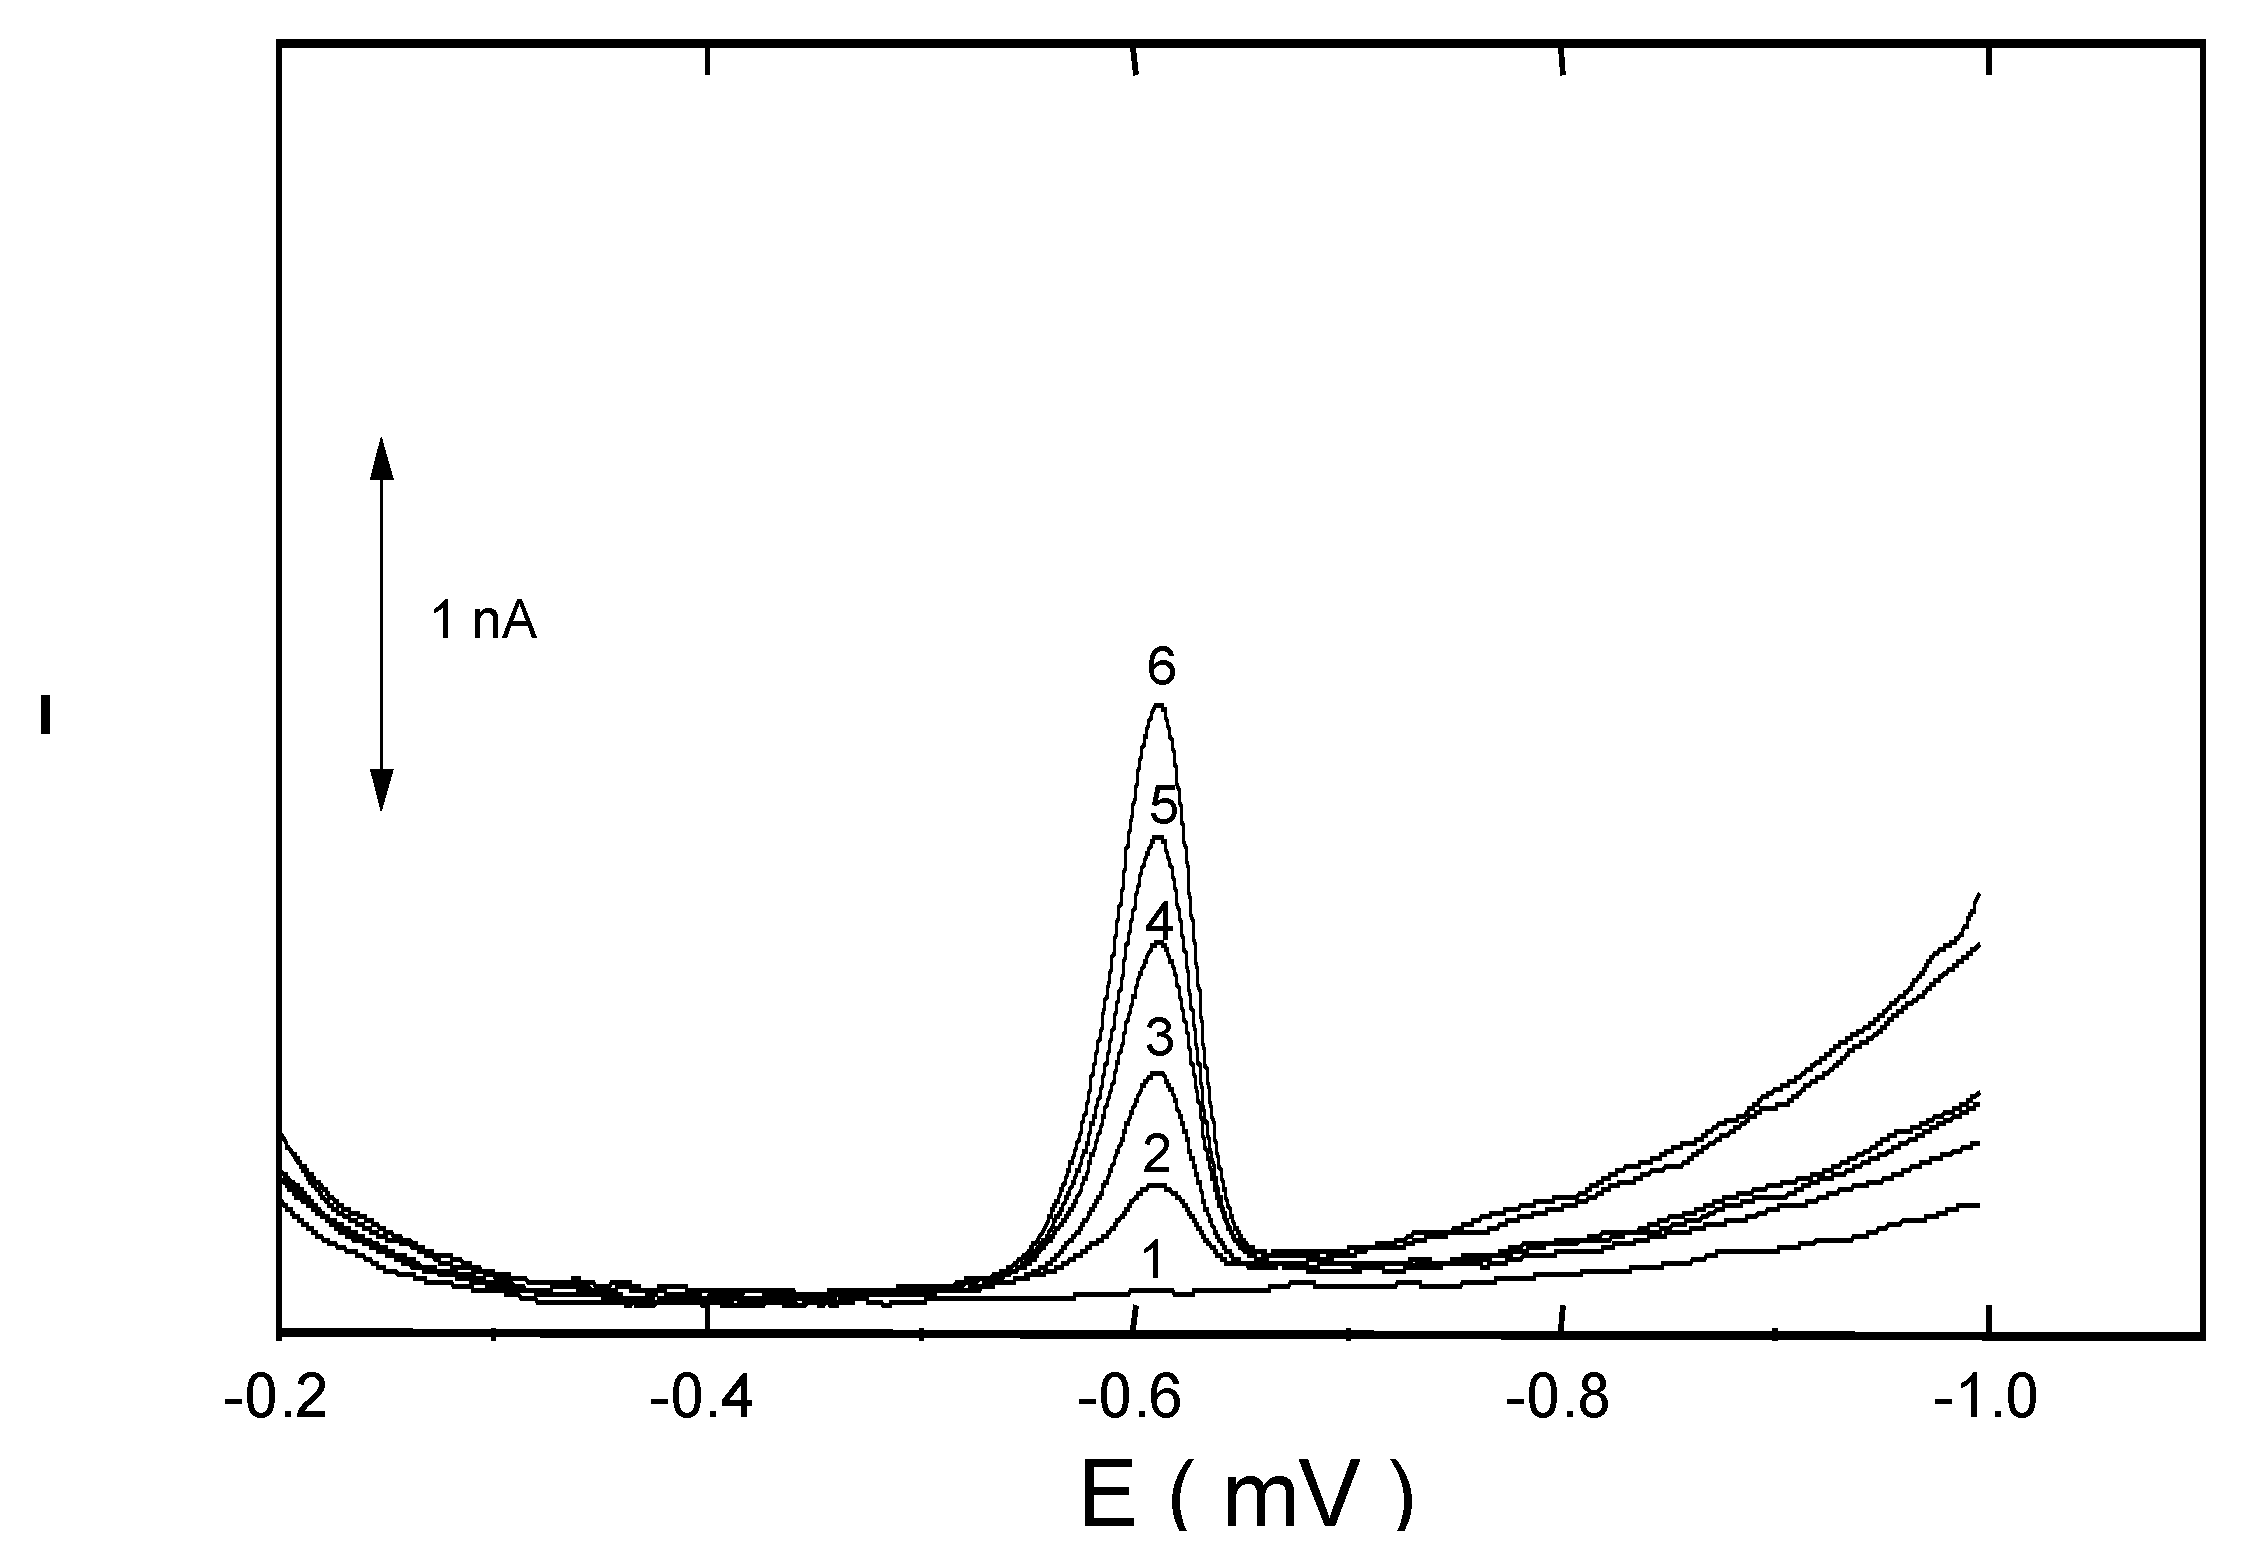
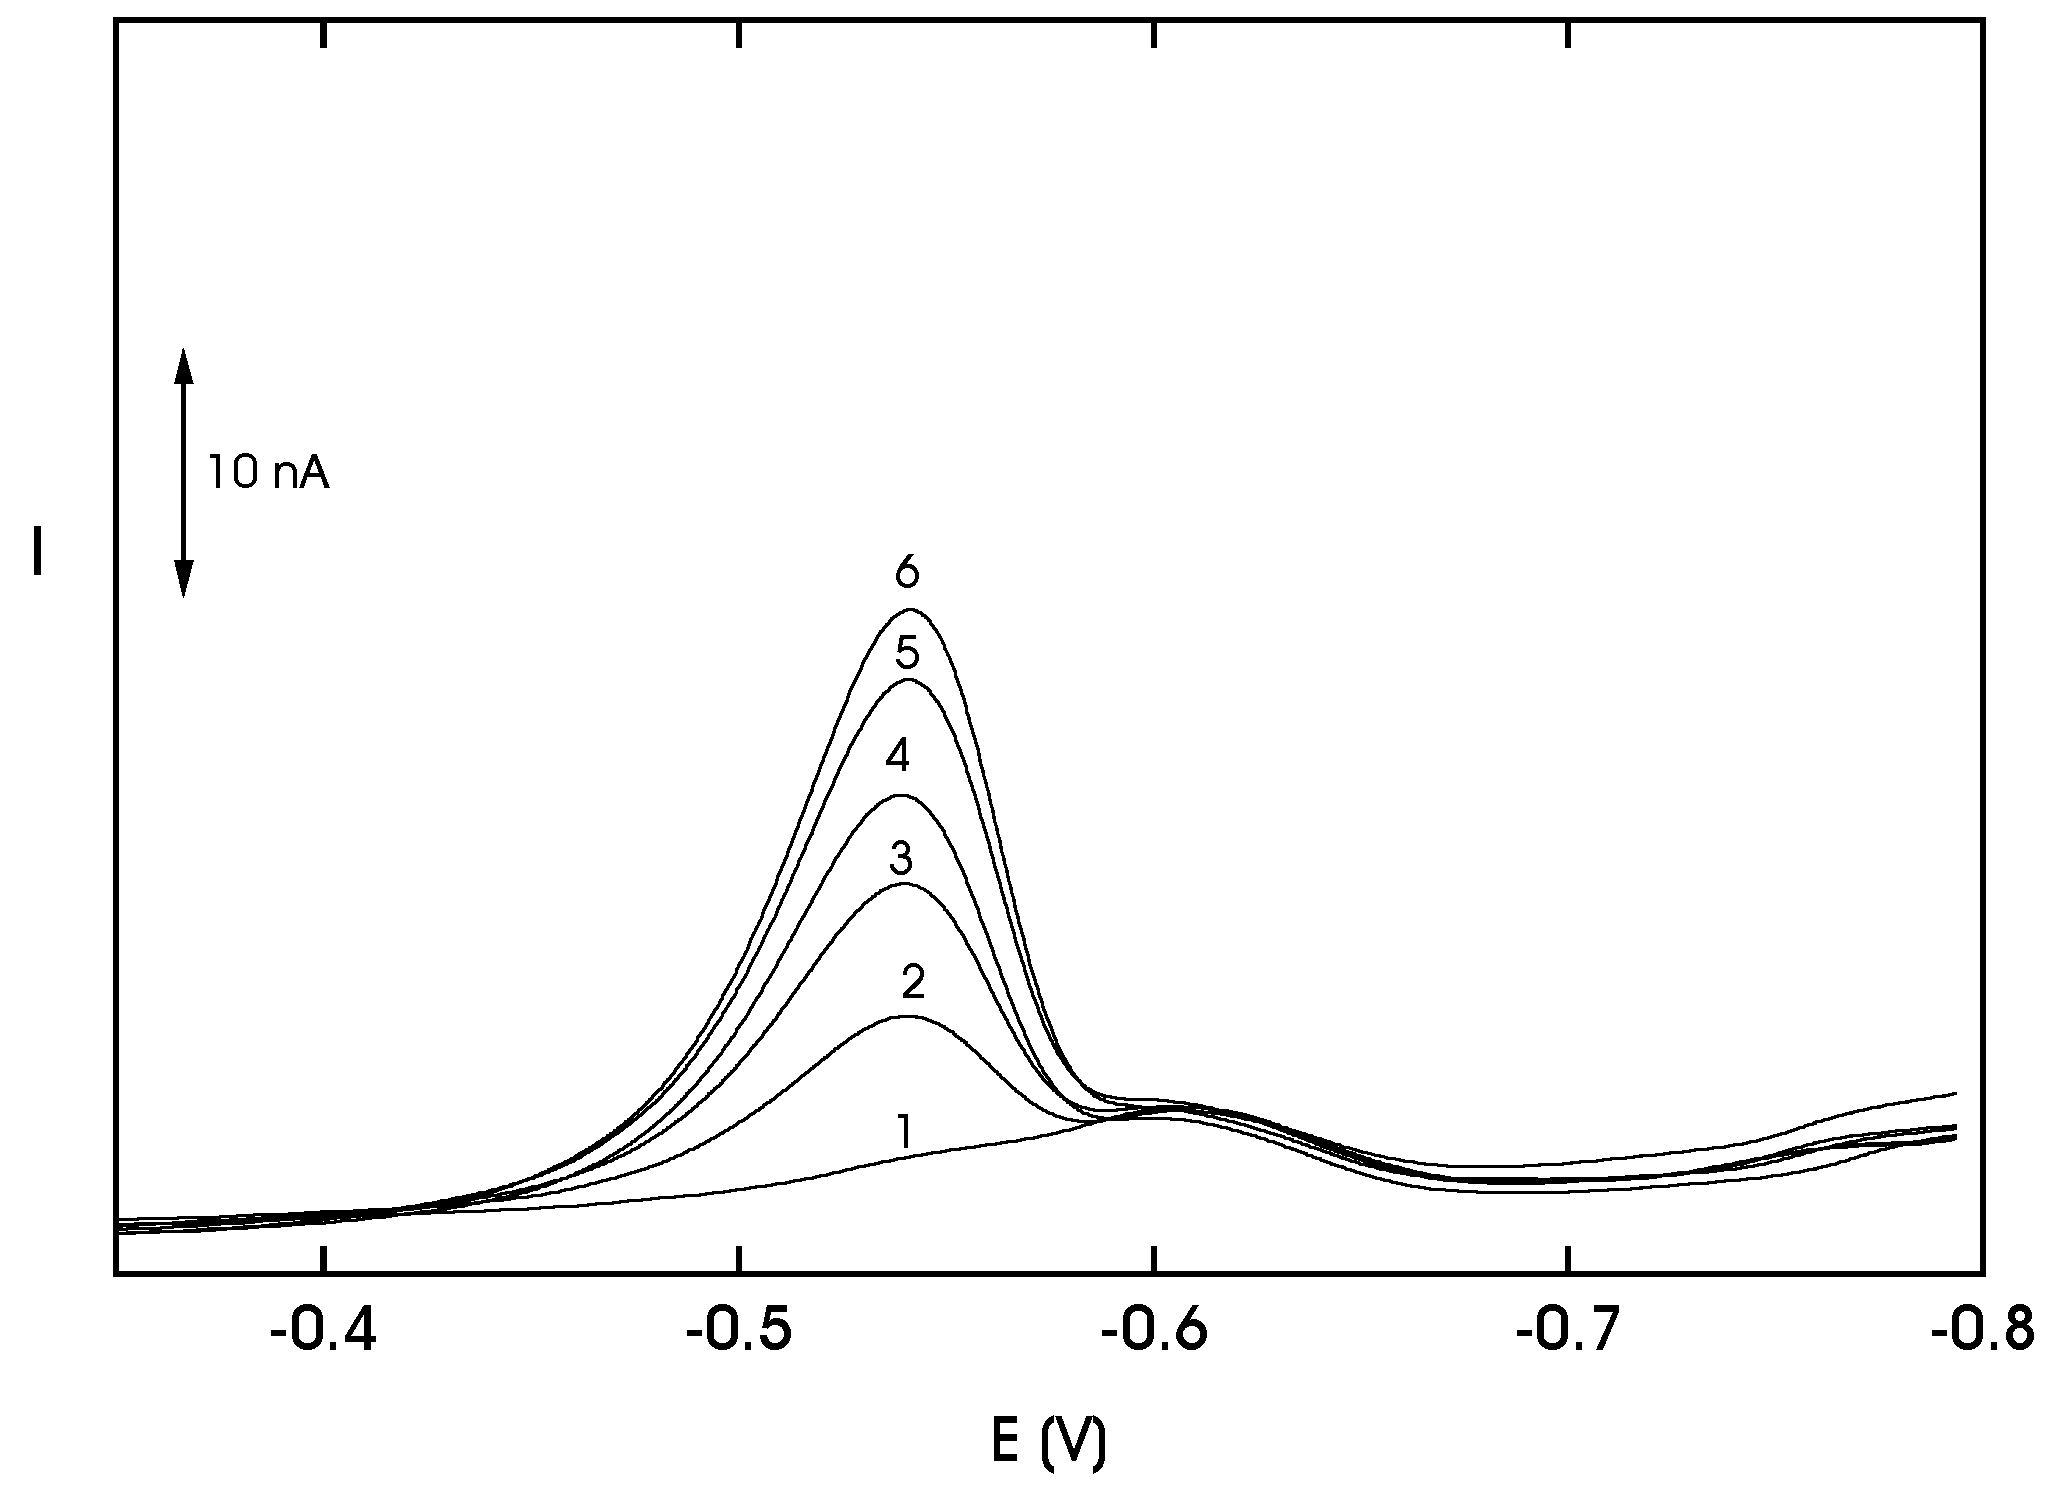
DP voltammograms of 2-NBP at HMDE in the lowest attainable concentration range. Britton-Robinson buffer – methanol (1:1) mixture with resulting pHm 12.0. Concentration of 2-NBP (mol·L−1): 0 (1), 2·10−8 (2), 4·10−8 (3), 6·10−8 (4), 8·10−8 (5), 10·10−8 (6).
Figure 3.
DP voltammograms of 2-NBP at HMDE in the lowest attainable concentration range. Britton-Robinson buffer – methanol (1:1) mixture with resulting pHm 12.0. Concentration of 2-NBP (mol·L−1): 0 (1), 2·10−8 (2), 4·10−8 (3), 6·10−8 (4), 8·10−8 (5), 10·10−8 (6).

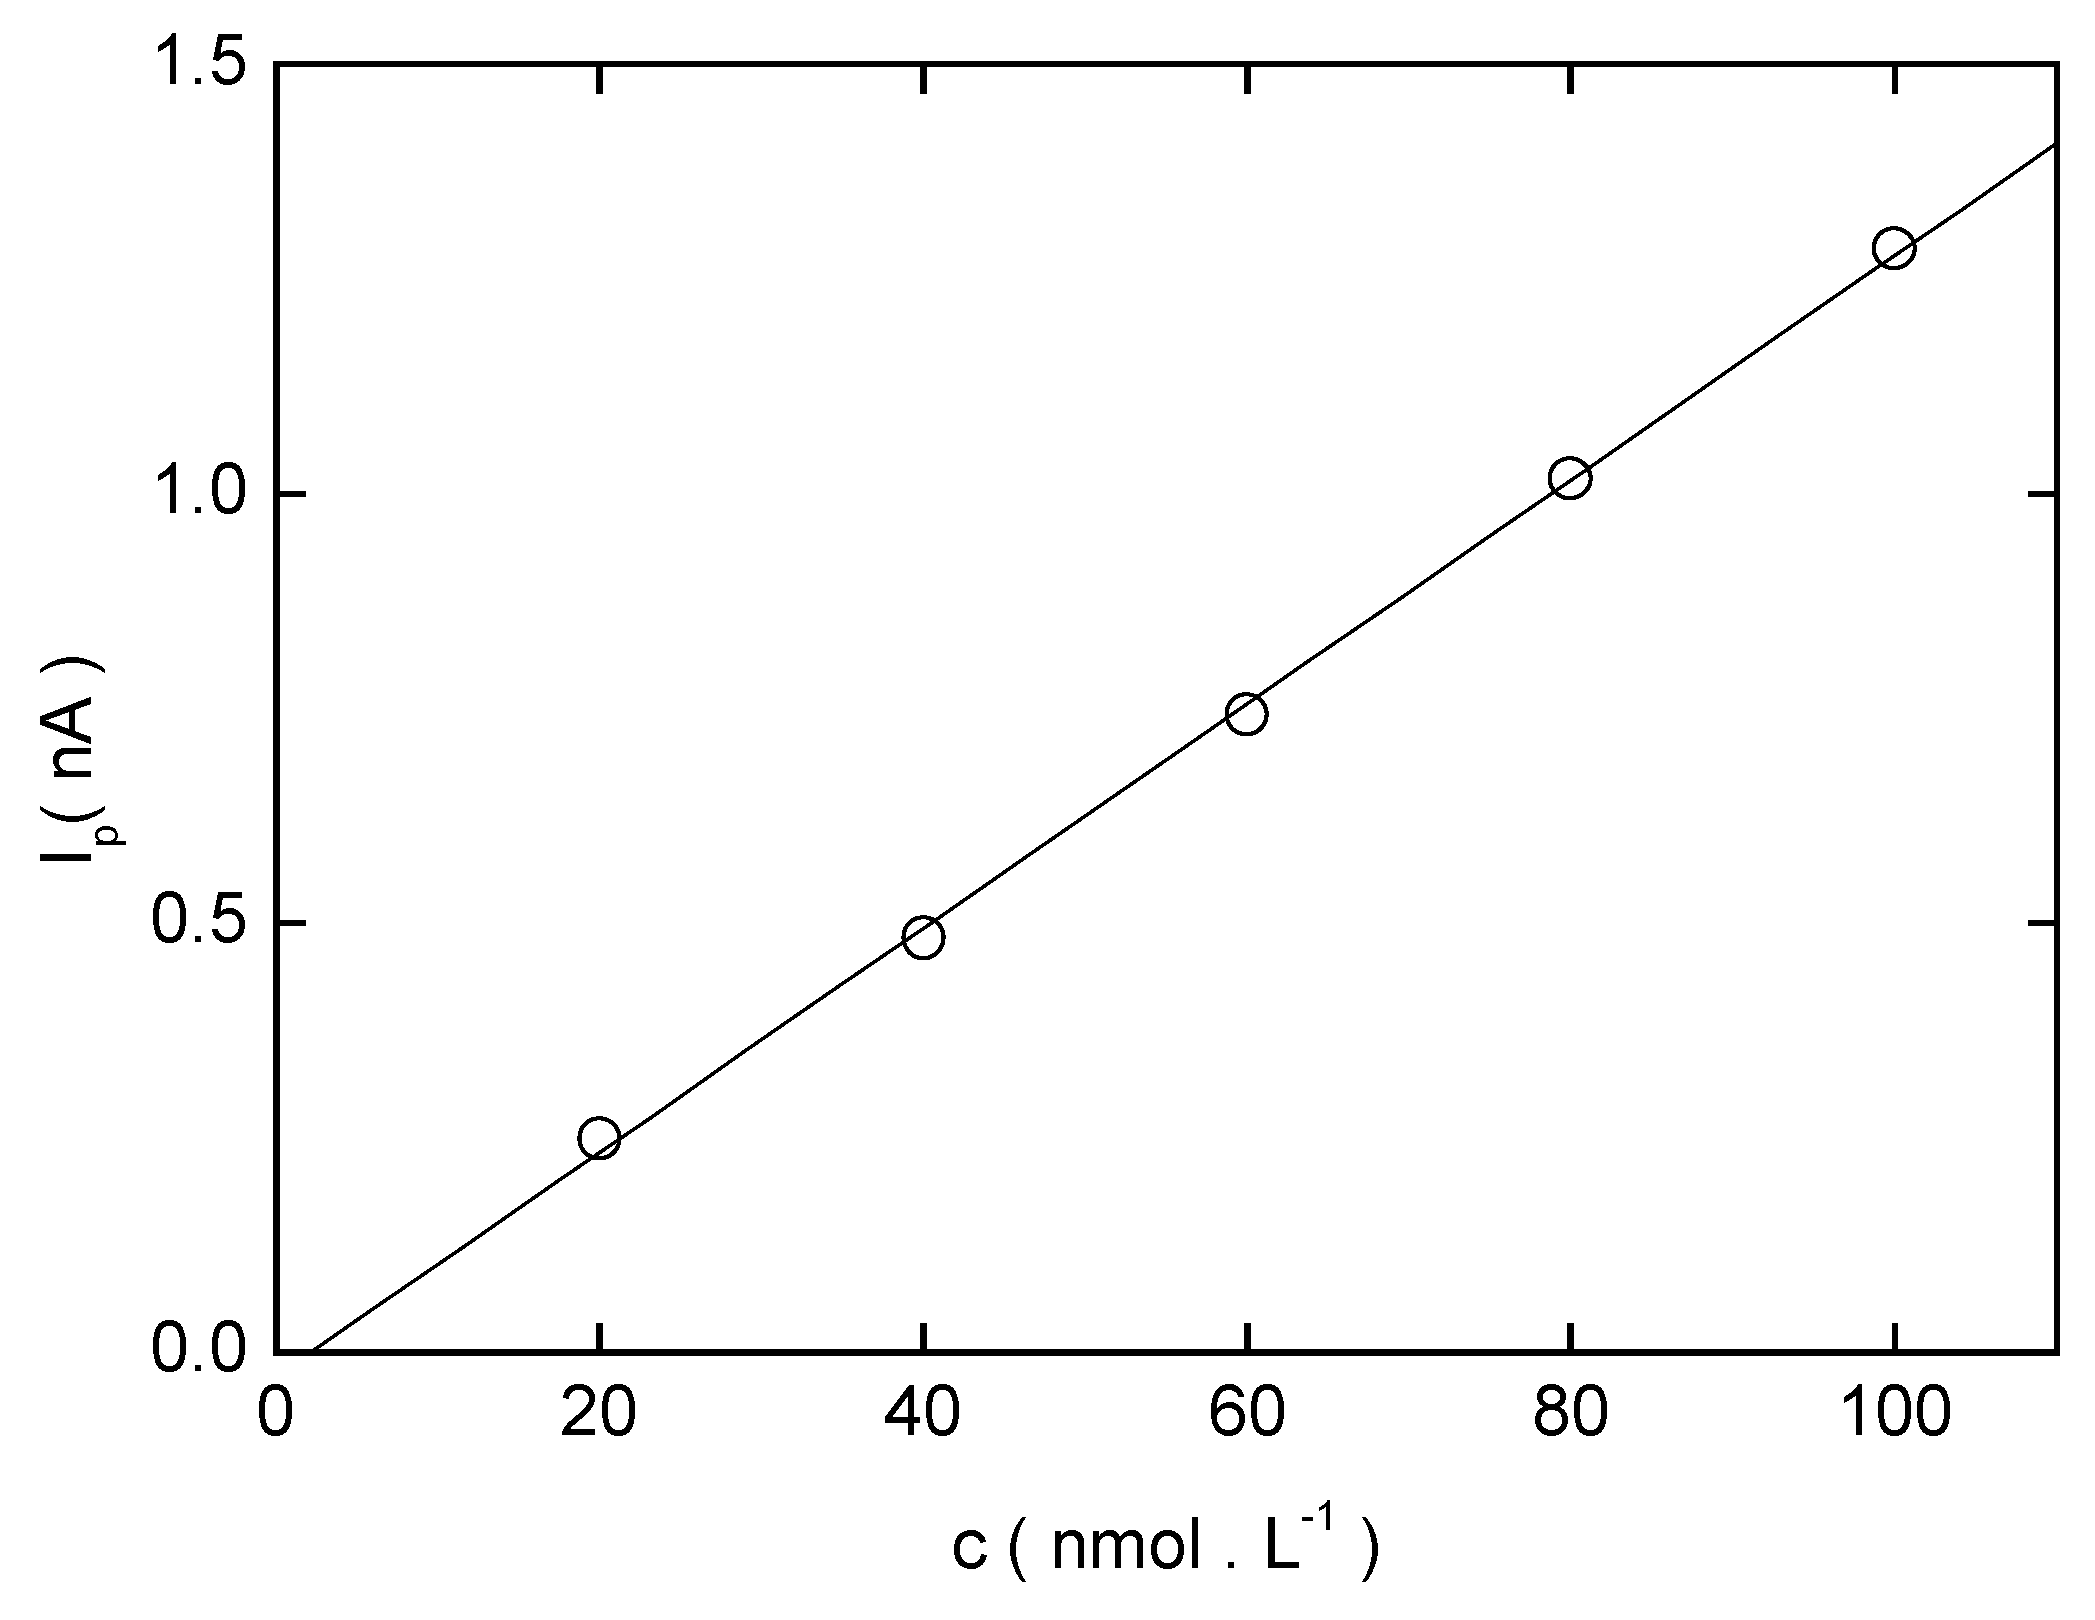
The calibration curves are linear within the concentration range from 2.10−8 to 1.10−5 mol·L−1 and their parameters are given in Table 2. DP voltammograms corresponding to the lowest attainable concentration range are depicted in Fig. 3.

Table 1.
The dependence of the peak potential (Ep) and peak current (Ip) of 2-NBP measured by DPV at HMDE on resulting pHm of the Britton-Robinson buffer – methanol (1:1) mixture.
| PHa | pHb | Ep 1(mV) | Ip 1(nA) | Ep 2(mV) | Ip 2(nA) |
|---|---|---|---|---|---|
| 2.0 | 2.6 | -213 | 46.7 | -- | -- |
| 3.0 | 4.0 | -314 | 45.9 | -- | -- |
| 4.0 | 4.9 | -402 | 39.6 | -- | -- |
| 5.0 | 5.9 | -465 | 31.5 | -415 | 28.5 |
| 6.0 | 7.1 | -514 | 45.2 | -- | -- |
| 7.0 | 8.1 | -580 | 47.9 | -- | -- |
| 8.0 | 8.7 | -615 | 40.8 | -- | -- |
| 9.0 | 9.3 | -645 | 35.1 | -- | -- |
| 10.0 | 10.2 | -696 | 38.5 | -605 | -18.5 |
| 11.0 | 11.2 | -705 | 29.4 | -634 | -29.4 |
| 12.0 | 12.0 | -695 | 46.5 | -- | -- |
a pH of Britton-Robinson buffer; b resulting pHm of the Britton-Robinson buffer – methanol (1:1) mixture; 1 first peak; 2 second peak
Table 2.
Parameters of calibration curves for the determination of 2-NBP by DPV at HMDE in Britton-Robinson buffer – methanol (1:1) mixture of resulting pHm 12.
| c (mol·L−1) | Slope (mA mol−1 L) | Intercept (nA) | Correlation coefficient | L Q (mol·L−1) |
|---|---|---|---|---|
| (2-10) .10−6 | 5.3 | 0.5 | 0.9998 | ---- |
| (2-10) .10−7 | 5.3 | -0.1 | 0.9998 | ---- |
| (2-10) .10−8 | 4.8 | 0.0 | 0.9957 | 3.1 .10−8 |
Differential Pulse Voltammetry of 3-Nitrobiphenyl at HMDE
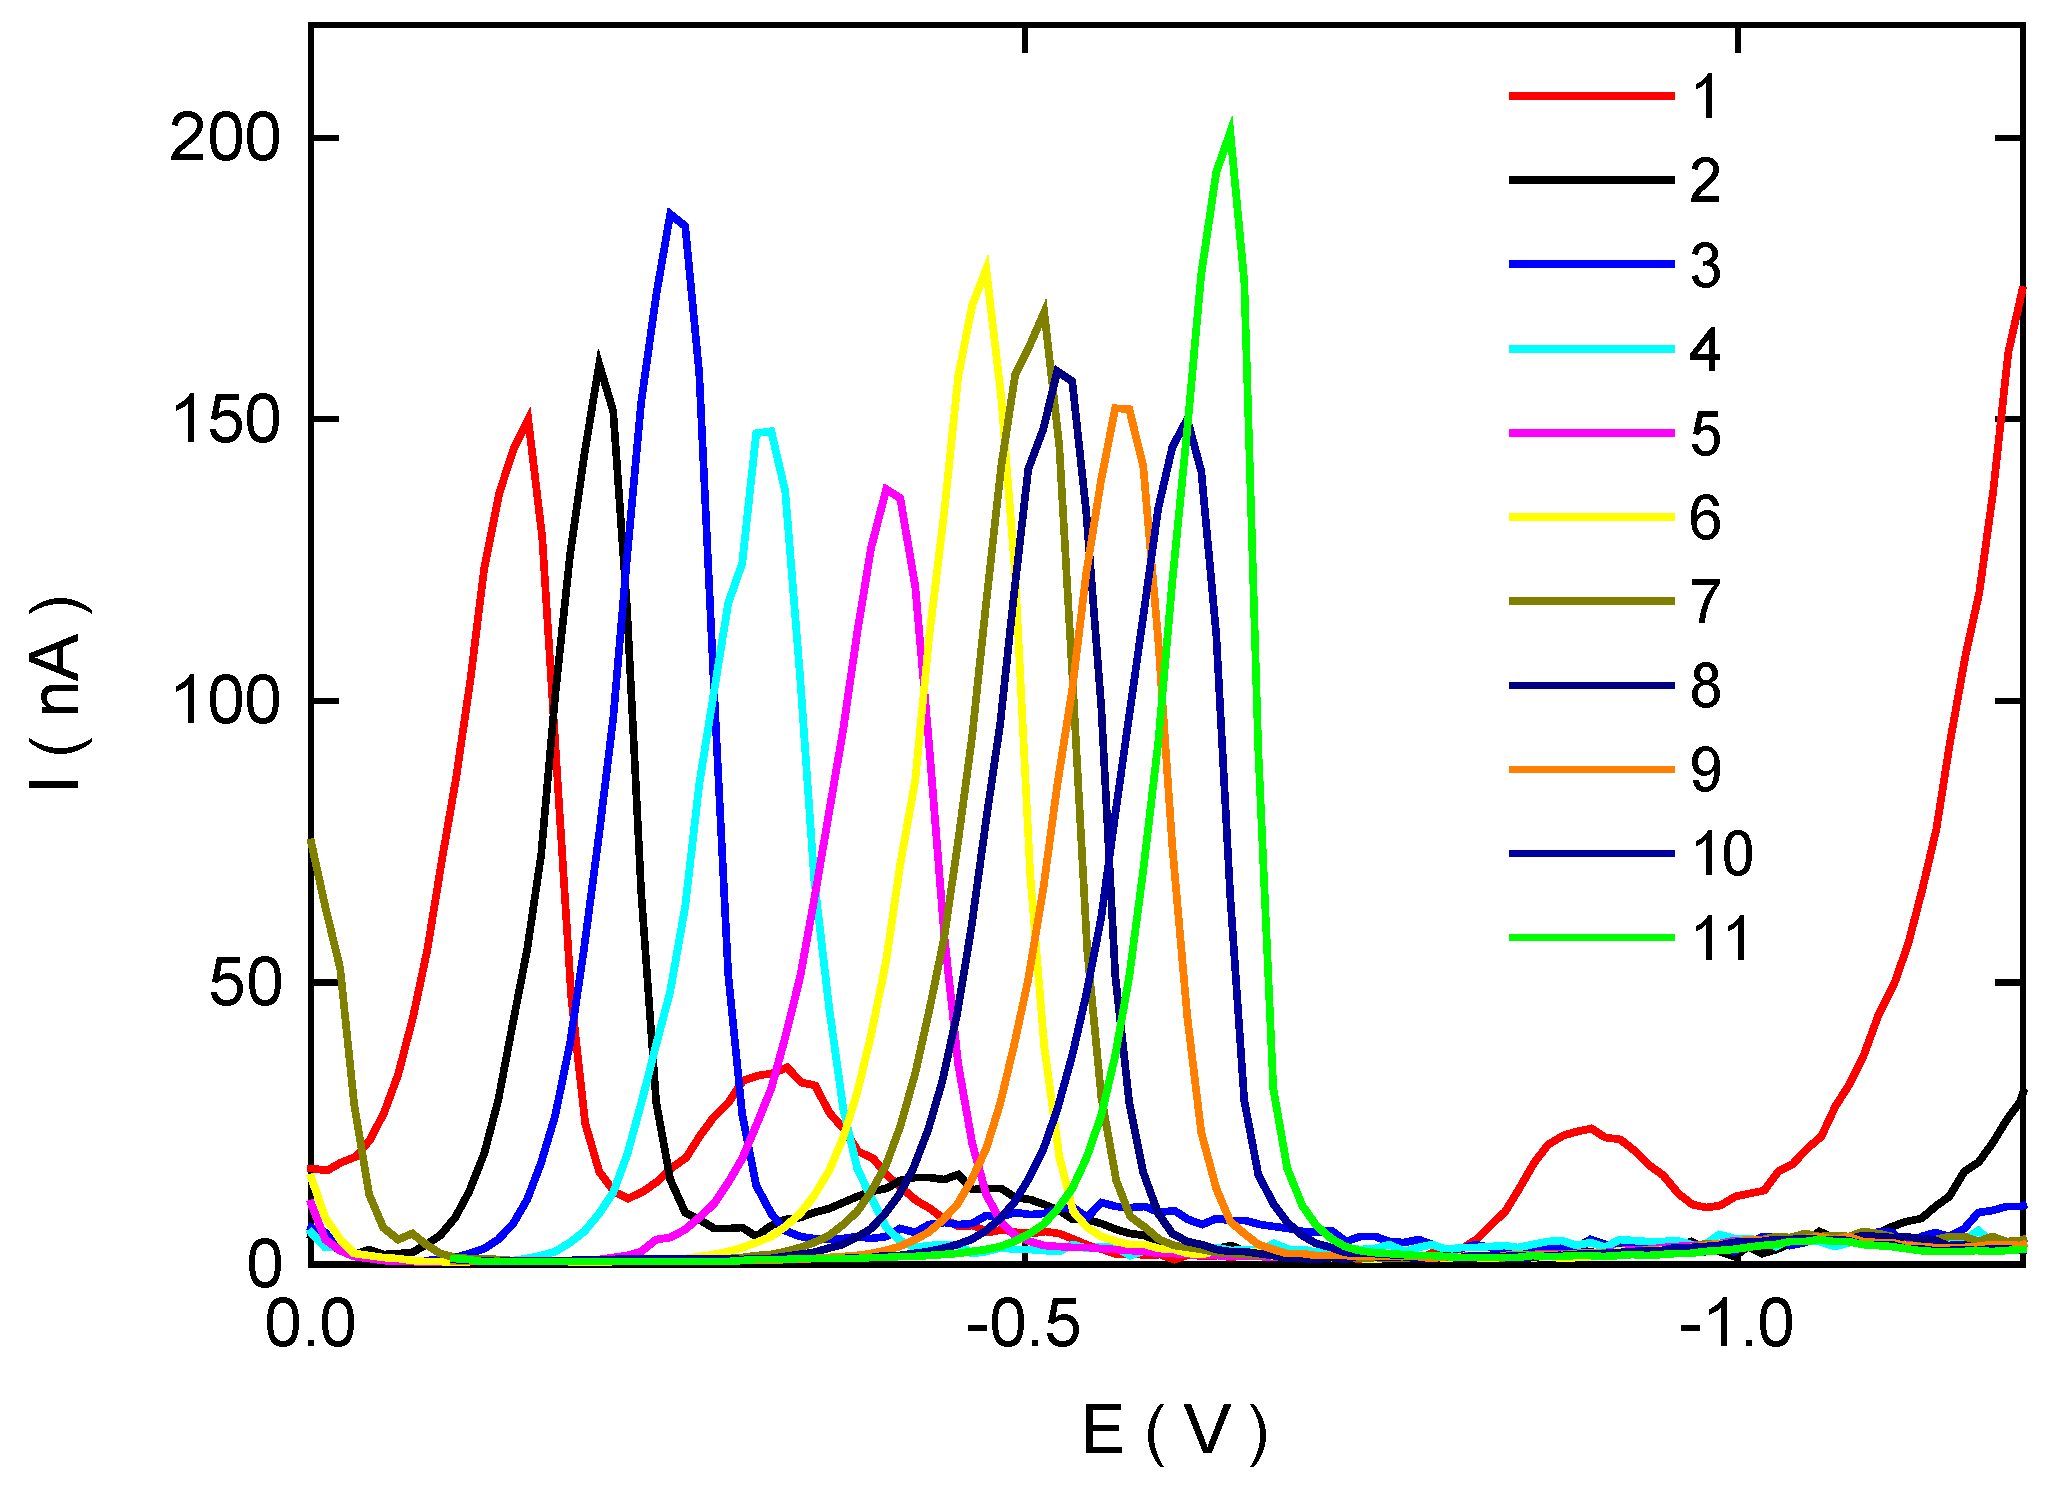
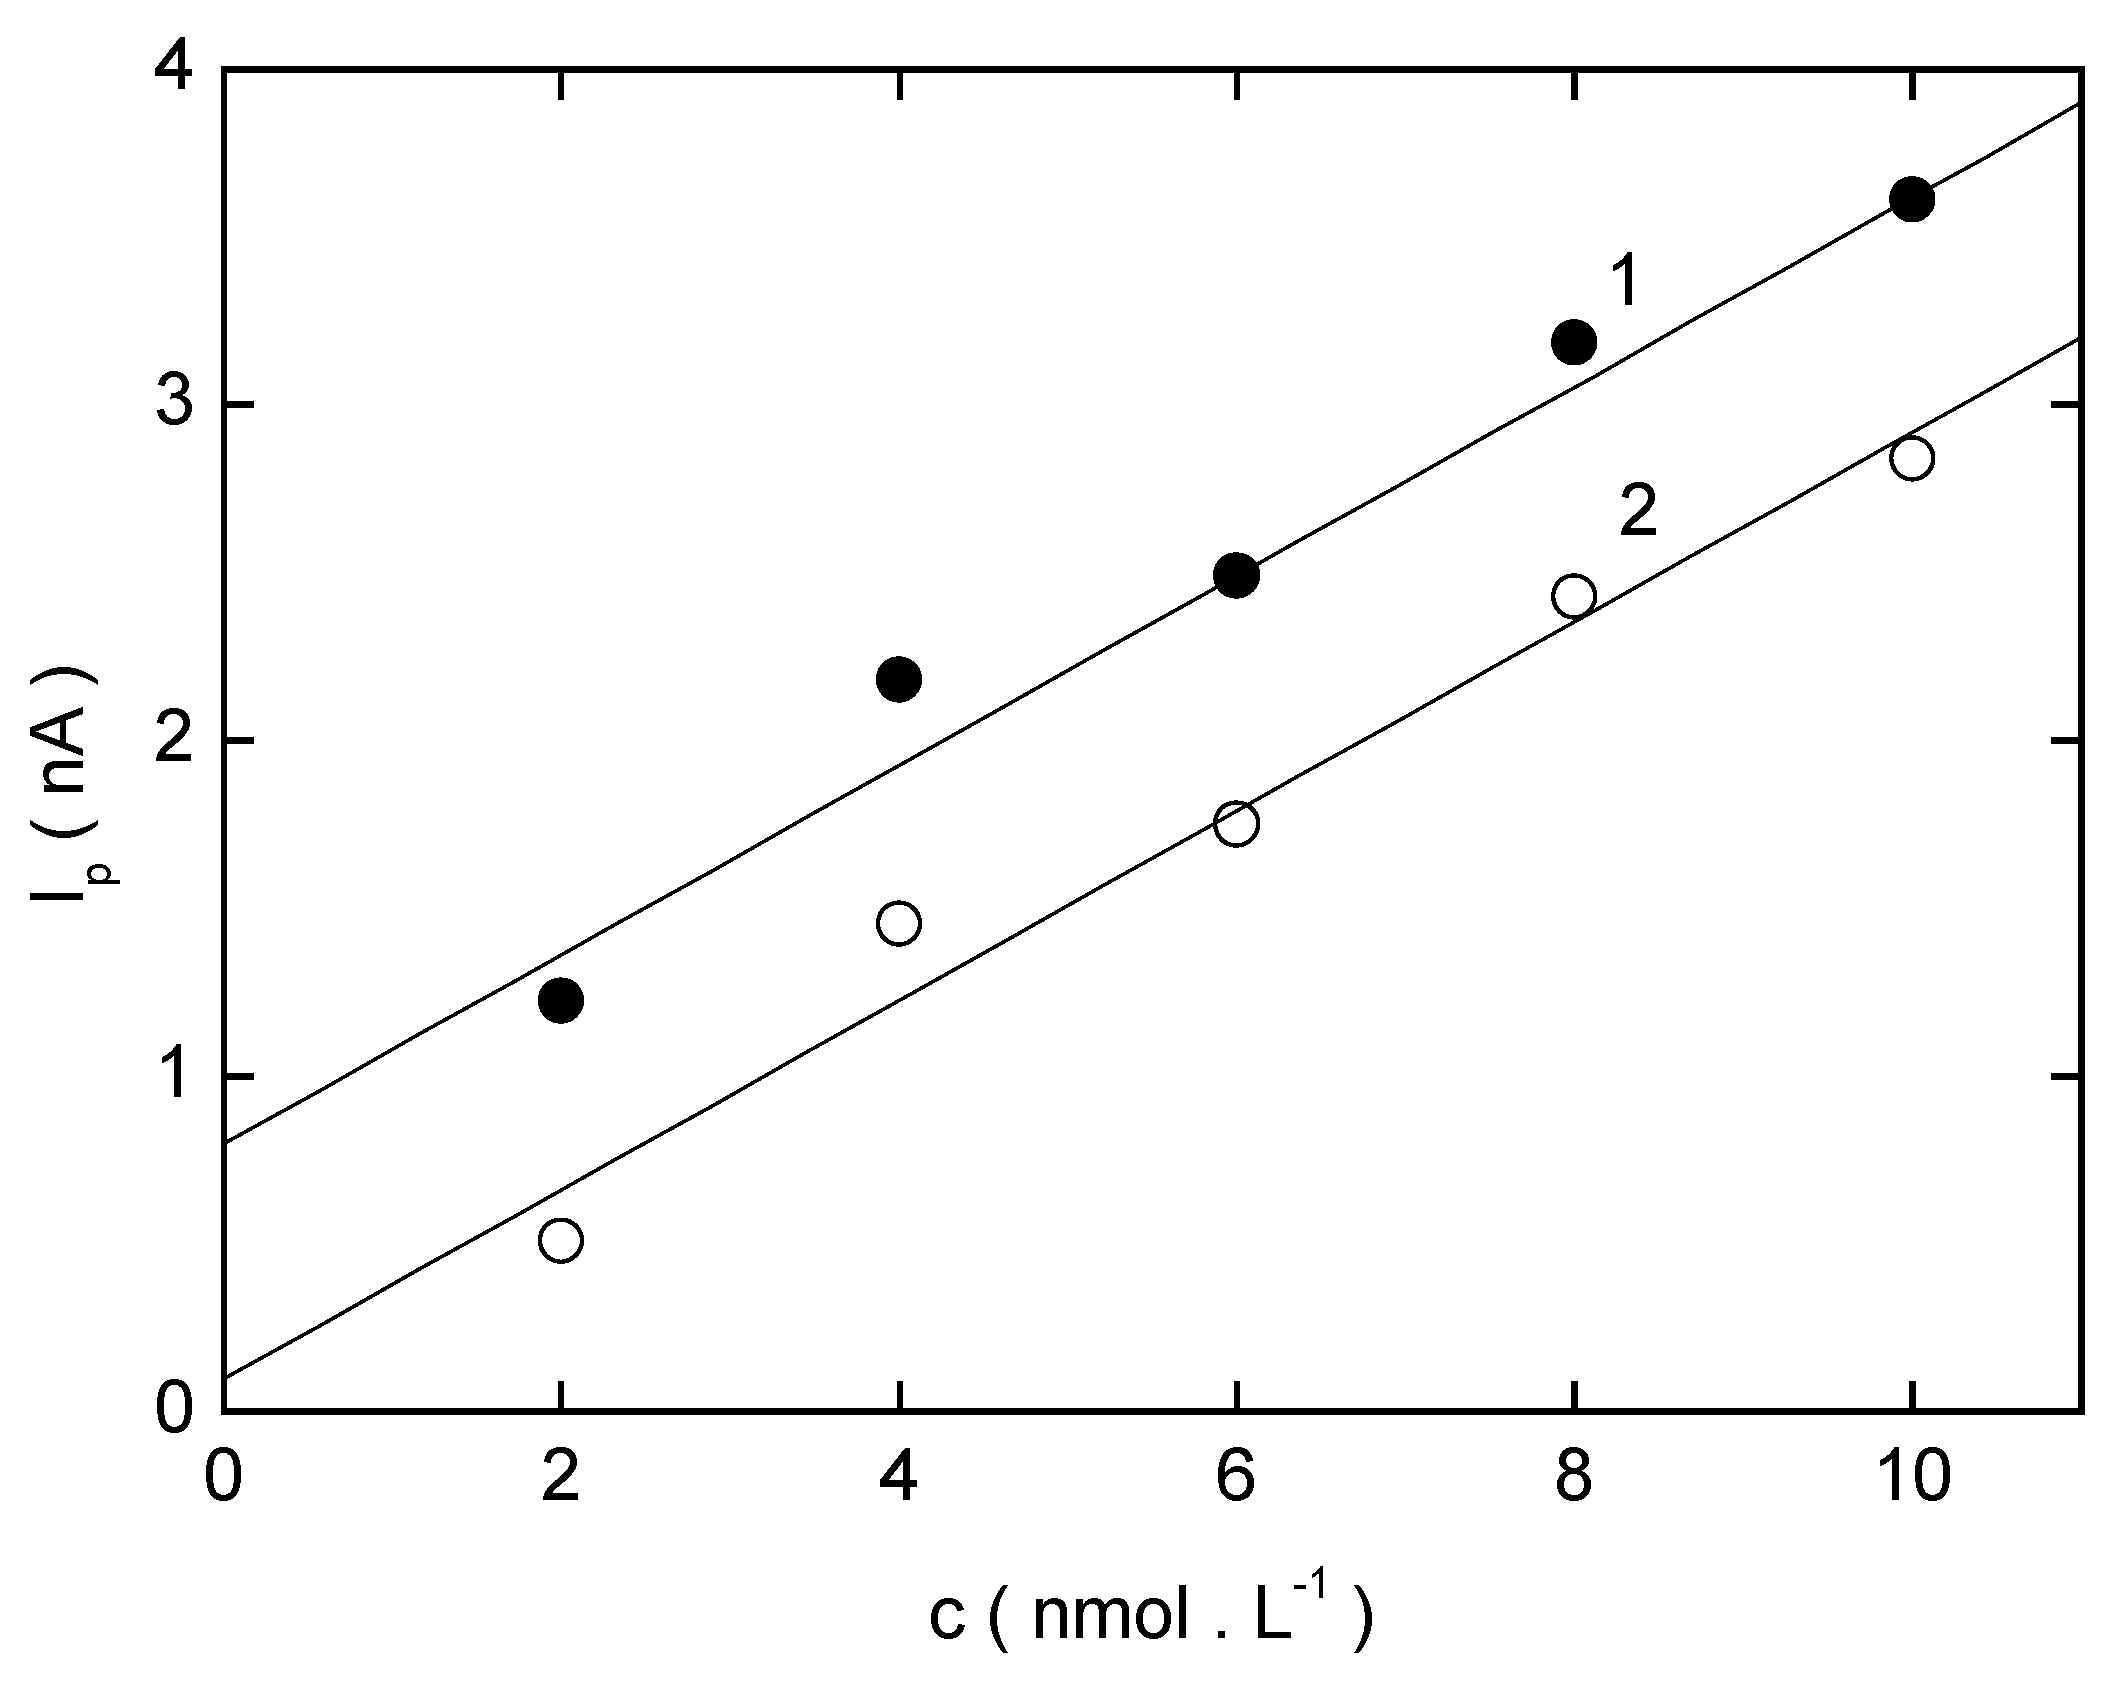
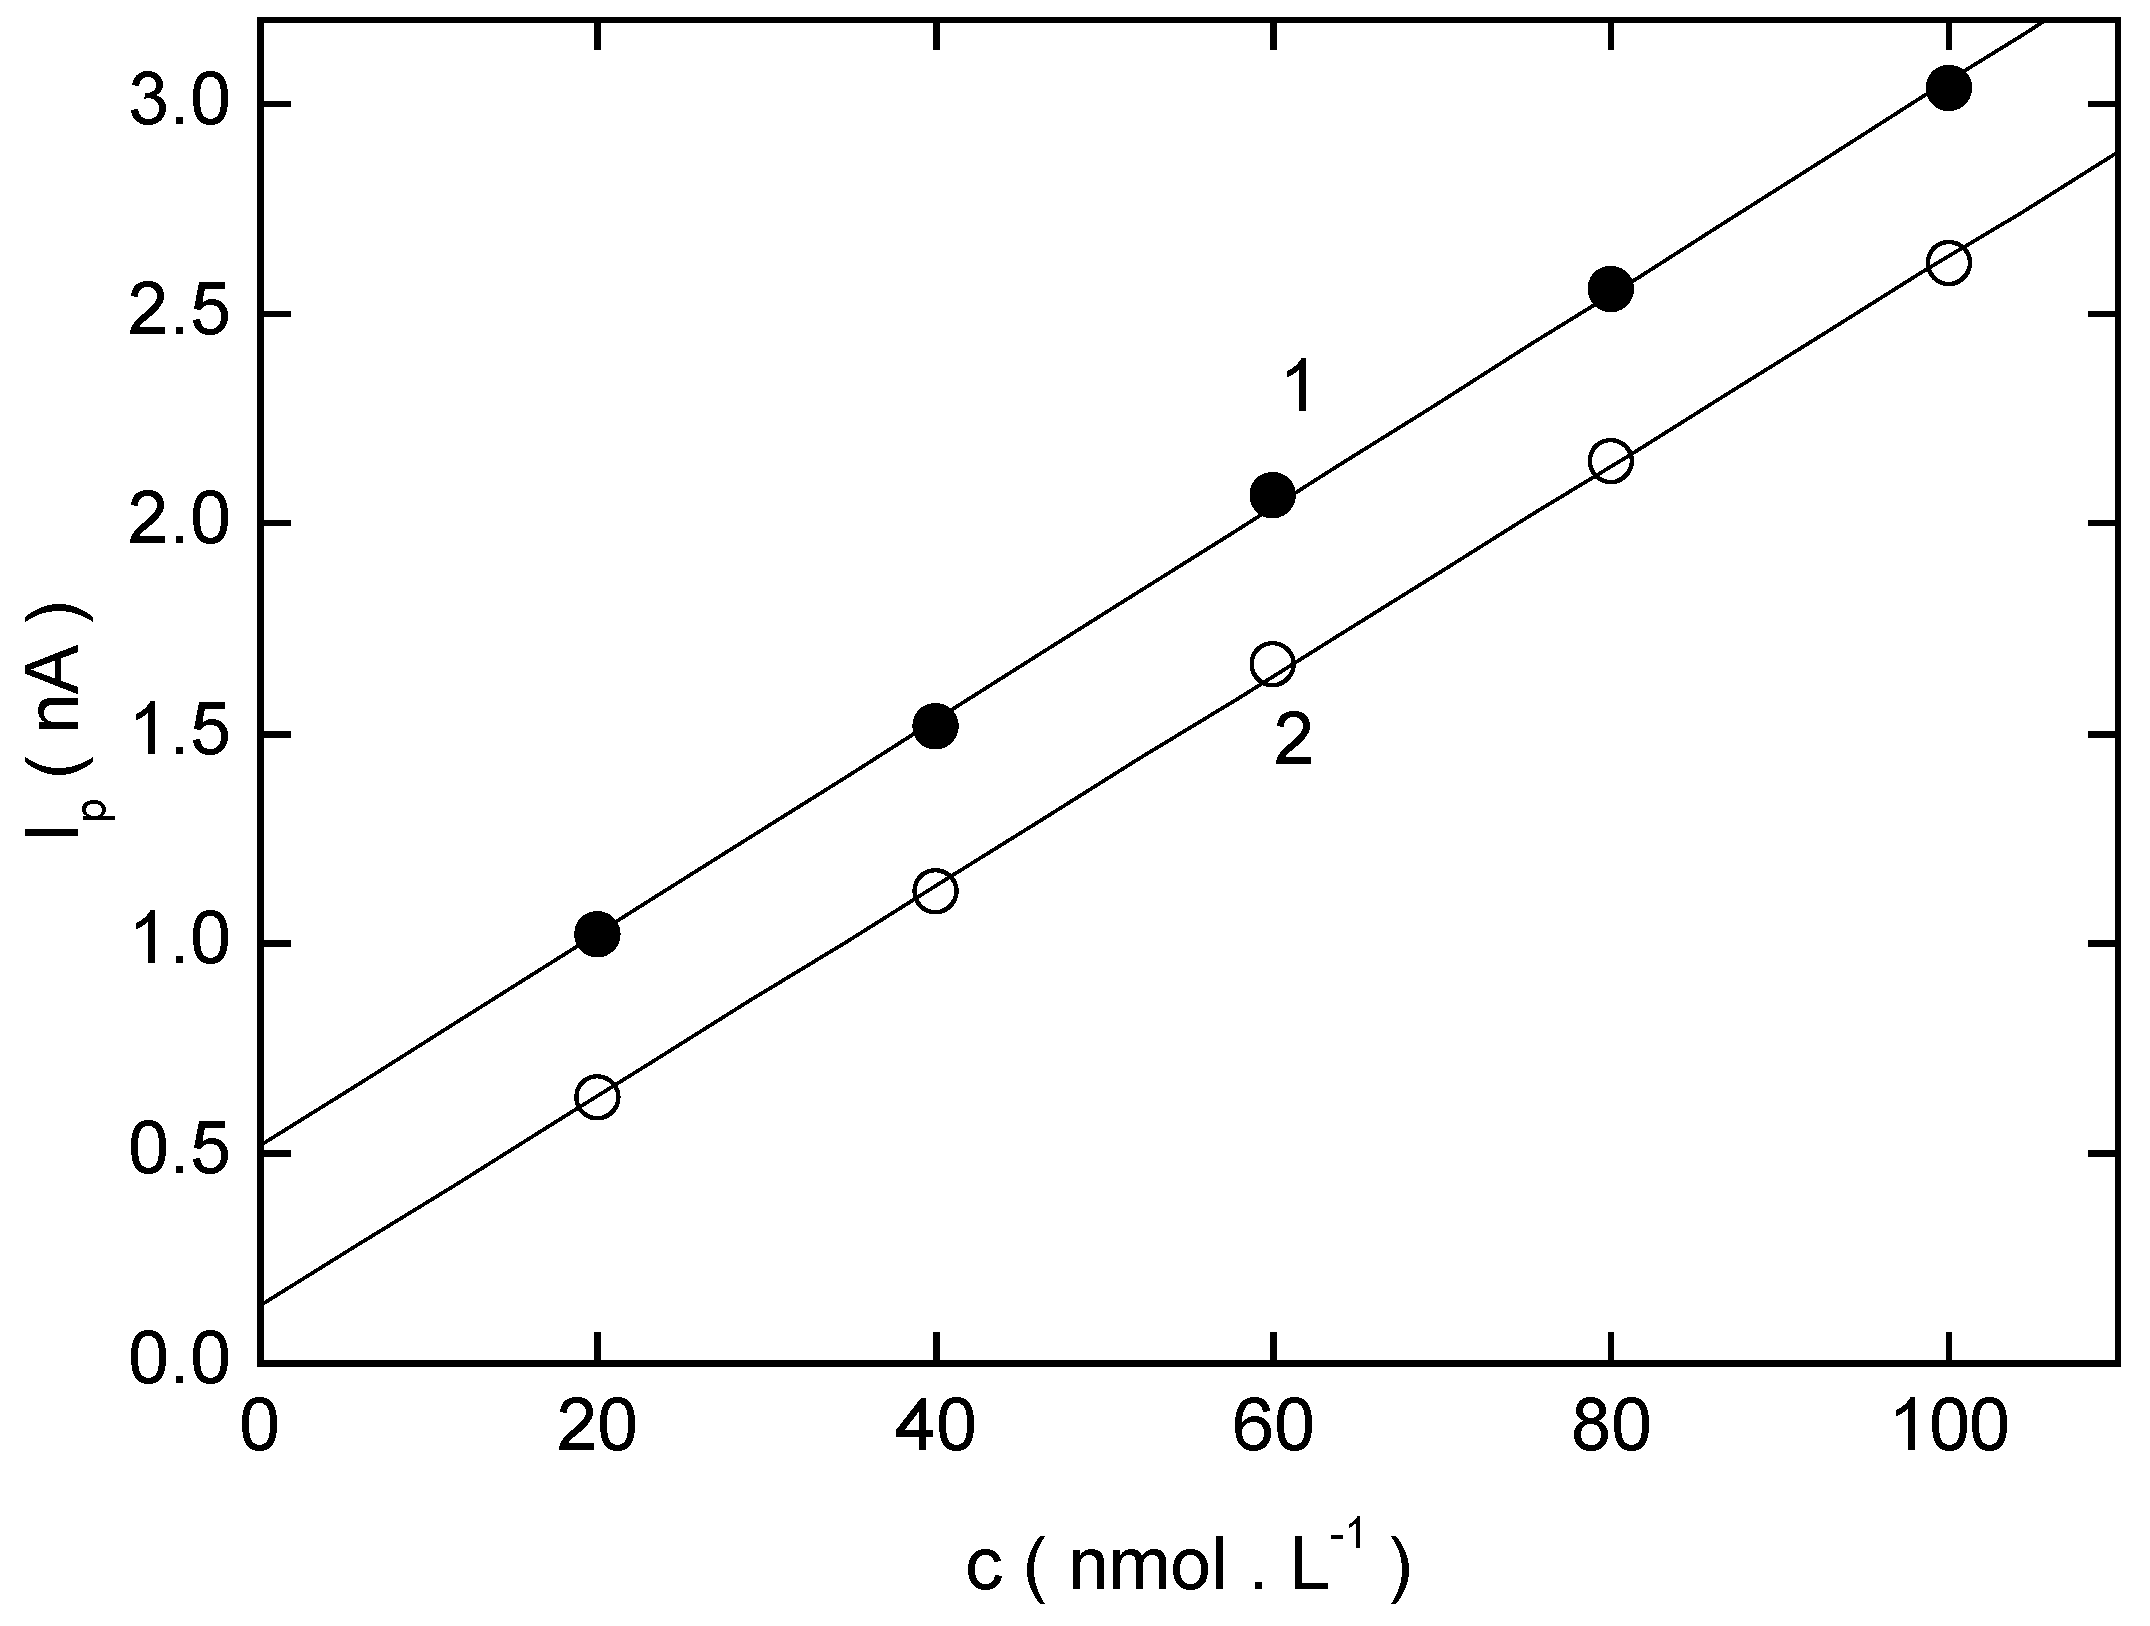
The effect of pH on DP voltammograms of 3-NBP is shown in Fig. 4. This substance gives one or two (at pHm 2.6, 4.0, and 4.9) well-developed peaks, which are shifted towards more negative potential with increasing pH (see Table 3). The highest, best-developed and most easily evaluated peak was again obtained at pHm 12 (see Fig. 4) where linear calibration curves were obtained (see Table 4). In the lowest attainable concentration range, a coinciding peak around –0.6 V was observed (see Fig. 5) which caused high intercept of the calibration curve (see Fig. 6, straight line 1). However, if the height of this peak was subtracted from the peaks of the test substances, the calibration straight line passed nearly through the origin (see Fig. 6, straight line 2).
Figure 4.
DP voltammograms of 1.10−5 mol·L−1 3-NBP at HMDE in the mixed Britton-Robinson buffer – methanol (1:1) mixture at resulting pHm 2.6 (1), 3.9 (2), 4.9 (3), 5.9 (4), 7.1 (5), 8.1 (6), 8.7 (7), 9.3 (8), 10.2 (9), 11.2 (10), 12.0 (11).
Figure 4.
DP voltammograms of 1.10−5 mol·L−1 3-NBP at HMDE in the mixed Britton-Robinson buffer – methanol (1:1) mixture at resulting pHm 2.6 (1), 3.9 (2), 4.9 (3), 5.9 (4), 7.1 (5), 8.1 (6), 8.7 (7), 9.3 (8), 10.2 (9), 11.2 (10), 12.0 (11).

Table 3.
The dependence of the peak potential (Ep) and peak current (Ip) of 3-NBP measured by DPV at HMDE on resulting pHm of the Britton-Robinson buffer – methanol (1:1) mixture.
| pHa | pHb | Ep 1(mV) | Ip 1(nA) | Ep 2(mV) | Ip 2(nA) |
|---|---|---|---|---|---|
| 2.0 | 2.6 | -92 | 133 | -323 | 26.5 |
| 3.0 | 4.0 | -151 | 156 | -433 | 12.1 |
| 4.0 | 4.9 | -202 | 183 | -554 | 6.2 |
| 5.0 | 5.9 | -272 | 146 | -- | -- |
| 6.0 | 7.1 | -380 | 137 | -- | -- |
| 7.0 | 8.1 | -423 | 176 | -- | -- |
| 8.0 | 8.7 | -464 | 168 | -- | -- |
| 9.0 | 9.3 | -473 | 158 | -- | -- |
| 10.0 | 10.2 | -563 | 151 | -- | -- |
| 11.0 | 11.2 | -614 | 149 | -- | -- |
| 12.0 | 12.0 | -644 | 200 | -- | -- |
a pH of Britton-Robinson buffer; b resulting pHm of the Britton-Robinson buffer – methanol (1:1) mixture; 1first peak; 2second peak
Table 4.
Parameters of calibration curves for the determination of 3-NBP by DPV at HMDE in Britton-Robinson buffer – methanol (1:1) mixture of resulting pHm 12.
| c (mol L−1) | Slope (mA mol−1 L) | Intercept (nA) | Correlation coefficient | L Q (mol L−1) |
|---|---|---|---|---|
| (2-10) .10−6 | 20.8 | 6.9 | 0.9975 | ---- |
| (2-10) .10−7 | 24.8 | 0.1 | 0.9984 | ---- |
| (2-10) .10−8 | 24.9 | 0.1 | 0.9997 | 2.7.10−8 |
Figure 5.
DP voltammograms of 3-NBP at HMDE in the lowest attainable concentration range. Britton-Robinson buffer – methanol (1:1) mixture with resulting pHm 12.0. Concentration of 3-NBP (mol·L−1): 0 (1), 2·10−8 (2), 4·10−8 (3), 6·10−8 (4), 8·10−8 (5), 10·10−8 (6).
Figure 5.
DP voltammograms of 3-NBP at HMDE in the lowest attainable concentration range. Britton-Robinson buffer – methanol (1:1) mixture with resulting pHm 12.0. Concentration of 3-NBP (mol·L−1): 0 (1), 2·10−8 (2), 4·10−8 (3), 6·10−8 (4), 8·10−8 (5), 10·10−8 (6).
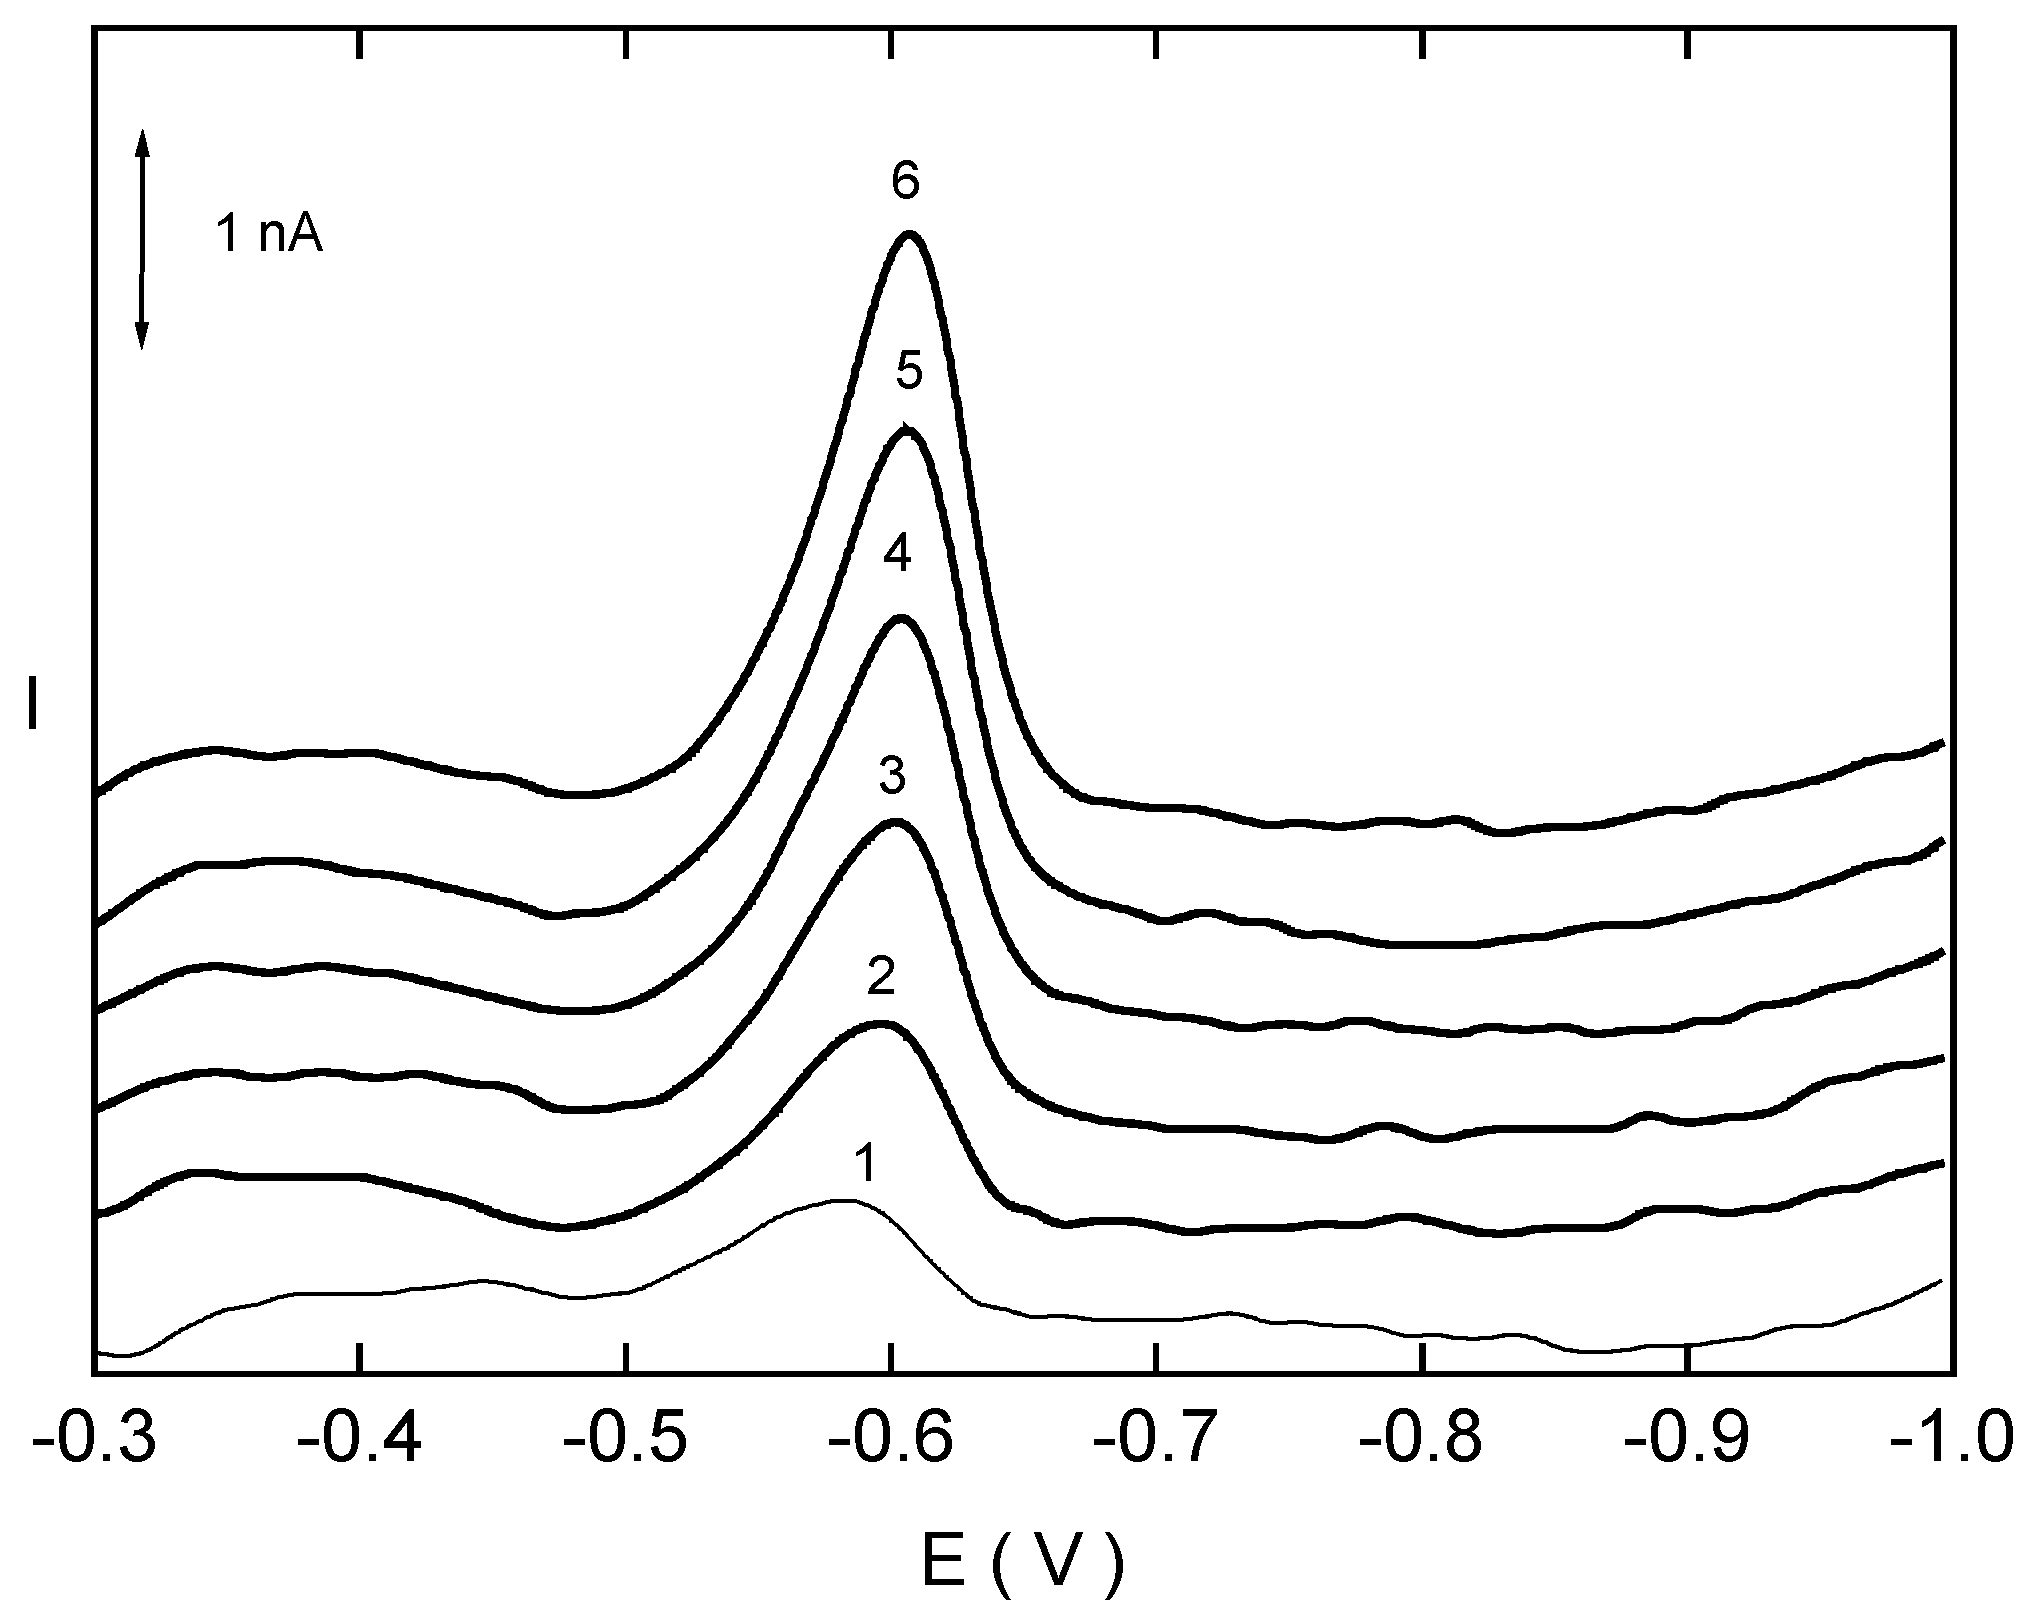
Figure 6.
The dependence of the peak current (Ip) on the concentration of 3-NBP (c = (2 – 10)·10−8 mol·L−1) measured by DPV at HMDE in the Britton-Robinson buffer – methanol (1:1) mixture with resulting pHm 12.0. Curve 1 is calibration curve with an interfering peak in the base electrolyte. Curve 2 is corrected calibration line.
Differential Pulse Voltammetry of 4-Nitrobiphenyl at HMDE
As in previous cases, this substance gives one or two (at pHm 2.6, 4.0 and 4.9) well-developed peaks (see Fig. 7) shifting to more negative potential with increasing pH (see Table 5). The parameters of calibration straight lines obtained at optimal pHm 12.0 are summarized in Table 6. DP voltammograms corresponding to the lowest measured concentration range are depicted in Fig. 8.
Figure 7.
DP voltammograms of 1·10−5 mol·L−1 4-NBP at HMDE in the mixed Britton-Robinson buffer – methanol (1:1) mixture at resulting pHm 2.6 (1), 3.9 (2), 4.9 (3), 5.9 (4), 7.1 (5), 8.1 (6), 8.7 (7), 9.3 (8), 10.2 (9), 11.2 (10), 12.0 (11).
Figure 7.
DP voltammograms of 1·10−5 mol·L−1 4-NBP at HMDE in the mixed Britton-Robinson buffer – methanol (1:1) mixture at resulting pHm 2.6 (1), 3.9 (2), 4.9 (3), 5.9 (4), 7.1 (5), 8.1 (6), 8.7 (7), 9.3 (8), 10.2 (9), 11.2 (10), 12.0 (11).

Table 5.
The dependence of the peak potential (Ep) and peak current (Ip) of 4-NBP measured by DPV at HMDE on resulting pHm of the Britton-Robinson buffer – methanol (1:1) mixture.
| pHa | pHb | Ep 1(mV) | Ip 1(nA) | Ep 2(mV) | Ip 2(nA) |
|---|---|---|---|---|---|
| 2.0 | 2.6 | -151 | 139 | -312 | 32.3 |
| 3.0 | 4.0 | -223 | 195 | -444 | 13.3 |
| 4.0 | 4.9 | -273 | 200 | -555 | 6.1 |
| 5.0 | 5.9 | -322 | 160 | -- | -- |
| 6.0 | 7.1 | -403 | 162 | -- | -- |
| 7.0 | 8.1 | -473 | 182 | -- | -- |
| 8.0 | 8.7 | -503 | 160 | -- | -- |
| 9.0 | 9.3 | -523 | 186 | -- | -- |
| 10.0 | 10.2 | -563 | 163 | -- | -- |
| 11.0 | 11.2 | -614 | 157 | -- | -- |
| 12.0 | 12.0 | -644 | 203 | -- | -- |
a pH of Britton-Robinson buffer ; b resulting pHm of the Britton-Robinson buffer – methanol (1:1) mixture; 1 first peak; 2 second peak
Table 6.
Parameters of calibration curves for the determination of 4-NBP by DPV at HMDE in Britton-Robinson buffer – methanol (1:1) mixture of resulting pHm 12.
| c (mol L−1) | Slope (mA mol−1 L) | Intercept (nA) | Correlation coefficient | L Q (mol L−1) |
|---|---|---|---|---|
| (2-10) .10−6 | 21.1 | 10.9 | 0.9999 | ---- |
| (2-10) .10−7 | 24.4 | 1.4 | 0.9961 | ---- |
| (2-10) .10−8 | 25.8 | 0.1 | 0.9965 | 2.5.10−8 |
Figure 8.
DP voltammograms of 4-NBP at HMDE in the lowest attainable concentration range. Britton-Robinson buffer – methanol (1:1) mixture with resulting pHm 12.0. Concentration of 4-NBP (mol·L−1): 0 (1), 2·10−8 (2), 4·10−8 (3), 6·10−8 (4), 8·10−8 (5), 10·10−8 (6).
Figure 8.
DP voltammograms of 4-NBP at HMDE in the lowest attainable concentration range. Britton-Robinson buffer – methanol (1:1) mixture with resulting pHm 12.0. Concentration of 4-NBP (mol·L−1): 0 (1), 2·10−8 (2), 4·10−8 (3), 6·10−8 (4), 8·10−8 (5), 10·10−8 (6).

Figure 9.
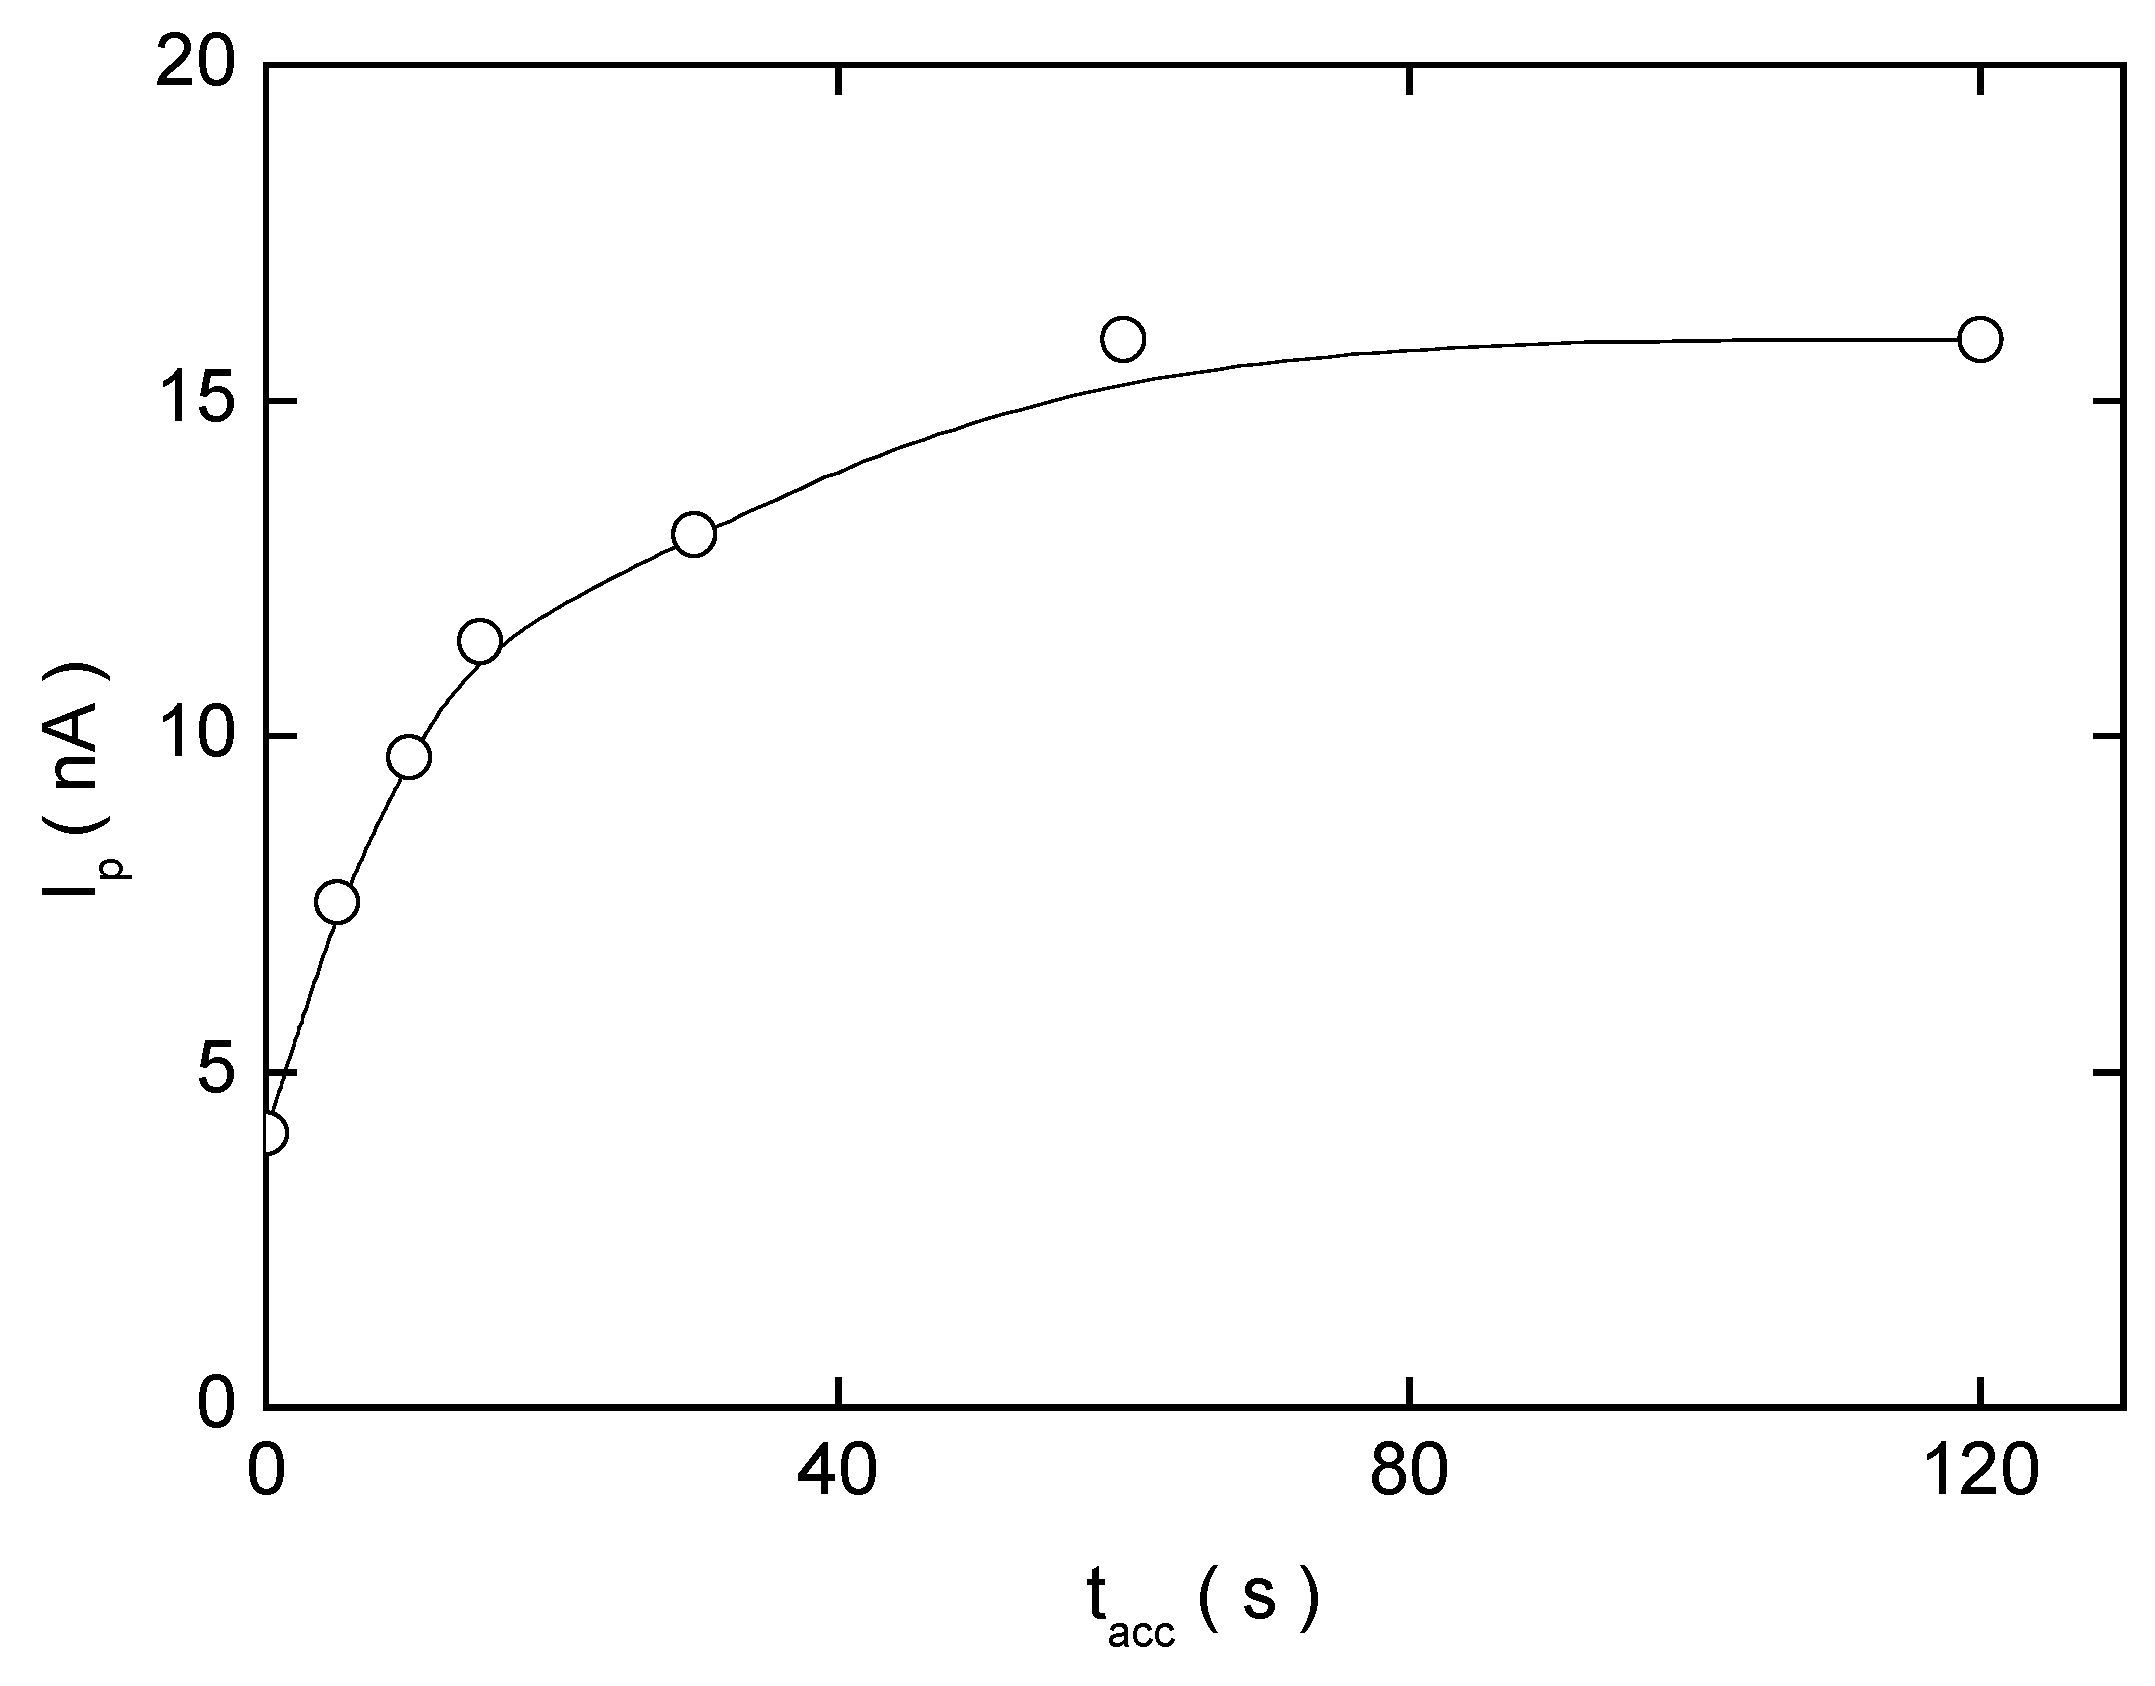
The influence of the accumulation time tacc on the peak height Ip of 2-NBP (c = 1·10−7 mol·L−1). Measured by AdSV at HMDE in the 0.01 mol·L−1 NaOH – methanol (100:1) mixture. Potential of accumulation Eacc = – 400 mV.
Figure 9.
The influence of the accumulation time tacc on the peak height Ip of 2-NBP (c = 1·10−7 mol·L−1). Measured by AdSV at HMDE in the 0.01 mol·L−1 NaOH – methanol (100:1) mixture. Potential of accumulation Eacc = – 400 mV.

Adsorptive Stripping Voltammetry of 2-Nitrobiphenyl at HMDE
It followed from preliminary experiments [11], that the best developed and most easily evaluated adsorptive stripping voltammograms were obtained in the 0.01 mol·L−1 NaOH – MeOH (100:1) mixture. The influence of pHm on the height and the position of the peak is shown in Table 7. The best-developed and best repeatable voltammograms were obtained at Eacc = – 400 mV. (At – 450 mV the peaks were higher but less reproducible and not so easy to evaluate). Afterwards, the influence of the accumulation time on the peak height was investigated (see Fig. 9 and Fig. 10). Optimum time of accumulation was found to be 60 s for the concentration range (2-10)·10−8 mol·L−1 and 180 s for the range (2-10)·10−9 mol·L−1. Under these conditions, linear calibration curves were obtained (see Fig. 11 and Fig. 12). In the lowest attainable concentration range, the calibration dependence is linear with relatively high intercept (curve 1 in Fig. 12), which is again caused by an interfering peak in the base electrolyte. By subtracting the height of this peak from the peaks of 2-NBP, a corrected calibration straight line (see curve 2 in Fig. 12) was obtained passing practically through the origin. The parameters of these calibration curves are given in Table 7.
Figure 10.
The influence of the accumulation time tacc on the peak height Ip of 2-NBF (c = 1·10−8 mol·L−1). Measured by AdSV at HMDE in the 0.01 mol·L−1 NaOH – methanol (100:1) mixture. Potential of accumulation Eacc = – 400 mV.
Figure 10.
The influence of the accumulation time tacc on the peak height Ip of 2-NBF (c = 1·10−8 mol·L−1). Measured by AdSV at HMDE in the 0.01 mol·L−1 NaOH – methanol (100:1) mixture. Potential of accumulation Eacc = – 400 mV.
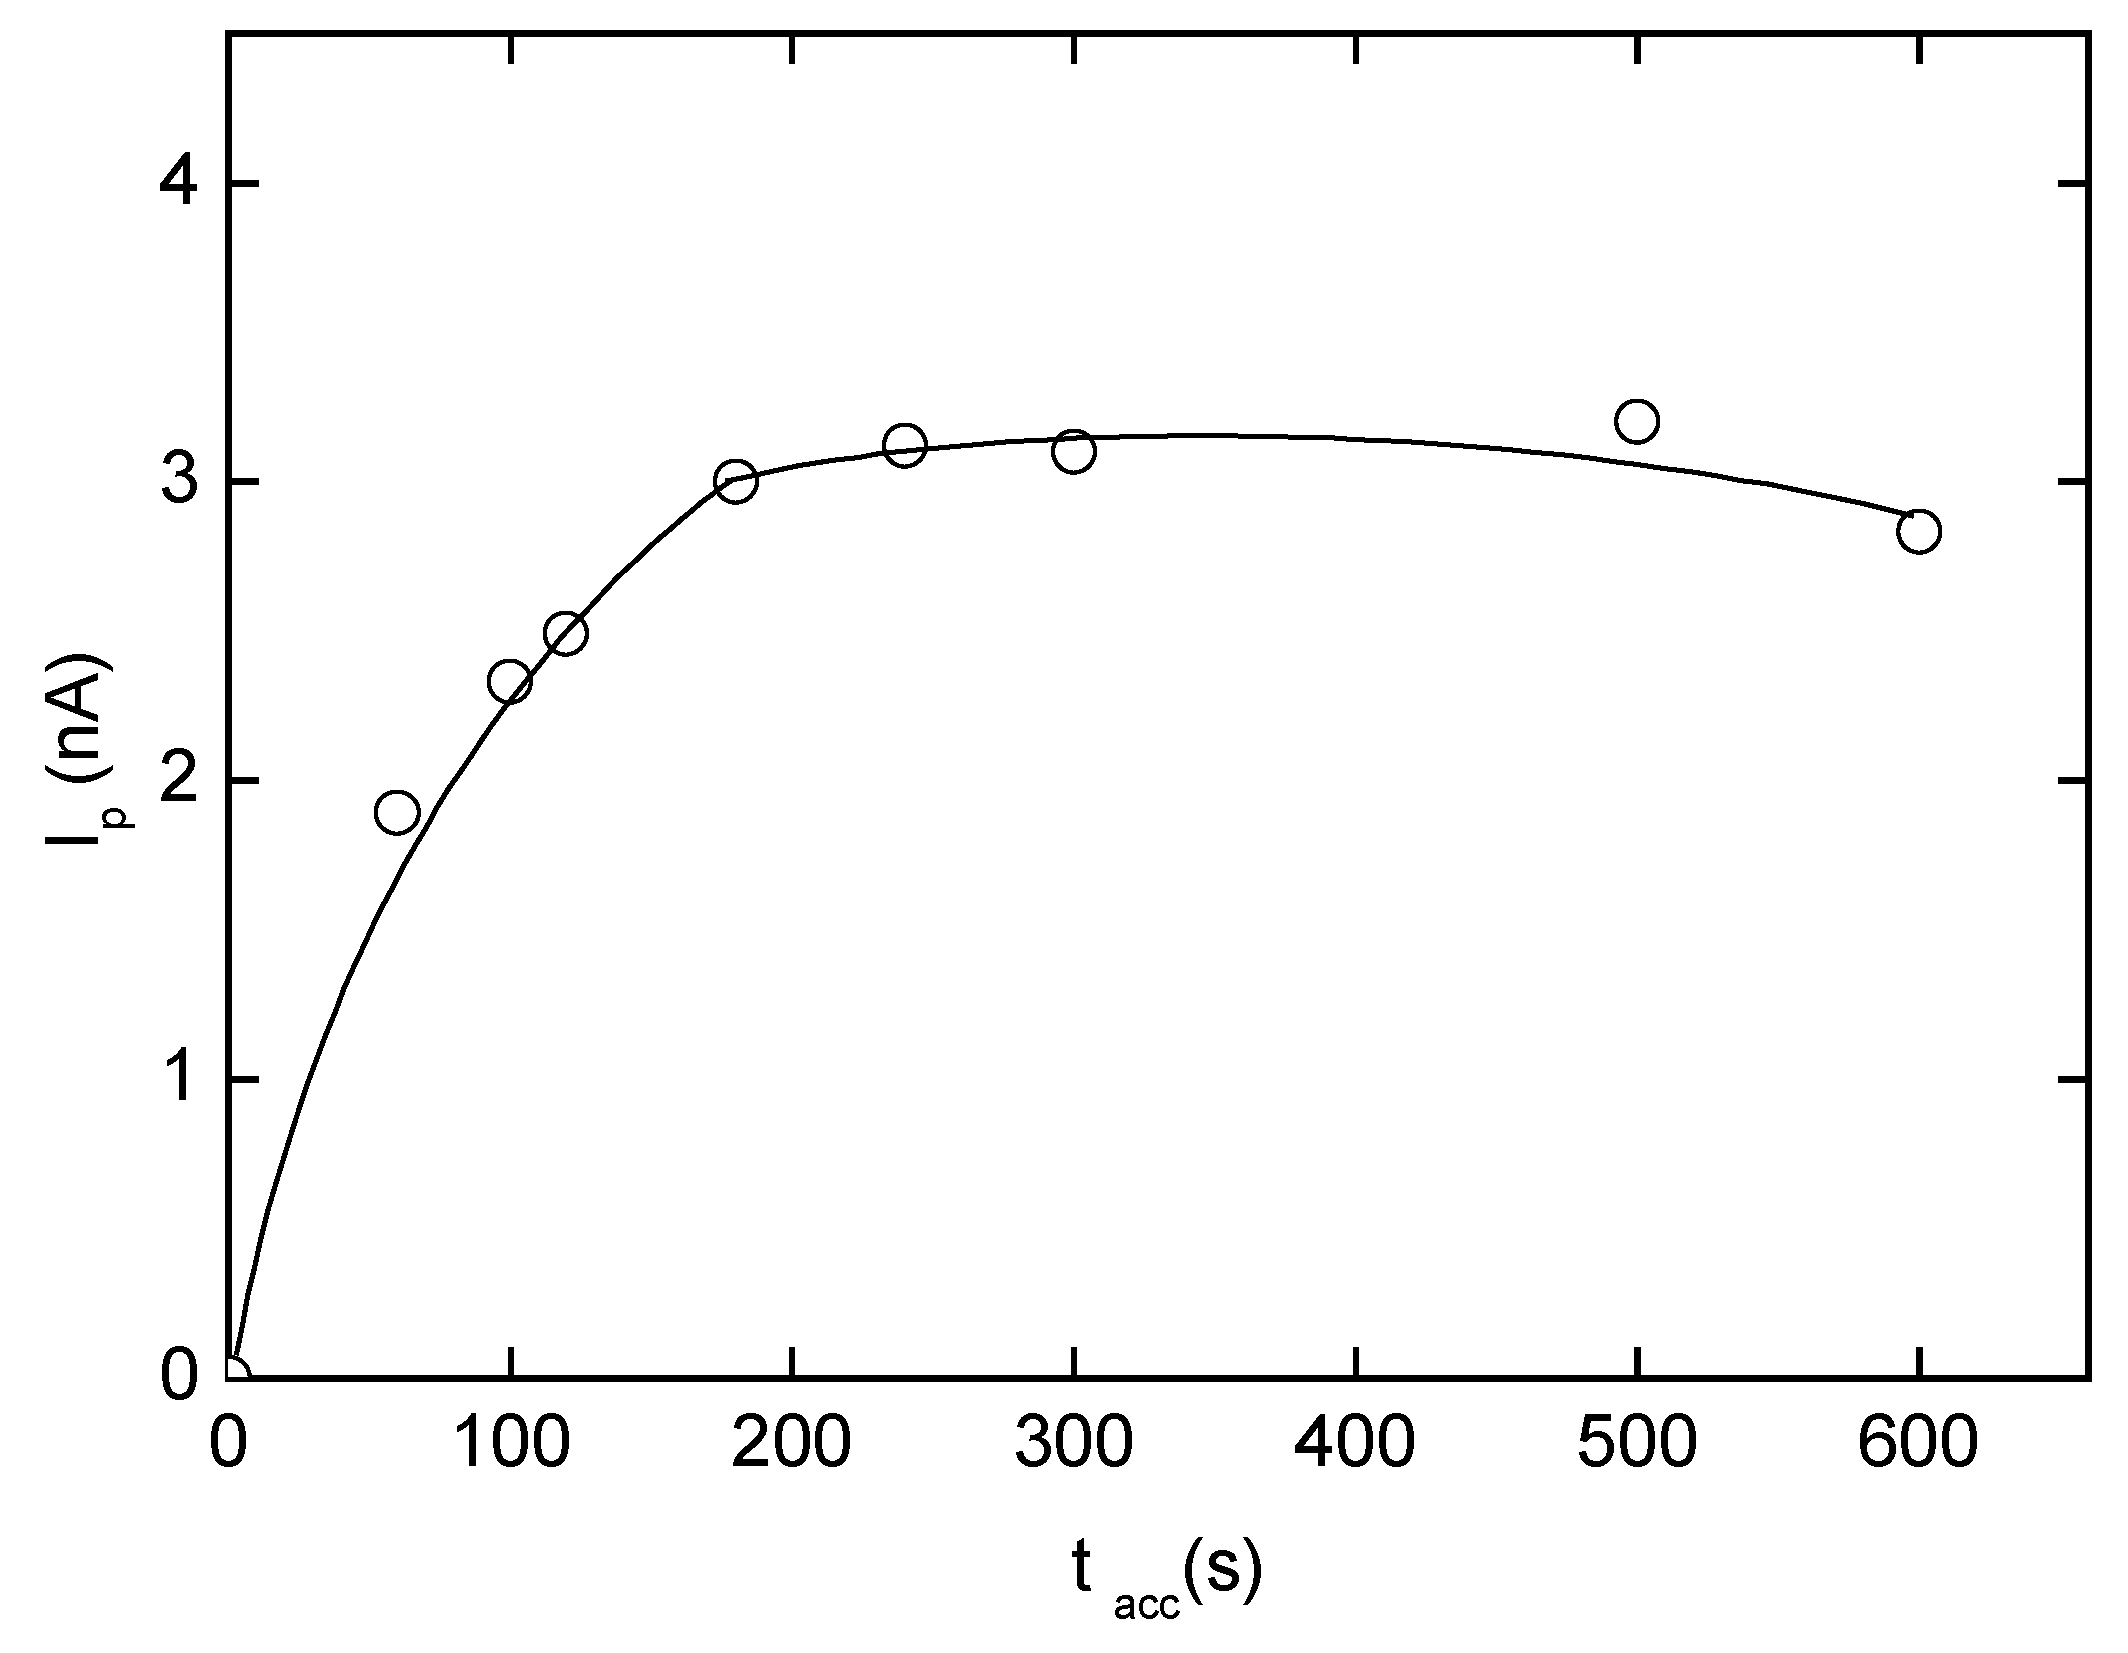
Figure 11.
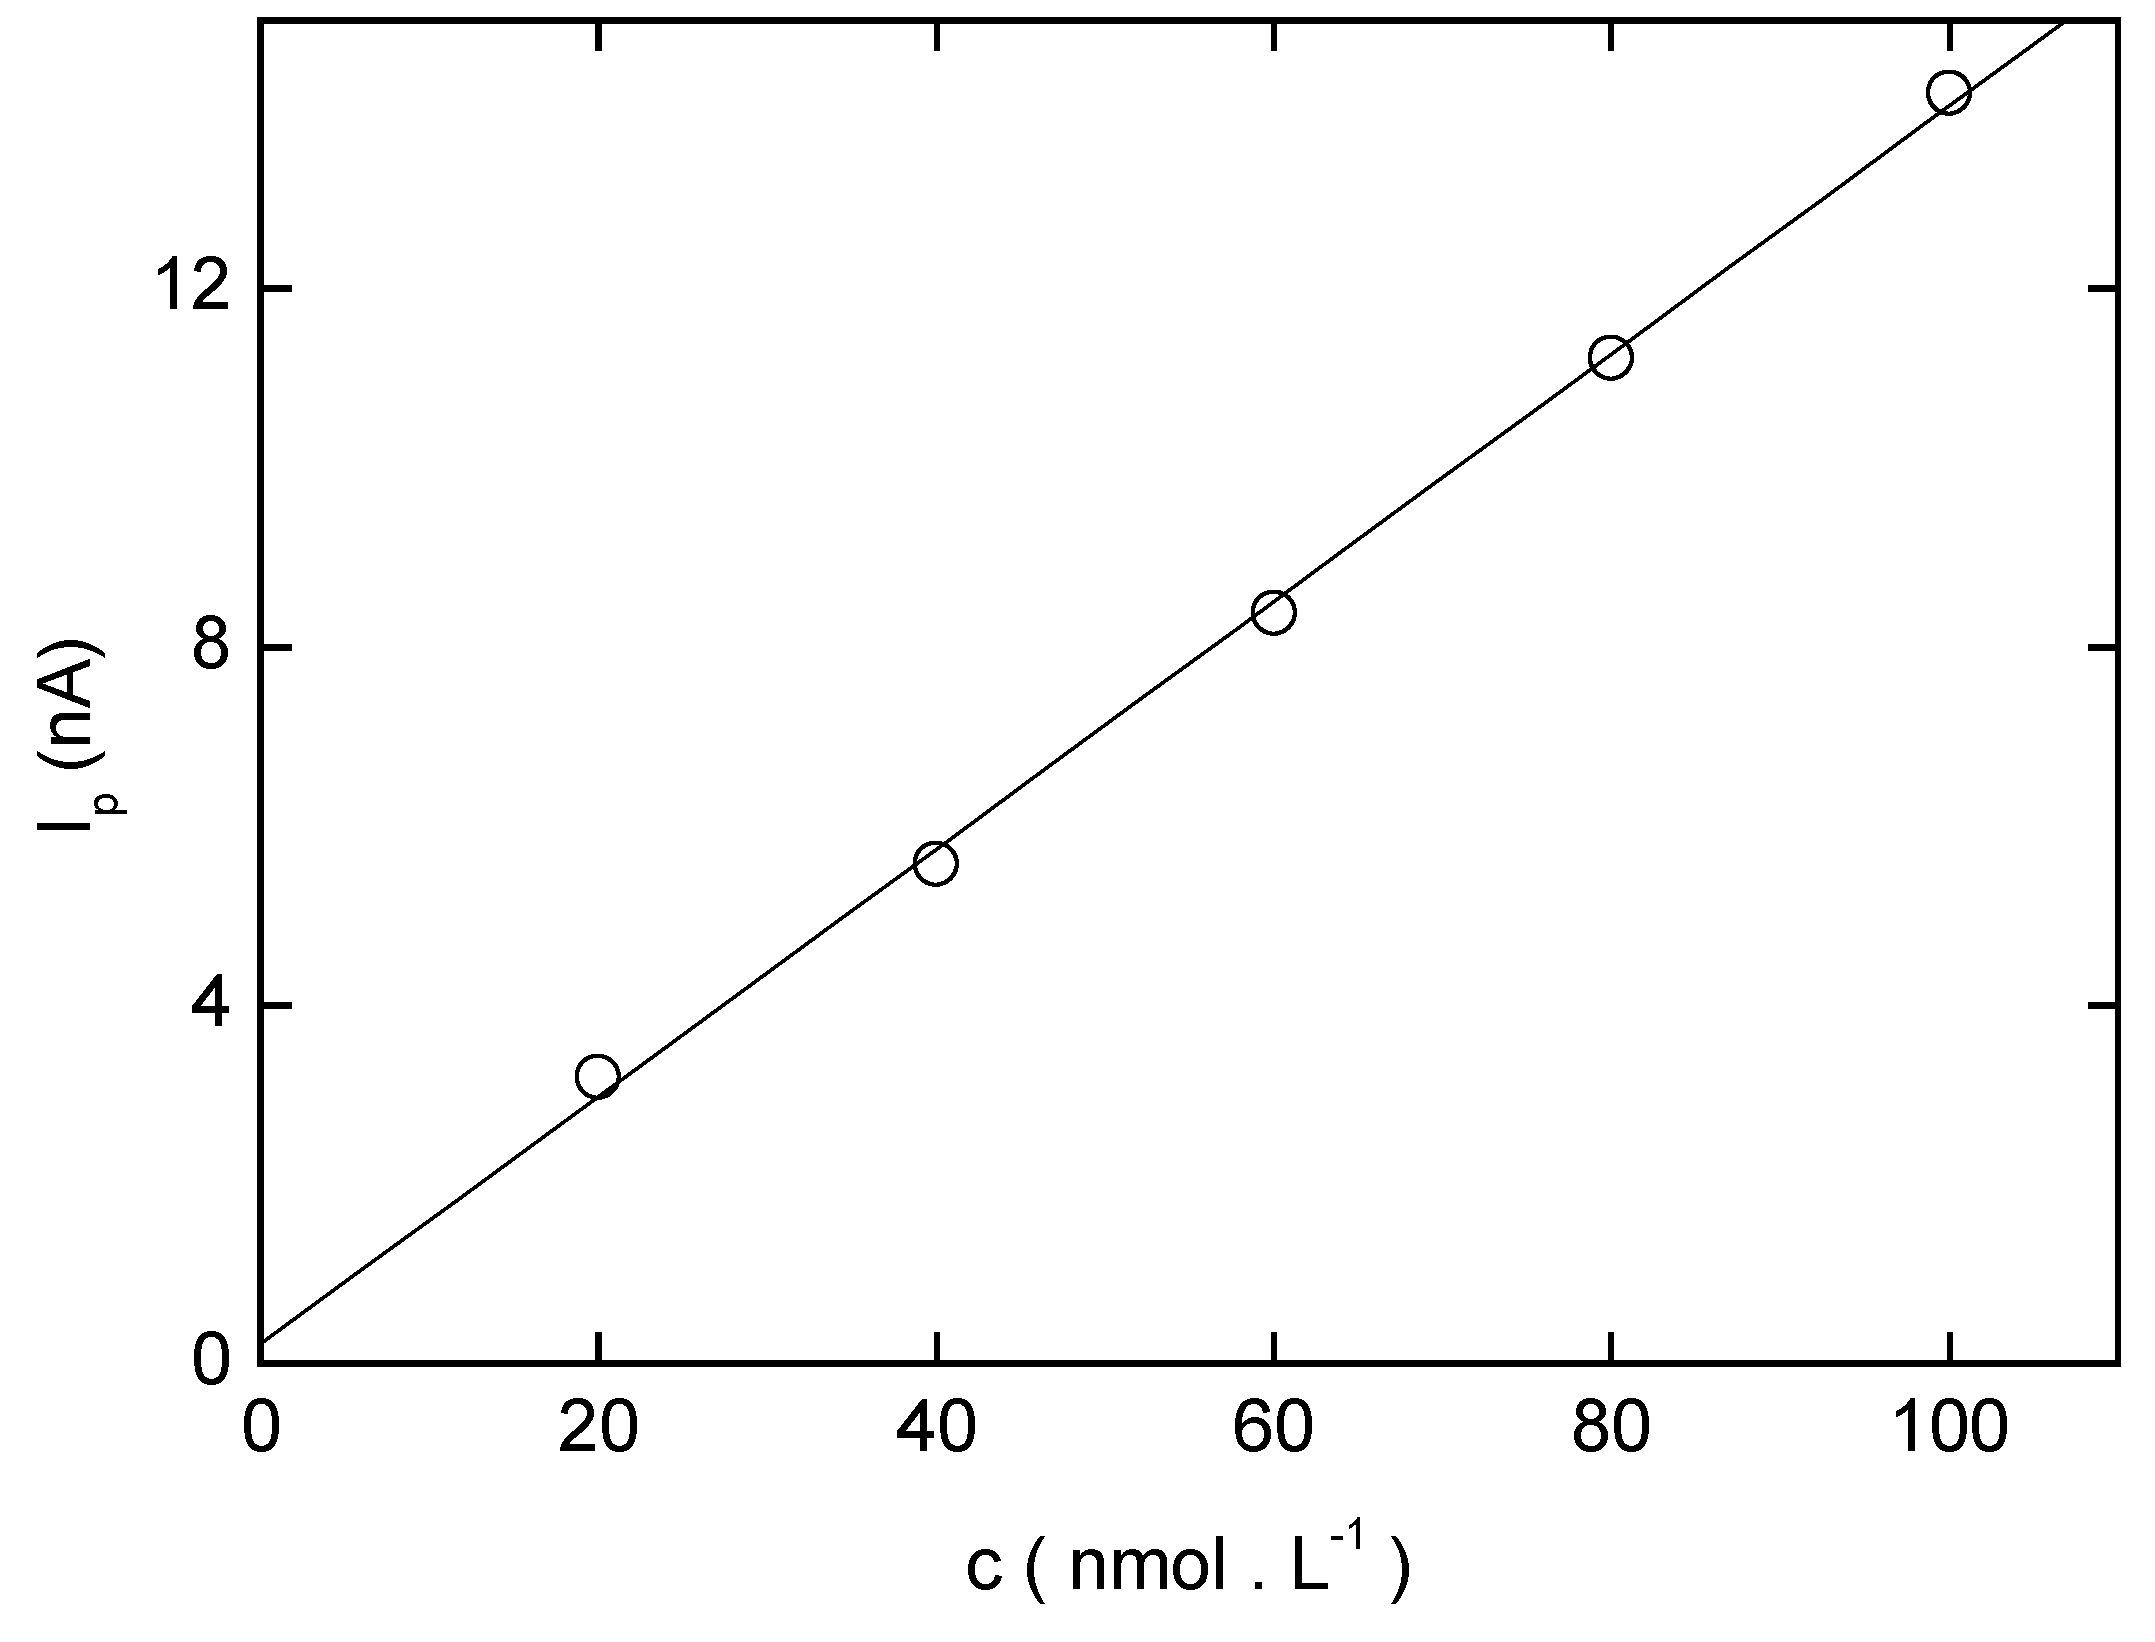
The dependence of the peak current (Ip) on the concentration of 2-NBP (c = (2 – 10)·10−8 mol·L−1). Measured by AdSV at HMDE in the 0.01 mol·L−1 NaOH – methanol (100:1) mixture with resulting pHm 12.0. Potential of accumulation Eacc = – 400 mV. Time of accumulation tacc = 60 s.
Figure 11.
The dependence of the peak current (Ip) on the concentration of 2-NBP (c = (2 – 10)·10−8 mol·L−1). Measured by AdSV at HMDE in the 0.01 mol·L−1 NaOH – methanol (100:1) mixture with resulting pHm 12.0. Potential of accumulation Eacc = – 400 mV. Time of accumulation tacc = 60 s.

Figure 12.
The dependence of the peak current (Ip) on the concentration of 2-NBP (c = (2 – 10)·10−9 mol·L−1). Measured by AdSV at HMDE in the 0.01 mol L−1 NaOH – methanol (100:1) mixture with resulting pHm 12.0. Potential of accumulation Eacc = – 400 mV. Time of accumulation tacc = 180 s. Curve 1 is calibration curve with an interfering peak in the base electrolyte. Curve 2 is corrected calibration line.

Table 7.
The dependence of the peak potential (Ep) and peak current (Ip) of 2-NBP measured by AdSV at HMDE on resulting pHm of the Britton-Robinson buffer – methanol (100:1) mixture at various potentials of accumulation (Eacc).
| pHm | Eacc(mV) | Ep(mV) | Ip(nA) | pHm | Eacc(mV) | Ep(mV) | Ip(nA) |
|---|---|---|---|---|---|---|---|
| 2.0 | 100 | -52 | 4.1 | 8.0 | -100 | -434 | 3.9 |
| 3.0 | 100 | -122 | 0.9 | 9.0 | -100 | -484 | 5.0 |
| 4.0 | 0 | -193 | 2.1 | 10.0 | -100 | -534 | 5.6 |
| 5.0 | 0 | -243 | 8.9 | 11.0 | -300 | -574 | 7.6 |
| 6.0 | 0 | -314 | 1.1 | 12.0 | -400 | -614 | 10.2 |
| 7.0 | -100 | -384 | 2.8 |
Table 8.
Parameters of calibration curves for the determination of 2-NBP by AdSV at HMDE in 0.01 mol·L−1 NaOH - methanol (100:1) mixture of resulting pHm 12. Potential of accumulation Eacc = – 400 mV.
| c (mol L−1) | Slope (mA mol−1 L) | Intercept (nA) | Correlation coefficient | L Q (mol L−1) |
|---|---|---|---|---|
| (2-10) .10−8 a | 138.1 | 0.24 | 0.9991 | 2.2. 10−8 |
| (2-10) .10−9 b | 282.3 | 0.08 | 0.9842 | 2.9. 10−9 |
a time of accumulation tacc = 60 s; b time of accumulation tacc = 180 s;
Adsorptive Stripping Voltammetry of 3-Nitrobiphenyl at HMDE
In this case, the following optimum conditions were found based on detailed investigations of the influence of various parameters on the height, position, and shape of the peak [11]: medium 0.01 mol·L−1 NaOH – MeOH (100:1) mixture, accumulation potential Eacc = - 400 mV, accumulation time tacc = 300 s for the concentrations (2-10) 10−8 mol·L−1 and tacc = 600 s for the range (2-10) 10–9 mol·L−1. Linear calibration curves obtained under these conditions are in Fig. 13 and Fig. 14. DP voltammograms corresponding to the lowest attainable concentration range are depicted in Fig. 15. The parameters of these calibration curves are summarized in Table 8.
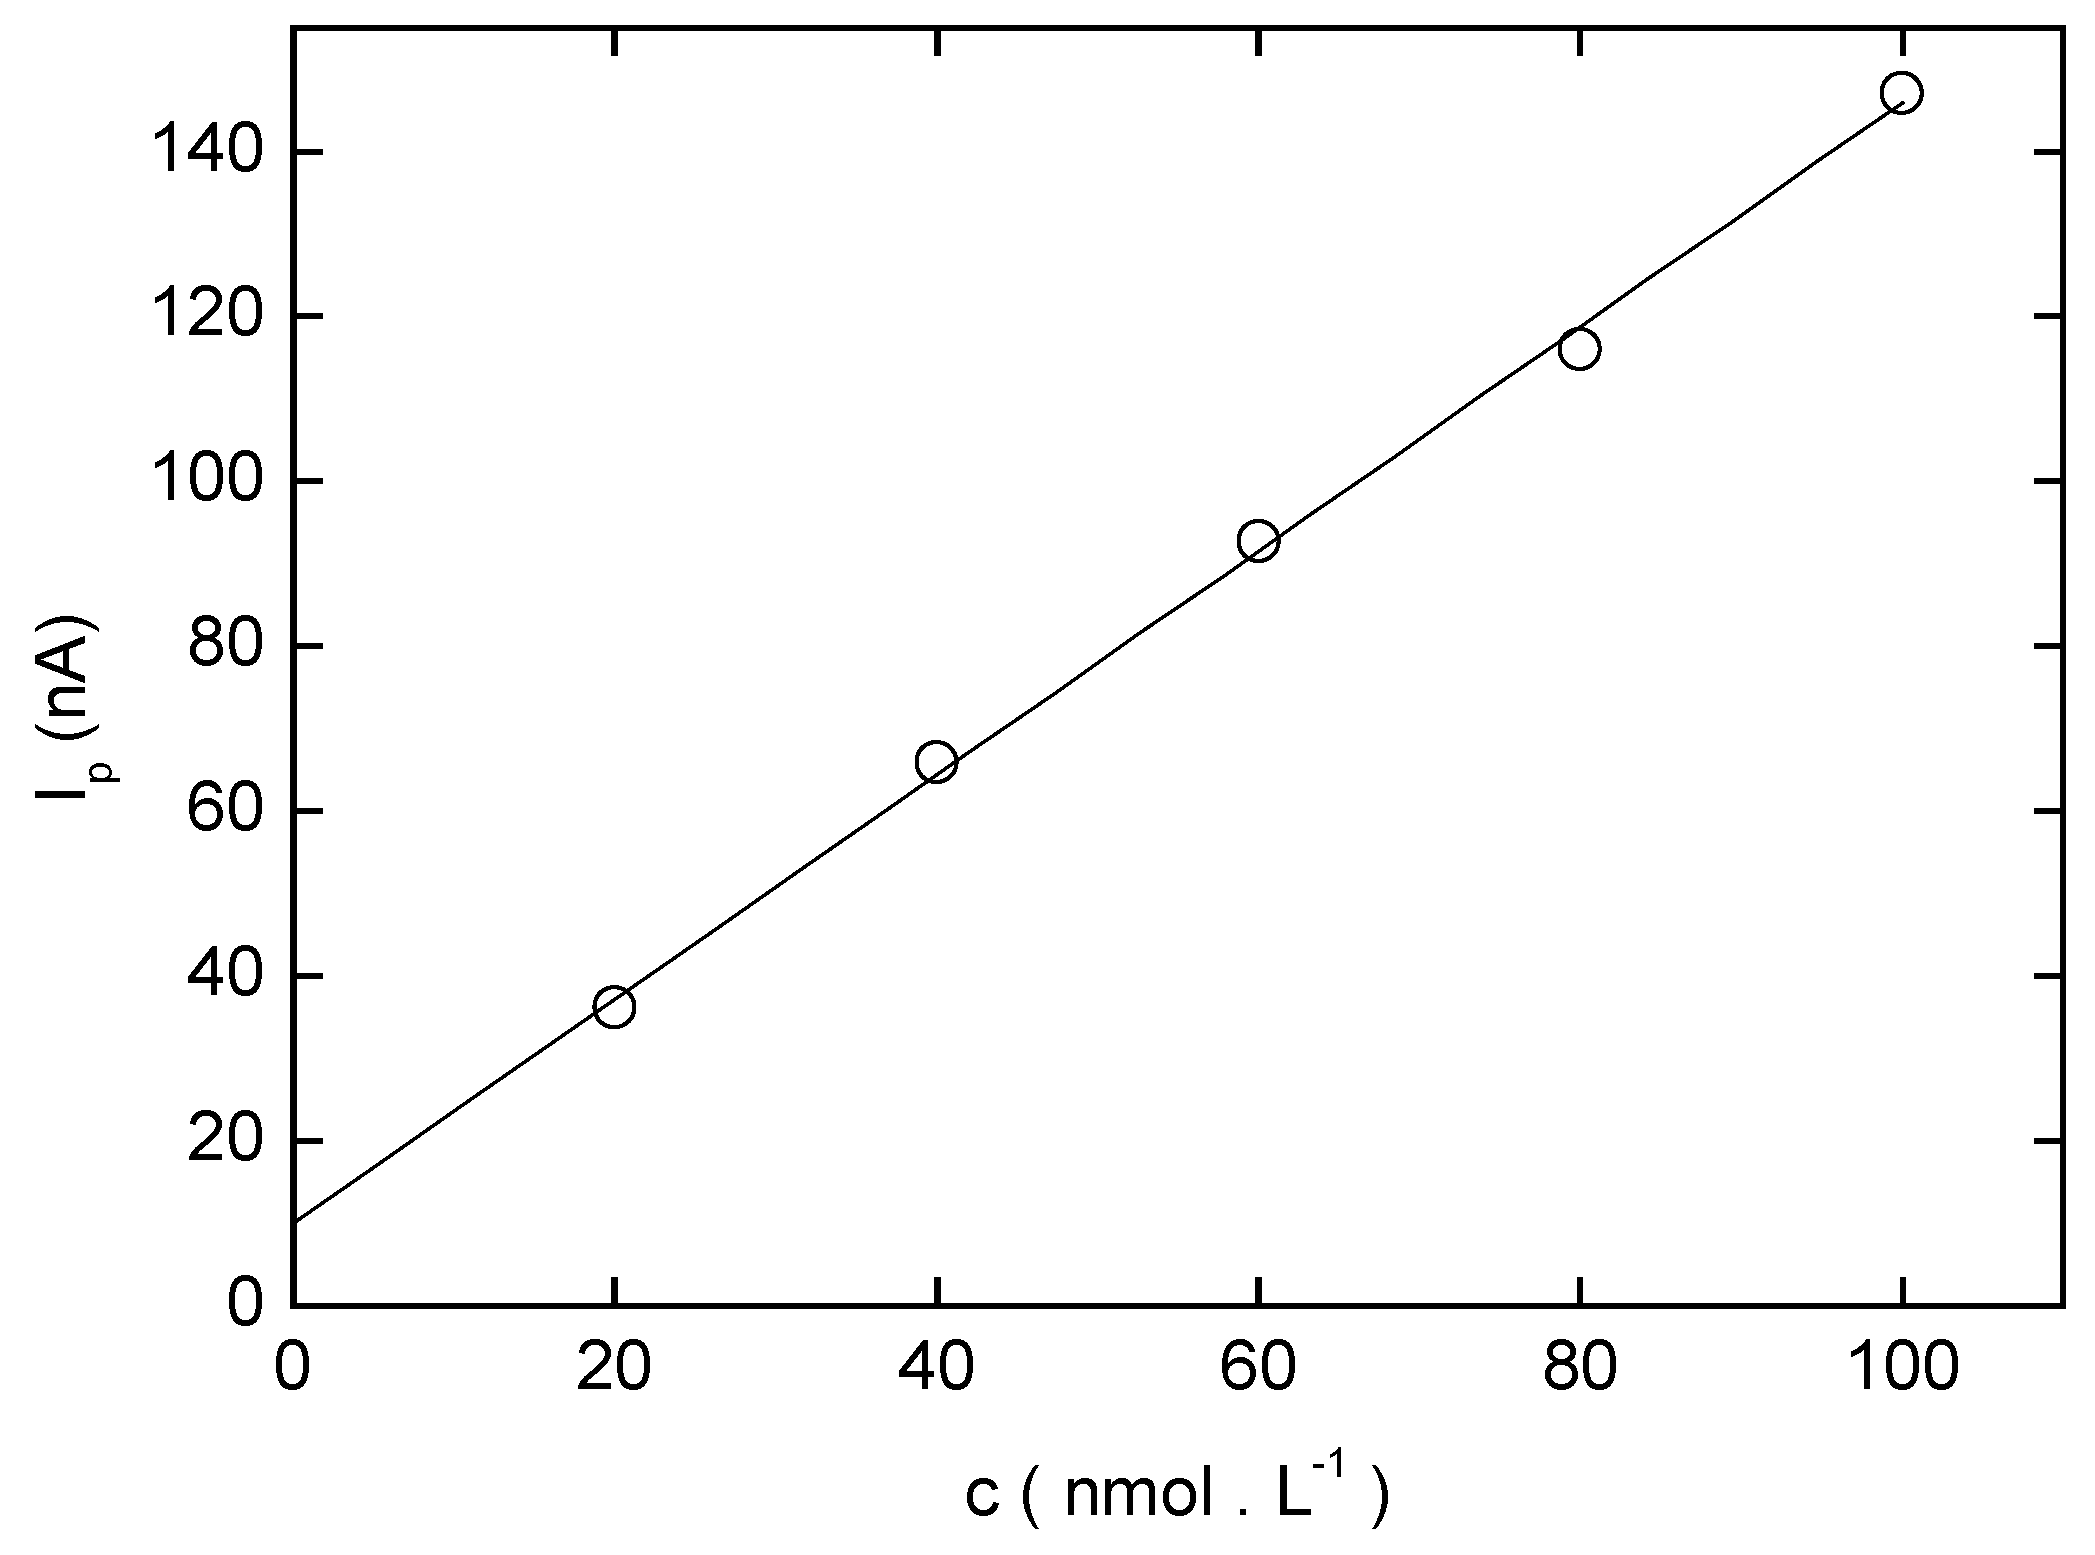
Figure 13.
The dependence of the peak current (Ip) on the concentration of 3-NBP (c = (2 – 10)·10−8 mol·L−1). Measured by AdSV at HMDE in the 0.01 mol·L−1 NaOH – methanol (100:1) mixture of resulting pHm 12.0. Potential of accumulation Eacc = – 400 mV. Time of accumulation tacc = 300 s.
Figure 13.
The dependence of the peak current (Ip) on the concentration of 3-NBP (c = (2 – 10)·10−8 mol·L−1). Measured by AdSV at HMDE in the 0.01 mol·L−1 NaOH – methanol (100:1) mixture of resulting pHm 12.0. Potential of accumulation Eacc = – 400 mV. Time of accumulation tacc = 300 s.

Figure 14.
The dependence of the peak current (Ip) on the concentration of 3-NBP (c = (2 – 10)·10−9 mol·L−1) measured by AdSV at HMDE in the 0.01 mol·L−1 NaOH – methanol (100:1) mixture of resulting pHm 12.0. Potential of accumulation Eacc = – 400 mV. Time of accumulation tacc = 600 s.
Figure 14.
The dependence of the peak current (Ip) on the concentration of 3-NBP (c = (2 – 10)·10−9 mol·L−1) measured by AdSV at HMDE in the 0.01 mol·L−1 NaOH – methanol (100:1) mixture of resulting pHm 12.0. Potential of accumulation Eacc = – 400 mV. Time of accumulation tacc = 600 s.

Figure 15.
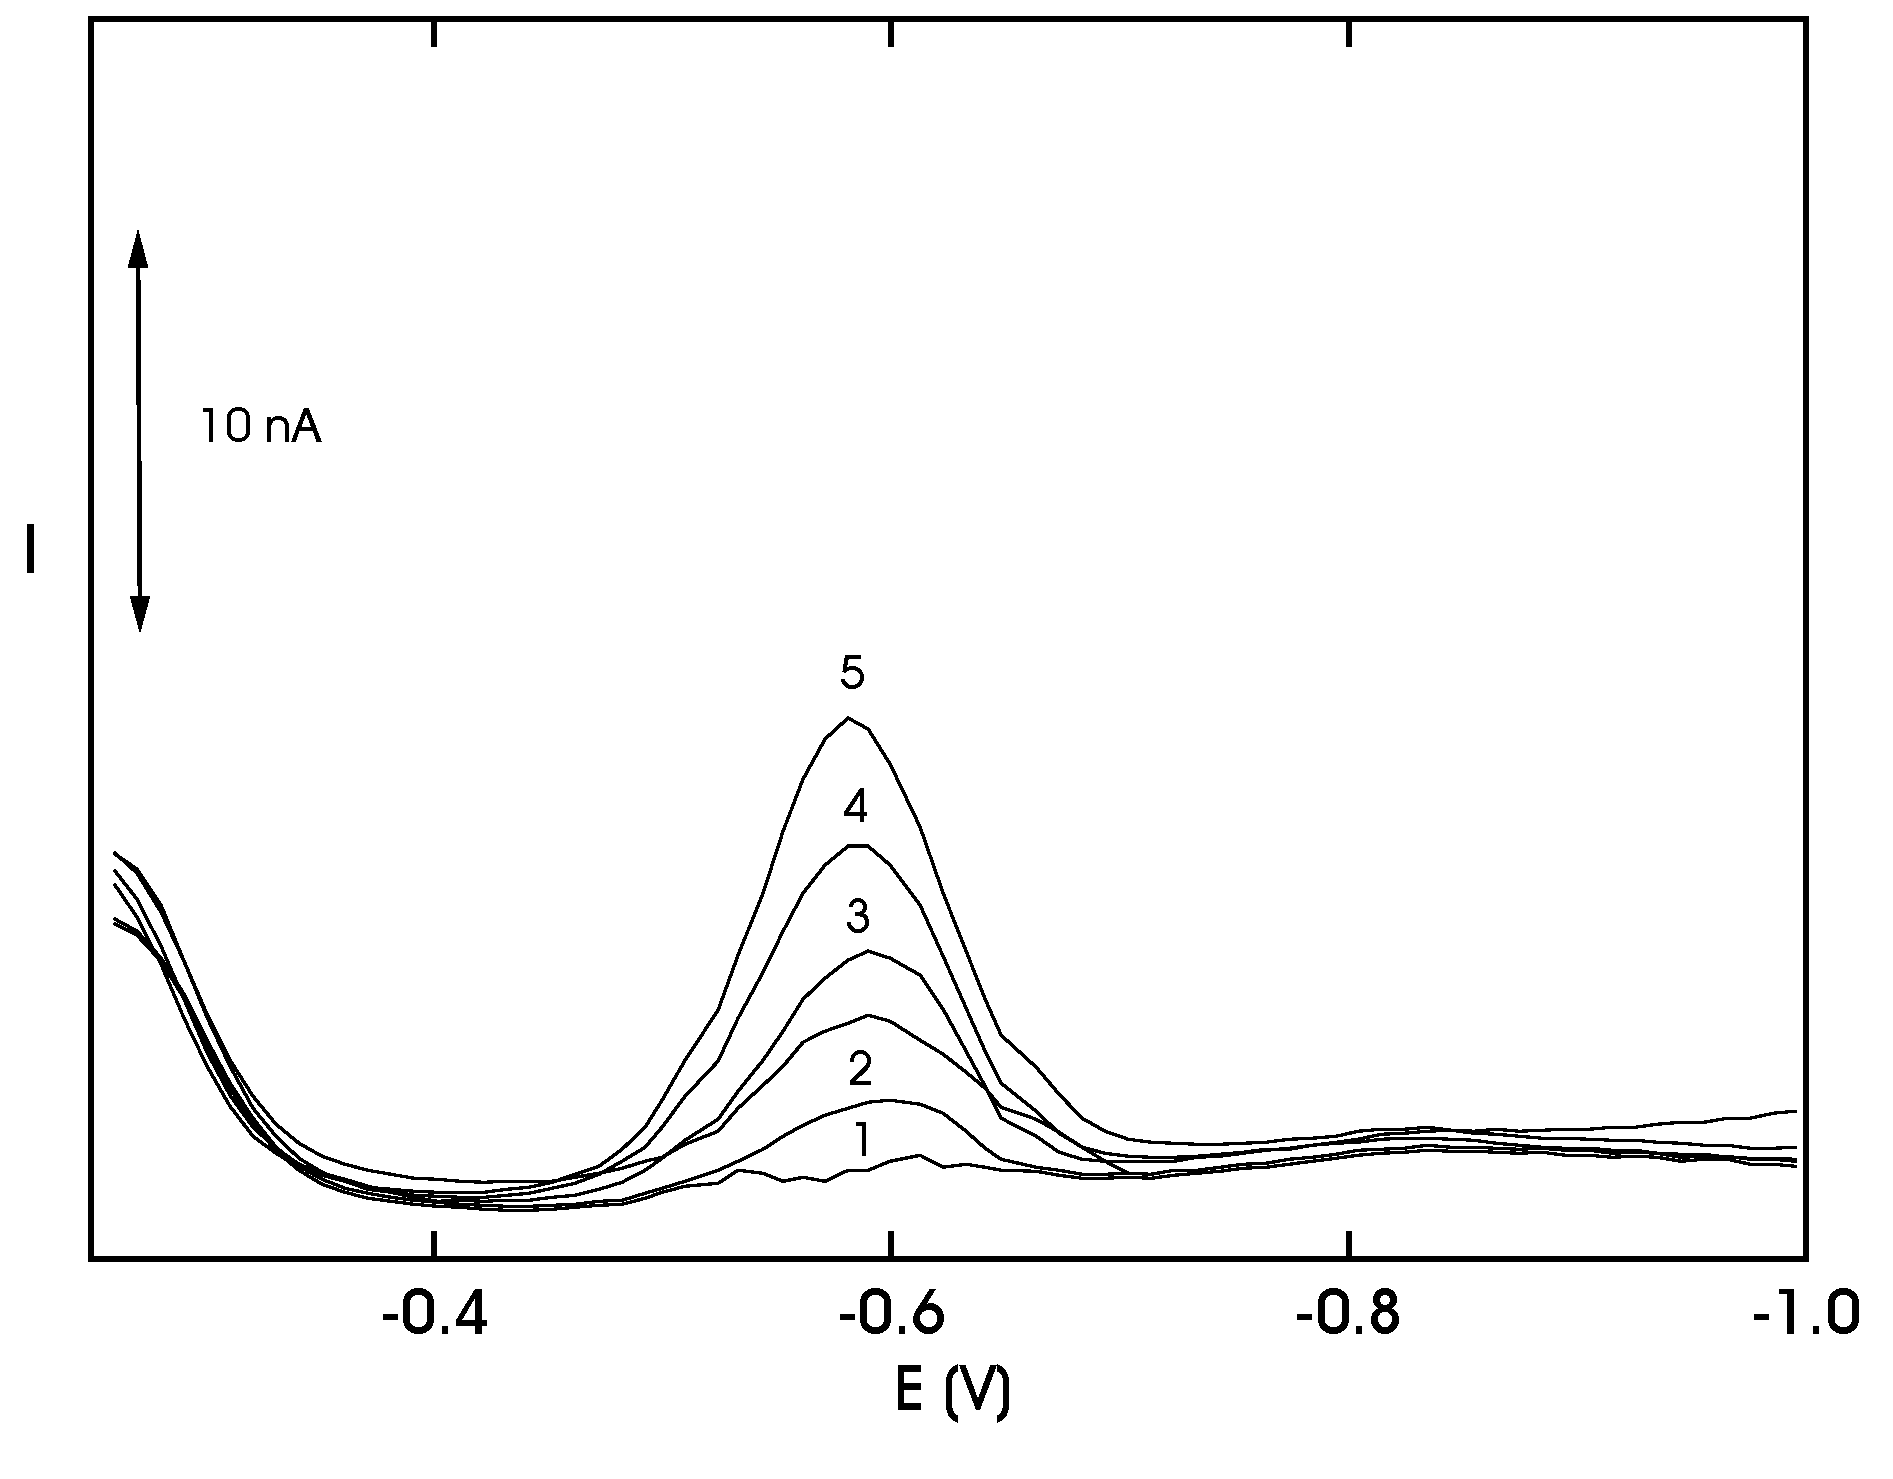
Voltammograms of 3-NBP measured by AdSV at HMDE in the lowest attainable concentration range. 0.01 mol L−1 NaOH – methanol (100:1) mixture with resulting pHm 12.0. Time of accumulation tacc = 300 s and potential of accumulation Eacc = – 400 mV. Concentration of 3-NBP (mol L−1): 0 (1), 2·10−9 (2), 4·10−9 (3), 6·10−9 (4), 8·10−9 (5), 10·10−9 (6).
Figure 15.
Voltammograms of 3-NBP measured by AdSV at HMDE in the lowest attainable concentration range. 0.01 mol L−1 NaOH – methanol (100:1) mixture with resulting pHm 12.0. Time of accumulation tacc = 300 s and potential of accumulation Eacc = – 400 mV. Concentration of 3-NBP (mol L−1): 0 (1), 2·10−9 (2), 4·10−9 (3), 6·10−9 (4), 8·10−9 (5), 10·10−9 (6).
Adsorptive Stripping Voltammetry of 4-Nitrobiphenyl at HMDE
Again, using usual optimization procedures [11], the following conditions were found: medium0.01 mol L−1 NaOH – MeOH (100:1) mixture, accumulation potential Eacc = – 400 mV, accumulation time tacc = 300 s for the concentrations (2-10)···10−8 mol L−1 and tacc = 600 s for the range (2-10)·10–9 mol·L−1. For the sake of illustration, the influence of pH on AdSV recordings of 4-NBP is demonstrated by Fig. 16, calibration curves are depicted in Fig. 17 and Fig. 18 and their parameters are given in Table 9. Relatively high intercept in Fig. 18, curve 1, is again caused by a coinciding peak of an impurity in the base electrolyte (see Fig. 19). After subtraction of the current corresponding to this coinciding peak, a corrected calibration straight line (see curve 2 in Fig. 19) was obtained with lower intercept.
Table 9.
Parameters of calibration curves for the determination of 3-NBP by AdSV at HMDE in 0.01 mol·L−1 NaOH – methanol (100:1) mixture of resulting pHm 12. Potential of accumulation Eacc = – 400 mV.
| c (mol L−1) | Slope (mA mol−1 L) | Intercept (nA) | Correlation coefficient | L Q (mol L−1) |
|---|---|---|---|---|
| (2-10) .10−8 a | 1.32 .109 | 10.3 | 0.9991 | 2.2. 10−8 |
| (2-10) .10−9 b | 2.39.109 | 2.64 | 0.9872 | 2.4. 10−9 |
a time of accumulation tacc = 300 s; b time of accumulation tacc = 600 s;
Figure 16.
AdSV voltammograms of 4-NBP at HMDE in the Britton-Robinson buffer – methanol (100:1) mixture at resulting pHm 2.0 (1), 4.0 (2), 6.0 (3), 8.0 (4), 10.0 (5), 12.0 (6). Time of acummulation tacc = 60 s.
Figure 16.
AdSV voltammograms of 4-NBP at HMDE in the Britton-Robinson buffer – methanol (100:1) mixture at resulting pHm 2.0 (1), 4.0 (2), 6.0 (3), 8.0 (4), 10.0 (5), 12.0 (6). Time of acummulation tacc = 60 s.
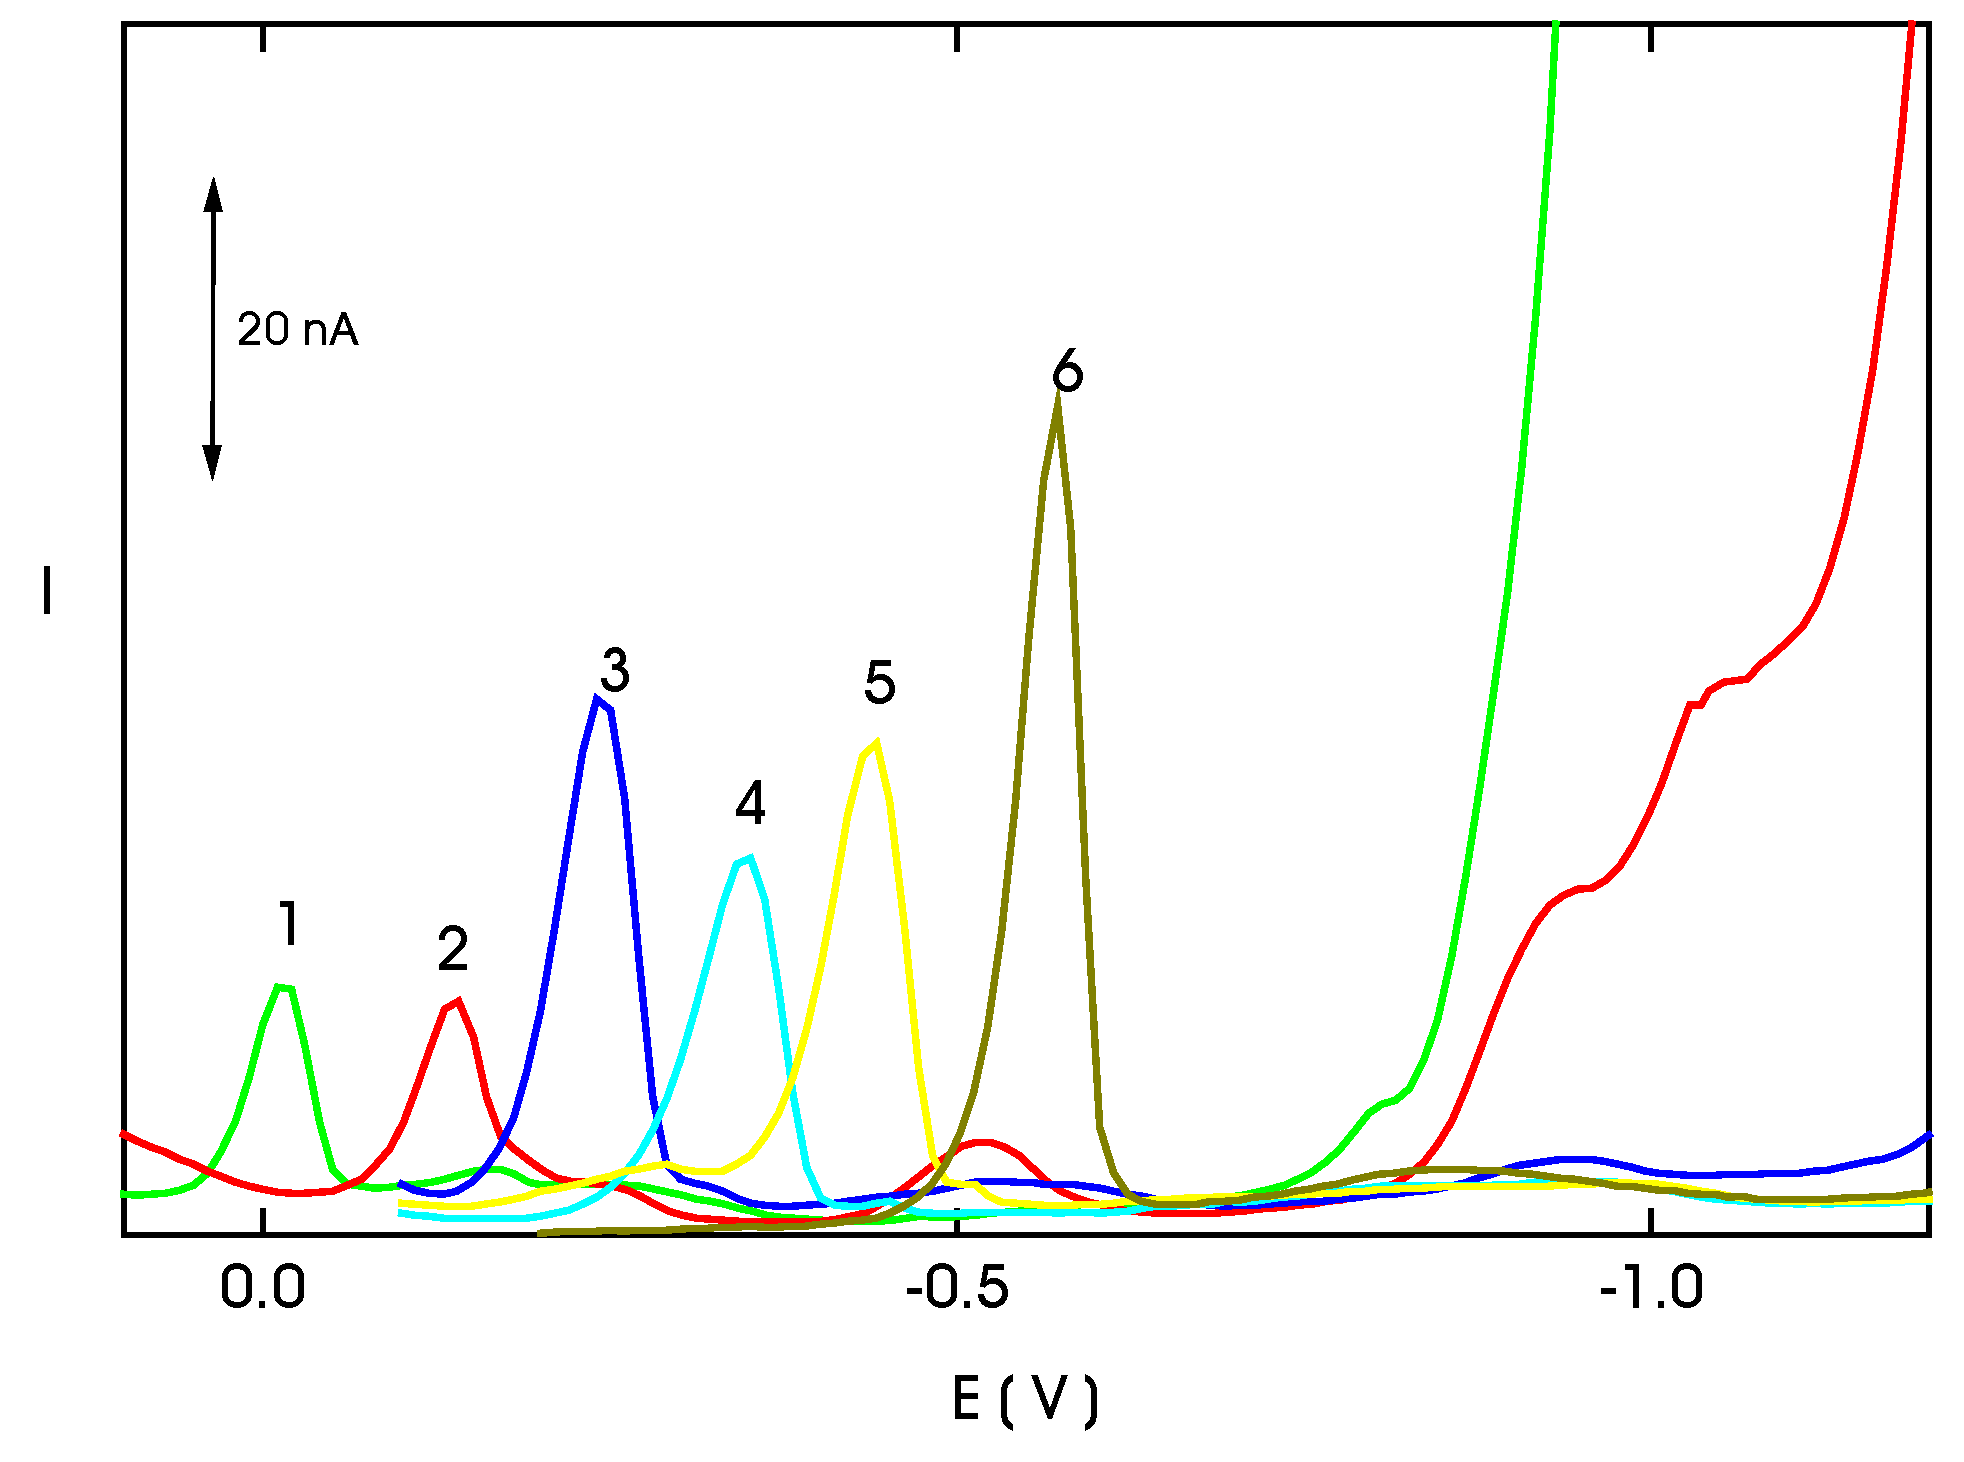
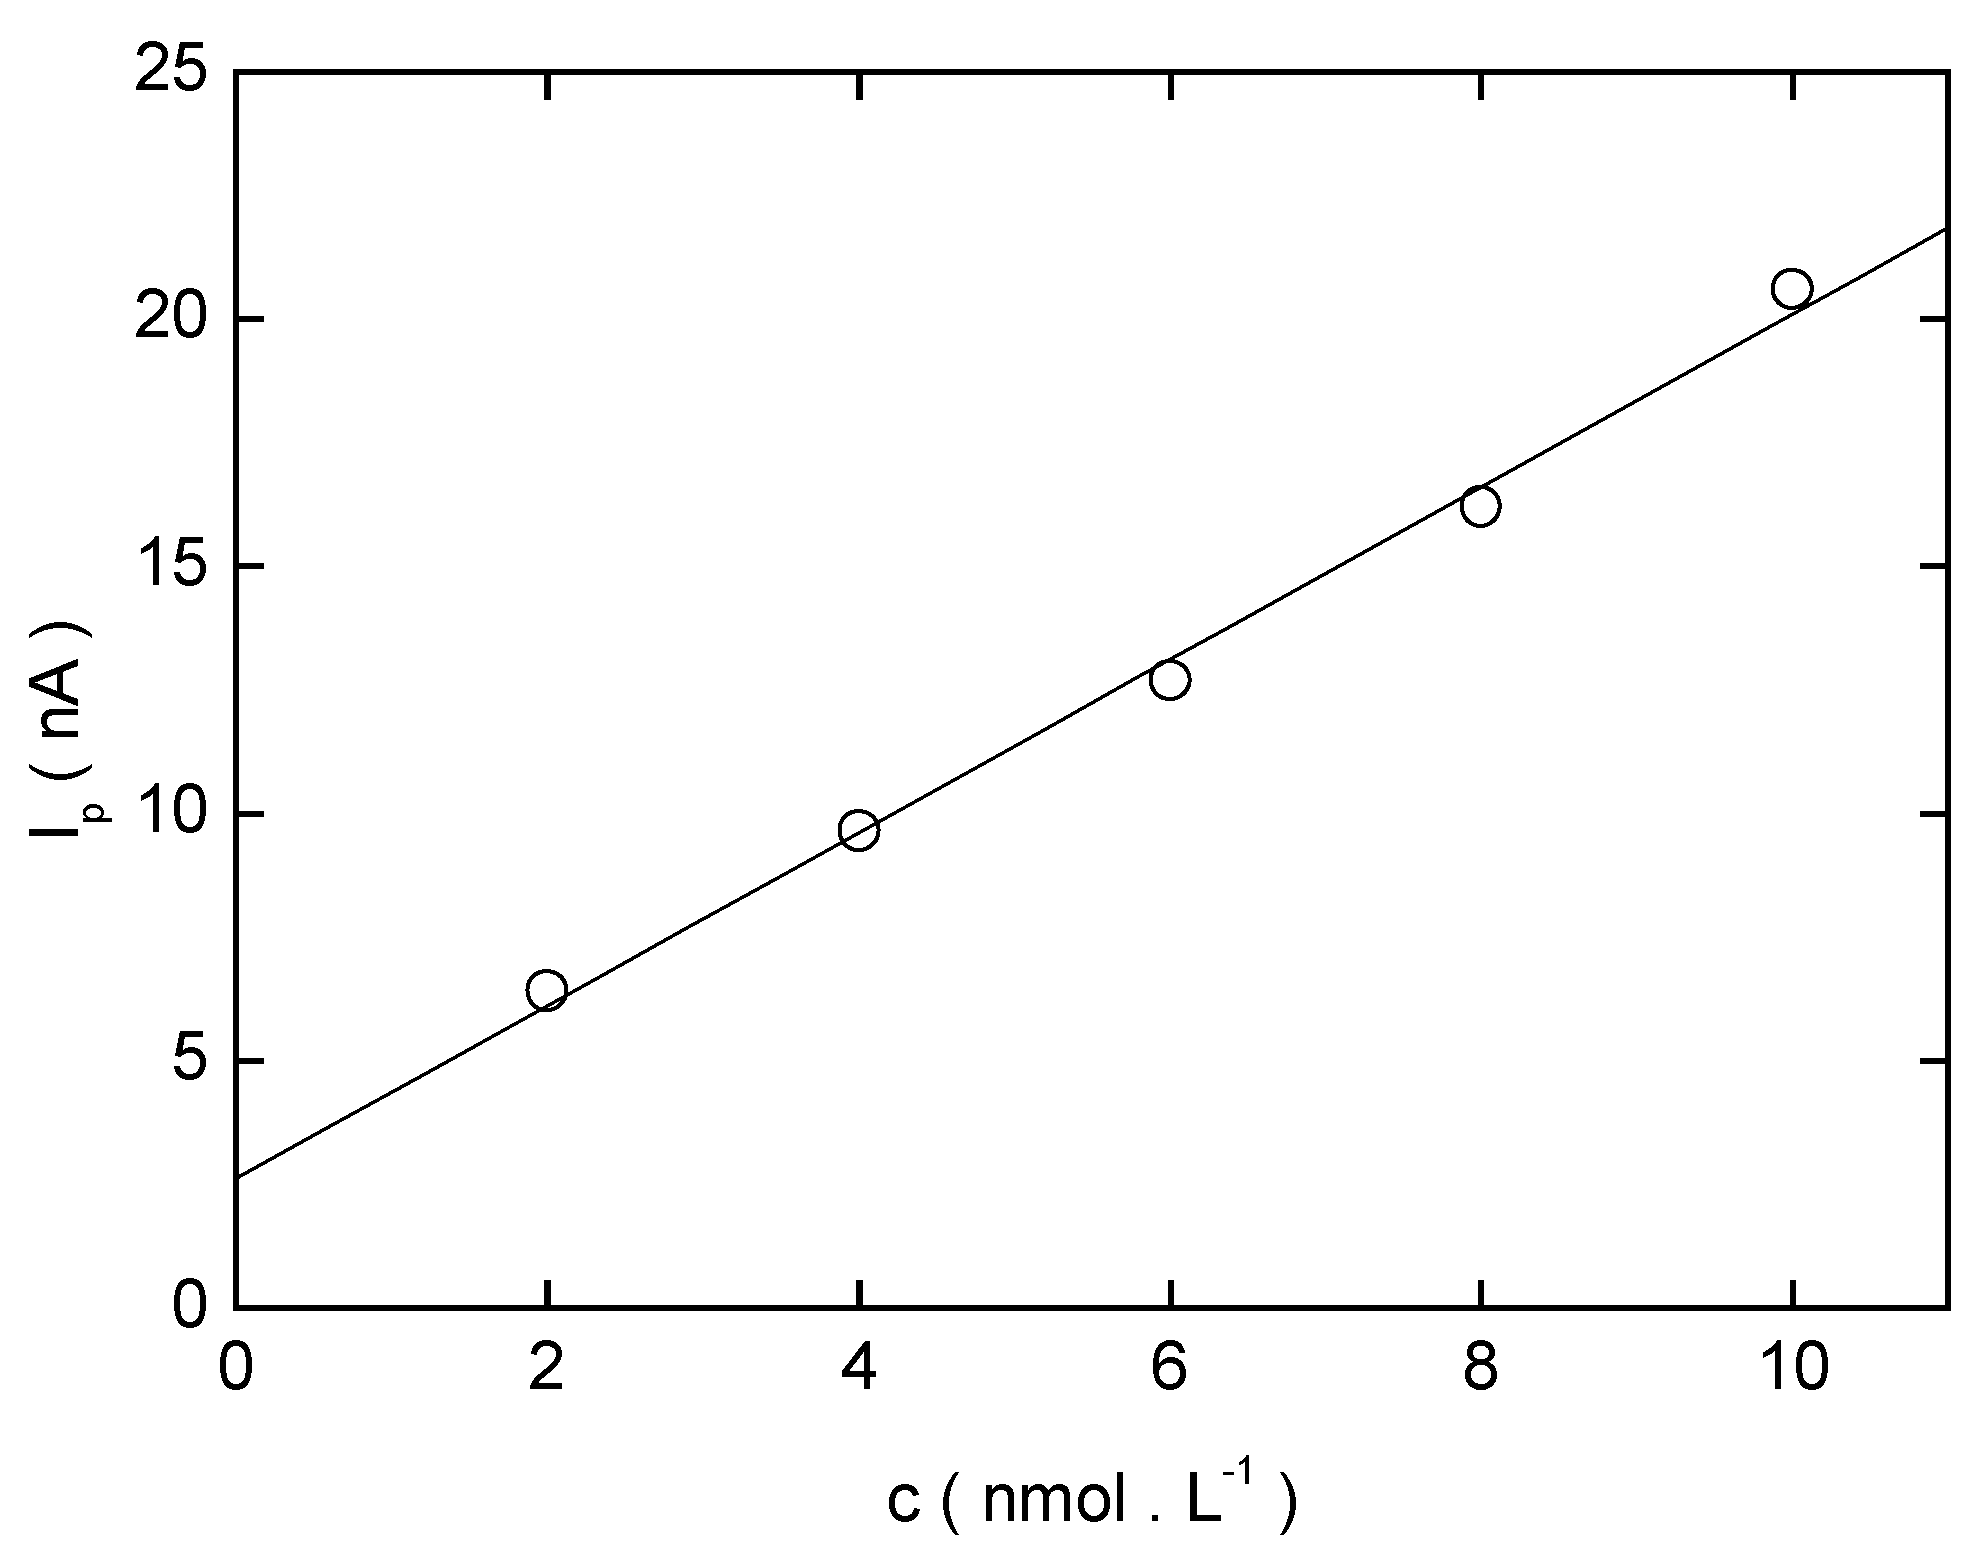
Figure 17.
The dependence of the peak current (Ip) on the concentration of 4-NBP (c = (2 – 10)·10−8 mol·L−1) measured by AdSV at HMDE in the 0.01 mol L−1 NaOH – methanol (100:1) mixture with resulting pHm 12.0. Potential of accumulation Eacc = –400 mV. Time of accumulation tacc = 300 s.
Figure 17.
The dependence of the peak current (Ip) on the concentration of 4-NBP (c = (2 – 10)·10−8 mol·L−1) measured by AdSV at HMDE in the 0.01 mol L−1 NaOH – methanol (100:1) mixture with resulting pHm 12.0. Potential of accumulation Eacc = –400 mV. Time of accumulation tacc = 300 s.
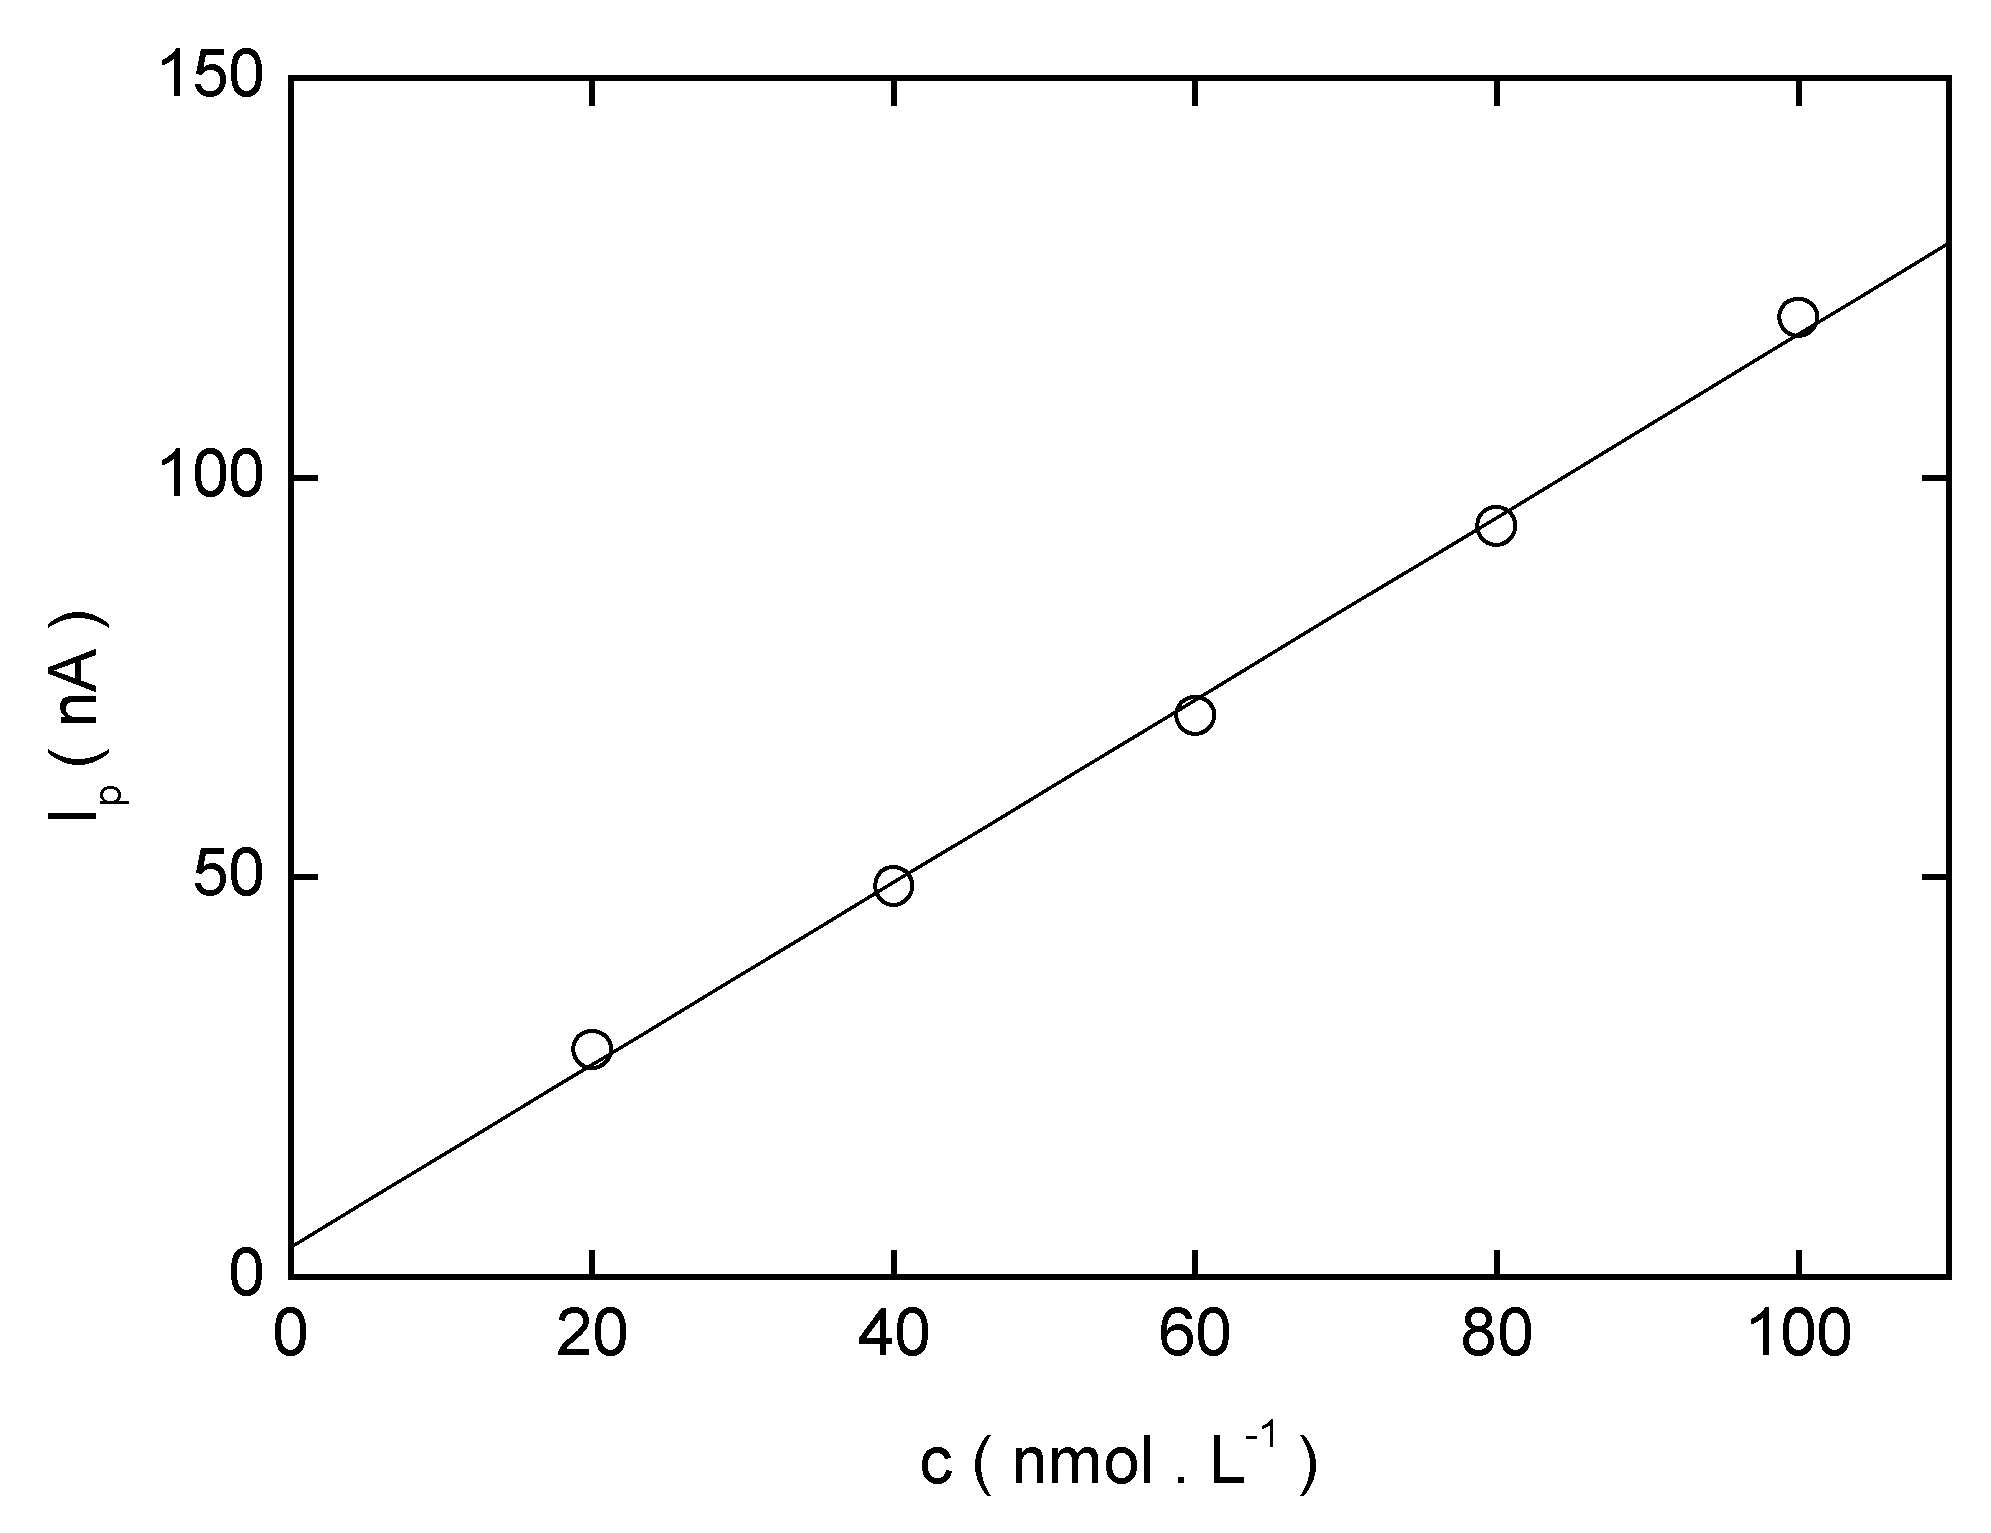
Table 10.
Parameters of calibration curves for the determination of 4-NBP by AdSV at HMDE in 0.01 mol·L−1 NaOH - methanol (100:1) medium of resulting pHm 12. Potential of accumulation Eacc = – 400 mV.
| c (mol·L−1) | Slope (nA mol−1 L) | Intercept (nA) | Correlation coefficient | L Q (mol·L−1) |
|---|---|---|---|---|
| (2-10) .10−8 a | 1.27 · 109 | 0.51 | 0.9973 | ---- |
| (2-10) .10−9 b | 2.36 · 109 | 1.40 | 0.9876 | 3.3. 10−9 |
a time of accumulation tacc = 300 s; b time of accumulation tacc = 600 s;
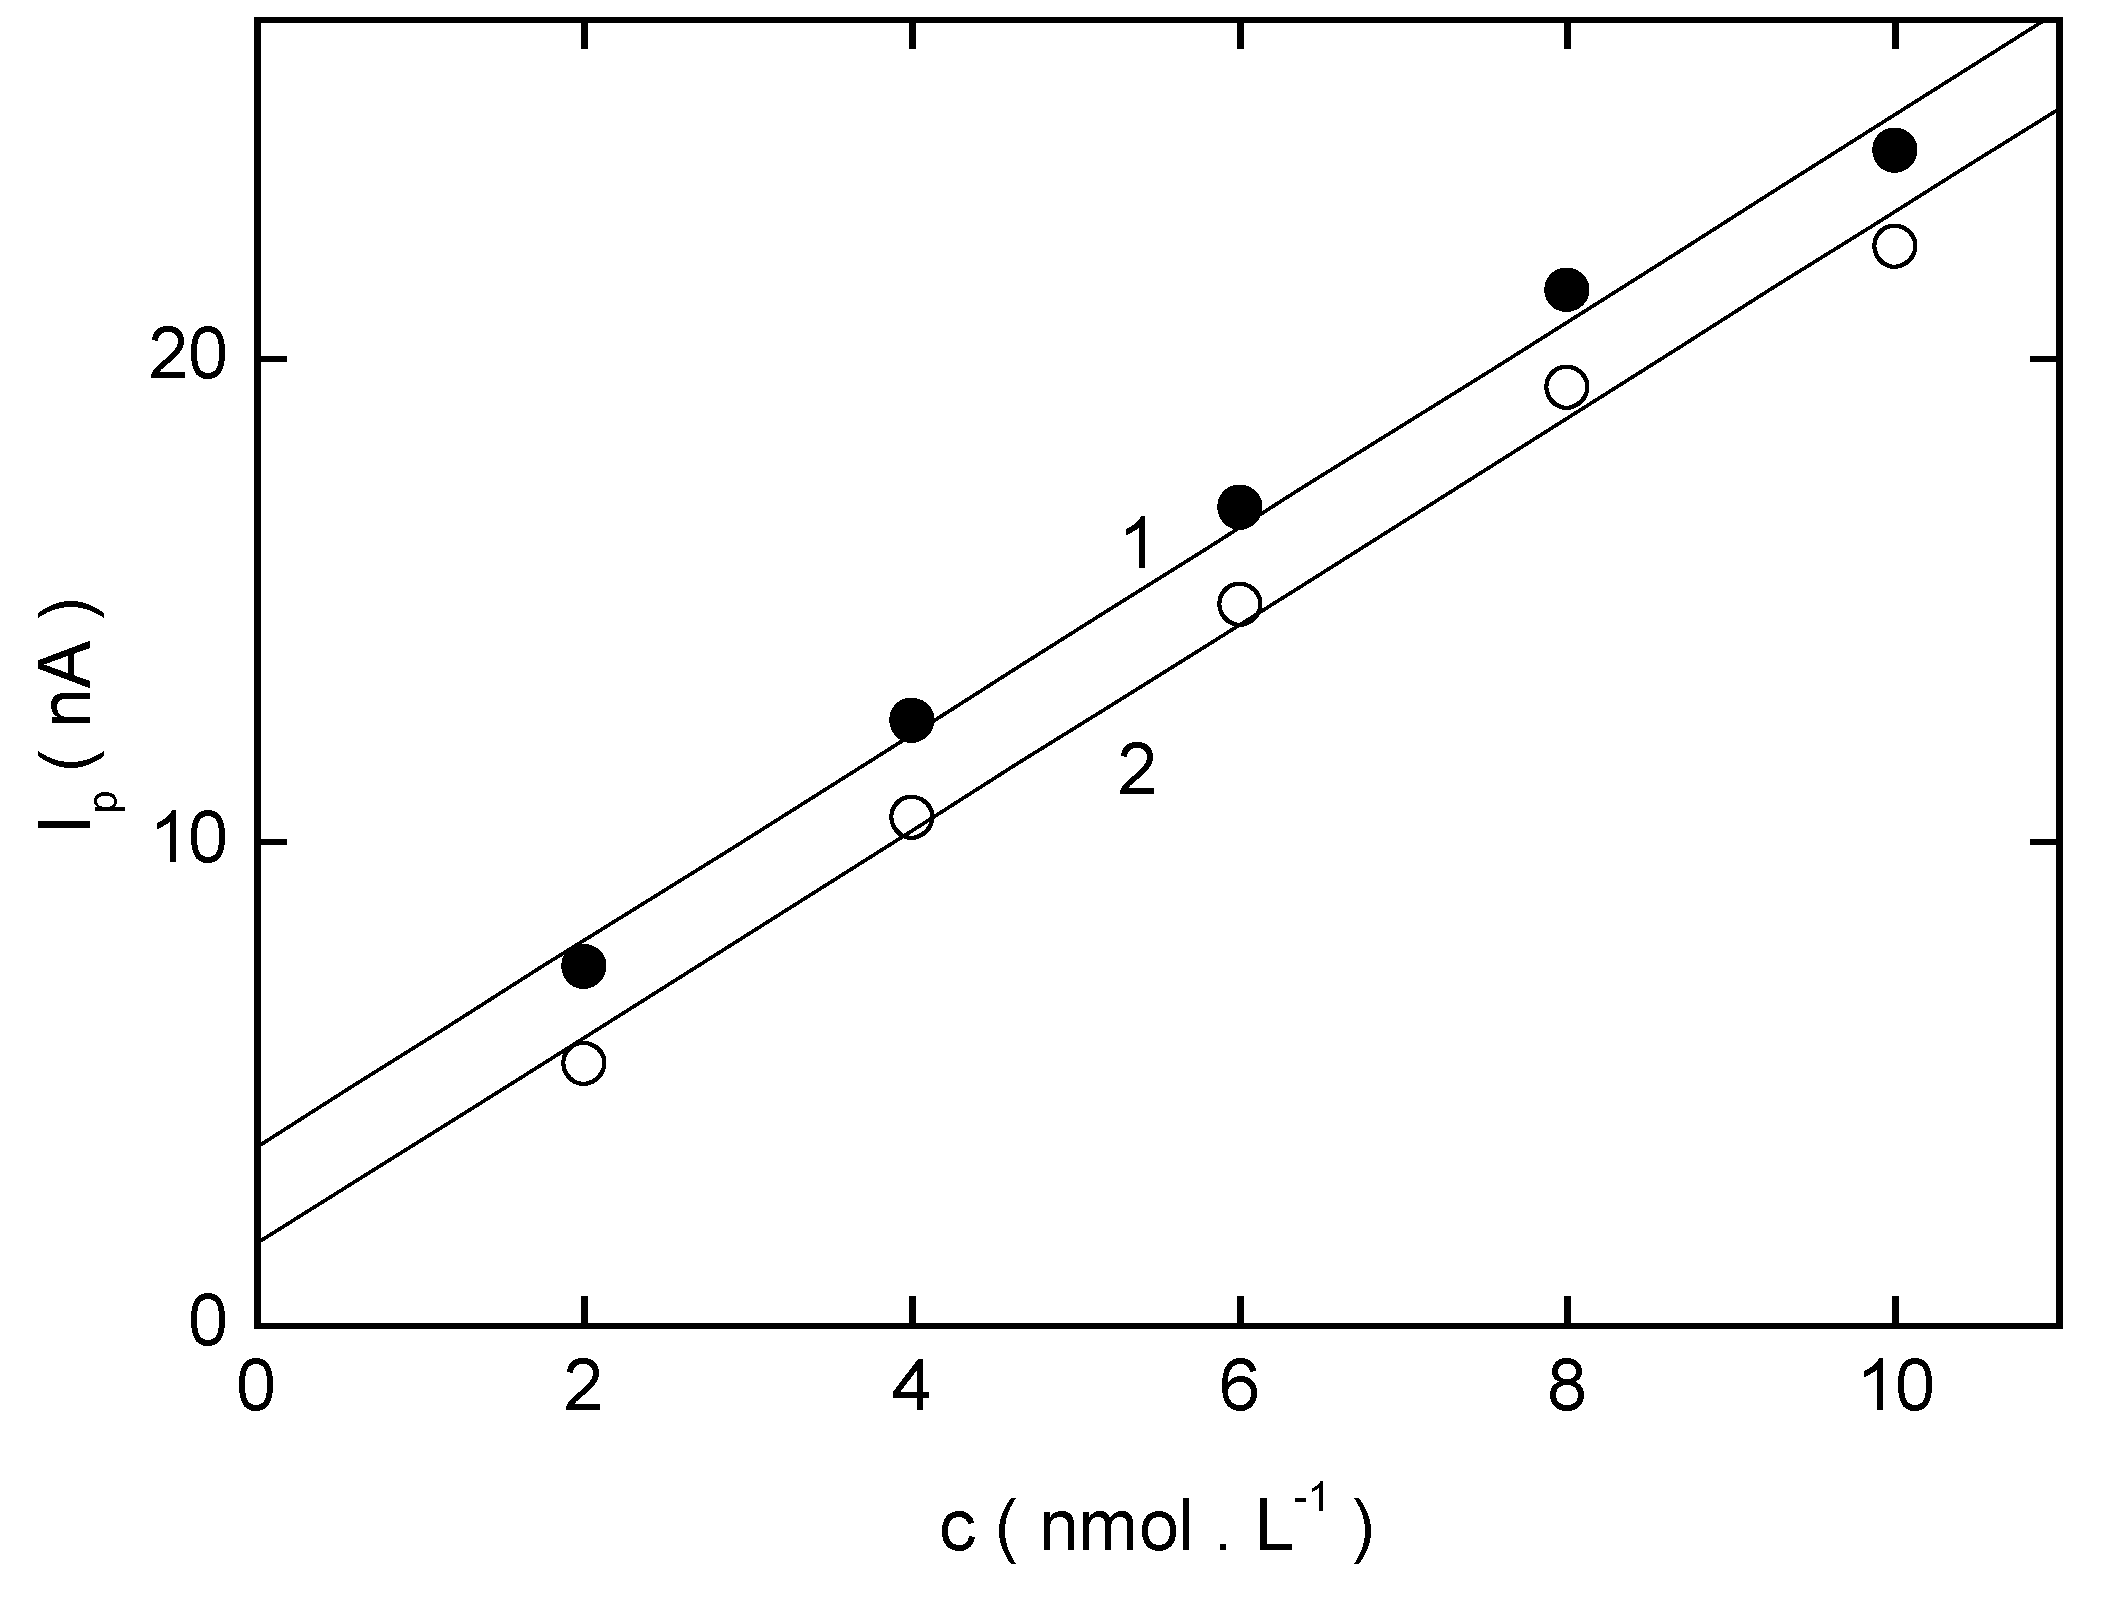
Figure 18.
The dependence of the peak current (Ip) on the concentration of 4-NBP (c = (2 – 10)·10−9 mol·L−1) measured by AdSV at HMDE in the 0.01 mol L−1 NaOH – methanol (100:1) mixture of resulting pHm 12.0. Potential of accumulation Eacc = – 400 mV. Time of accumulation tacc = 600 s. Curve 1 is calibration curve with an interfering peak in the base electrolyte. Curve 2 is corrected calibration line.

Figure 19.
Voltammograms of 4-NBP measured by AdSV at HMDE in the lowest attainable concentration range. 0.01 mol L−1 NaOH – methanol (100:1) mixture of resulting pHm 12.0. Time of accumulation tacc = 300 s and potential of accumulation Eacc = – 400 mV. Concentration of 4-NBP (mol L−1): 0 (1), 2·10−9 (2), 4·10−9 (3), 6·10−9 (4), 8·10−9 (5), 10·10−9 (6).
Analysis of Model Samples of Drinking Water
The following procedure was used: 5.00 mL of drinking water was spiked with standard solutions of 3-NBP to obtain model samples containing (2-10)·10−8 mol L−1 of 3-NBP, 100 μL of 1 mol·L−1 NaOH was added and the solution was filled up to 10 mL with methanol. The resulting calibration curve (see Fig. 20) and corresponding voltammograms (Fig. 21) confirm the applicability of DPV at HMDE in this concentration range. To determine even lower concentrations, a preliminary separation and preconcentration must be included. The following procedure can be used [11]: 100 mL of model solutions of drinking water containing (2-10)·10−9 mol·L−1 of 3-NBP were extracted with 5 mL of hexane, the extract was evaporated to dryness using a rotating vacuum evaporator and the residue was dissolved in 1 mL of methanol using sonication,. Afterwards, 1 mL of Britton-Robinson buffer pH 12 was added and DP voltammogram was recorded. The recovery was found to be 65.8 %. The calibration curves thus constructed are depicted in Fig. 22 and corresponding DP voltammograms in Fig. 23. It can be seen that this approach is suitable for the determination of nanomolar concentrations of 3-NBP in drinking water.
Figure 20.
The dependence of the peak current (Ip) on the concentration of 3-NBP measured by DPV at HMDE in the mixture drinking water – methanol (1 : 1) with resulting pHm 12.0 (Adjusted by 100 μL of 1 mol·L−1 NaOH). Concentration of 3-NBP in drinking water (2 – 10)·10−8 mol·L−1.
Figure 20.
The dependence of the peak current (Ip) on the concentration of 3-NBP measured by DPV at HMDE in the mixture drinking water – methanol (1 : 1) with resulting pHm 12.0 (Adjusted by 100 μL of 1 mol·L−1 NaOH). Concentration of 3-NBP in drinking water (2 – 10)·10−8 mol·L−1.

Figure 21.
DP voltammograms of 3-NBP at HMDE in the drinking water – methanol (1:1) mixture with resulting pHm 12.0 (Adjusted by 100 μL of 1 mol L−1 NaOH). Concentration of 3-NBP in drinking water (mol·L−1): 0 (1), 2·10−8 (2), 4·10−8 (3), 6·10−8 (4), 8·10−8 (5), 10·10−8 (6).
Figure 21.
DP voltammograms of 3-NBP at HMDE in the drinking water – methanol (1:1) mixture with resulting pHm 12.0 (Adjusted by 100 μL of 1 mol L−1 NaOH). Concentration of 3-NBP in drinking water (mol·L−1): 0 (1), 2·10−8 (2), 4·10−8 (3), 6·10−8 (4), 8·10−8 (5), 10·10−8 (6).

Figure 22.
The dependence of the peak current (Ip) on the concentration of 3-NBP measured by DPV at HMDE in the Britton-Robinson buffer – methanol (1:1) mixture with resulting pHm 12.0. 100 mL of model solutions of drinking water containing (2-10)·10−9 mol·L−1 of 3-NBP extracted with 5 mL of hexane.
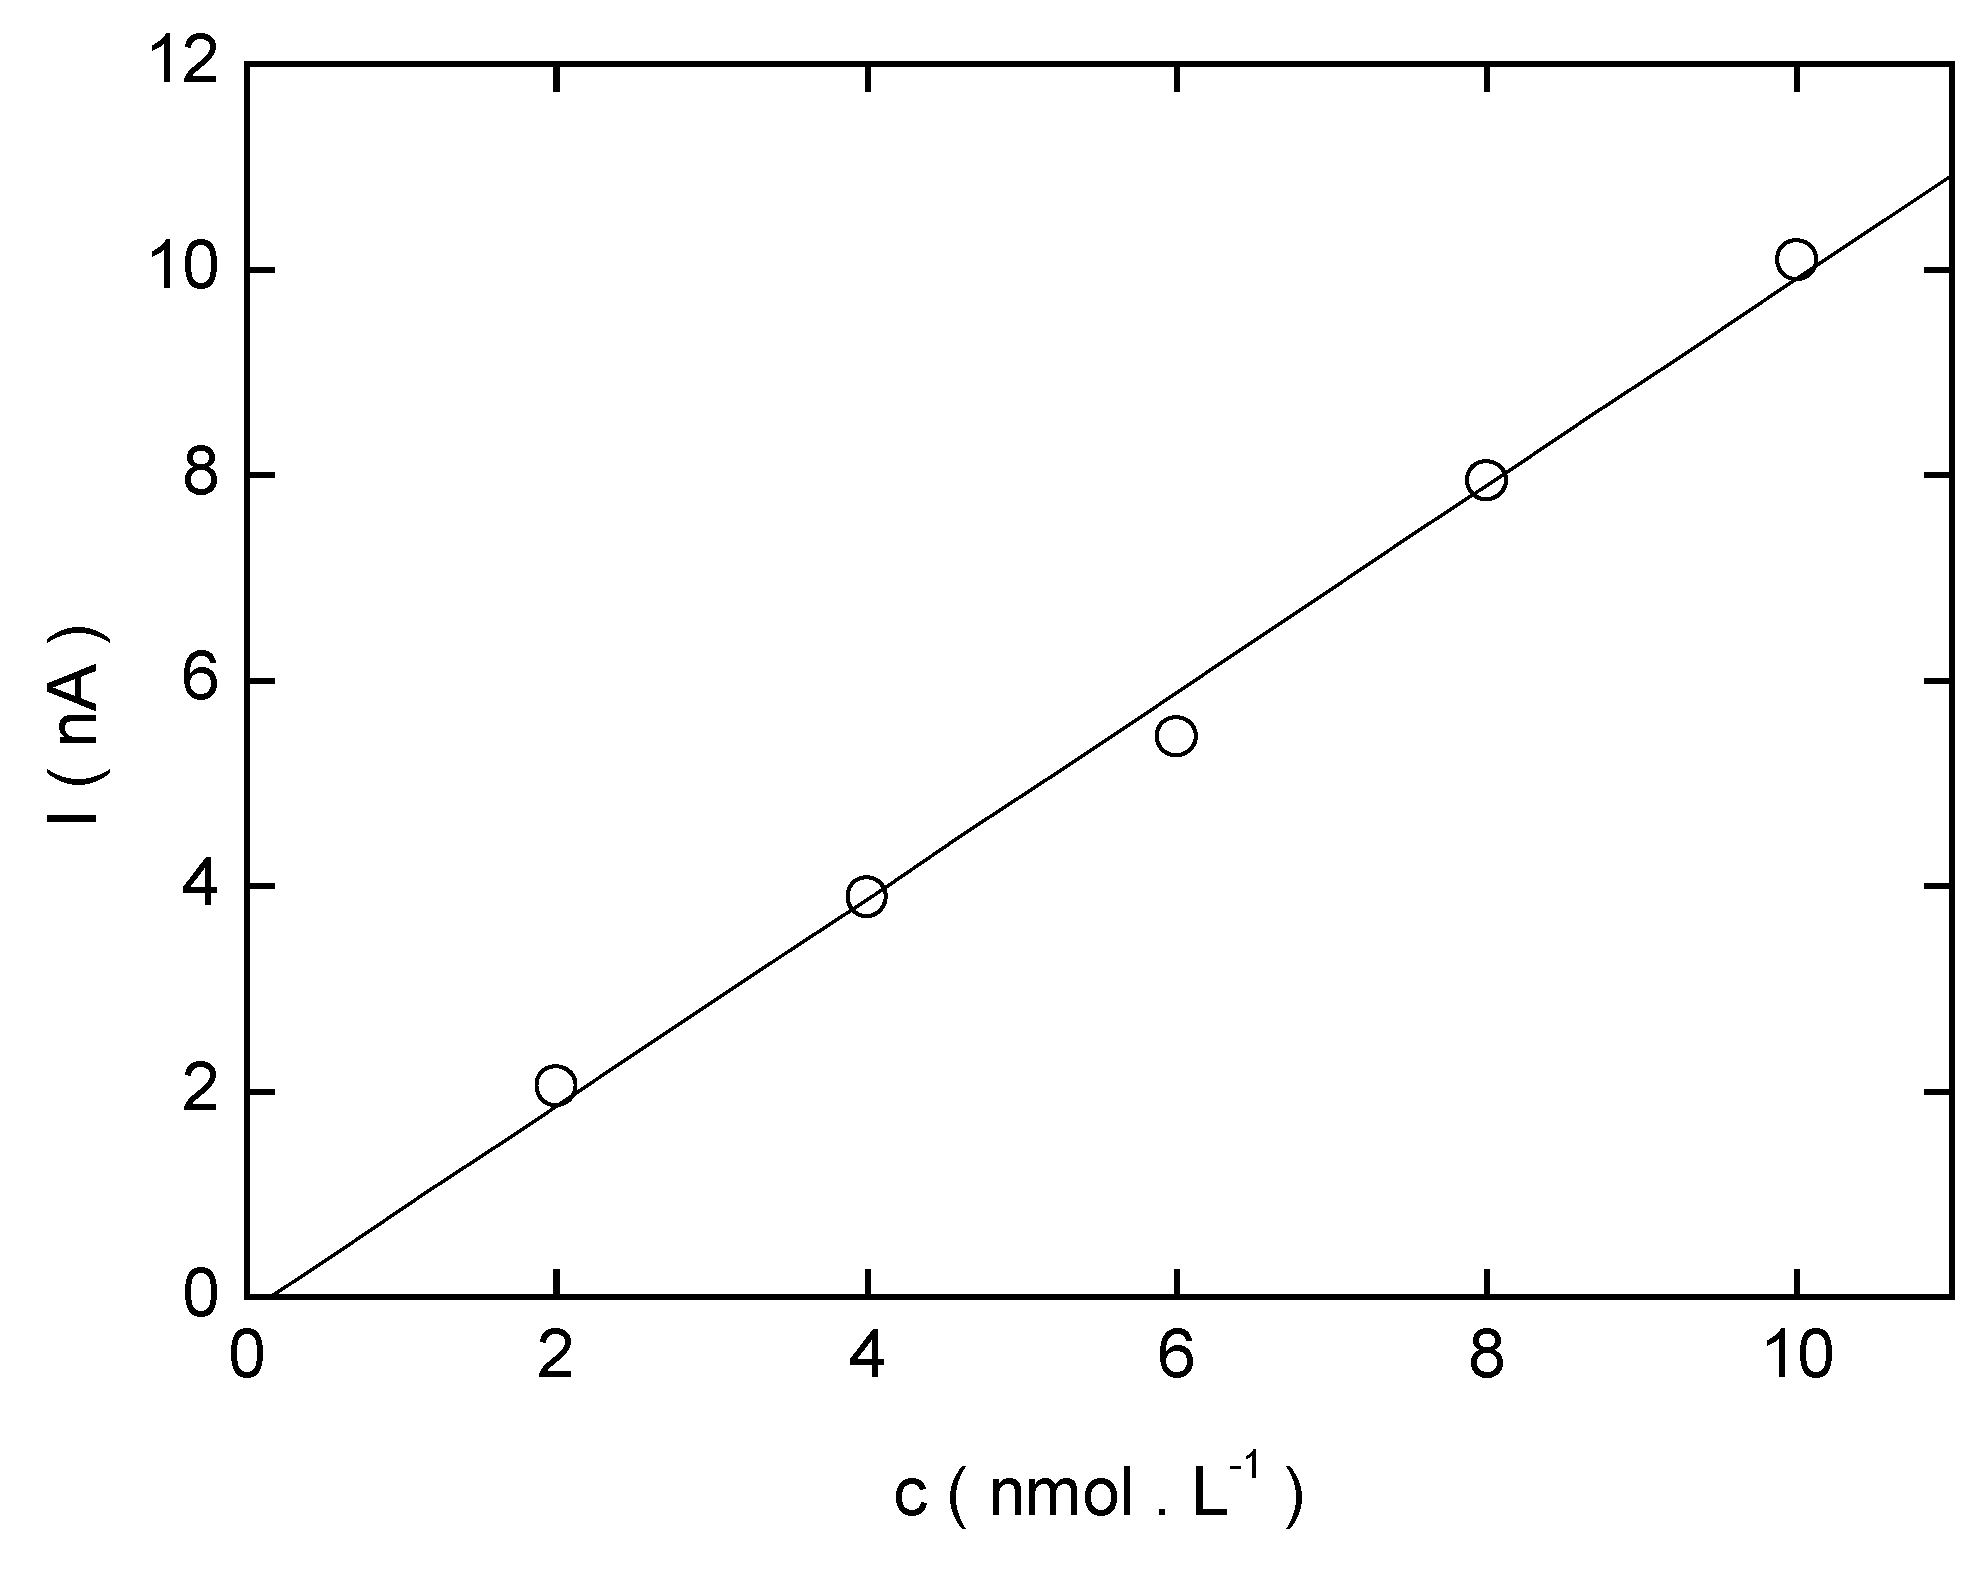
Figure 23.
DP voltammograms of 3-NBP at HMDE in the Britton-Robinson buffer – methanol (1:1) medium with resulting pHm 12.0. 100 mL of model solutions of drinking water containing 0 (1), 2·10−9 (2), 4·10−9 (3), 6·10−9 (4), 8·10−9 (5), 10·10−9 (6) mol·L−1 of 3-NBP extracted with 5 mL of hexane.
Figure 23.
DP voltammograms of 3-NBP at HMDE in the Britton-Robinson buffer – methanol (1:1) medium with resulting pHm 12.0. 100 mL of model solutions of drinking water containing 0 (1), 2·10−9 (2), 4·10−9 (3), 6·10−9 (4), 8·10−9 (5), 10·10−9 (6) mol·L−1 of 3-NBP extracted with 5 mL of hexane.
Conclusions
It has been shown that hanging mercury drop electrode is a suitable sensor for the determination of submicromolar and nanomolar concentrations of nitro substituted biphenyls in simple matrices, such as drinking water, using DPV or AdSV. For more complicated matrices, such as surface or waste waters, classical dropping mercury electrode should be preferred because of periodical renewal of its surface preventing problems with passivation of the electrode or fouling of its surface, which can be the case with HMDE, the surface of which is not renewed in the course of registration of a voltammetric curve.
Acknowledgement
JB thanks the Grant Agency of the Charles University (grant no. 253/2001/B-Ch/PrF). JZ thanks the Czech Ministry of Education, Youth and Sports (research project 113100002).
References
- Moreira, J.C.; Barek, J. Analysis of carcinogenic nitrated polycyclic aromatic hydrocarbons. Quimica Nova 1995, 18, 362–367. [Google Scholar]
- Jacob, J.; Karcher, W.; Belliardo, J.J.; Dumler, R.; Boenke, A. Review. Polycyclic aromatic compounds of environmental and occupational importance - their occurrence, toxicity and the development of high-purity certified reference materials. Part III. Fresenius J. Anal. Chem. 1991, 340, 755–767. [Google Scholar] [CrossRef]
- Cvačka, J.; Barek, J.; Fogg, A.G.; Moreira, J.C.; Zima, J. Review. HPLC of nitrated polycyclic aromatic hydrocarbons. Analyst. 1998, 123, 9–18. [Google Scholar]
- Wang, J. Electroanalytical Chemistry; Bard, A.J., Ed.; Dekker: New York, 1989; Vol.16, pp. 1–88. [Google Scholar]
- Kalvoda, R. Instrumentation in Analytical Chemistry; Zýka, J., Ed.; Horwood: London, 1994; p. 54. [Google Scholar]
- Kemula, W.; Kublik, Z. Application of the steady hanging mercury electrode to the oscillopo-larographic investigations. Roczn. Chem. 1956, 30, 1005–1008. [Google Scholar]
- Barek, J.; Fogg, A.G.; Muck, A.; Zima, J. Polarography and Voltammetry at Mercury Electrodes. Crit. Rev. Anal. Chem. 2001, 31(4), 291–309. [Google Scholar] [CrossRef]
- Barek, J.; Cvačka, J.; Muck, A.; Quaiserová, V.; Zima, J. Polarographic and Voltammetric Determination of Nitro and Amino Derivatives of Polycyclic Aromatic Hydrocarbons. Electroanalysis 2001, 13, 1369–1375. [Google Scholar] [CrossRef]
- Kemula, W.; Krygowski, T.M. Encyclopedia of the Electrochemistry of the Elements-Organic Section; Bard, A.J., Lund, H., Eds.; Dekker: New York, 1979; Vol.13, p. 77. [Google Scholar]
- http://www.cdc.gov/niosh/npg/npgd0451.html October 9, 2002.
- Štěpán, R. DiplomaThesis. Faculty of Science; Charles University: Prague, 2001; pp. 10–87. [Google Scholar]
- Oppenhelmer, L.; Cappizi, T.P.; Weppelman, R.M.; Metha, H. Determing the lowest limit of reliable assay measurement. Anal. Chem. 1983, 55, 638–643. [Google Scholar] [CrossRef]
- Schwartz, L.M. Lowest limit of reliable assay measurement with nonlinear calibration. Anal. Chem. 1983, 55, 1424–1426. [Google Scholar] [CrossRef]
- Ebel, S.; Kamm, U. Statistical definition of the limit of determination. Fresenius Z. Anal. Chem. 1984, 318, 293–294. [Google Scholar] [CrossRef]
- Sample Availability: Available from the authors.
© 2003 by MDPI (http://www.mdpi.net). Reproduction is permitted for noncommercial purposes.
Share and Cite
MDPI and ACS Style
Štěpán, R.; Barek, J.; Mejstřík, V.; Zima, J. Voltammetric Determination of Carcinogenic Nitrobiphenyls at a Hanging Mercury Drop Electrode. Sensors 2003, 3, 43-60. https://doi.org/10.3390/s30300043
AMA Style
Štěpán R, Barek J, Mejstřík V, Zima J. Voltammetric Determination of Carcinogenic Nitrobiphenyls at a Hanging Mercury Drop Electrode. Sensors. 2003; 3(3):43-60. https://doi.org/10.3390/s30300043
Chicago/Turabian StyleŠtěpán, Radek, Jiří Barek, Viktor Mejstřík, and Jiří Zima. 2003. "Voltammetric Determination of Carcinogenic Nitrobiphenyls at a Hanging Mercury Drop Electrode" Sensors 3, no. 3: 43-60. https://doi.org/10.3390/s30300043