Article

Electrochemical Study of Iodide in the Presence of Phenol and o-Cresol: Application to the Catalytic Determination of Phenol and o-Cresol

by
Lida Fotouhi
1,*,
Mahsa Ganjavi
1 and
Davood Nematollahi
2
1
Department of Chemistry, Faculty of Science, Al-Zahra University, P.O. Box 1993891176, Tehran, Iran
2
Department of Chemistry, Faculty of Science, Bu-Ali-Sina University, Hamadan, Iran
*
Author to whom correspondence should be addressed.
Sensors 2004, 4(11), 170-180; https://doi.org/10.3390/s41100170
Submission received: 10 May 2004 / Accepted: 25 October 2004 / Published: 30 November 2004

Abstract

:
The electrochemical oxidation of iodide in the presence of phenol and o-cresol was investigated at a glassy carbon electrode in buffered media by cyclic voltammetry, linear sweep voltammetry and controlled–potential coulometry. The experimental results indicate that the phenol and o-cresol convert to their derivatives after participating in a halogenation coupled reaction (quasi-catalytic reaction) following the oxidation of iodide to iodine. The concentrations of phenol and o-cresol have been determined in aqueous solutions according to the linear dependence of quasi-catalytic peak currents with the concentration. The calibration graphs show two linear sections of 0.0 to 1.0×10⁻⁴ M and 2.0×10⁻⁴ to 1.0 ×10⁻³ M for phenol and 4.2×10⁻⁵ to 1.0×10⁻⁴ M and 2.0×10⁻⁴ to 1.0×10⁻³ M for o-cresol. The theoretical detection limits and the relative standard deviations for ten measurements of phenol and o-cresol are 1.125×10⁻⁵ M, 1.06% and 4.201×10⁻⁵ M, 1.44%, respectively.

Introduction

Phenol and related compounds are used extensively in industry in the manufacture of a large variety of aromatic compounds including rubber, fertilizer, paints, drug preparations, petroleum, and agricultural industries [1-3]. Phenol is reported to be carcinogenic and exposure to phenol results in several symptoms such as convulsions, dizziness and irregular respiration [1, 4].
Some typical phenols as atmospheric pollutants are phenol, o-cresol, m-cresol, and p-cresol; however, phenols are noted more as water pollutants than as air pollutants [5]. It is frequently pollutant in industrial waste and occurs in soil and drinking water supplies [6]. In the food industry, phenols are of interest because they are essential compounds of fruit juices, beer, and wines [7].
Since many phenolic compounds can cause bad taste and undesirable odor contamination and are highly toxic and hazardous to human health [8], their analysis at low concentrations is very important [9, 10]. As the manufacture and use of phenols requires qualitative and quantitative control, a wide variety of methods have been developed to determine phenolic compounds. The range of available methods extends from distillation [11], membrane extraction [12], liquid-liquid extraction [13, 14] and gas chromatography [15, 16] to more sophisticated techniques such as microwave-assisted extraction [17, 18], ultra sonication and supercritical fluid extraction [19, 20].
Recently, some achievements in the field of enzyme electrode [21, 22] and biosensors [23, 24] have been reported. Tyrosinase-based biosensors for the determination of phenolic compounds in the organic phase have been reported extensively [25-27]. Regarding electroanalytical techniques, procedures involving phenol oxidation at solid electrodes [28-29] have been reported. In addition, chemically-modified carbon paste electrodes have proven very useful for analytical applications [22, 30].
In the previous works [31, 32], the electrochemical oxidation of iodide in the presence of barbituric acid was investigated and barbituric acid was determined by a quasi-catalytic method and coulometric titration. In this paper, we describe the electrochemical behavior of iodide in the presence of phenol and o-cresol. Here, we present a simple and sensitive method of determination of these compounds based on their reaction with electrogenerated iodine.

Experimental

Reagents and solutions

Phenol and o-cresol were prepared from the highest purity grade chemicals purchased from Aldrich. A stock Britton-Robinson buffer solution, which was 0.04 M with respect to boric, orthophosphoric and acetic acid, was prepared from analytical-reagent grade. From this stock solution of buffer, solutions of various pHs were prepared by the addition of 0.2 M sodium hydroxide solution. The solutions of various pHs of Walpole acetate buffer were prepared by mixing the appreciate amounts of 0.2 M acetic acid and 0.2 M sodium acetate. The solutions of 0.2 M disodium phosphate and 0.1 M citric acid were used for preparing the McIlvaine buffer solutions. All other reagents were of analytical grade and used without further purification.

Apparatus

Cyclic voltammetry (CV) and linear sweep voltammetry (LSV) were carried out with Metrohm model 746 VA Trace Analyzer connected to a 747 VA Stand. Coulometry was performed with Autolab model PGSTAT20 potentiostat-galvanostat. Ά glassy carbon (GC) electrode (0.2 mm diameter) was used as working electrode, which was sequentially polished with alumina powder. A platinum wire and a commercial saturated Ag/AgCl-electrode from Metrohm were used as an auxiliary and a reference electrode, respectively. Coulometry at controlled potential was performed at a platinum electrode (4 cm2). Cyclic voltammetric measurements were conducted at room temperature under nitrogen.

Analytical procedure for calibration curves

Phenol and o-cresol stock solutions were prepared by dissolving the right amount of pure substance into McIlvaine buffer solution (pH 5.4). At first, the cyclic voltammogram of 3×10⁻³ M sodium iodide in McIlvaine buffer (pH 5.4) was recorded between 0.0 and + 0.7 V. Then, different volumes of phenol or o-cresol solutions were added to the sodium iodide solution. After each addition, a cyclic voltammogram was taken for each addition. Scan rate was chosen 50 mVs-1 as optimum scan rate.

Results and discussions

The cyclic voltammogram of 1×10⁻³ M of sodium iodide in aqueous solution containing 0.2 M acetate buffer (pH 4.8) is shown in Fig. 1. As it can be seen from the Fig. 1a, iodide shows an anodic peak at 0.537 V and a cathodic peak at 0.457 V corresponding to the oxidation of iodide (I-) to iodine (I2) and vice versa. Fig. 1b shows the cyclic voltammogram of 1×10⁻³ M solution of iodide in the presence of 1×10⁻³ M phenol.
The cyclic voltammogram exhibits an increase in the anodic current and the disappearance of the cathodic current in reverse scan. The anodic peak potential is shifted to more positive potential (from 0.537 V to 0.559 V) in the presence of phenol, which is due to the deposition of the product on the surface of the electrode inhibiting to a certain extent the performance of the electrode process [33].
A typical cyclic voltammogram of sodium iodide (1×10⁻³ M) in the presence of 1×10⁻³ M phenol at different scan rates at pH 4.8 is shown in Fig. 2. Under these conditions, proportional to the increase of sweep rate, the cathodic peak (C) appears and the height increases progressively with scan rate. As it can be seen from Fig. 2 (inset, left) the Ipc/Ipa ratio increases toward unity by increasing the scan rate (Ipc and Ipa are the cathodic and anodic peak currents of iodide, respectively). The current function (Ipa1/2) also decreases by increasing the scan rate (Fig. 2, inset, right). This diagnostic citation fulfills the requirement for irreversible chemical reaction following a reversible electron transfer (EC process) [34].
Coulometric experiments were carried out to determine the number of electrons transferred in the oxidation of 1×10⁻³ M iodide solution in the presence of 1×10⁻³ M phenol at 0.550 V vs Ag/AgCl. The monitoring of the electrolysis process by cyclic voltammetry shows that as the electrolysis proceeds, the anodic peak decreases and disappears when the charge consumption becomes about two electrons per sodium iodide. However, the coulometry of the solution containing only sodium iodide consumes one electron per mole of iodide, which indicates that the number of electrons increases in the presence of phenol. This is a good indication of regeneration of iodide in the following chemical reaction, which shows an EC mechanism (quasi-catalytic reaction, see eq. (1) and (2)). The anodic peak current of iodide in the absence of phenol, which is diffusion controlled, Ipd, increased in the presence of phenol. On this basis, the increasing anodic peak current in the presence of phenol (Fig. 1b) that is related to the regeneration of iodide at the surface of the electrode [34] is presented as a quasicatalytic current (Ipcat). Thus, the most probable mechanism is as following:
2 I 2 e I 2 ( E )
phenol + I 2 Iodophenol + HI ( C )
The proposed mechanism was also confirmed by a positive test for iodine in the product obtained from the bulk electrolysis in the solution containing sodium iodide and phenol. Such a mechanism is also in good agreement with the results already proposed about electrochemical iodination and bromination of dibenzoylmethane [35].
The cyclic voltammograms of sodium iodide in the presence of o-cresol are shown in Fig. 3. The similar behavior is observed for o-cresol. The anodic peak current of NaI in the absence of o-cresol (Ipd) was increased in the presence of o-cresol (Ipcat). The decreasing current function (Ipa1/2) and increasing current ratio (Ipc/Ipa) with scan rate shows EC mechanism. Coulometry and positive test of iodine in the product of bulk electrolysis of o-cresol and sodium iodide indicate the similar quasicatalytic reaction in the same manner to phenol.

Analytical aspects

Optimization of the solution pH

In order to investigate the effect of pH on the cyclic voltammogram of sodium iodide in the presence of phenol and o-cresol, various types of buffer solutions were chosen. In each buffer at different pH values, the cyclic voltammograms of sodium iodide and phenol or o-cresol were recorded and the Ipcat/Ipd ratios were calculated. Ipcat is the anodic peak current of iodide in the presence of phenol or o-cresol, and Ipd is the anodic peak current of iodide in the absence of these compounds.
Among three different buffer solutions of Britton-Robinson, Walpole acetate and McIlvaine, the best results were obtained in McIlvaine buffer. The typical current ratios of Ipcat/Ipd of phenol and o-cresol were plotted against pH in McIlvaine buffer in Fig. 4. As it can be observed from Fig. 4, both ratios Ipcat/Ipd increased by increasing the pH. At pH higher than 6, the peaks became ill-defined and in pH lower than 5 the ratio Ipcat/Ipd is low. The best value of pH 5.4 is chosen for determination of both compounds.

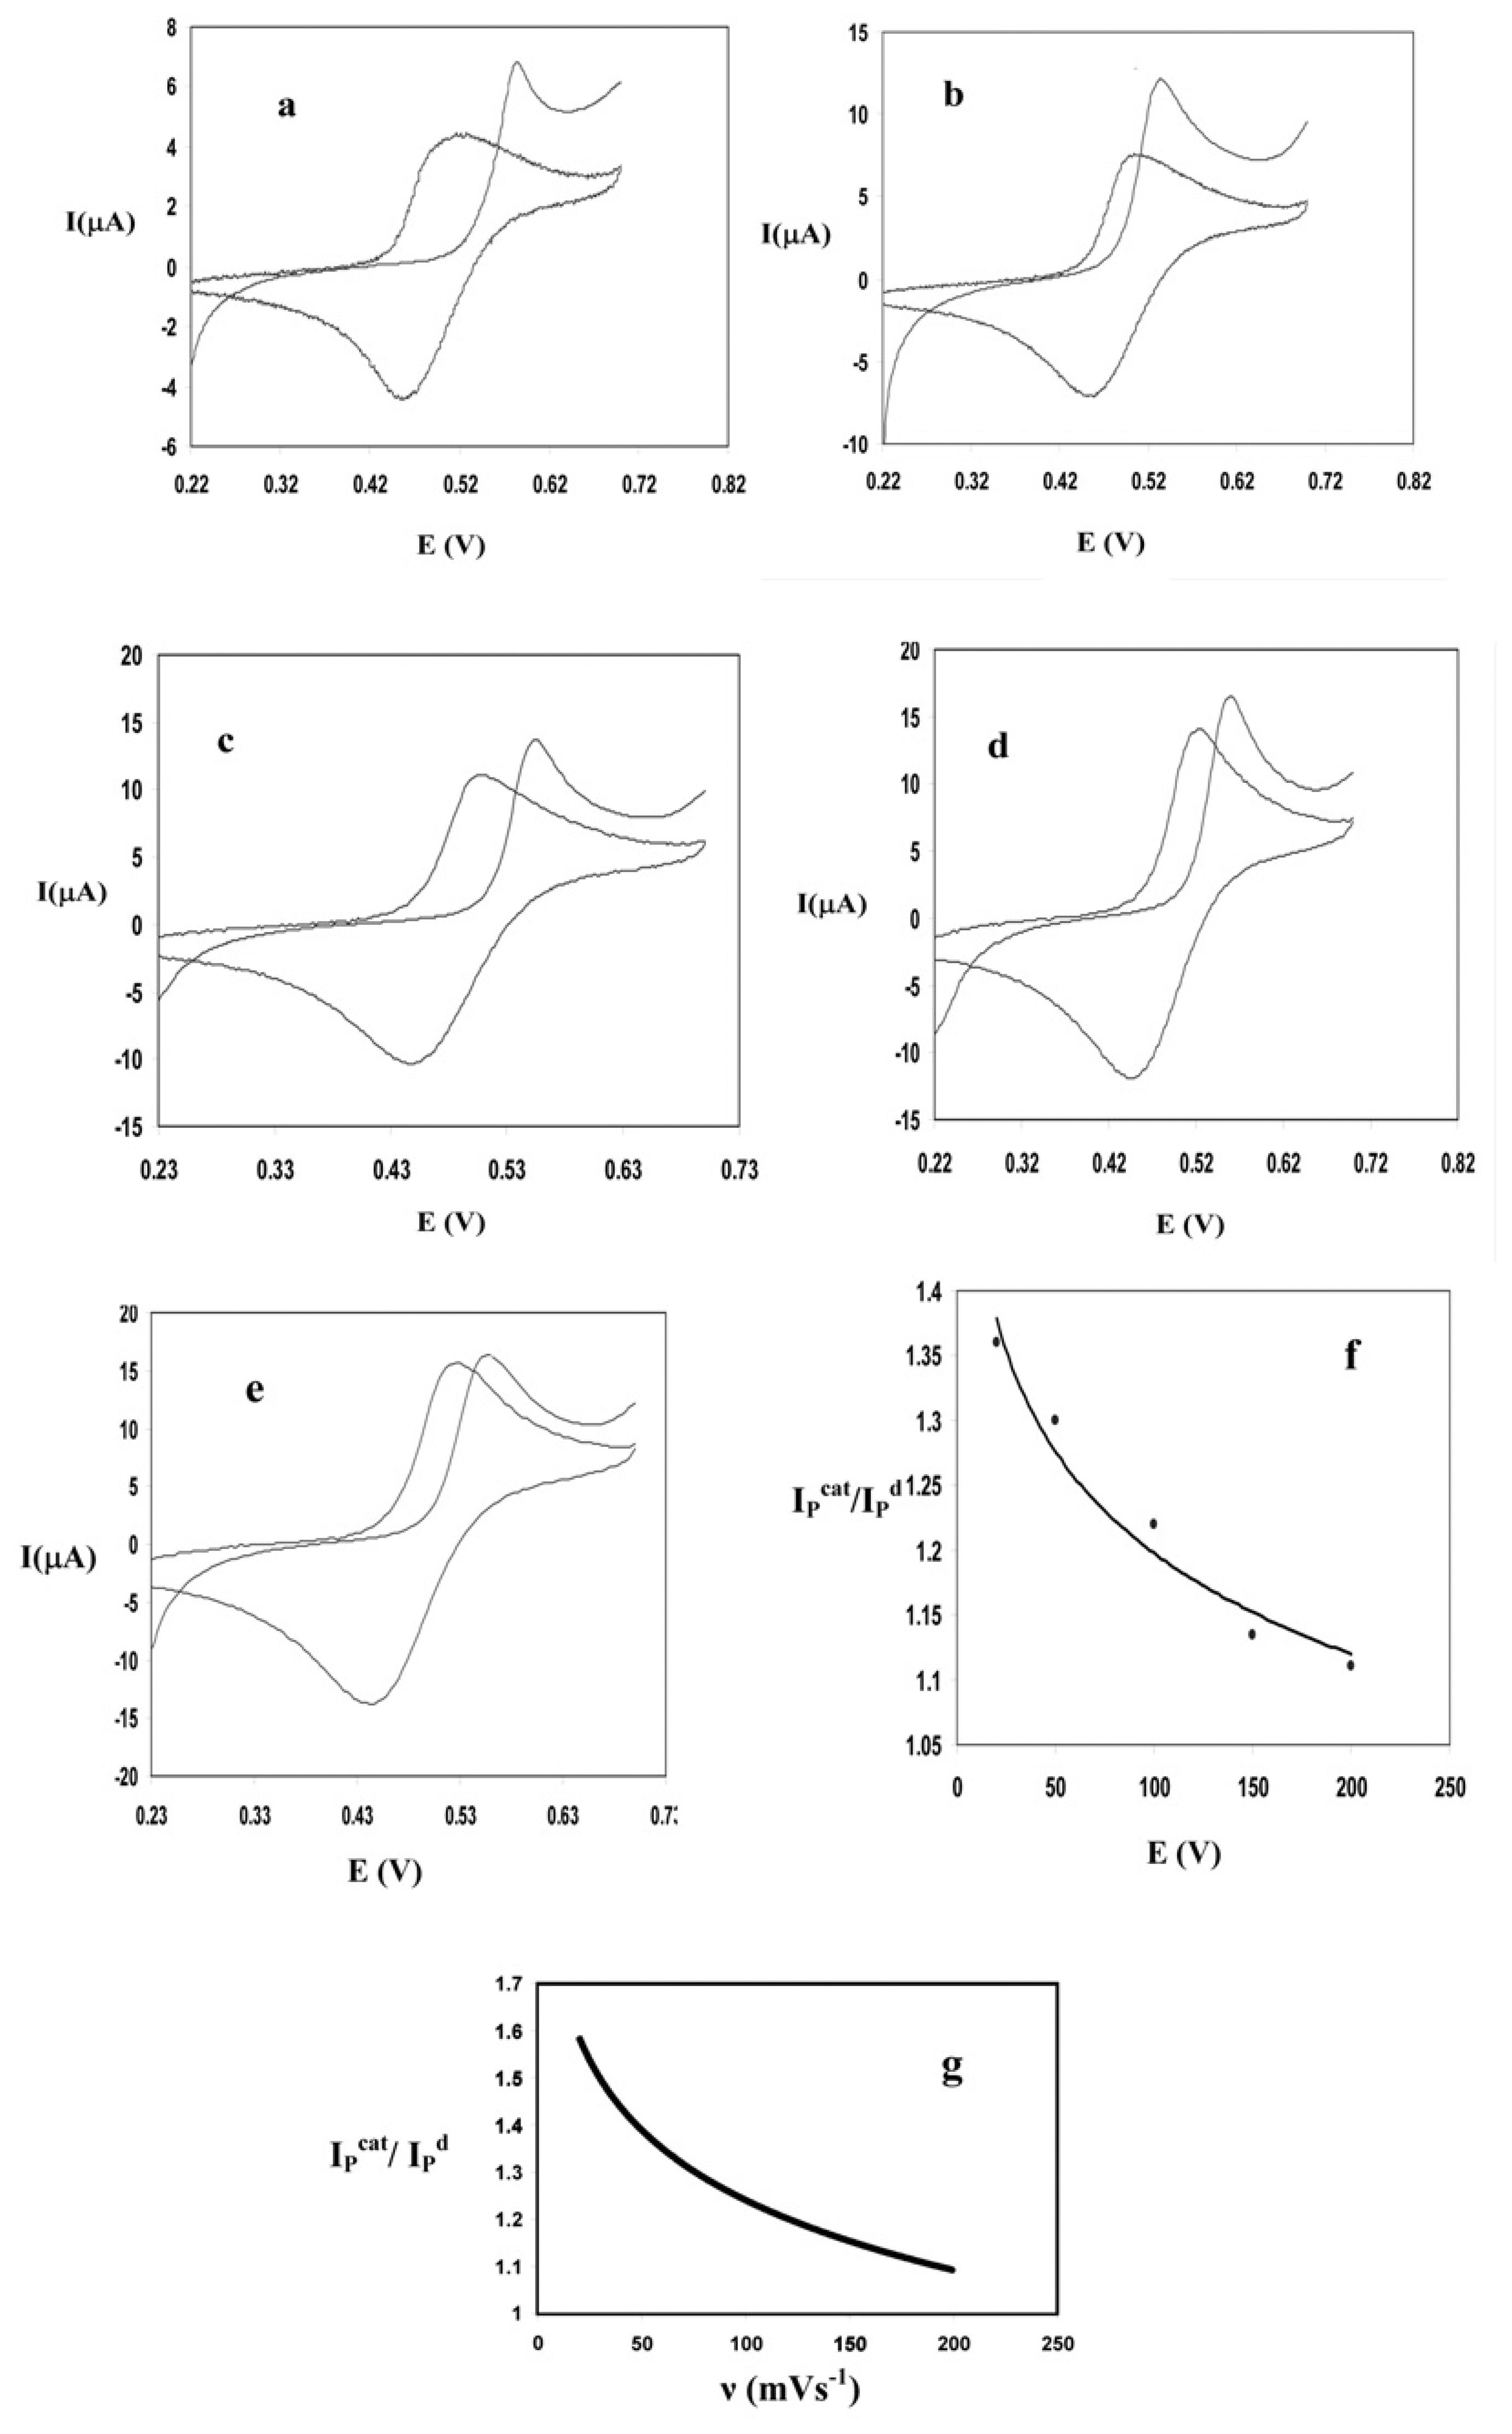
Optimization of scan rate

The influence of scan rate, υ, on the anodic peak current of iodide in the presence and absence of phenol and o-cresol was examined in the range of 20-200 mVs-1. Fig. 5 shows cyclic voltammograms (CV) of 1 mM sodium iodide in buffered medium (pH 5.4) and linear sweep voltammograms (LSV) of NaI in the presence of 2 mM phenol at various scan rates. As it can be seen by increasing the scan rate, both currents, Ipd and Ipcat (the anodic current of iodide in the absence and presence of phenol, respectively) were increased. The plot of the ratio Ipcat/Ipd vs scan rate for phenol is shown in Fig. 5f. As shown in this figure, the maximum of Ipcat/Ipd is obtained at 20 mVs-1. Since the difference of ratio values of 20 and 50 mVs-1 is small in this method, a scan rate of 50 mVs-1 is preferable due to increasing the rate of analysis. The voltammograms of o-cresol were recorded at similar conditions. The same trends with increasing scan rate were observed for this compound (Fig. 5g). The scan rate 50 mVs-1 was also chosen for o-cresol.

Optimization of sodium iodide concentration
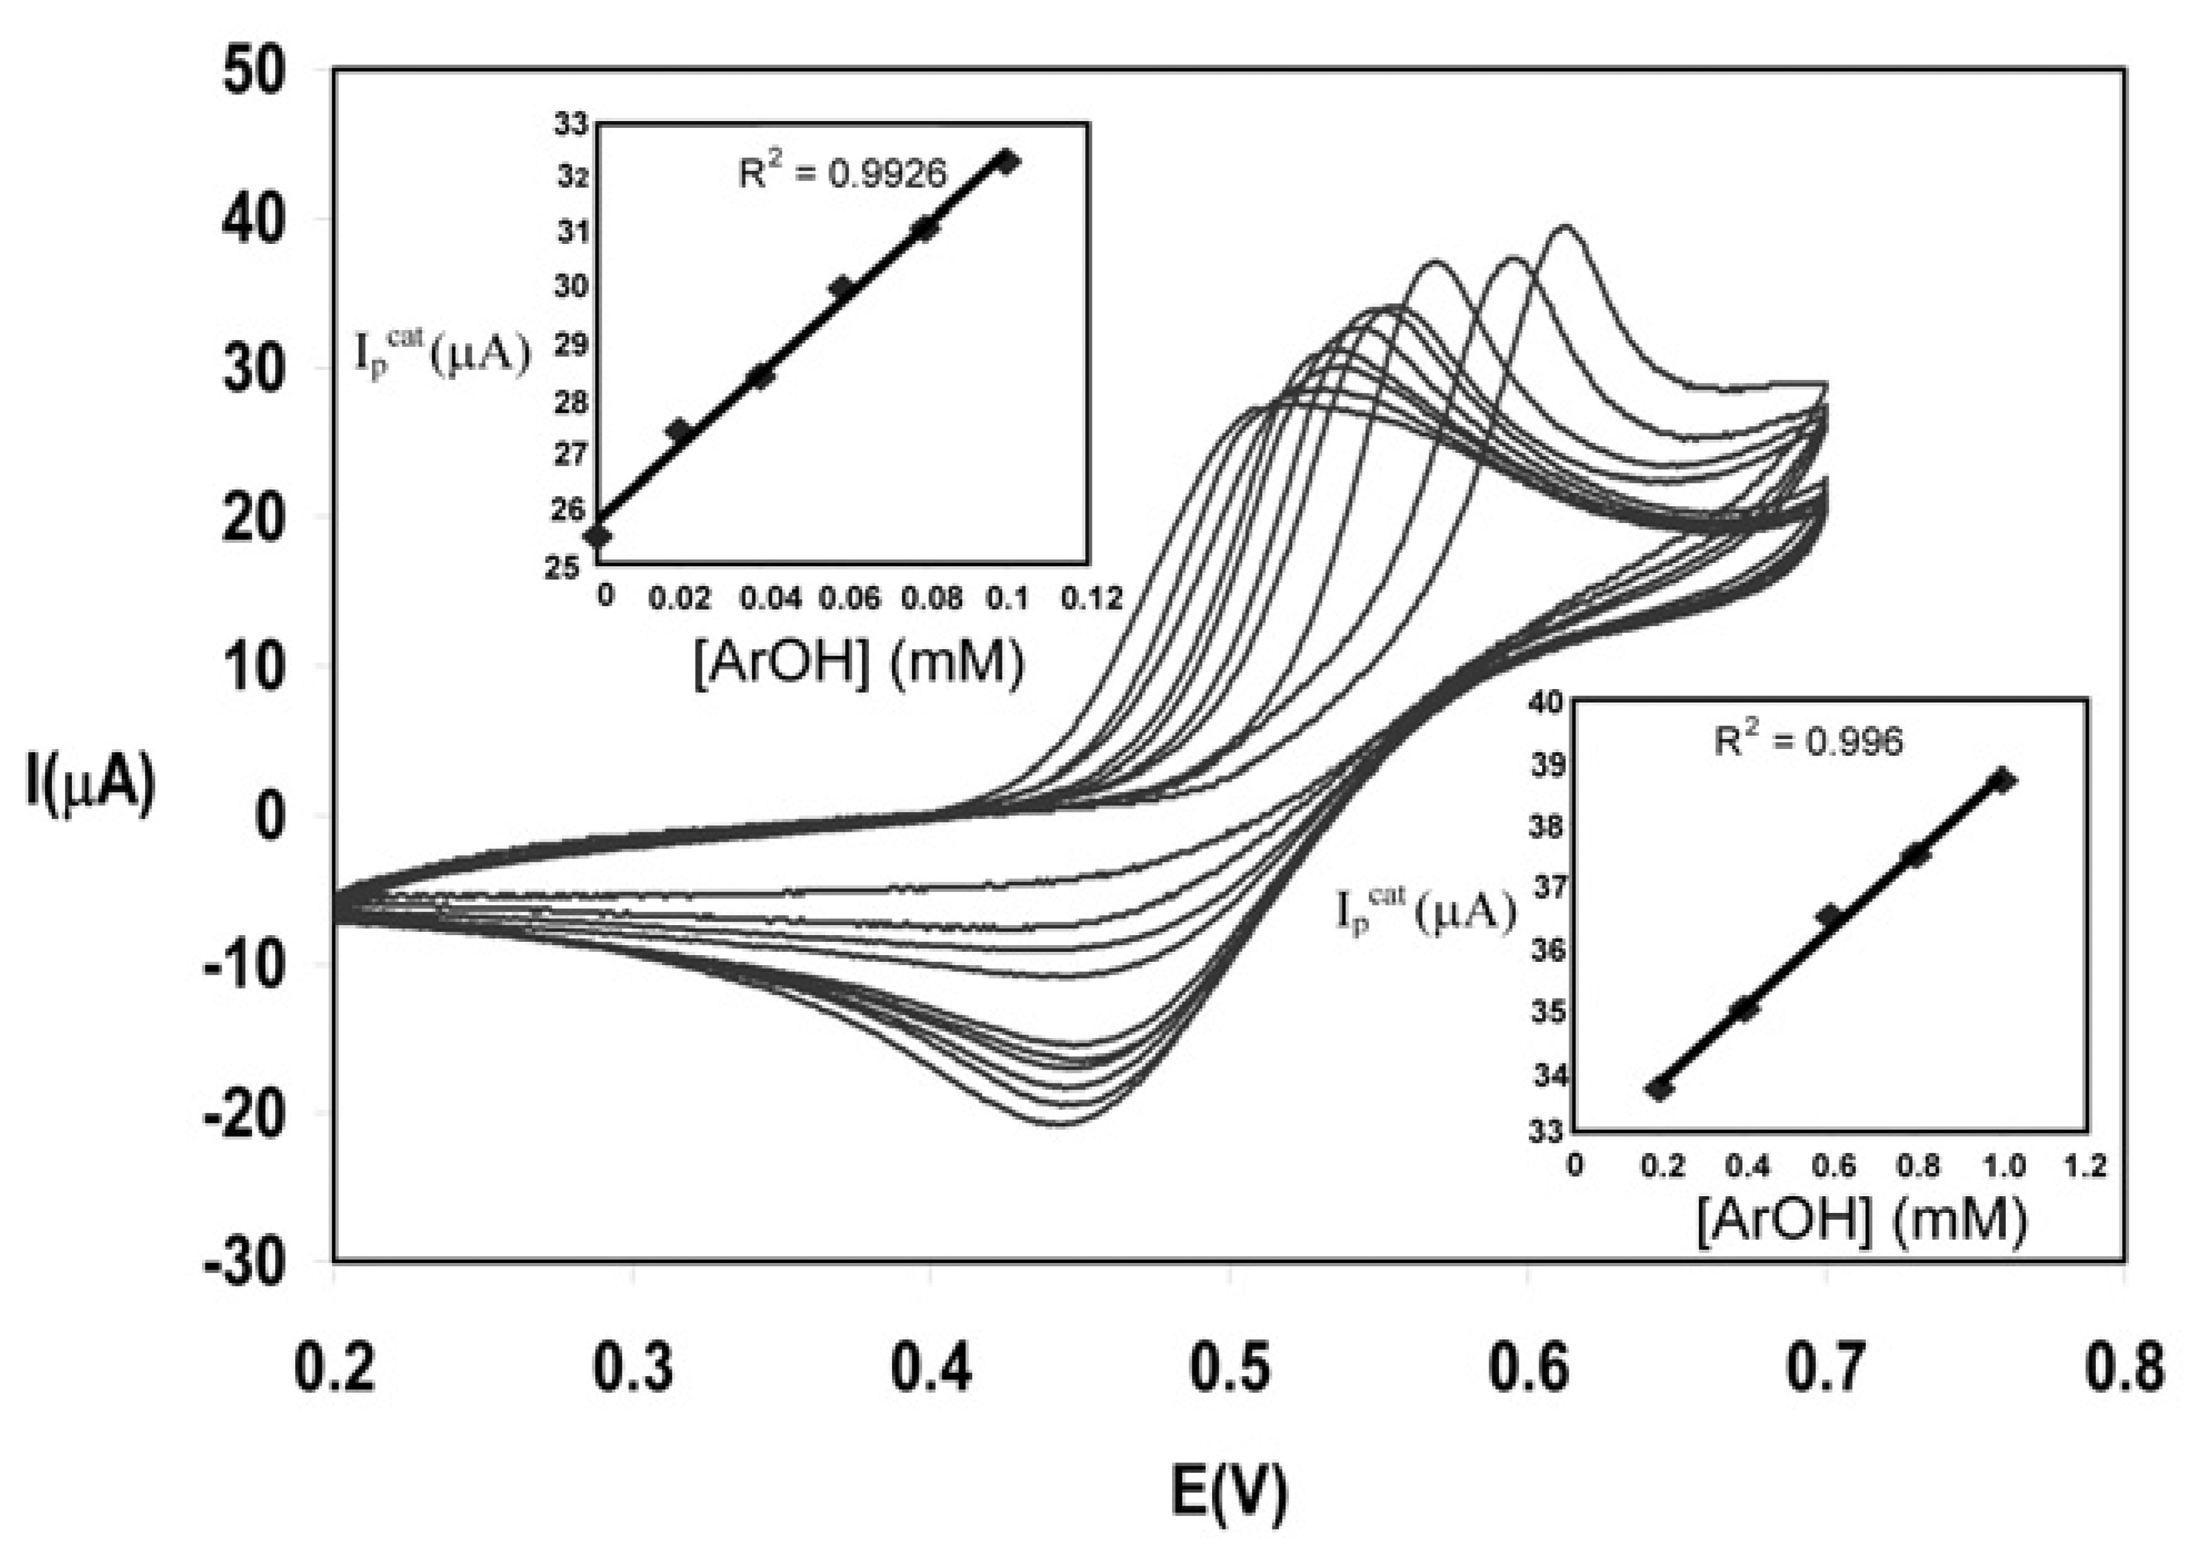
The cyclic voltammograms at different concentrations of sodium iodide in the presence of phenol or o-cresol were recorded, and the best value of 3×10⁻³ M for sodium iodide concentration was obtained.

Calibration graphs

The cyclic voltammograms of phenol at different concentrations under the optimum conditions described above such as 3×10⁻³ M sodium iodide, pH 5.4, in McIlvaine buffer and a scan rate of 50 mVs-1 were shown in Fig. 6. The calibration graph of phenol shows two linear sections of 0.0 to 1.0×10⁻⁴ M (r = 0.993, y=66.71x+25.78) and 2.0×10⁻⁴ to 1.0×10⁻³ M (r = 0.996, y=6.25x+32.53) of phenol. The calibration graph of o-cresol shows two linear sections, 4.2×10⁻⁵ to 1.0×10⁻⁴ M (r =0.999, y=143.5x+18.28) and 2.0×10⁻⁴ to 1.0×10⁻³ M (r=0.998, y=14.85x+40.7). The theoretical detection limit (DL) was calculated from DL= Xb + 3Sb equation, in which, Xb and Sb the are average value and standard deviation (SD) of blank for nine measurements. Theoretical and experimental detection limits, relative standard deviations and recoveries of phenol and o-cresol are reported in Table 1.

Interferences

In order to assess the possible analytical application of the catalytical method described above, the effect of some organic and inorganic substances was tested. It was found that many organic compounds such as ascorbic acid, acetaldehyde, cyclohexane, methanol, ethanol, acetone, carbon tetrachloride and inorganic ions such as Mg 2+, Co 2+, Cu 2+, Ca 2+, Li + and K + do not interfere, even in large amounts. As a real sample, phenol was determined in tap water under optimum conditions, in which phenol can be recovered by 5 % relative error in tap water.

Conclusions

The results of this work show that iodide is oxidized to iodine. The iodine then, reacts with phenol or o-cresol in a quasi-catalytic chemical reaction. In addition, the results of this work show that iodide can be used as a mediator in the determination of these compounds. The calibration graphs, relative standard deviations and recoveries are reported for the determination of phenol and o-cresol. Comparing the proposed determination of phenol and o-cresol with the methods previously reported [36-38], one may conclude that it is characterized by a simple cell and electrode, short analysis time, simple procedure, and commonly available reagents. And determination over a wide order of magnitude in the sample is possible.

Acknowledgments

The authors gratefully acknowledge the financial support of Department of Chemistry of Al-Zahra University.

References

  1. Patty, F.A. Industrial Hygiene and Toxicology; Vol. 2, Interscience: New York, 1963; p. p.1363. [Google Scholar]
  2. Kolthoff, I.M.; Elving, P.J.; Stross, F.H. Treatise on Analytical Chemistry; Vol. 2, Wiley: New York, 1971; p. p.490. [Google Scholar]
  3. Leithe, W. Analysis of Air Pollutants; Ann Arbor Science: Ann Arbor, MI, 1971; p. p.246. [Google Scholar]
  4. Leithe, W. Analysis of Organic Pollutants in Water and Waste Water; Ann Arbor Science: Ann Arbor, MI, 1972; p. p.113. [Google Scholar]
  5. Manahan, S.E. Fundamental of Environmental Chemistry; Lewis: Boca Raton, 1993; p. p.618. [Google Scholar]
  6. Morales, A.; Birkholz, D.A.; Hrudey, S.E. Analysis of pulp mill effluent contaminations in water, sediment and fish bile fatty and resin acids. Water Environ. Res. 1992, 64, 660. [Google Scholar]
  7. Buckee, G.K. Determination of the volatile components of beer. J. Inst. Brew. 1992, 98, 78. [Google Scholar]
  8. Chen, D.; Ray, A.K. Photodegradation kinetics of 4-nitrophenol in TiO2 suspension. Water Res. 1998, 32, 3223. [Google Scholar]
  9. Realini, P.A. Determination of priority pollutant phenols in water by HPLC. J. Chrom. Sci. 1981, 19, 124. [Google Scholar]
  10. Tyagi, R. Determination of substituted phenols in water by gas chromatography/mass spectroscopy after solid phase extraction. Fresenius Environ. Bull. 1995, 4, 751. [Google Scholar]
  11. Green, J.P.; Strierwalt, B.K.; Green, J.A.; Grizzle, P.L. Analysis of polar compound classes in SRC – II liquids-comparison of non-aqueous titrametric, i.r. spectrometric and h.p.l.c. methods. Fuel 1985, 64, 1571. [Google Scholar]
  12. Gonzalo, E.R.; Perez-Pavon, J.L.; Ruzicka, J.; Christinan, G.D. Flow injection analysis determination of phenols in kerosene and naphtha by membrane extraction preconcentration. Anal. Chim. Acta 1992, 259, 37. [Google Scholar]
  13. Heemken, O.P.; Theobald, N.; Wenclawiak, B.W. Comparison of ASE and SFE with soxhlet, sonication and mathematic saponification extraction for the determination of organic micropollutants in marine particulate matter. Anal. Chem. 1997, 69, 2171. [Google Scholar]
  14. Snyder, J.L.; Grob, R.L.; McNally, M.E.; Oostdyk, T.S. Comparison of supercritical fluid extraction with classical sonication and soxhlet extractions for selected pesticides. Anal. Chem. 1992, 64, 1940. [Google Scholar]
  15. Lompart, M.P.; Lorenzo, R.A.; Cela, R. Multivariate optimization of supercritical fluid derivatization and extraction of phenol in soil samples. J. Chrom. Sci. 1996, 34, 43. [Google Scholar]
  16. Lompart, M.P.; Lorenzo, R.A.; Cela, R. Optimization of supercritical fluid extraction of phenol and cresols in soil samples. J. Chrom A 1996, 723, 123. [Google Scholar]
  17. Lompart, M.P.; Lorenzo, R.A.; Cela, R.; Li, K.; Belanger, J.M.R.; Pare, J.R.J. Evaluation of supercritical fluid extraction, microwave-assisted extraction and sonication in the determination of some phenolic compounds from various soil matrics maria. J. Chrom. A 1997, 774, 243. [Google Scholar]
  18. Egizabal, A.; Zuloaga, O.; Etxebarria, N.; Fernandez, L.A.; Madariaga, J.M. Comparison of microwave-assisted extraction and soxhlet extraction for phenols in soil samples using experimental designs. Analyst 1998, 123, 1679. [Google Scholar]
  19. Asharf-Khorassani, M.; Gidanian, S.; Yamini, Y. Effect of pressure, temperature, modifier, modifier concentration, and sample matrix on the supercritical fluid extraction efficiency of different phenolic compounds. J. Chrom. Sci. 1995, 33, 658. [Google Scholar]
  20. Santos, F.J.; Jauregui, O.; Pinto, F.J.; Galceran, M.T. Experimental design approach for the optimization of supercritical fluid extraction of chlorophenols from pollutant soils. J. Chrom. A 1998, 823, 249. [Google Scholar]
  21. Deng, Q.; Gue, Y.; Dong, S. Cyro-hydrogel for the construction of a tyrosinase-based biosensor. Anal. Chim. Acta 1996, 319, 71. [Google Scholar]
  22. Gorton, L. Carbon paste electrodes modified with enzymes, tissues, and cells. Electroanal 1995, 7, 23. [Google Scholar]
  23. Sampath, S.; Lev, O. Membrane-free, rhodium-modified, methyl silicate-graphite amperometric biosensor. J. Electroanal. Chem. 1997, 426, 141. [Google Scholar]
  24. Wang, R.; Narang, U.; Prasad, P.N.; Bright, F.V. Affinity of antifluorescein antibodies encapsulated within a transparent sol-gel glass. Anal. Chem. 1993, 65, 2671. [Google Scholar]
  25. Dong, S.; Guo, Y. Organic phase enzyme electrode operated in water-free solvents. Anal. Chem. 1994, 66, 3895. [Google Scholar]
  26. Schubert, F.; Saini, S.; Turner, A.P.F.; Scheller, F. Organic phase enzyme electrodes for the determination of hydrogen peroxide and phenol. Sens. Actuators B. 1992, 7, 408. [Google Scholar]
  27. Conner, M.P.; Sanchez, J.; Wang, J.; Smyth, M.R.; Mannino, S. Silicone-grease-based immobilisation method for the preparation of enzyme electrodes. Analyst 1989, 114, 1427. [Google Scholar]
  28. Hedenburg, J.F.; Freiser, H. Anodic voltammetry of phenols. Anal. Chem. 1953, 25, 1355. [Google Scholar]
  29. Smyth, M.R.; Smyth, W.F. Voltammetric methods for the determination of foreign organic compounds of biological significance. A review. Analyst 1978, 103, 529. [Google Scholar]
  30. Kalcher, K. Chemically modified carbon paste electrodes in voltammetric analysis. Electroanal. 1990, 2, 419. [Google Scholar]
  31. Nematollahi, D.; Hesari, M. Electrochemical study of iodide in the presence of barbituric acid. Application to the catalytic determination of barbituric acid. J. Anal. Chem. 2001, 56, 1109. [Google Scholar]
  32. Nematollahi, D.; Hesari, M. Electrochemical study of iodide in the presence of barbituric acid. Application to coulometric titration of barbituric acid. Microchemical J. 2001, 70, 7. [Google Scholar]
  33. Golabi, S.M.; Nematollahi, D. Electrochemical study of catechol and some of 3-substituted catechols in the presence of 4-hydroxycoumarin. Application to electro-organic synthesis of new coumestan derivatives. J. Electroanal. Chem. 1997, 420, 127. [Google Scholar]
  34. Bard, A.J.; Faulkner, L.R. Electrochemical Methods: Fundamentals and Applications; New York; Wiley, 1980; p. p.452. [Google Scholar]
  35. Nematollahi, D.; Afkhami, A.; Zolfigol, M.A.; Akaberi, N. Electrochemical iodination and bromination of dibenzoylmethan. Bull. Electrochem. 2000, 16, 89. [Google Scholar]
  36. Wang, J.; Fang, L.; Lopez, D. Amperometric biosensor for phenol based on a tyrosinase-graphite epoxy biocomposite. Analyst 1994, 119, 455. [Google Scholar]
  37. Stanca, S.E.; Popescu, I.C.; Oniciu, L. Biosensors for phenol derivatives using biochemical signal amplification. Talanta 2003, 61, 501. [Google Scholar]
  38. Kim, H.; Chang, S.; Shim, Y. Cyclodextrin modified screen printed graphite electrodes for detection of phenols. Bull. Korean Chem. Soc. 2002, 23, 427. [Google Scholar]
Figure 1. Cyclic voltammograms of 1×10⁻³ M sodium iodide: (a) in the absence and (b) in the presence of 1×10⁻³ M phenol, at GC electrode in aqueous solution containing 0.2 M acetate buffer (pH 4.8), scan rate 20 mVs-1.
Sensors 04 00170f1
Figure 2. Cyclic voltammograms of 1×10⁻³ M sodium iodide in the presence of 1×10⁻³ M phenol at GC electrode, at various scan rates: 20, 50, 100, 150, 200 mVs-1. Inset: variation of peak current function (Ipa1/2) (right) and peak current ratio (Ipc/Ipa) (left) as a function of scan rate.
Sensors 04 00170f2
Figure 3. Cyclic voltammograms of 1×10⁻³ M sodium iodide: (a) in the absence and (b) in the presence of 1×10⁻³ M o-cresol, at GC electrode in aqueous solution containing 0.2 M acetate buffer (pH 4.8), scan rate, 20 mVs-1.
Sensors 04 00170f3
Figure 4. Plot of Ipcat/Ipd vs pH in McIlvaine buffer solution of (a) phenol and (b) o-cresol.
Sensors 04 00170f4
Figure 5. Voltammograms of 1 mM sodium iodide, CV in the absence and LSV in the presence of 2 mM phenol at GC electrode, at various scan rates. Scan rates from (a) to (e) are: 20, 50, 100, 150, and 200 mV s-1, respectively. Curves f and g show the variation peak of the current ratio (Ipcat/Ipd) as a function of scan rate for phenol and o-cresol.
Sensors 04 00170f5
Figure 6. Voltammograms of phenol at different concentrations, 0, 2×10⁻⁵, 4×10⁻⁵, 6×10⁻⁵, 8×10⁻⁵, 1×10⁻⁴, 2×10⁻⁴, 4×10⁻⁴, 6×10⁻⁴, 8×10⁻⁴, 1×10⁻³ M. Inset: the calibration graphs of phenol in two different concentration ranges, GC electrode, scan rate 50 mVs-1, McIlvaine buffer (pH 5.4) and 3×10⁻³ M sodium iodide.
Sensors 04 00170f6
Table 1. Detection limits, relative standard deviations and recoveries of phenol and o-cresol determination by cyclic voltammetry.
CompoundsTheoretical DL (M)Experimental DL (M)SD RelativeRecovery
Phenol1.16×10-51.125×10-51.0697 %
o-Cresol4.56×10-54.201×10-51.4495 %

