Article

Electrical Characterization of a Thiol SAM on Gold as a First Step for the Fabrication of Immunosensors based on a Quartz Crystal Microbalance

by
Asma Tlili
,
Adnane Abdelghani
*,
Salwa Hleli
and
Mhamed A. Maaref
Unité de Recherche de Physique des Semiconducteurs et Capteurs, IPEST, La Marsa, 2070 Tunis, Tunisia
*
Author to whom correspondence should be addressed.
Sensors 2004, 4(6), 105-114; https://doi.org/10.3390/s40670105
Submission received: 15 February 2004 / Accepted: 18 August 2004 / Published: 30 August 2004

Abstract

:
In order to develop a robust biosensor based on quartz crystal microbalance technique for antigen detection, a control of the steps of the surface functionalization has been performed by impedance spectroscopy. The gold electrode is functionalized with the self-assembled monolayer technique. The high insulating properties of the acidic thiol monolayer has been characterized with cyclic voltammetry and impedance spectroscopy. The modified surface is activated with N-hydroxysuccinimide(NHS) and 1-(3-(dimethylamino)propyl)-3-ethylcarbodimide hydrochloride(EDC) cross-linker for antibody coupling. The non-specific sites are blocked with bovin serum albumine molecules. Different concentrations of antigen can be detected with a good reversibility in real time with the quartz crystal microbalance.

Introduction

The key feature of a preferment biosensor is the immobilization of a high density of functional molecules on the transducer surface. Many strategies have been involved for the immobilization of biomolecules for different surfaces [1]. The chosen immobilization method must retain the stability and activity of the bound biologic receptor. One route can that be used is provided by the Self-Assembled Monolayer (SAM) technique of thiols on metallic surface and especially, on gold. Then, the receptor can be coupled using the end of the SAM via a functional group, like N-hydroxysuccinimide (NHS) and 1-(3-(dimethylamino)propyl)-3-ethylcarbodiimide hydrochloride (EDC) cross-linker.
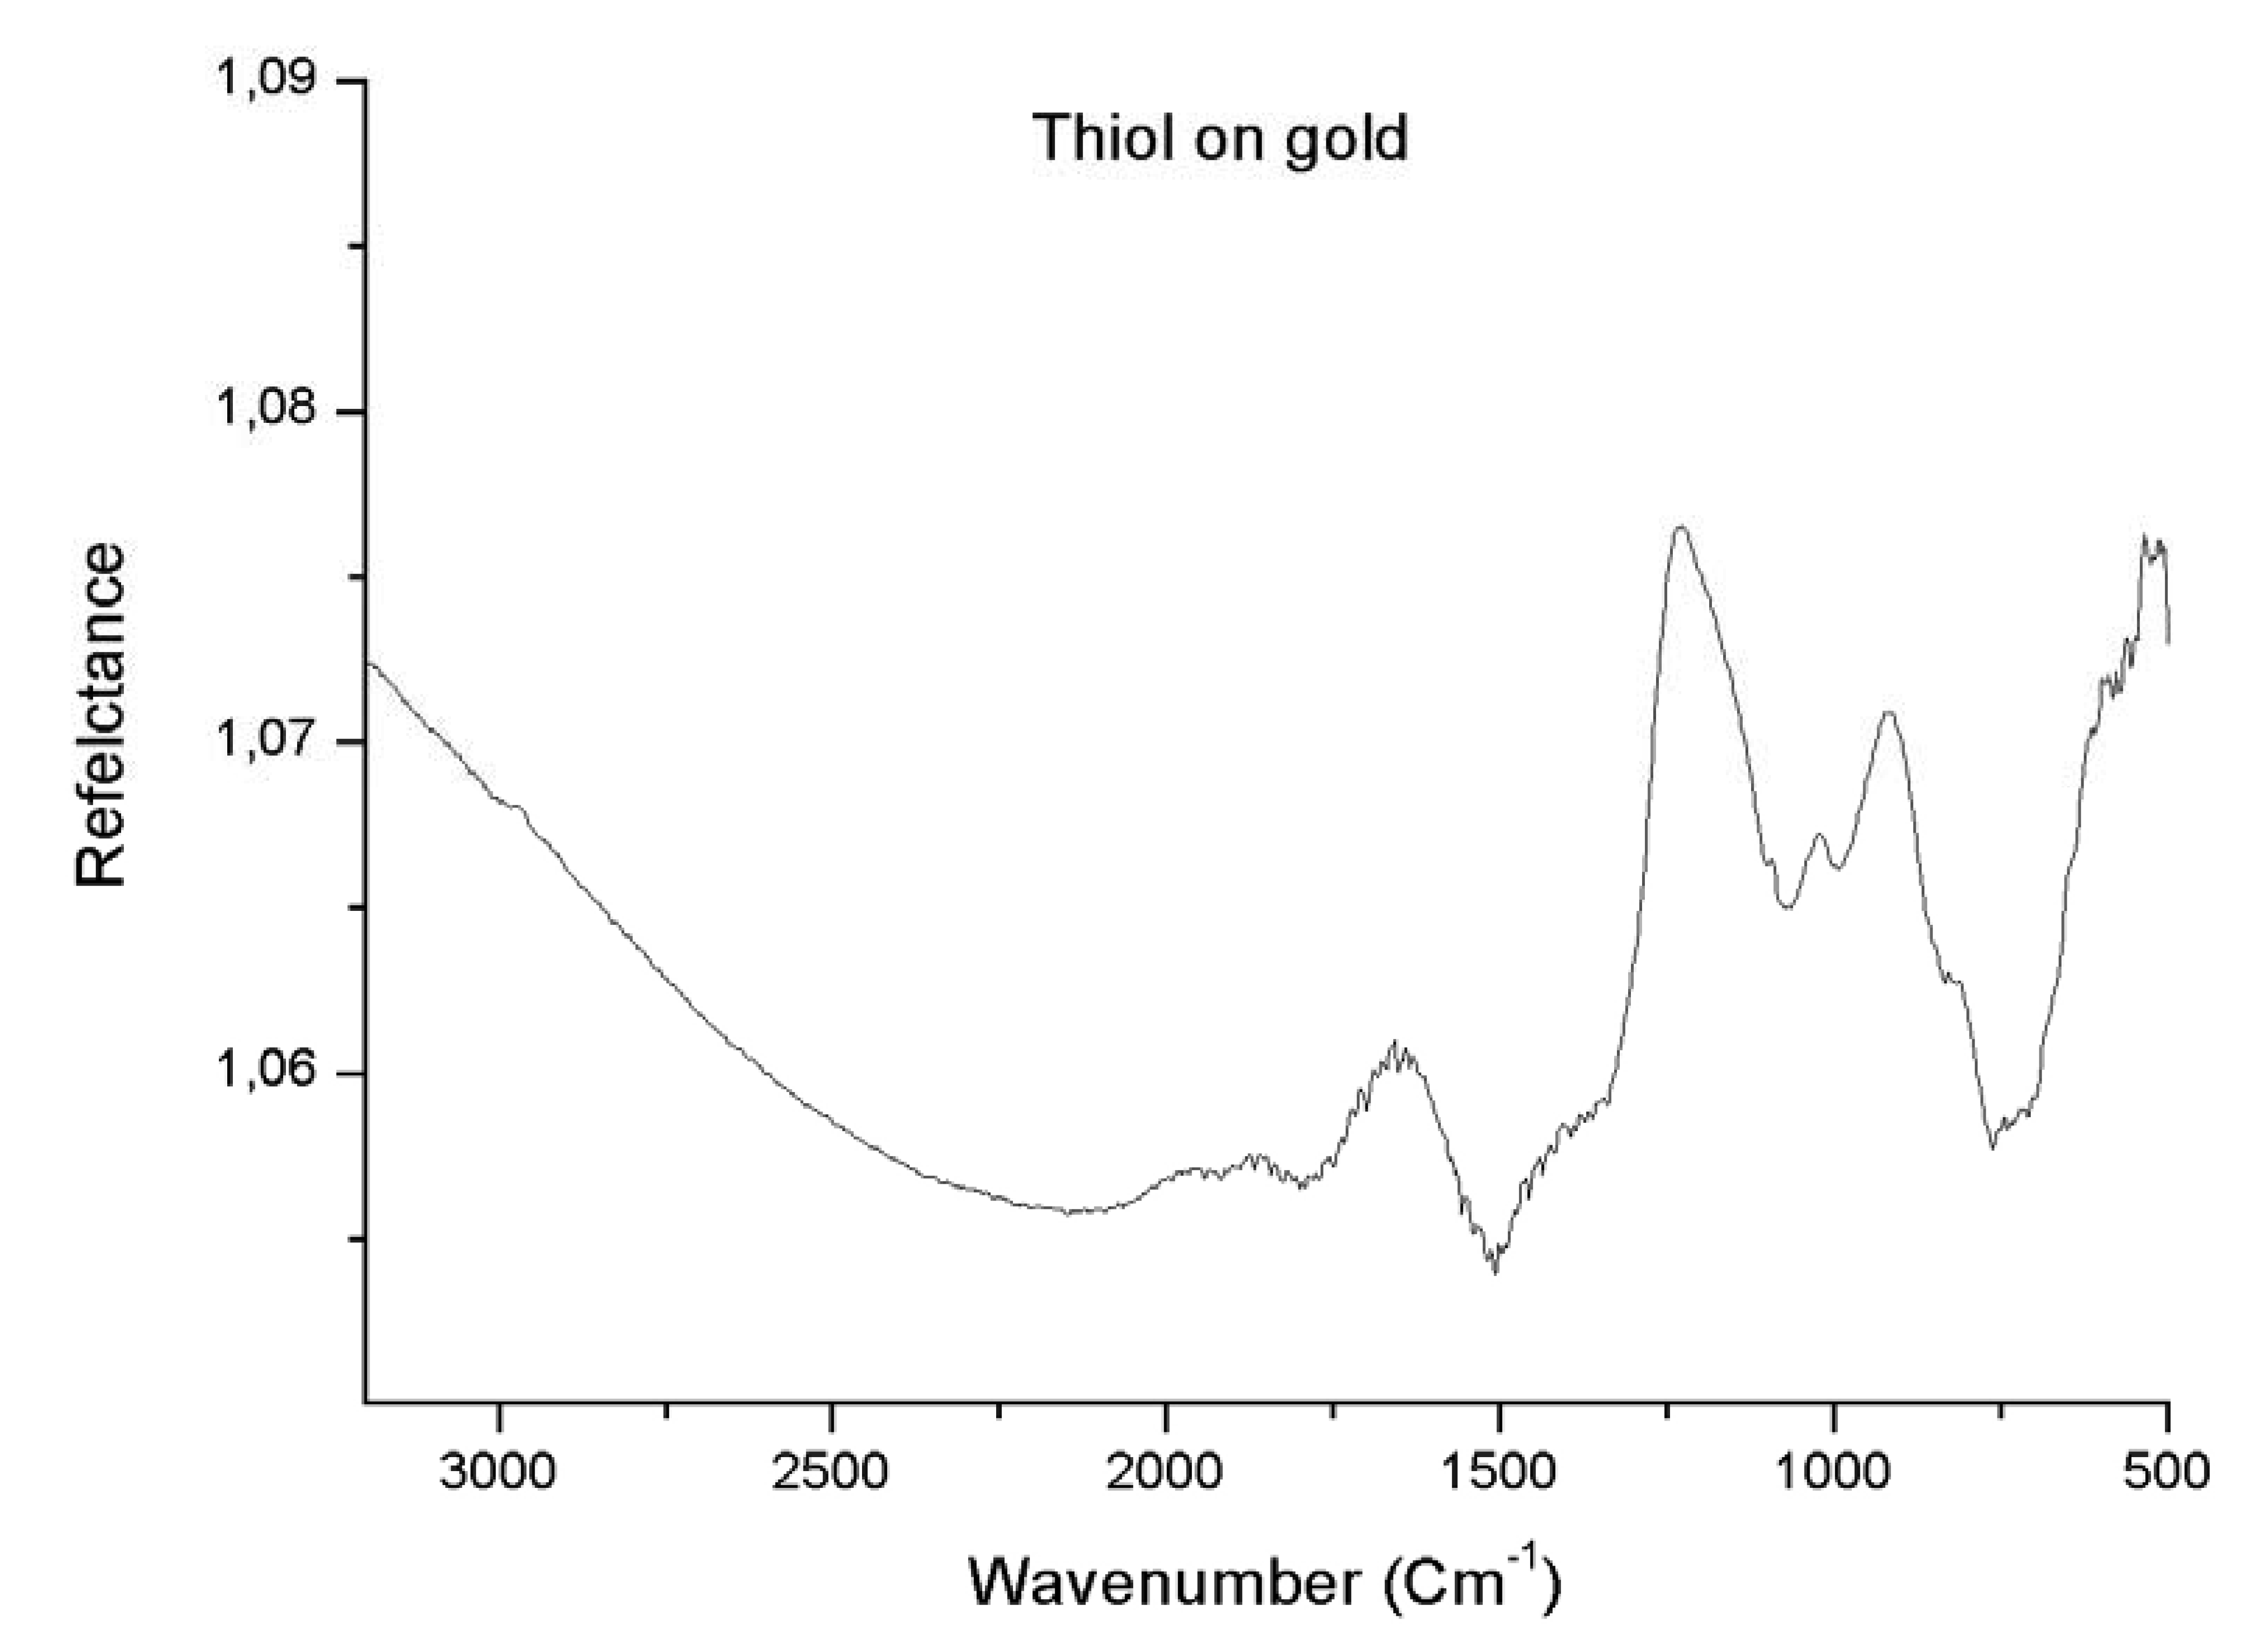
In this work, the cyclic voltammetry and impedance spectroscopy technique has been used to characterize the high dielectric properties of self-assembled monolayers on a quartz surface (gold). The high coverage area of the acidic thiols monolayer can be estimated with impedance spectroscopy using a redox couple. The vibration molecule frequencies of the thiol monolayer can be detected with infrared spectroscopy. The antibody can be coupled via NHS/EDC activation method. The nonspecific sites can be blocked with bovin serum albumine molecules. Different antigen concentrations can be detected with the quartz crystal microbalance.

Experiment

Materials

The following materials were obtained as indicated: 11-Mercaptoundecanoic acid (95%), N-hydroxysuccinimide (NHS), N'-(3-dimethylaminopropyl)-3-ethyl carbodiimide hydrocloride (EDC), anti-IgG rabbits, BSA (Bovine Serum Albumin), IgG (rabbit) and PBS (Phosphate Buffer Saline) are obtained from Sigma Aldrich (France). The Millipore water with specific resistance 18.2 MΩ.cm-1 was employed during all experiments. All solutions are degassed before use.

Passivation of the crystal surface

A typical QCM experiment begins with the cleaning of the crystal surface with a piranha solution (30% H2O2 and 70% concentration H2SO4). After being rinsed with deionised water, the crystal was dried over a stream of N2 gas. An UV-cleaning process for 5 minutes was used to scavenge hydrocarbons adsorbates. Next, the crystal was mounted in the QCM and impedance cell for reference measurements with flow-injection pump with PBS buffer. After that, the crystal was rinsed another time, and soaked in a 1 mM Mercaptoundecanoic acid solution (dissolved in ethanol) over night. The crystal was then, rinsed with ethanol and mounted onto the QCM and impedance cell for measurement with the same injection rate.

Activation with EDC/NHS

0.5 M NHS and 0.2 M EDC solution have been prepared in millipore water. The solutions were applied to the quartz by a micropipette (100 μl) before inserting it into the flow-injection pump. The crystal was kept 45 min. in contact with NHS/EDC solution. After reaction, the crystal was rinsed with PBS solution and mounted in the QCM cell for measurement.

Antibody immobilization

A solution of 5 μg/ml antibodies in acetic/acetate buffer (pH=5) was applied to the quartz by a micropipette (100 μl) for 1 hour. After that, the crystal was rinsed with 0.05% Tween 20 and with PBS solution.

BSA blocking layer

For unspecific interaction, the non-covered surface is blocked with a bovine serum albumine (BSA). A solution of 0.1% BSA was applied to the quartz by a micropipette (100 μl) for 30 min. After that, the crystal was rinsed with PBS.
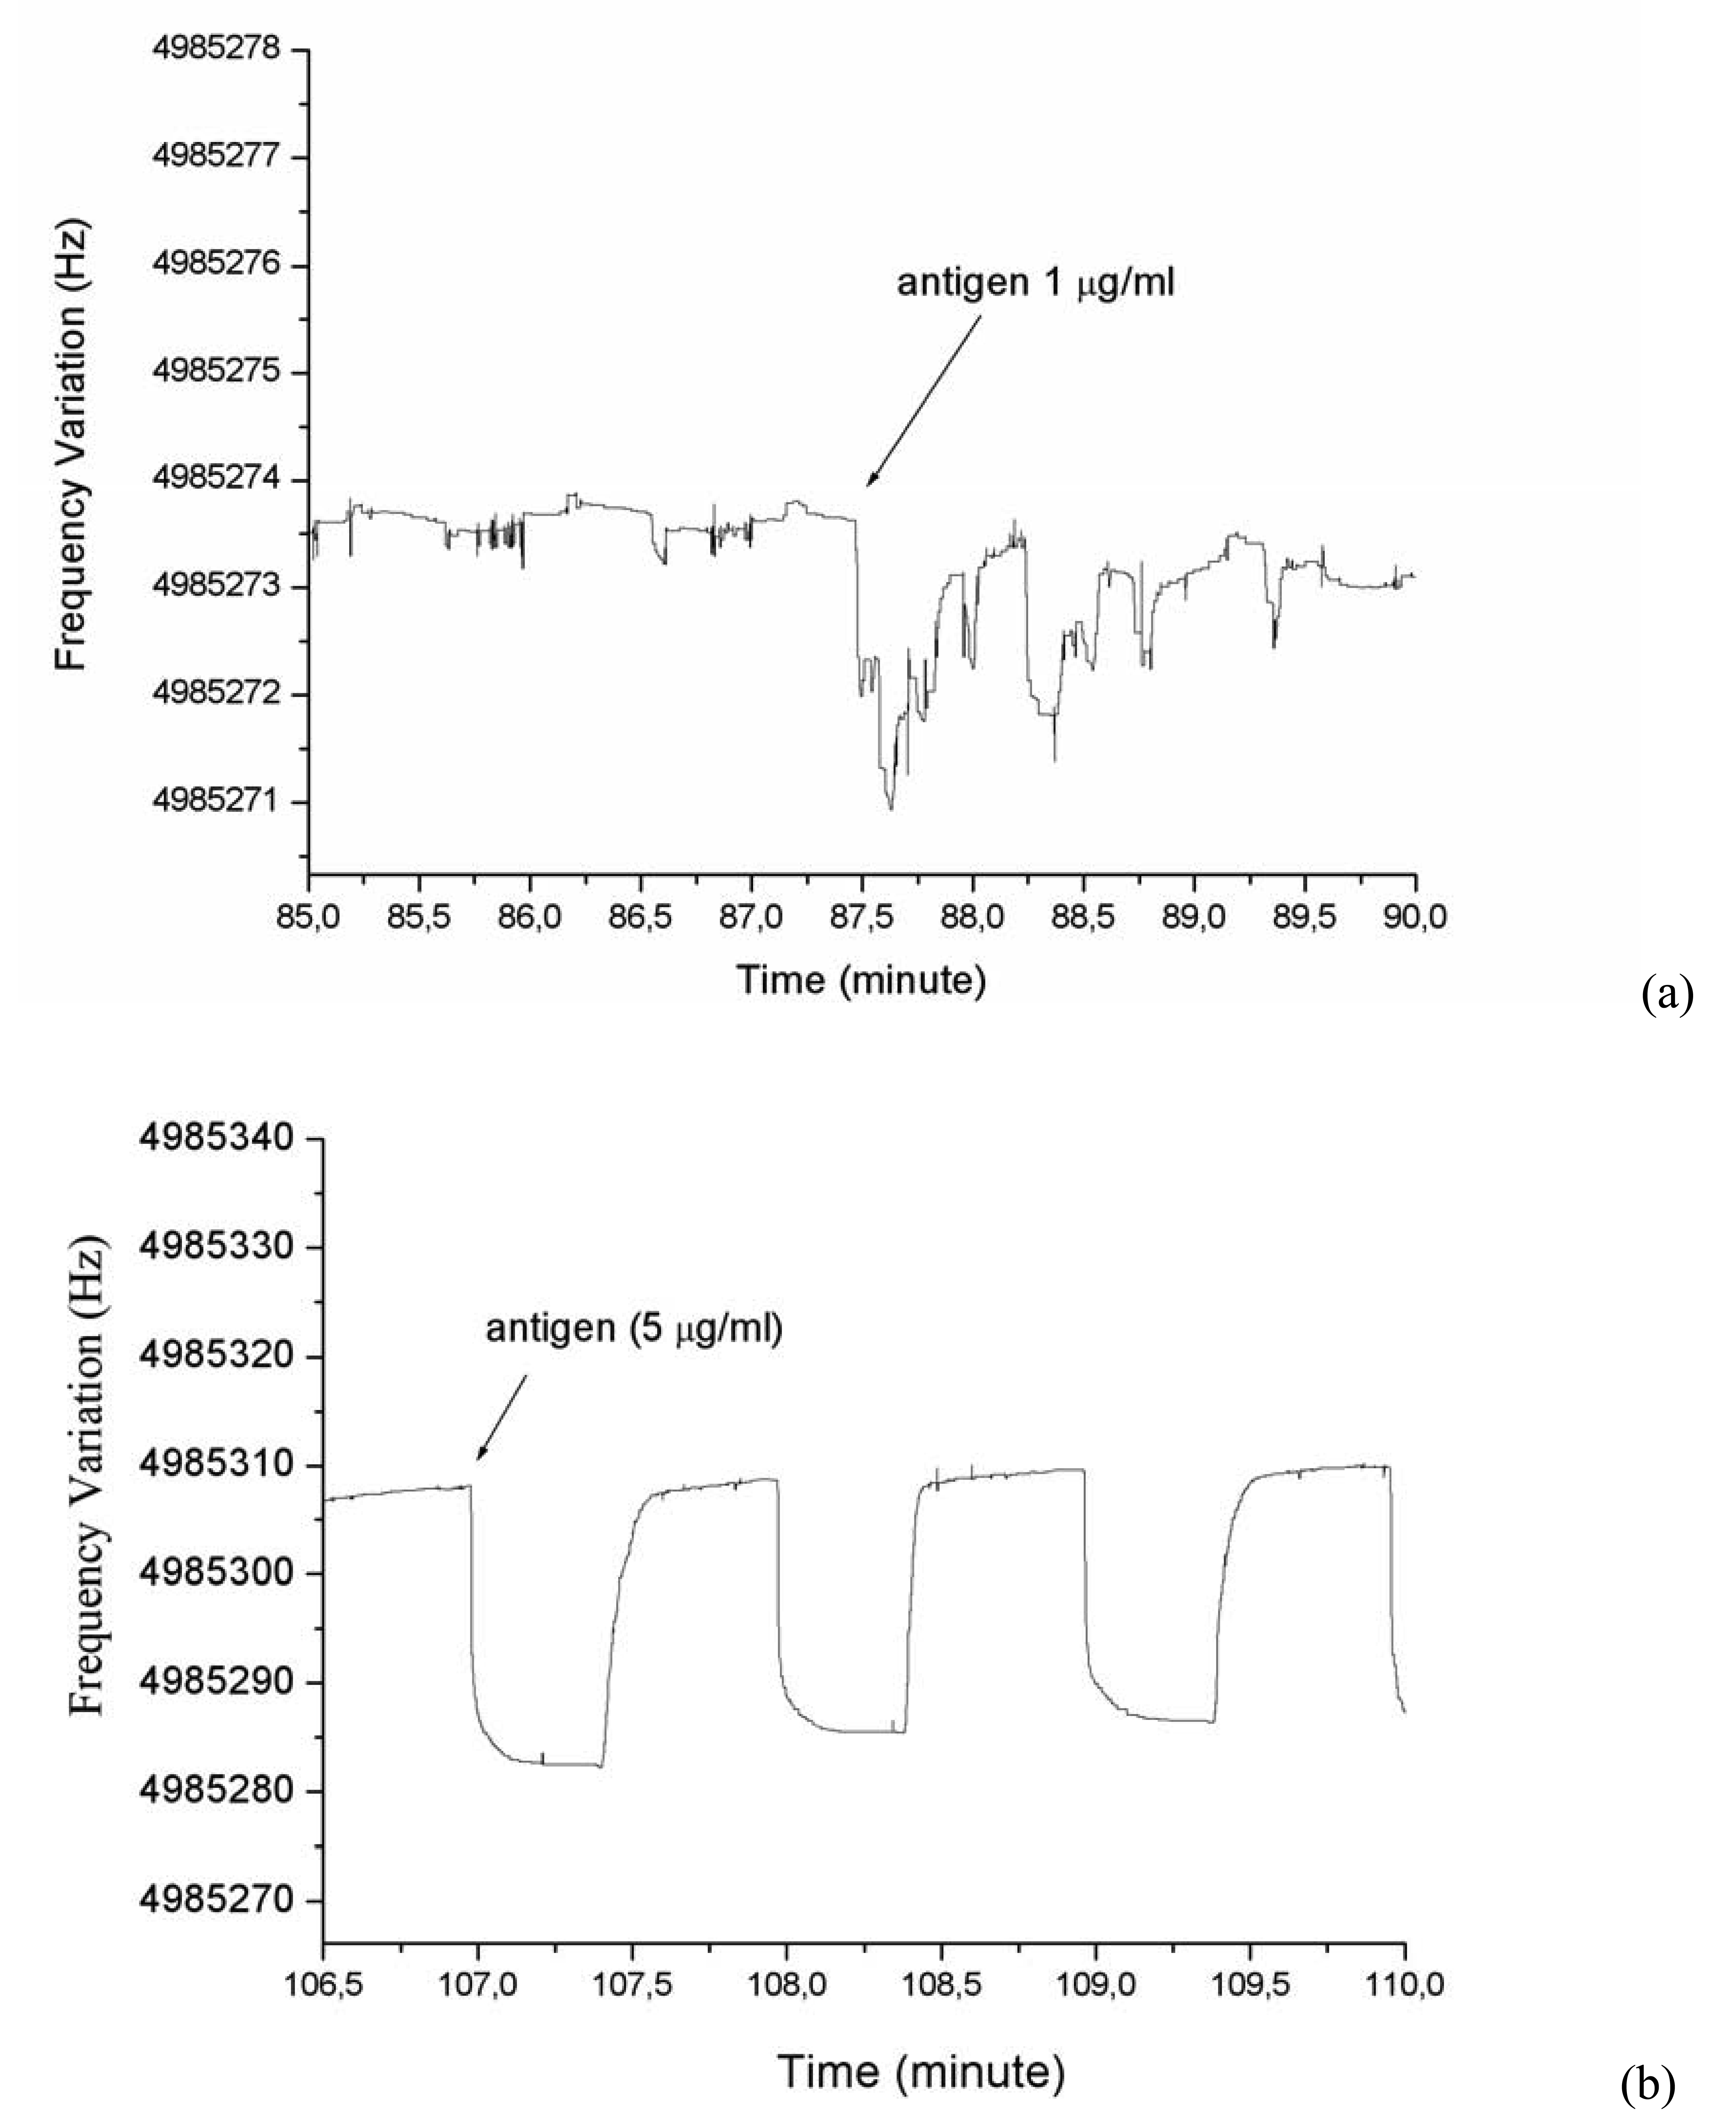
Antigen detection

Different antigen concentrations were prepared in PBS. The injections of antigen were applied with the pump and the frequency shift can be observed in real time.

Impedance spectroscopy

In a number of reports [
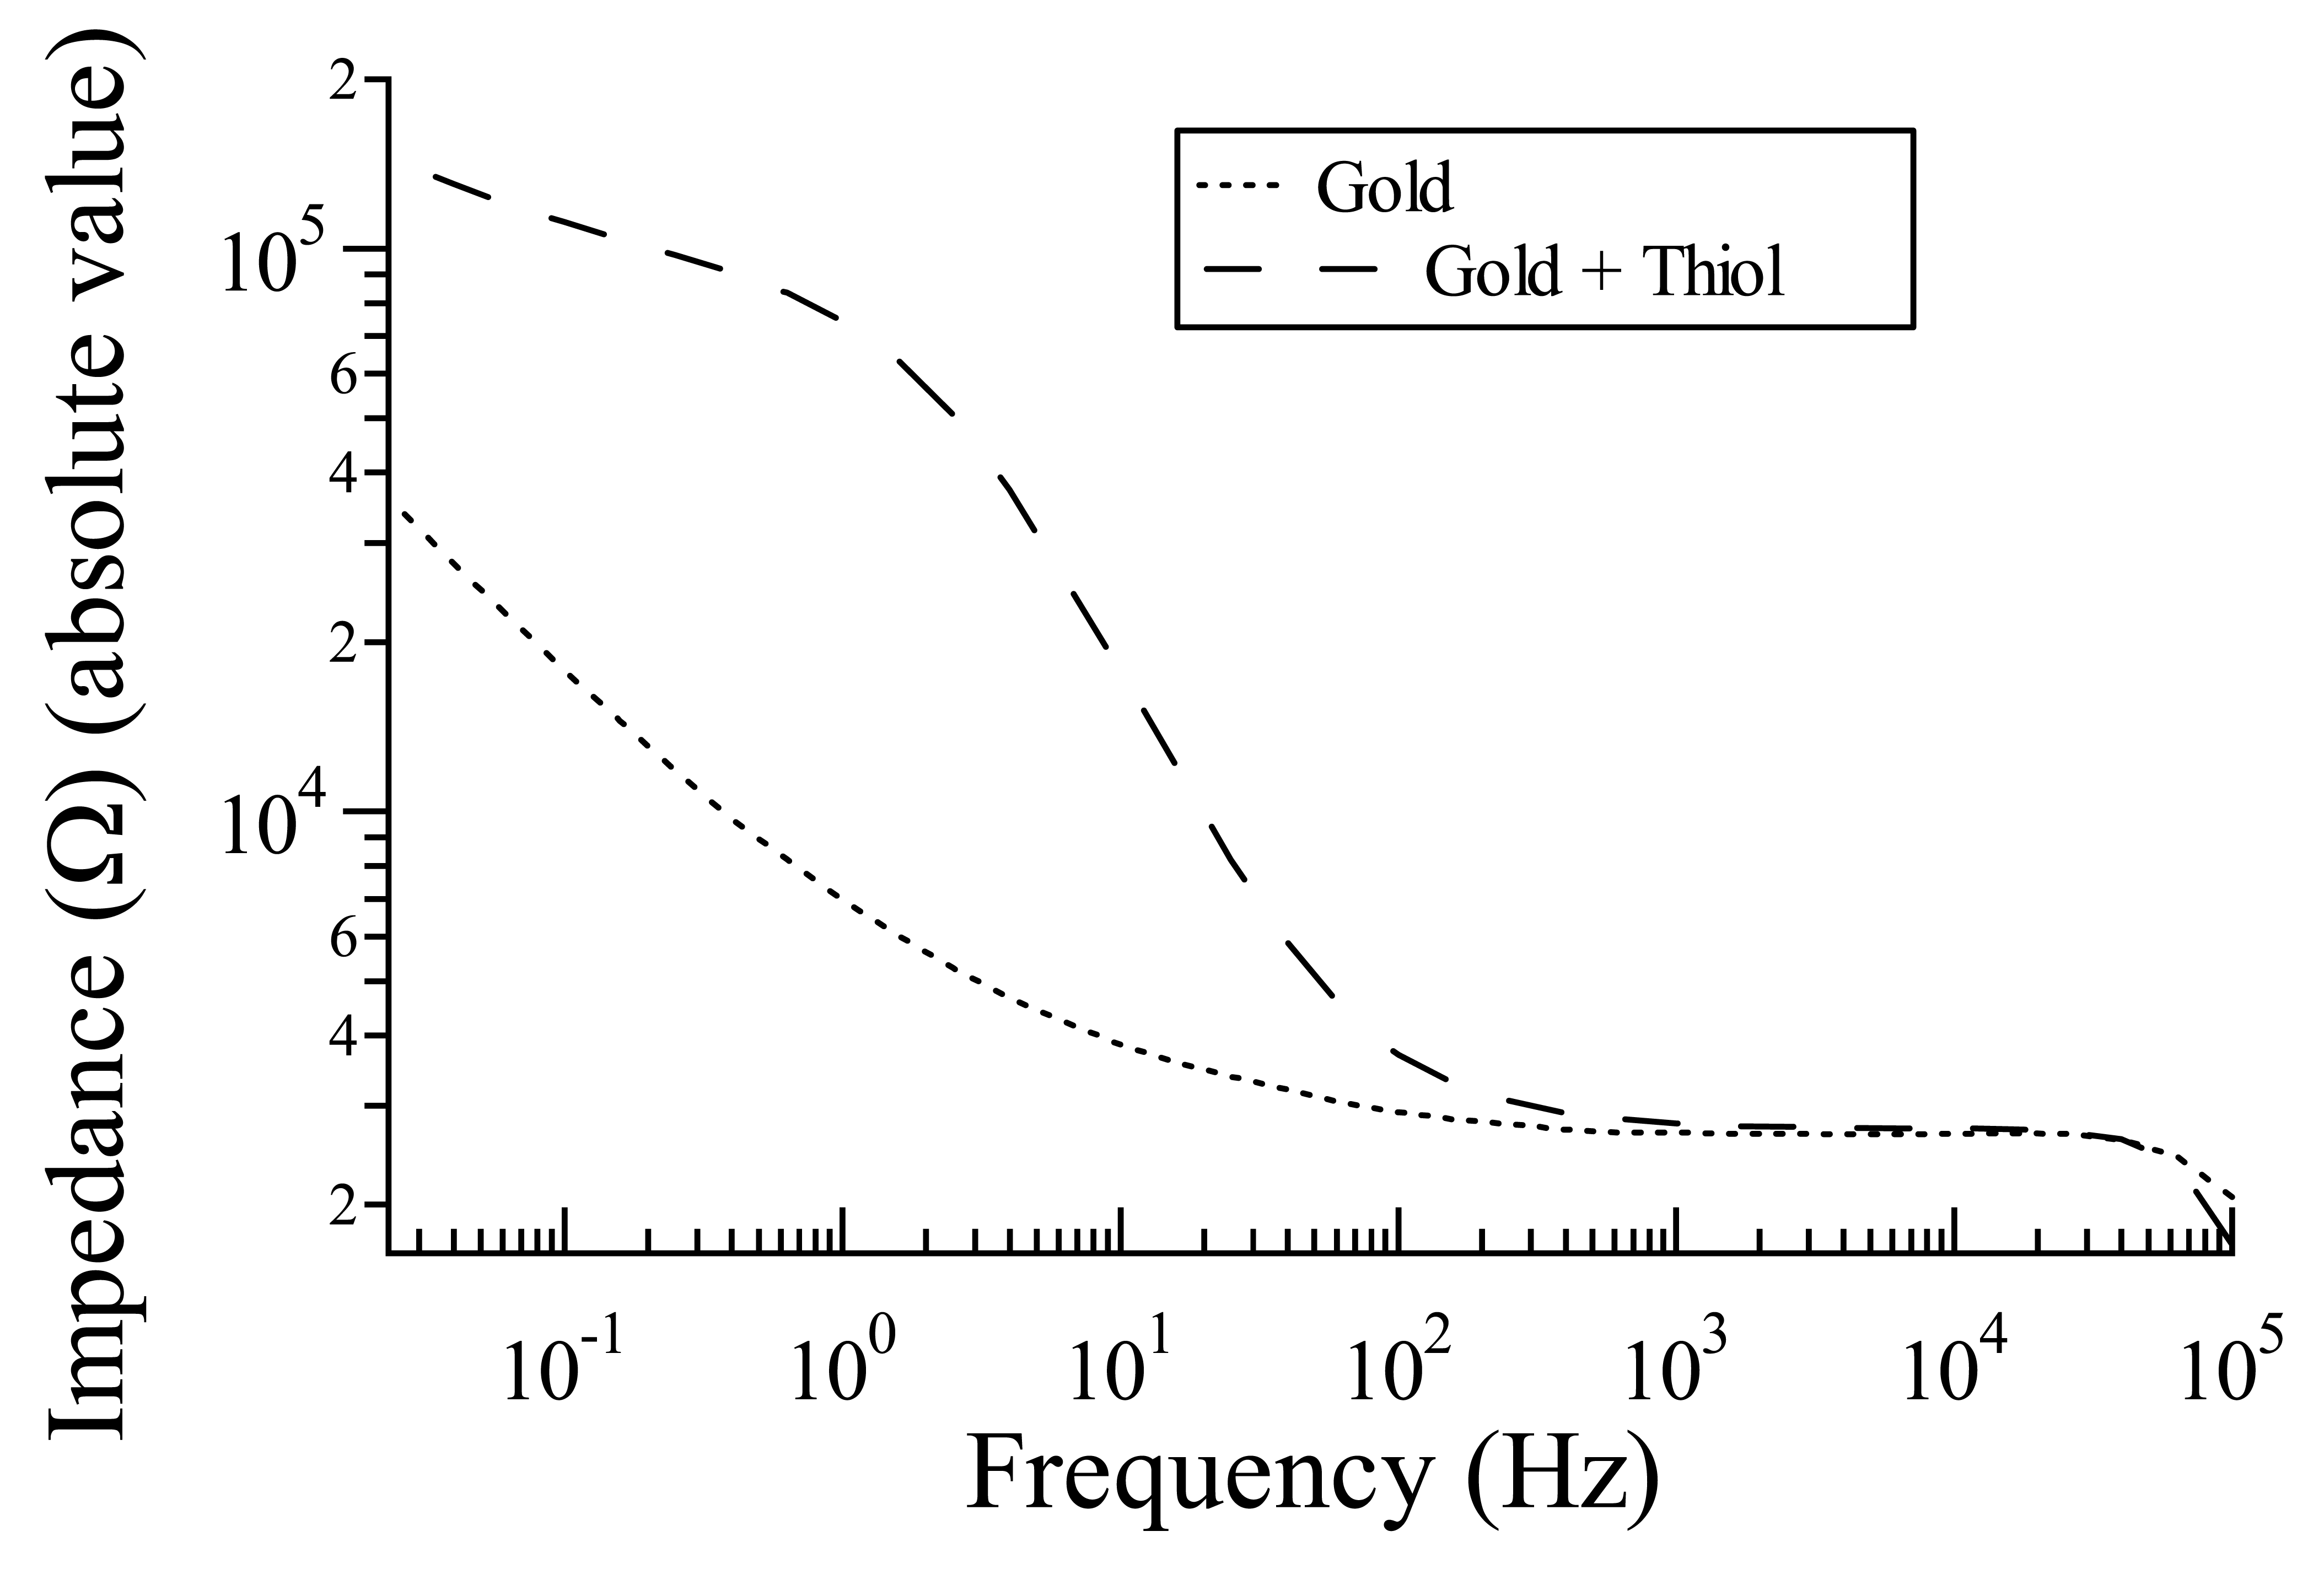
2-5] it has been shown that impedance spectroscopy is a useful tool to characterize the compactness of amphiphilic films on solid-state surfaces. A capacitor is formed between the conducting electrode and the electrolyte. The frequency-dependent capacitance C of the complex stratified surface is related to the absolute value of the complex electric impedance Z (measured in Ohms) by the equation:
| Z | = 1 2 π f C
where f is the frequency (in Hz) at which | Z | is measured.
The surface of the device with a supported film in contact with the aqueous phase exhibits a complex capacitance composed of at least three sub-layers. If the complex impedance Zi of the sub-layers i can be determined by analysis of the measured impedance in terms of an electrical equivalent circuit, the thickness of the sub-layers () can be determined according to equation:
d i = ε 0 ε i A C i
ε0 is the vaccum dielectric constant (8.85 ×10⁻¹⁴ F/cm2), ει is the dielectric constant of the layer i and A is the area of the surface. The impedance analysis was performed with the Voltalab 40 impedance analyzer. The impedance modulus |Z(ω)| is plotted versus frequency ω, which is sufficient for the discussion of impedance data. For analyzing the measured data, the second polar coordinate of the complex impedance φ(ω) is of course considered as well.
To fit the measured spectra with the impedance spectra out of ideal elements, the ideal elements have been replaced with the constant phase elements (CPE):
Z CPE = K ω α
The frequency exponent is α = 1 and K = 1/C for an ideal capacitance, and α = 0 and K = R for an ideal resistance, respectively. The exponent α could be obtained, when the membrane capacitance (or layer capacitance) was replaced by a constant phase element ZCPE. The deviation of the exponent α from the ideal values is attributed to the inhomogeneities of the analyzed layer, like defects or roughness. The measured spectra of the impedance and phase were analyzed in terms of electrical equivalent circuits using an Apple Macintosh and the analysis program IGOR (Wavemetrics, OR). The mathematical expressions of the equivalent circuit models were fitted to the data in terms of the logarithm of the absolute value of the impedance Z(ω)and the phase φ(ω) by user-defined functions. The electric parameters of the system were calculated with the computer program and the fit error was kept under a maximum of 10%.
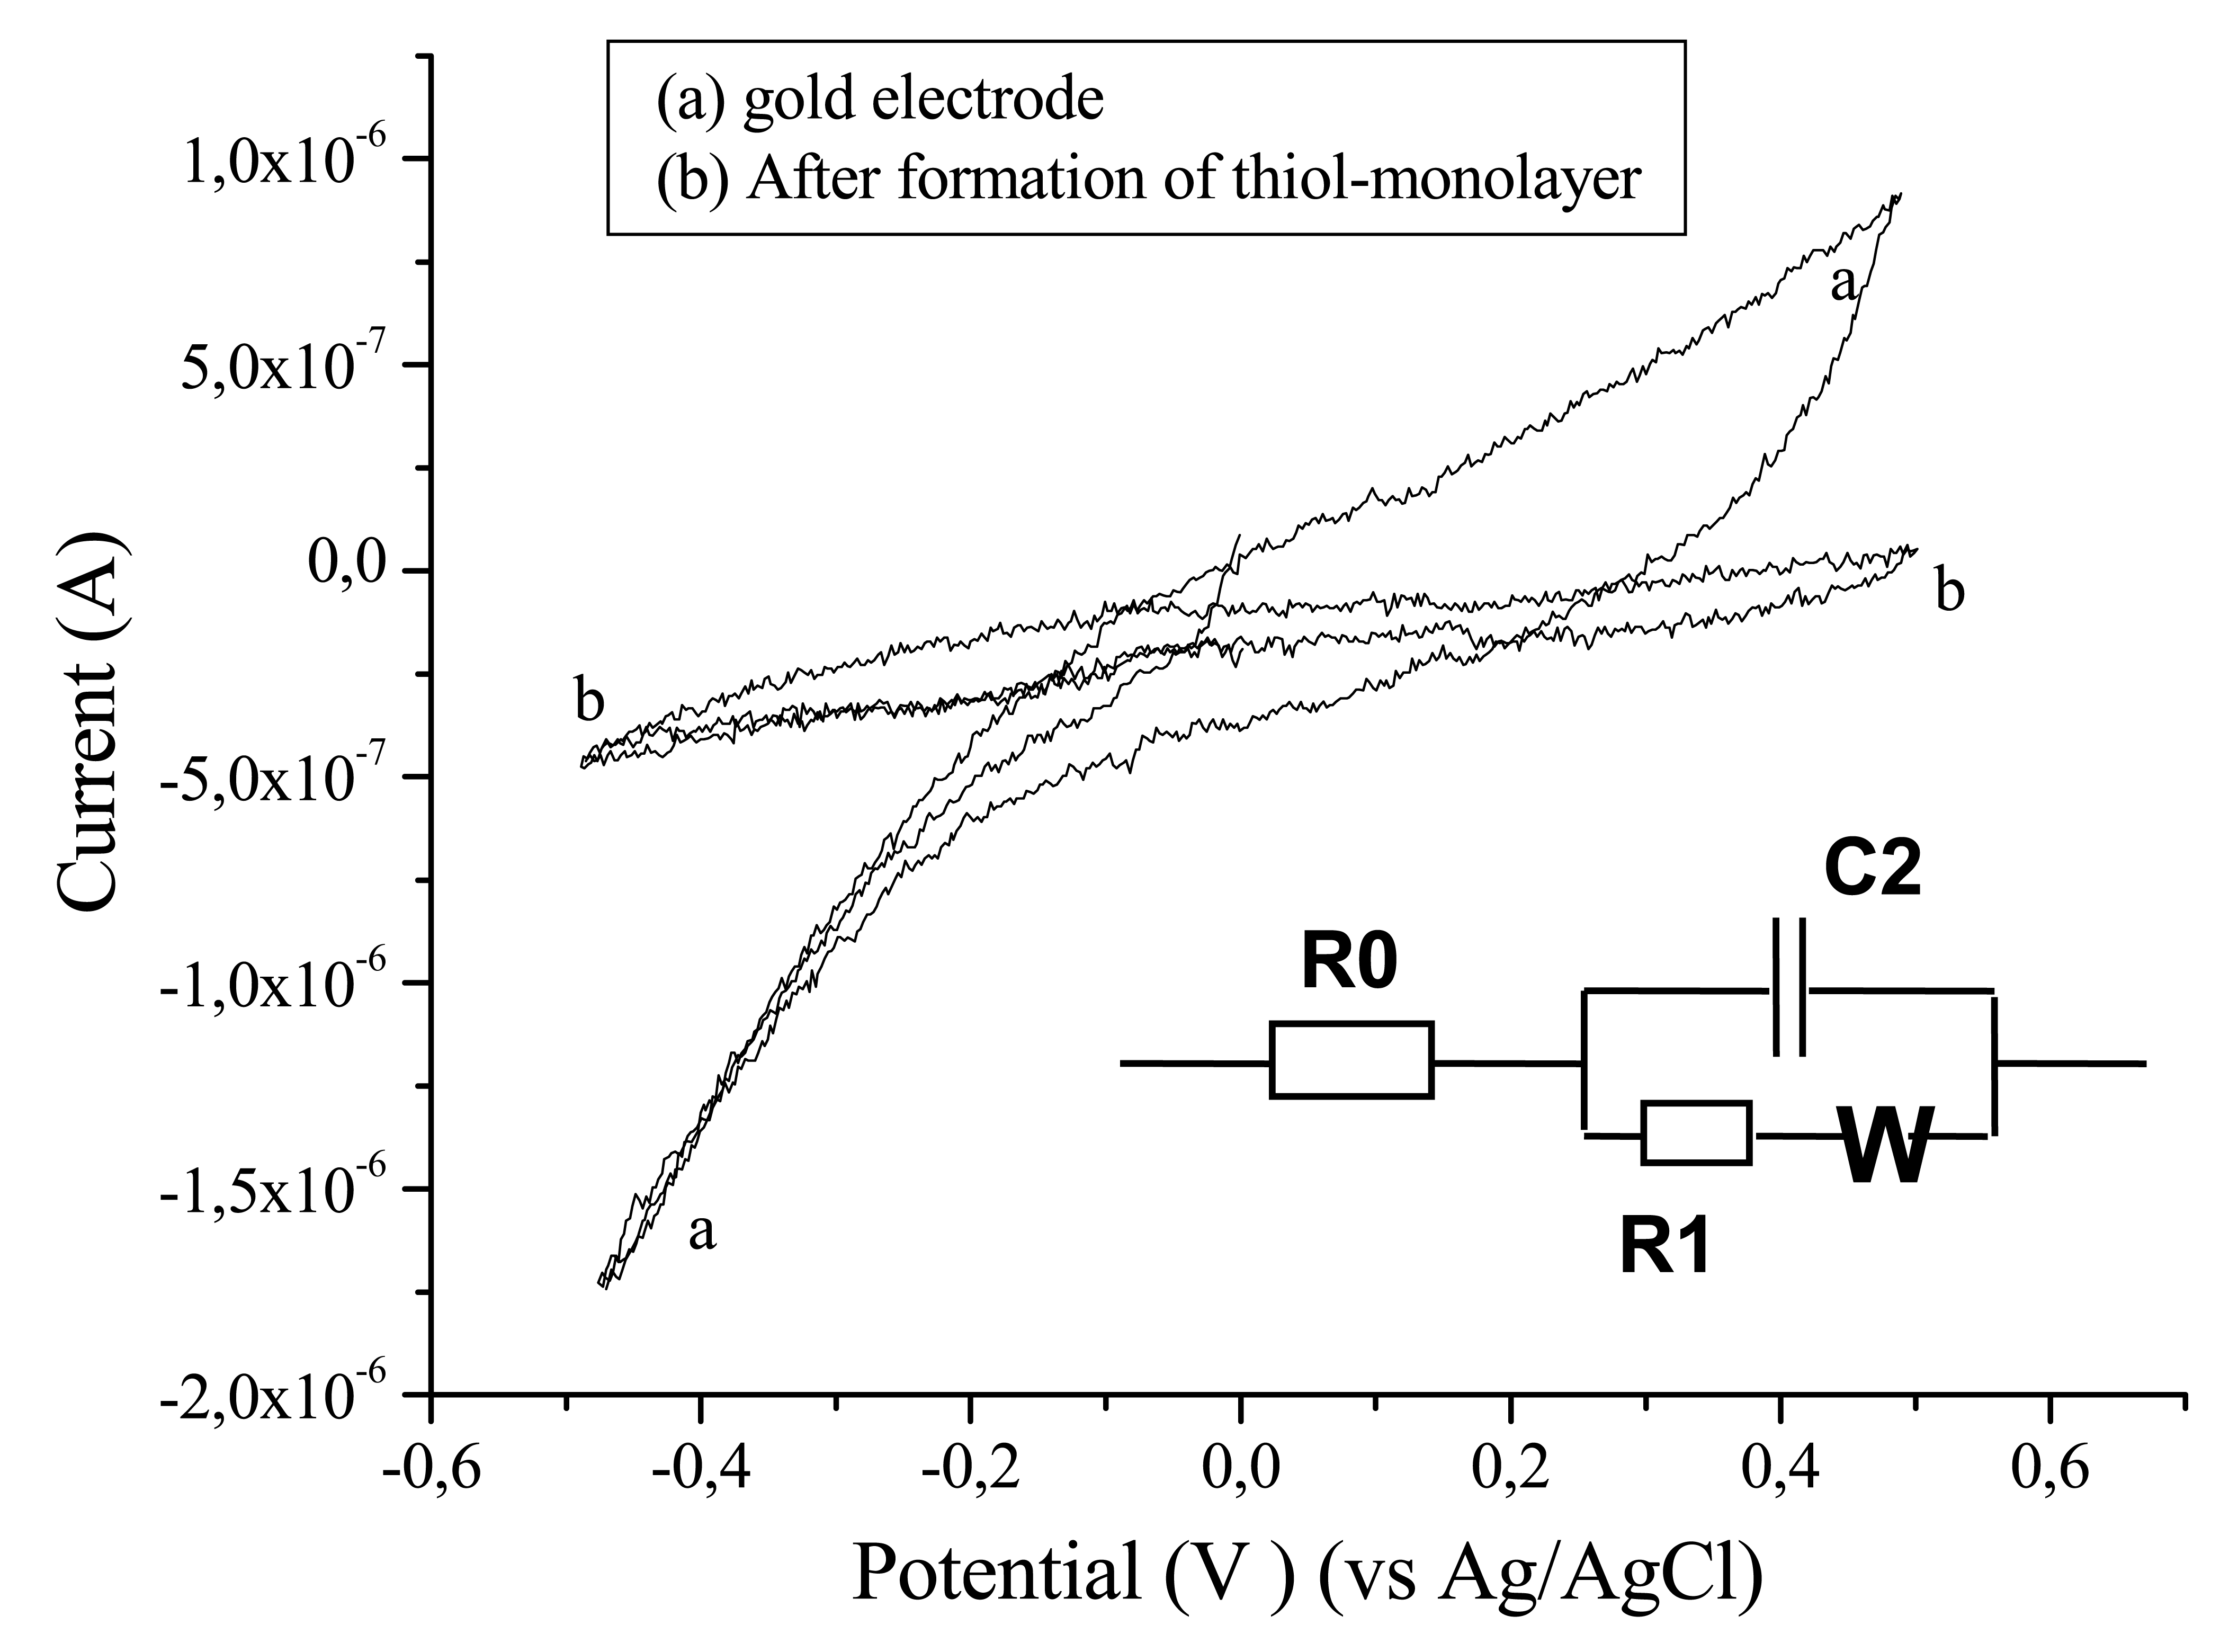
The electrochemical cell (Voltalab 40, Radiometer Analytical, Lyon, France) consisted of a conventional three-electrode configuration with a platinum counter electrode and a Ag/AgCl reference electrode. For the I/V measurements, the potential was stepped from −0.6 V to 0.6 V with a rate of 25 mV/s. The percentage of coverage rate of the thiol monolayer can be estimated by impedance measurements with a redox couple at 0 V. All the experiments were performed in obscurity and in a Faraday box.

Quartz crystal microbalance theory

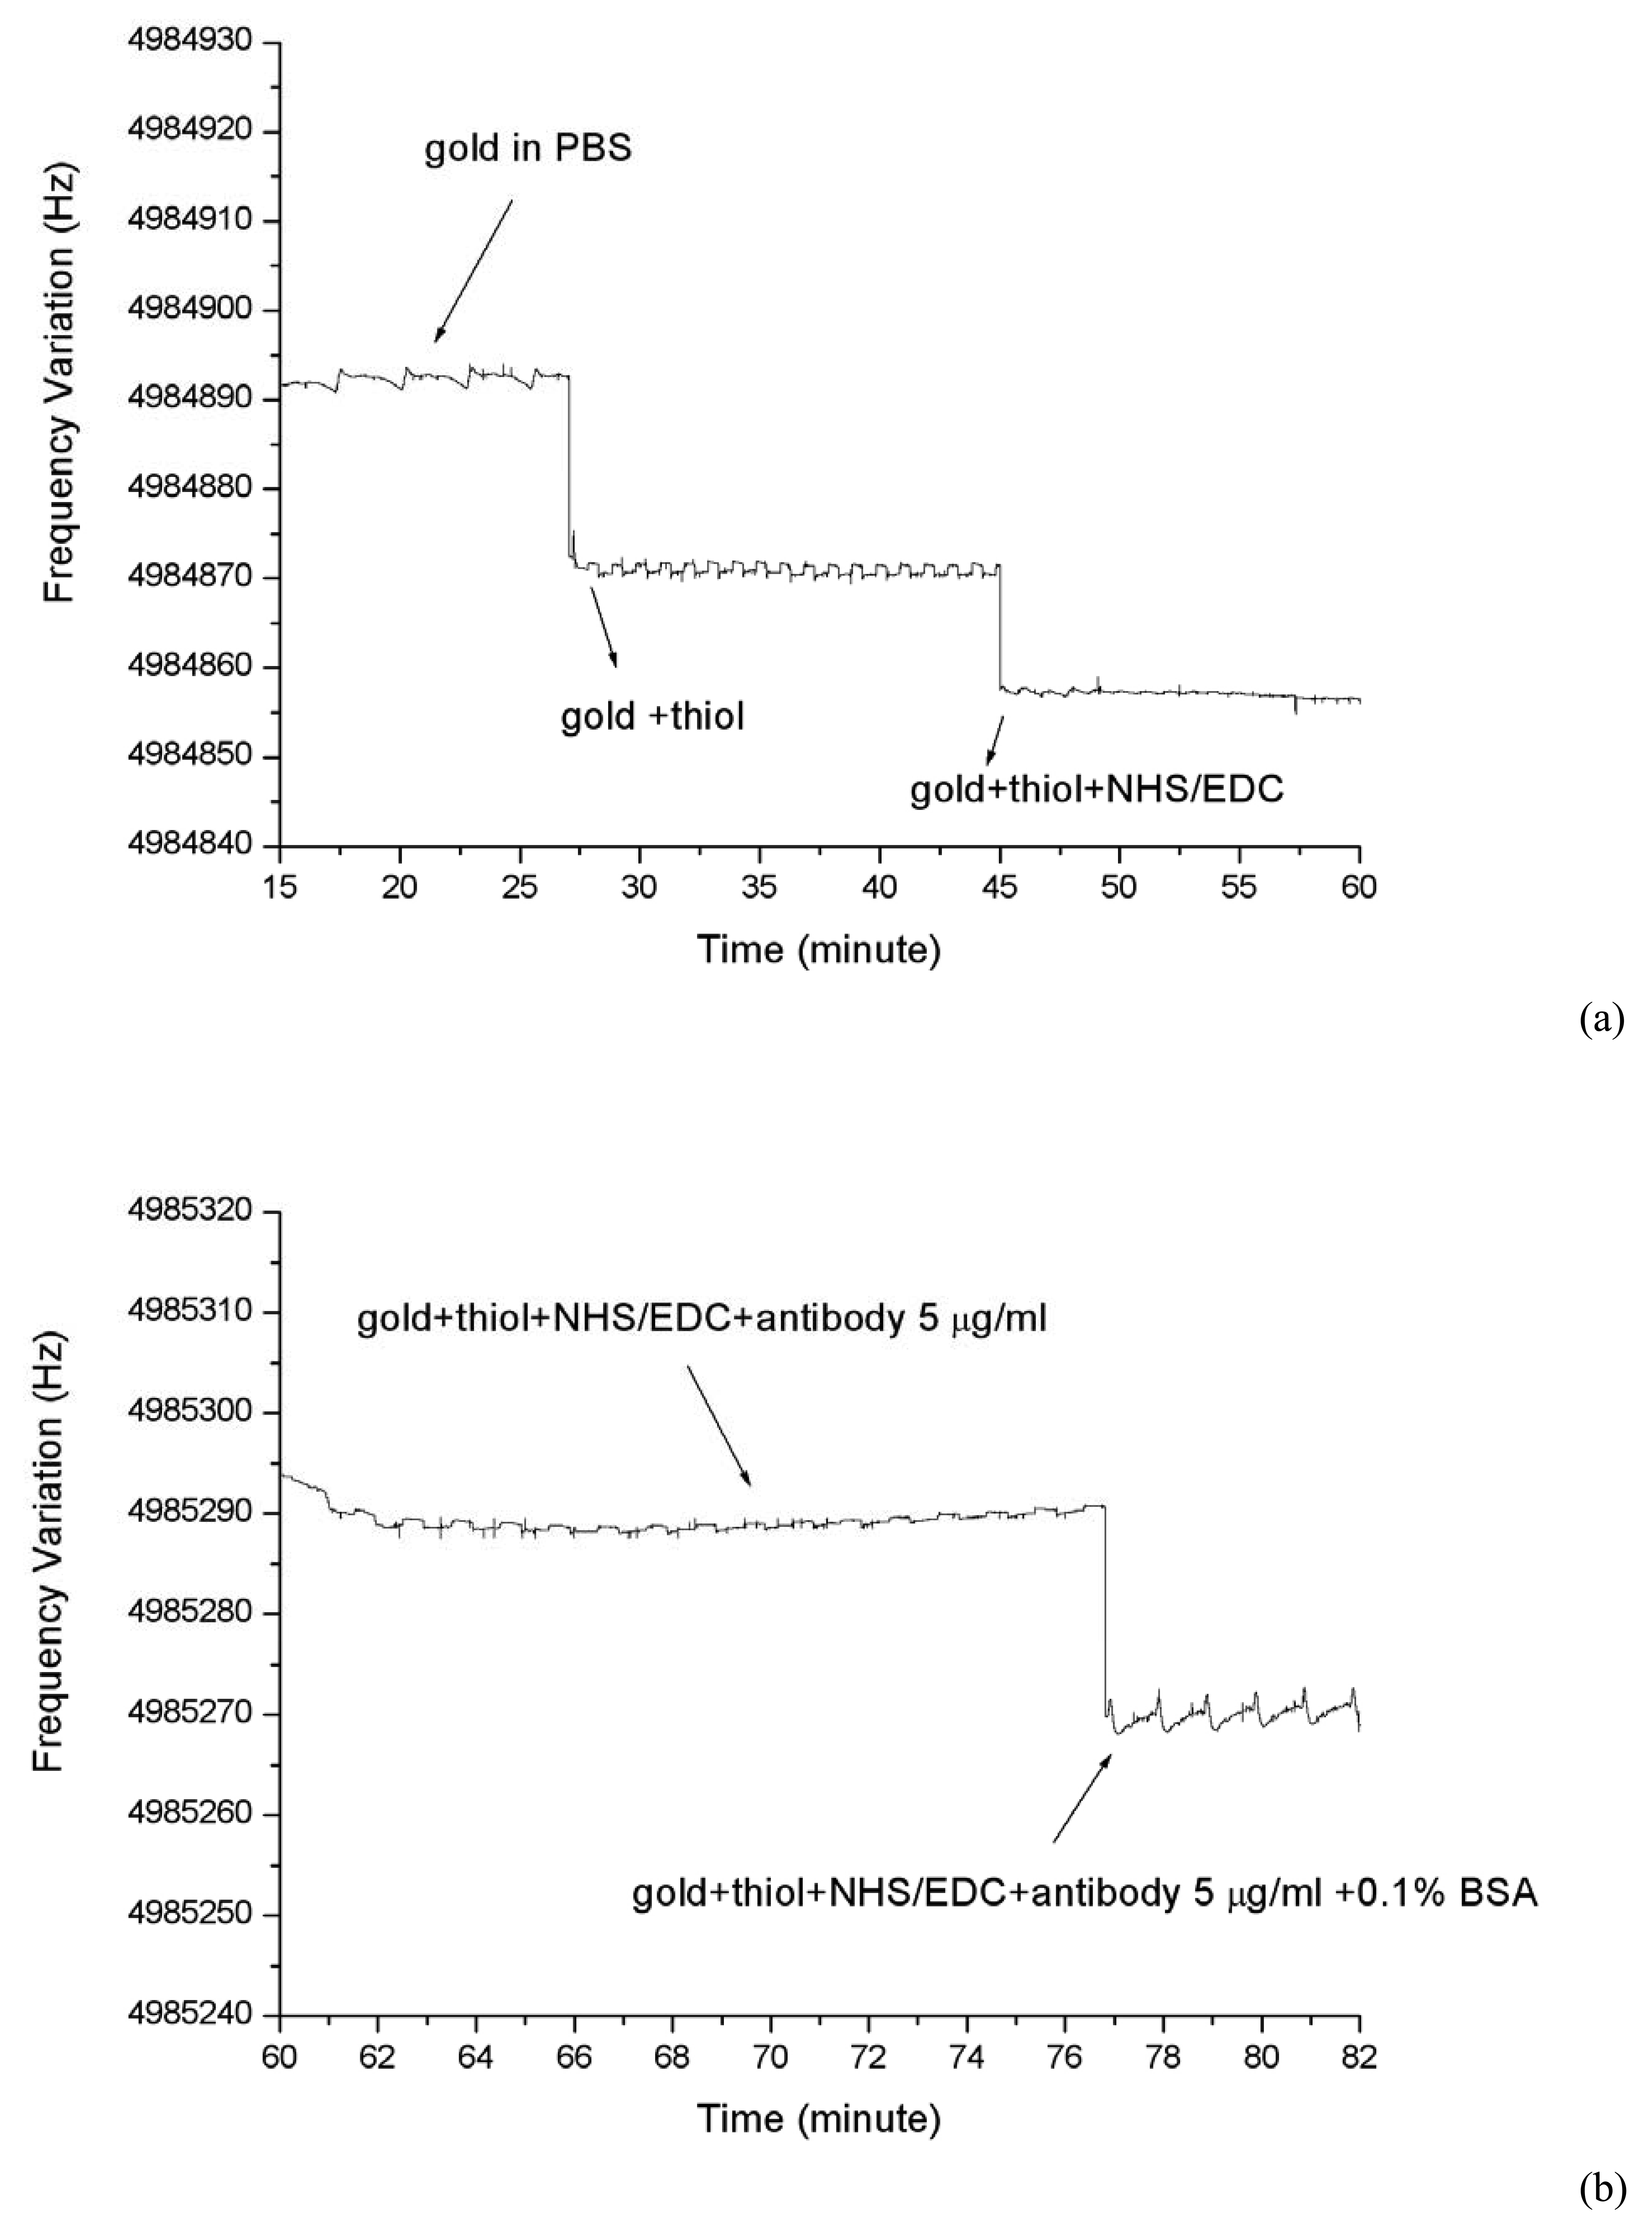
The Quartz Crystal Microbalance (QCM) technique can be used to detect low amounts of biological or chemical substances via mass accumulation; this therefore, represents a promising transducing mechanism for immuno-biosensors [6-10]. The use of QCM transducer offers an in-situ sensitive detection without the need for optical or redox indicators. This technique is based on the simple relation between the frequency shift (Δf) of the quartz crystal resonator and changes of its mass per unit surface area (Δm), which is given by the Sauerbrey equation:
Δ f = 2 f 0 2 A ( μ q ρ q ) 1 / 2 Δ m
Where μq and ρq are the shear modulus and the density of the quartz (2.95 1011 dyne/cm2 and 2.65 g/cm3, respectively), f0 the fundamental oscillation frequency of the dry crystal and Δm is the mass of the material adsorbed on the surface per unit/area. Some factors can influence the oscillation frequency, like the thickness, the density and the shear modulus of the quartz that are constant, and the physical parameters of the adjacent media (density or viscosity of liquid). As differences in viscosity between running buffer and sample (like millipore water for NHS/EDC deposition or acetic/acetate buffer for antibody deposition), it is important to separate each frequency variation signal.
The quartz crystal employed in this study was commercially available, they are AT-cut type (diameter 25.1 mm) with Au electrodes on both sides (12.25 mm; 6.25 mm diameter; 1.17 cm2 area) and the resonance frequency was equal to 5 MHz. The crystal frequency was monitored by a Maxtech PM710, which was connected to a computer. The one-side-sealed piezoelectric quartz crystal was set in side of a glass flow cell (1 ml volume). Water passed over the crystal at a flow rate of 30 μl/min with a pump.

Fourier-transformed infrared spectroscopy

FTIR spectra were obtained with a Brucker IFS66V/S spectrometer equipped with MIR (Middle Infrared) source, DTGS detector and KBr separating mirror. All spectra were collected with 32 scans for the reference and the sample, with 4 cm-1 resolution in the reflection mode. This method is very simple; first the spectrum of the crystal substrate after the cleaning procedure is recorded as a reference and then, that of the crystal with thiol as a sample. The ratio of the second one and the first one gives the spectrum of the thiol monolayers on the modified crystal.

Results and Discussions

Electrochemical characterization of the self-assembled monolayers

Figure 1 shows the cyclic voltammogram of the fresh gold electrode before and after thiol deposition in PBS at pH = 7.5. There are two processes which take place, one in positive bias (oxidation of gold surface) and the second one in a negative bias (reduction of gold surface). The oxidation reaction at the interface has been reduced after thiol deposition and no reduction takes place. This confirms the high insulating properties of the thin layer of thiol to prevent the oxydo-reduction of the gold surface. The percentage of the coverage area can be estimated with impedance spectroscopy with Fe3+/Fe4+ redox couple.
The impedance spectra of the crystal substrate before and after the deposition of the thiol monolayer are represented in Figure 2. The impedance spectra should be fitted using the model equivalent circuit presented in Figure 1. The capacitance C2 is the double layer capacitance of the gold/electrolyte interface, R1 is the charge transfer resistance in the low frequency range and Z(W) is the impedance due to the mass transfer of the redox species to the electrode described by Warburg. The resistance in the high frequency range R0 is the resistance of the electrolyte, the contacts and connections.
The values of the capacitance C2 equal to 4×10⁻⁵ F/cm2 (α =0.98), the resistance R1 equal to 100 Ω/cm2, the resistance R0 equal to 500 Ω/cm2 and the Warburg impedance equal to 8500 Ω/cm2 can be obtained with the fitting program.
The impedance spectrum of the gold/thiol/electrolyte interface should be fitted using the same electric model as presented in Figure 1. The deposition of the monolayer led to a significant increase in the charge transfer resistance, R1 = 2000 Ω/cm2 and a decrease in the capacity C2 = 2×10⁻⁵ F/cm2. These values have been obtained with a good reproductibility with the fitting program. From the measured value of the charge transfer resistance before and after the thiol deposition, one can estimate the percentage of covered area (1-θ) of the thiol, which can be described as:
1 θ = R 2 before thiol deposition R 2 after thiol deposition
We calculated the ratio and obtained (1-θ) = 95%, which is a high coverge area.

FTIR

Figure 3 shows the FTIR spectrum of the thiol monolayer between 500 and 3000 cm-1. The formation of a covalent gold-sulfur bond has been proven by the presence of the large band in the range of 500 to 750 cm-1. This large band is assigned to stretch the mode of C-S groups. The peak at 950 and 1450 cm-1 corresponds to the O-H deformation mode and methyl antisymmetric bending mode. Another band appears at 1700 cm-1, this band correspond to C=O stretch vibration mode. The peak observed at 1310 cm-1 is assigned to the C-H scissors vibration mode. Finally, a small main band at 2900-2950 cm-1 is clearly observed in the high frequency region. This is assigned to the vibration mode of alkyl thiol chains.

Quartz crystal microbalance

Figure. 4(a) shows the decrease of the resonance frequency of the quartz due to the adsorption of the thiol monolayer and NHS/EDC cross-linker. The adsorption of thiol induces a shift in the frequency of about 20 Hz, but for NHS/EDC the shift is about 15 Hz. The deposition of antibody was made without recording the frequency variation as it was avoided a variation in the frequency due to the difference in viscosity of the acetic/acetate buffer with the running buffer PBS. The adsorption of 0.1% BSA molecules induce a frequency shift of about 25 Hz, which is normal as these molecule are rather big (Figure 4(b)).

Biosensor application

Figure 5 shows the frequency shift of the quartz for two different antigen concentrations injected with the pump. The range of applicable concentrations depends on the binding constant and on the sensitivity of the QCM. Suspensions of 1 μg/ml and 5 μg/ml antigen give reasonable signals. (One should start with low concentrations and then, inject higher concentrations). One can see in these curves the association and the dissociation kinetics of the antibody-antigen couple. The injections of 1 μg/ml and 5 μg/ml antigen induce a frequeny shift of about 3 Hz and 23 Hz, respectively.

Conclusions

A robust biosensor based on quartz crystal microbalance technique for antigen detection with functionalized crystal surface by self-assembled monolayer technique has been developed. The high insulating properties of the thiol monolayer have been characterized with cyclic volatmmetry and impedance spectroscopy. For future work, other biomolecules will be used and the association and dissociation constant can be determined.

Acknowledgments

The authors thank the Alexander-Von-Humboldt Foundation (Germany) for the material donation.

References

  1. Weetall, H.H.; Lee, M. J. Antibodies immobilized on inorganic supports. Applied Biochemistry and Biotechnology 1989, 22, 311. [Google Scholar]
  2. Wiegand. Fundamental principles of the electric properties of supported lipid membranes investigated by advanced methods of impedance spectroscopy. Ph.D thesis, Technische Universität of München, Germany, 1999. Shaker Verlag, ISBN 3-8265-7231-9. [Google Scholar]
  3. Hillebrandt, H.; Abdelghani, A.; Abdelghani-Jacquin, C.; Aepfelbacher, M.; Sackmann, E. Electrical and optical characterization of thrombin-induced permeability of cultured endothelial cell monolayers on semiconductor electrode arrays. Appl. Phys. A 2001, 73, 539. [Google Scholar]
  4. Ben Ali, M.; Abdelghani, A.; Ben Ouada, H.; Jaffrezic-Renault, N. Optical and electrochemical studies of Thiacalix[4]arene film supported on Si/SiO2 for ion-sensitive sensors. Materials Science and Engineering C 2002, 21, 29. [Google Scholar]
  5. Abdelghani, A.; Hleli, S.; Cherif, K. Optical and electrochemical characterisation of self assembled Octadecyltrichlorosilane on modified silicon electrodes. Materials Letters 2002, 6, 1064. [Google Scholar]
  6. Köβlinger, C.; Uttenthaler, E.; Brink, G.; Sackmann, E. Comparaison of the QCM and the SPR method for surface studies and immunological applications. Sensors and Actuators B 1995, 24-25, 107. [Google Scholar]
  7. Wang, J.; Jiang, M.; Palecek, E. Real-time monitoring of enzymatic cleavage of nucleic acids using a quartz crystal microbalance. Bioelectrochemistry and Bioenergetics 1999, 48, 477. [Google Scholar]
Figure 1. Cyclic voltammetry of the fresh gold electrode before (a) and after (b) thiol deposition in PBS at pH=7.5.
Sensors 04 00105f1
Figure 2. Impedance spectra of the crystal substrate before and after the deposition of the thiol monolayer.
Sensors 04 00105f2
Figure 3. FTIR spectrum of the thiol monolayer between 500 - 3000 cm-1.
Sensors 04 00105f3
Figure 4. a) Decrease of the resonance frequency of the quartz due to the adsorption of thiol monolayer and NHS/EDC cross-linker. b) Decrease of the resonance frequency of the quartz due to the adsorption of 0.1% BSA molecules.
Sensors 04 00105f4
Figure 5. a) Frequency shift of the quartz for 1 μg/ml antigen. b) Frequency shift of the quartz for 5 μg/ml antigen.
Sensors 04 00105f5

