Study of Influencing Factors of Dynamic Measurements Based on SnO2 Gas Sensor

1
Hefei Institute of Intelligent Machines, Chinese Academy of Sciences, Hefei, 230031, P.R. China
2
Department of Chemistry, University of Science and Technology of China, Hefei, 230026, P.R.China
3
Department of Machines, Anhui University of Technology and Science, Wuhu, 241000, P.R.China
*
Authors to whom correspondence should be addressed.
Sensors 2004, 4(6), 95-104; https://doi.org/10.3390/s40670095
Submission received: 1 April 2004
/
Accepted: 19 August 2004
/
Published: 30 August 2004
Abstract
:The gas-sensing behaviour based on a dynamic measurement method of a single SnO2 gas sensor was investigated by comparison with the static measurement. The influencing factors of nonlinear response such as modulation temperature, duty ratio, heating waveform (rectangular, sinusoidal, saw-tooth, pulse, etc.) were also studied. Experimental data showed that temperature was the most essential factor because the changes of frequency and heating waveform could result in the changes of temperature essentially.
Introduction
Presently, low-cost tin-oxide chemical sensors applied to gas detection present some well-known problems (lack of selectivity, drift, etc.) which motivates active research in material science, different measurement strategies and signal-processing algorithms, different measurement strategies including sensors arrays, static and dynamic measurements, etc. Several attempts have been focused on dynamic measurements which include temperature transient or pulsed techniques and temperature modulation through oscillation of heater voltage because they have suggested that temperature modulation of tin-oxide sensor provides more information from a single sensor than static measurement [1-19]. However, these works always focused on the identification of certain gases such as H2S, CO, NO2, CO2, ethanol, methane, n-butane, ethane, propane, propylene, ammonia, and so on under a given constant heating waveform, frequency and operation temperature.
In our previous work, we reported rapid detecting of pesticide residues using temperature modulation by employing only a single sensor rather than an array. We also reported the amplitudes of the higher harmonics of the FFT signal exhibited characteristic changes that depended not only on the species of pesticide gases but also on the concentration of pesticide gases by means of analysis dynamic responses [20, 21].
In the present paper, we will report on the advantages of the dynamic measurement and discuss the influencing factors of nonlinear responses such as modulation temperature, frequency, heating shape waveform (rectangular, triangular, saw-tooth, pulse, sinusoidal) throughout the experimental trails.
Experimental
The sol was prepared using a mixed ethanol solution of SnCl2, SbCl3, CaCl2 and SrCl2. The amounts of Sb, Ca and Sr elements were fixed to 2.5 mol% as M/Sn, respectively. As a binder, a given amount of commercial glass powder was added in doped SnO2 powder formed by calcinating the powder at 500 °C for half an hour in air. The screen-printing technique was used to prepare SnO2 thick films on alumina ceramic substrates with a RuO2 layer as a heating element on the back. The thick films were sintered at various temperatures for half an hour in air to obtain doped SnO2 TF gas sensors. These elements were aged in working temperature until reproducible steady-state resistances were obtained.
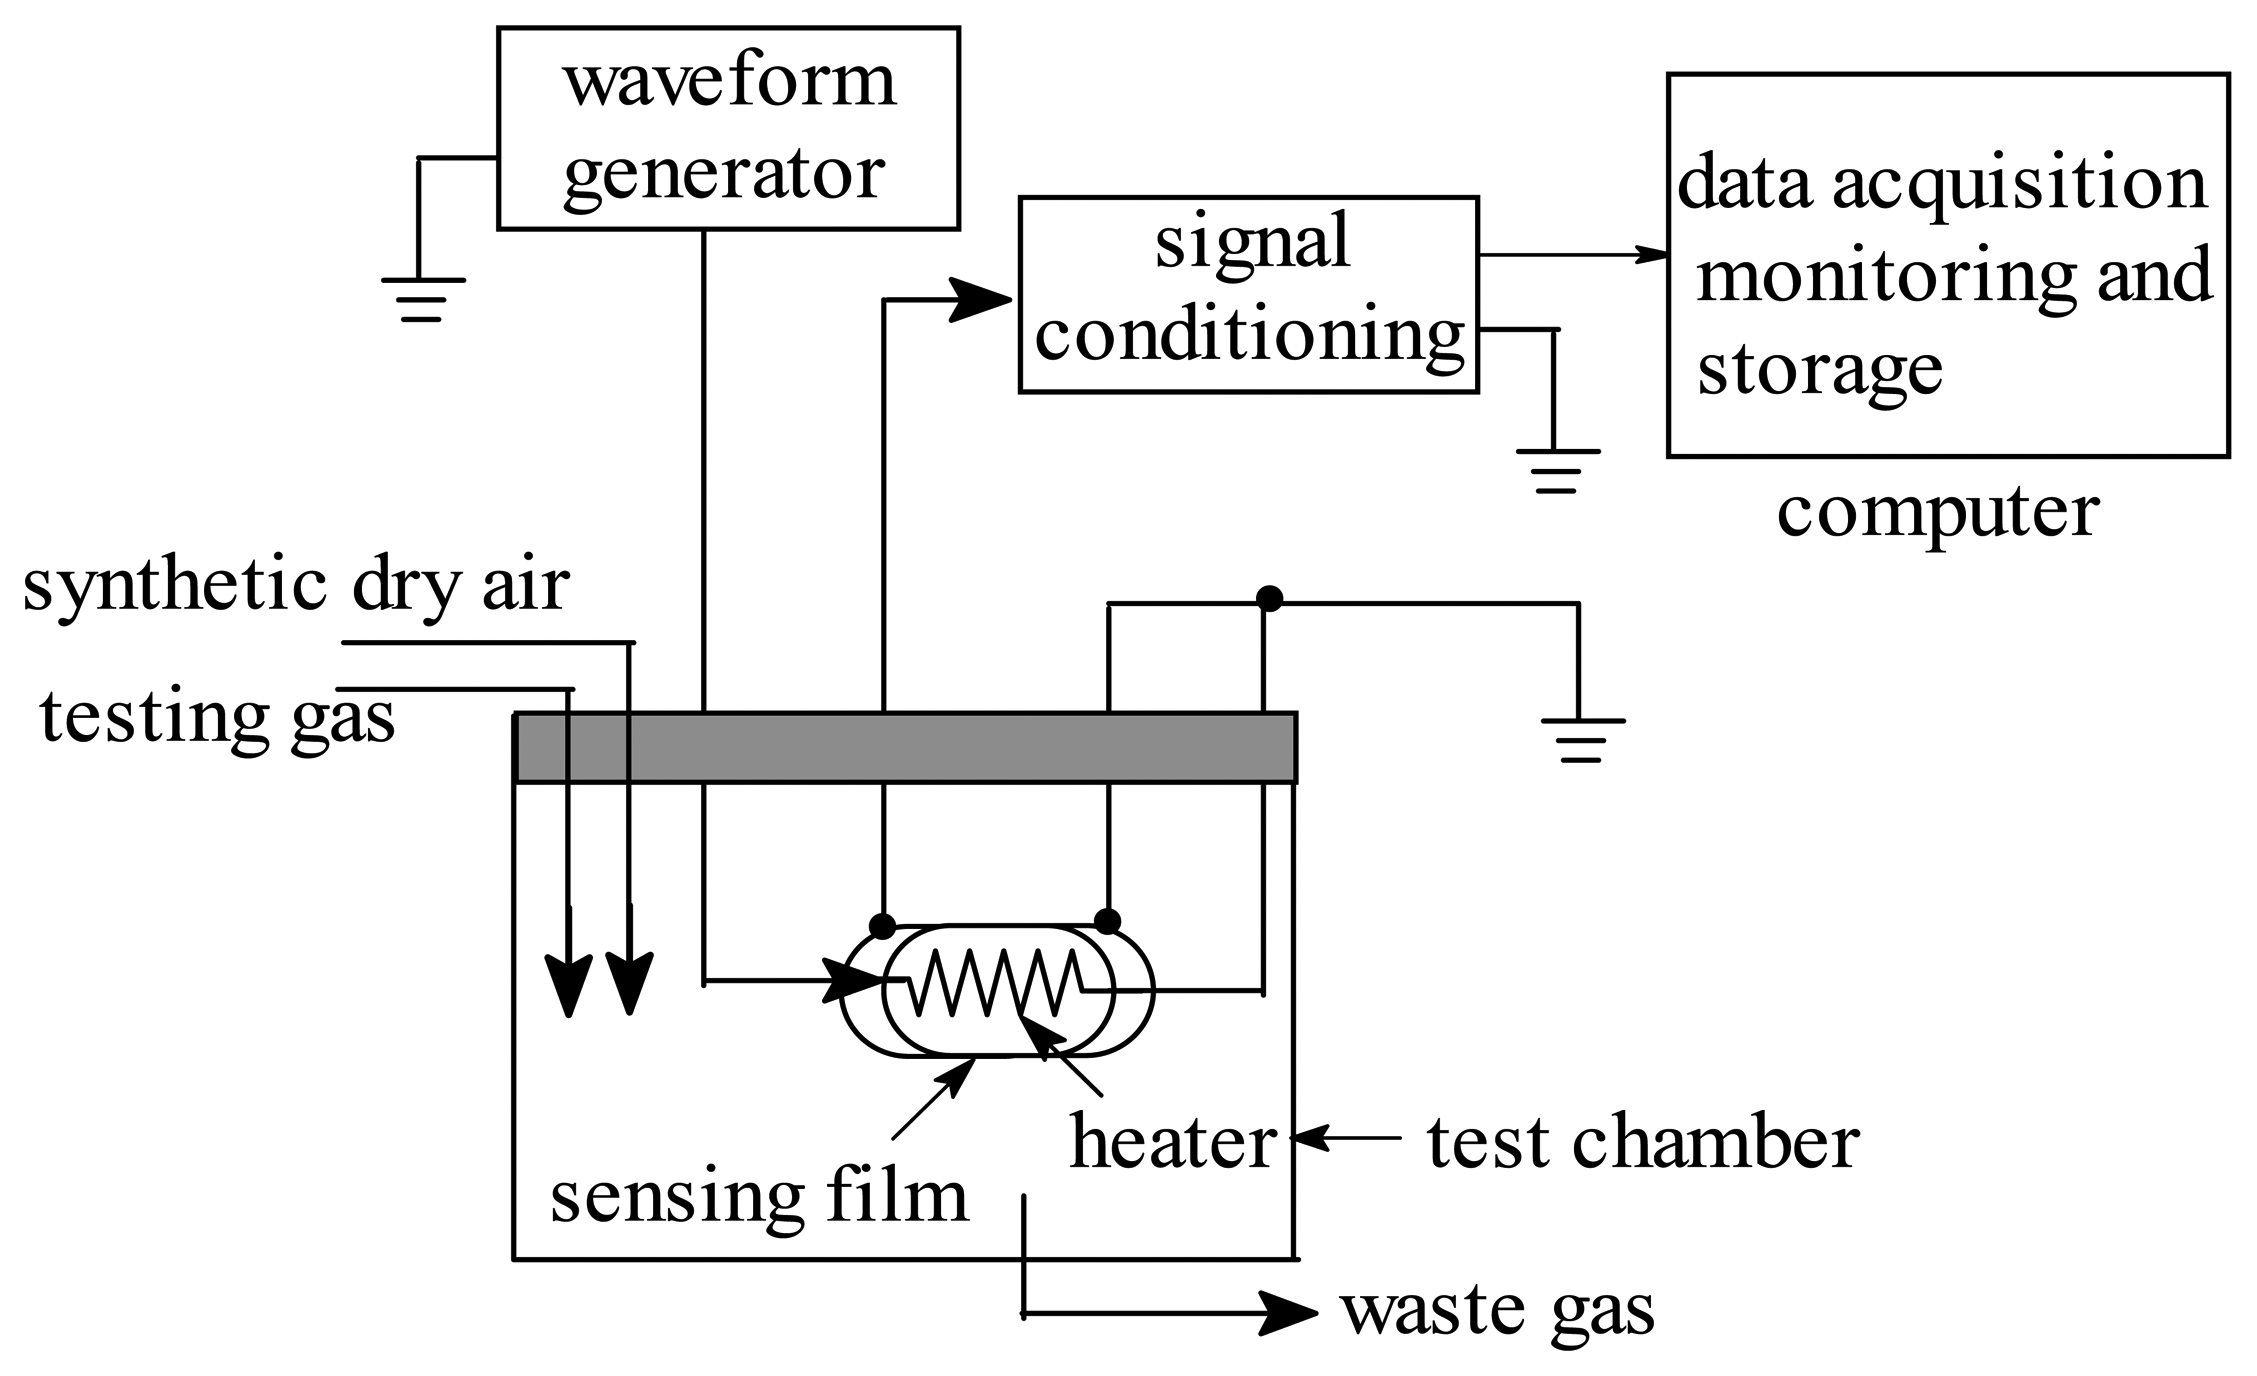
A headspace sample (HP-7694) was used to inject sample gases measured into a 2500 ml sensor test chamber, where a single SnO2 gas sensor was kept. Butanone, acetone, ethanol, methanol, formaldehyde and cyclohexanone (Analytical standard, provided by Sigma-Aldrich Laborchemikalien Gmbh) were measured. The signal-producing circuit board was made by ECU Electronics Industrial Co., LTD (No. 38 Research Institute of China Electronics & Technology Group Corp., China). The signal frequency and operating temperatures settings were adjusted to obtain good sensitivities and selectivity to the pesticide gases measured. The sensor resistance was monitored, acquired and stored in a PC for further analysis. Fig.1 shows the experimental set-up. The measurement process was as follows: dry air at a constant flow rate of 10 ml/sec was used as carrier gas. Data acquisition started from 80 s before the injection of the test gases sample into the air-flow. The sampling rate was set to two points per second and it took several minutes to complete the measurements. The surface temperature of the gas-sensing element was measured with an infrared thermometer (Keyence, IT2-01, Japan).
Results and discussion
Static responses of the SnO2-based gas sensor
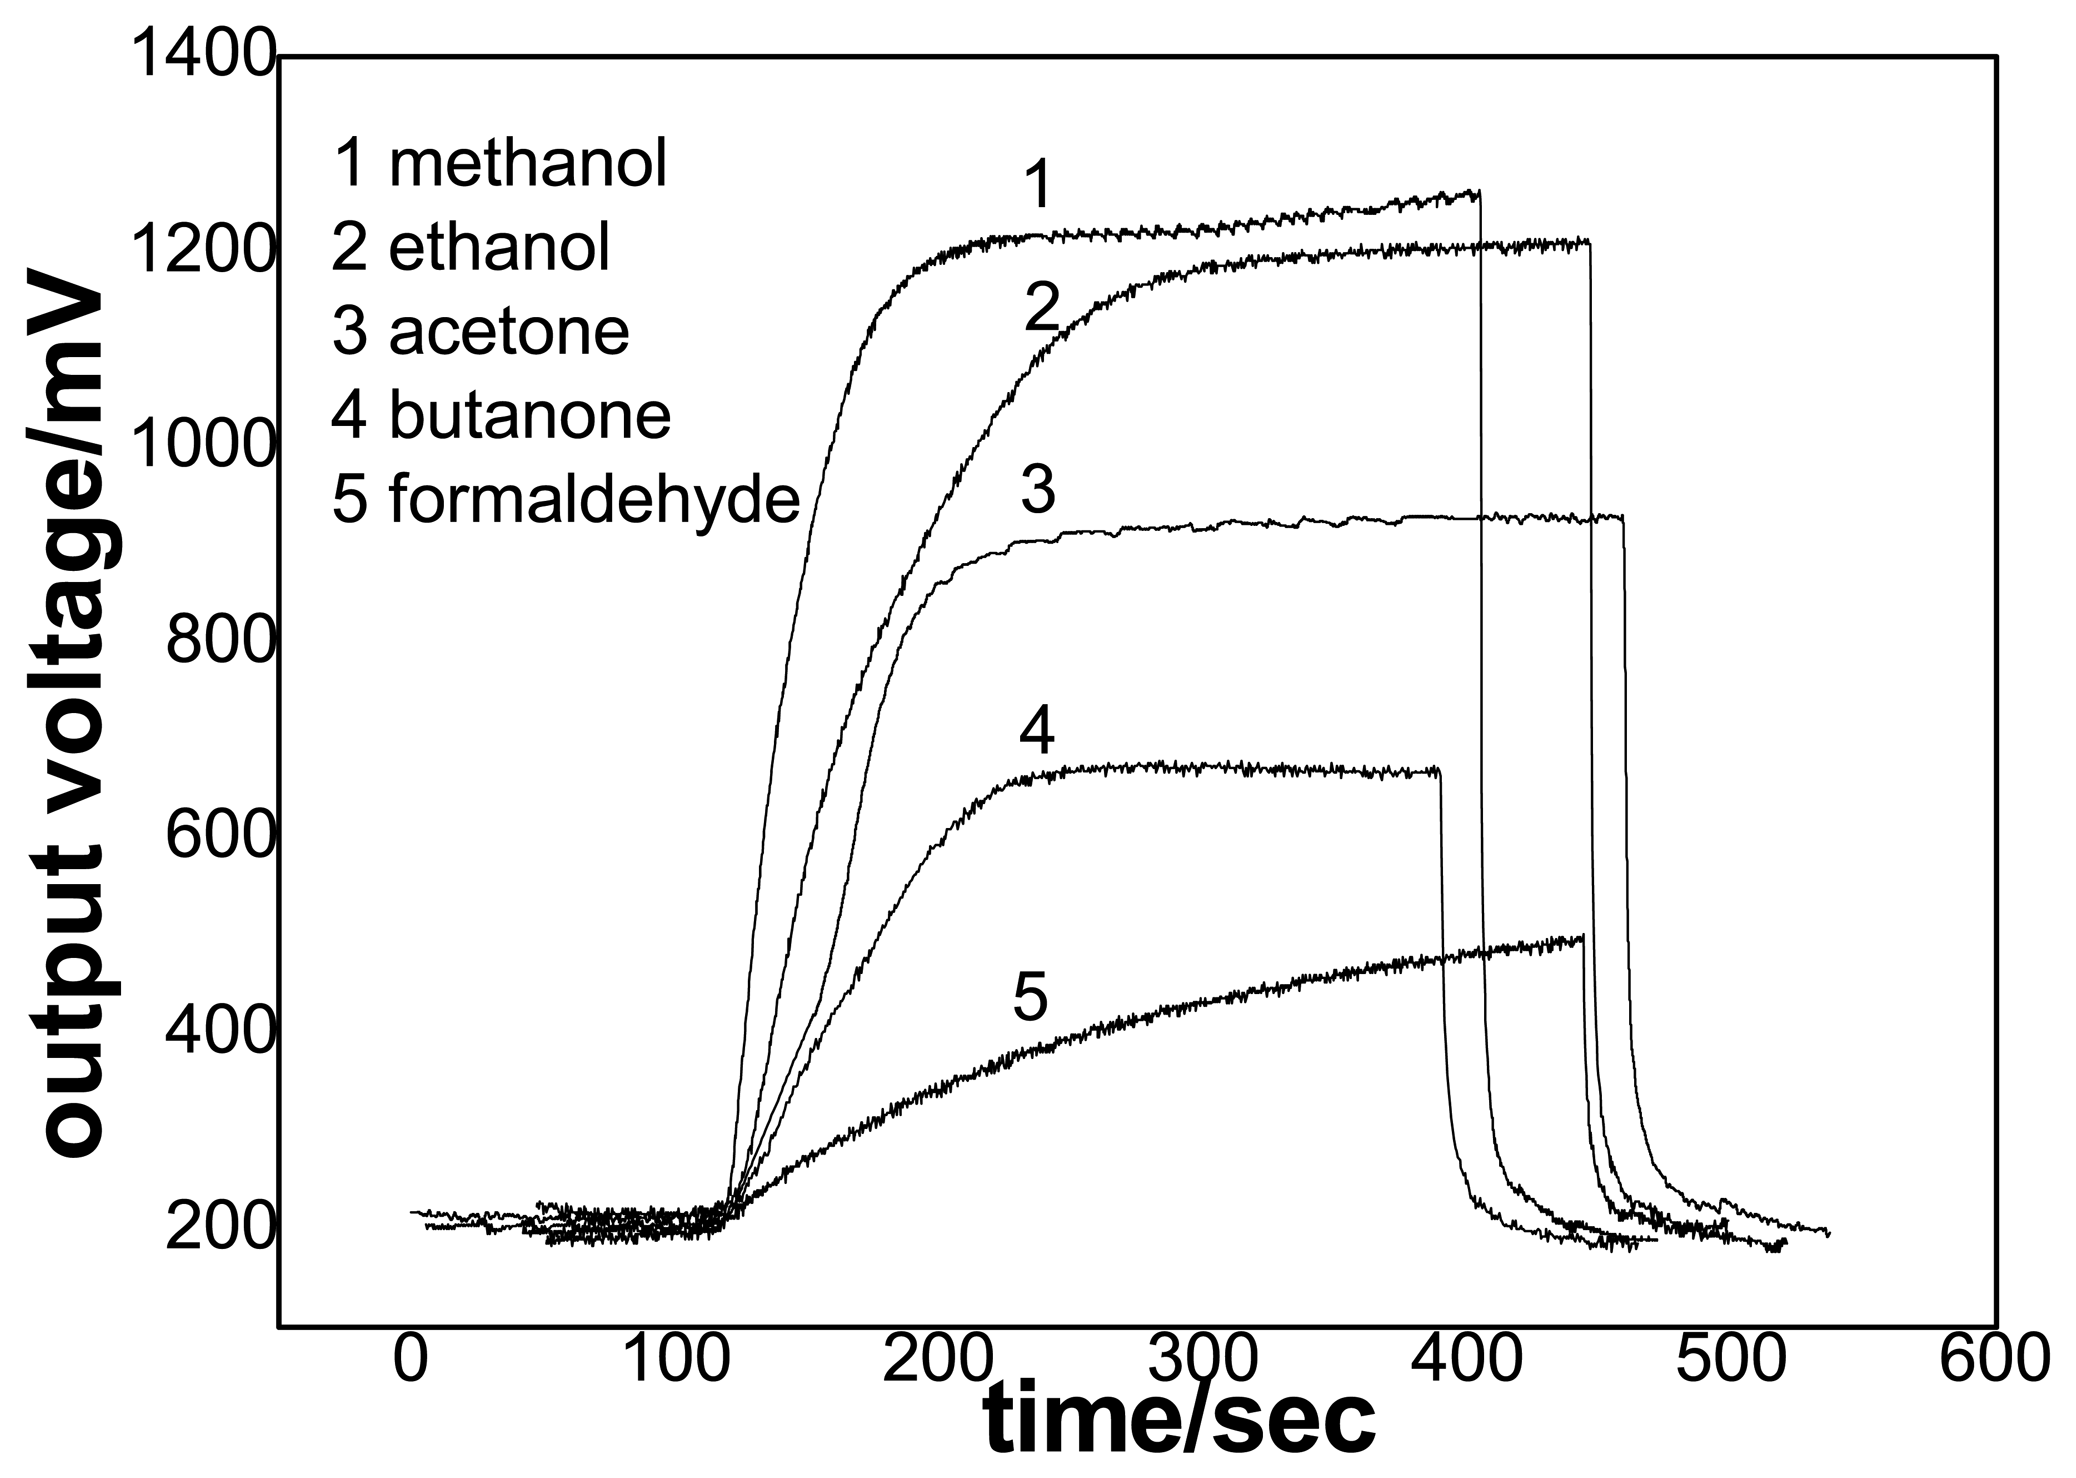
The static responses to 0.5 ppm butanone, acetone, ethanol, methanol and formaldehyde at 300 °C for the SnO2 sensor are reported in Fig. 2.
As shown in the figure, one could clearly observe that the resistance of the sensing element changes obviously upon exposure to the organic gas, meanwhile the response time could be observed audio-visually by means of the tendency of the static curves. It was also necessary to point out that, however, in addition to the changes in resistance and response time, there was no other information about reaction processes, so it was difficult to analyses the sensing mechanism for butanone, acetone, ethanol and methanol. Except the static response to formaldehyde, the other responses were similar to each other. In fact, there are two types of different functional groups (carbonyl group and hydroxyl group). There is no way to distinguish between the carbonyl and hydroxyl group because of the shortcoming concerning their lack of sufficient phenomenon. In a word, during static measurements, only the resistance changes of the sensing element in initial and final state were observed, as for the other changes during reaction processes no other information was obtained.
Dynamic nonlinear responses of SnO2-based gas sensor
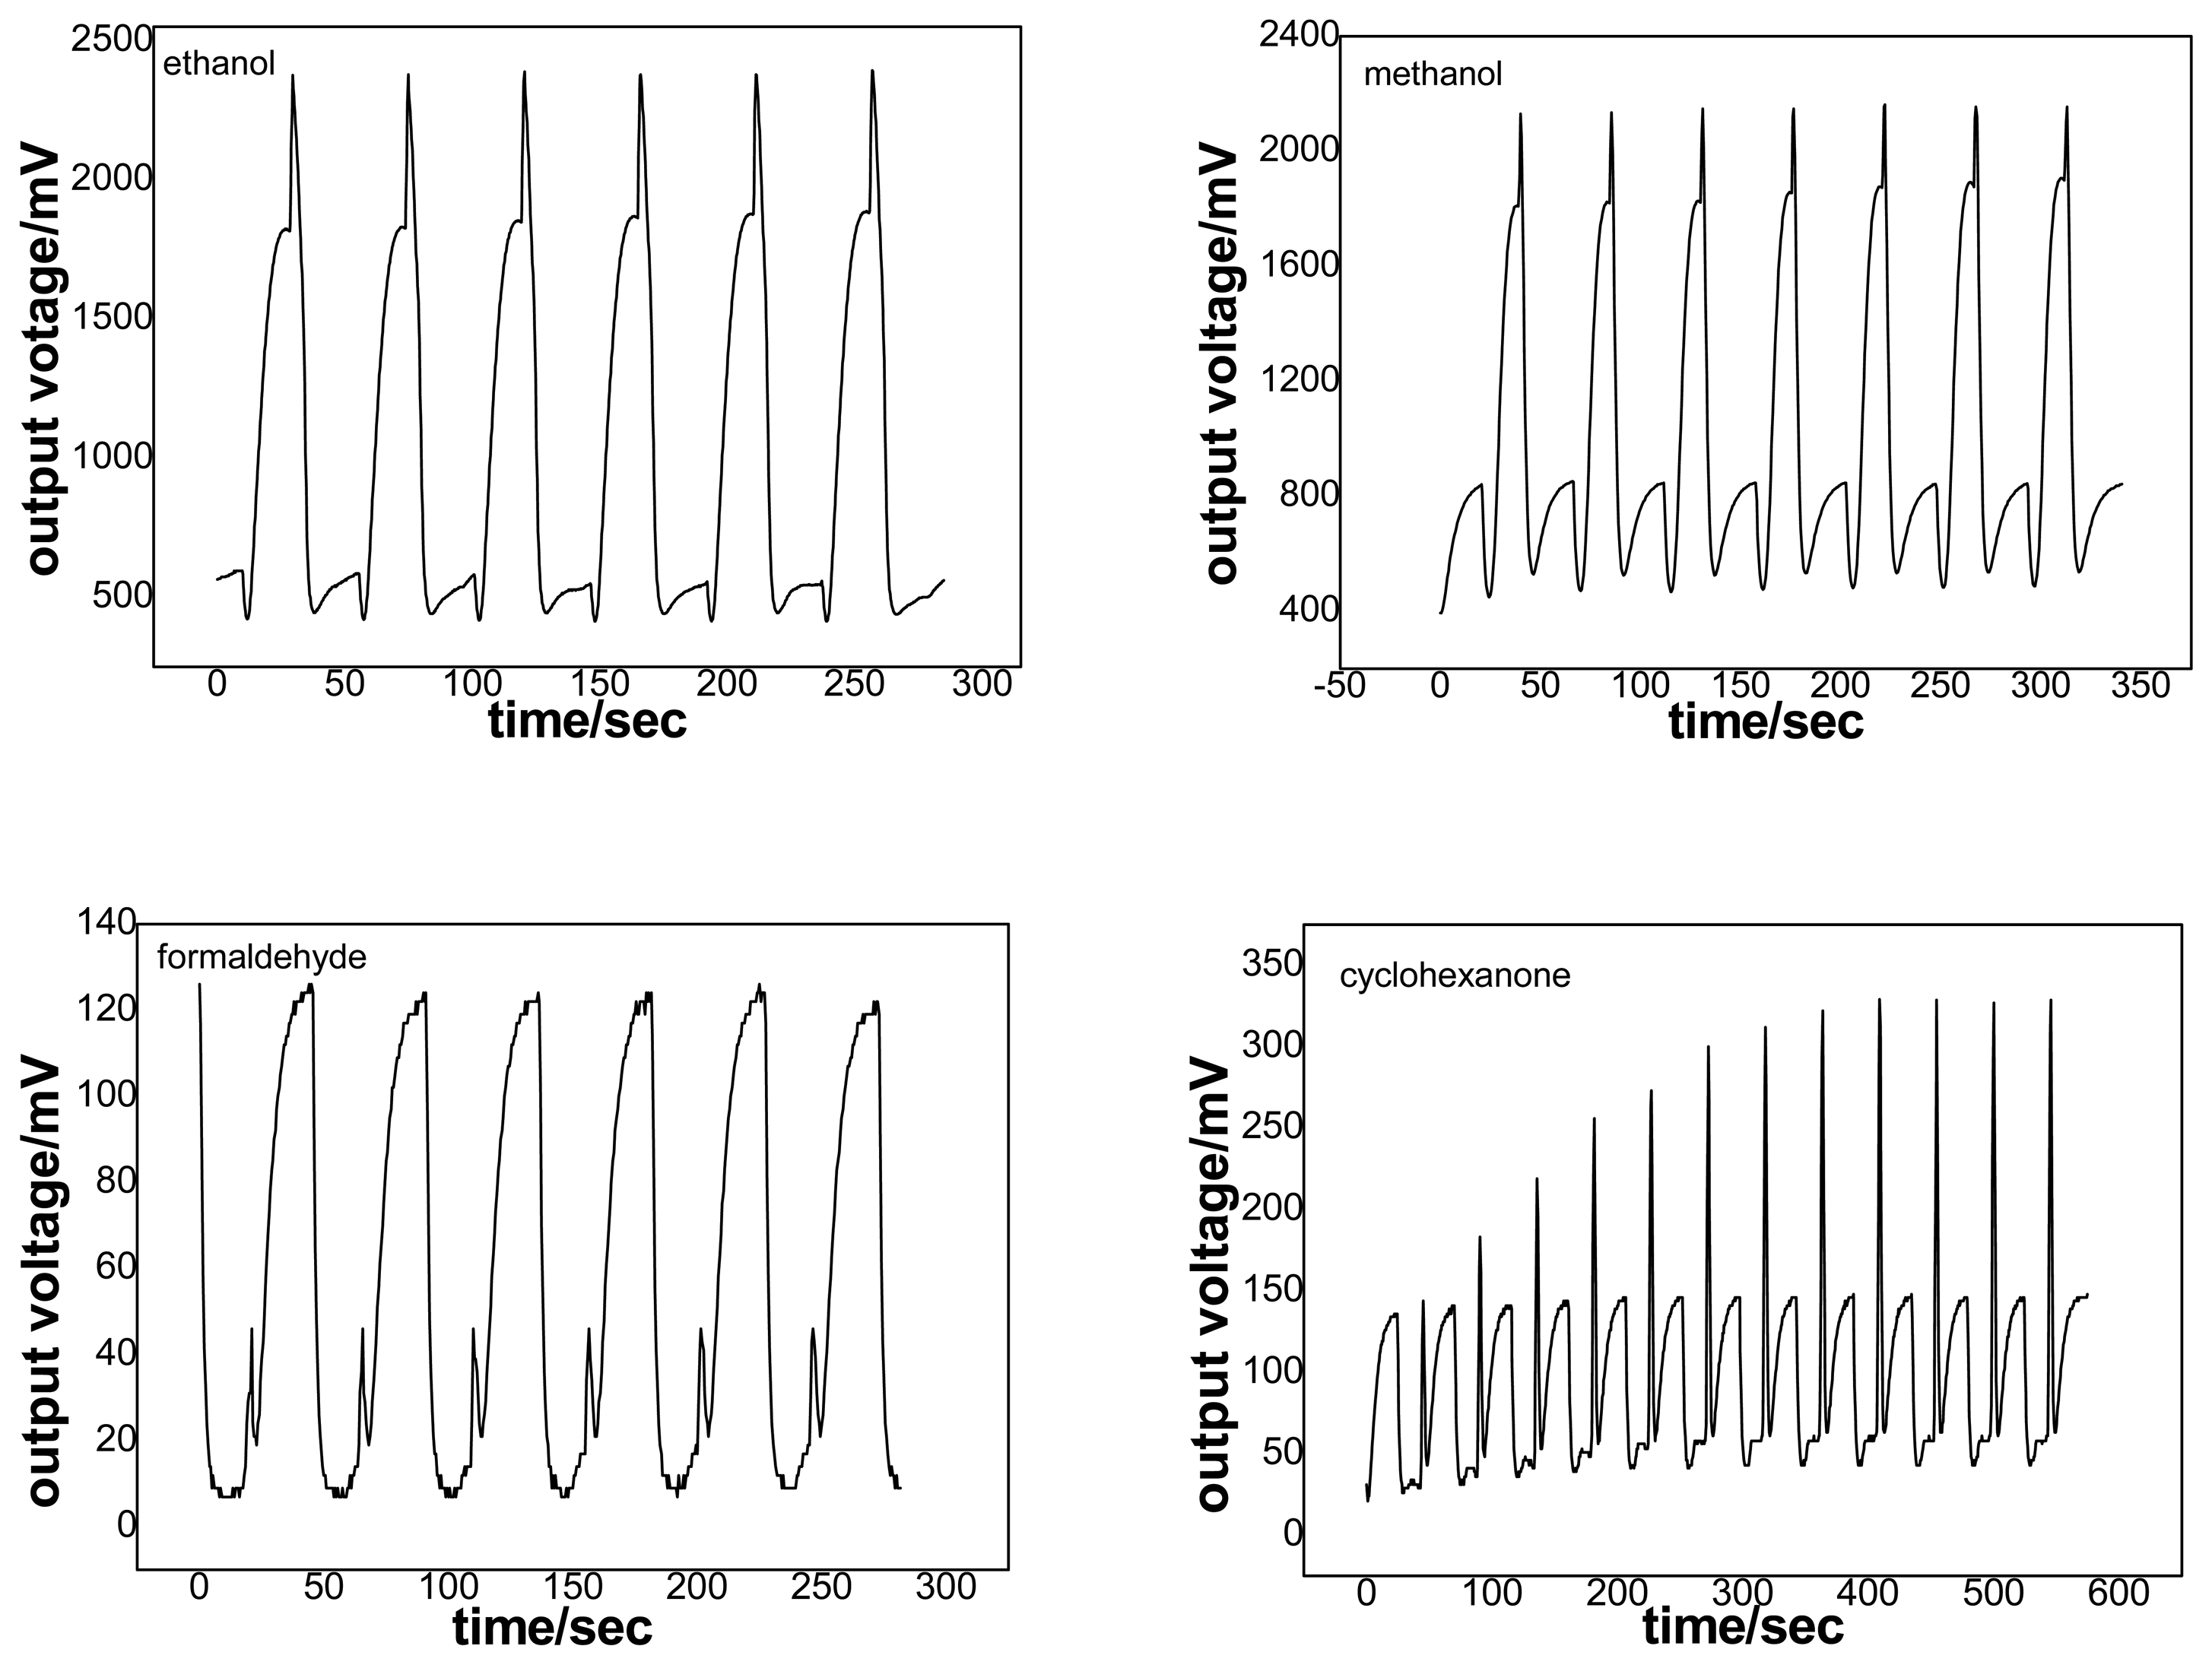
Fig. 3 reports the dynamic nonlinear responses to 0.5 ppm ethanol, methanol, formaldehyde and cyclohexanone of a single SnO2 gas sensor, respectively. Experimental conditions were as follows: applied potential 7 V, modulation frequency 20 mHz, rectangular mode.
Firstly, as seen in Fig. 3, it was worth to note that there was sufficient reaction information in the dynamic nonlinear responses, so the sample gases could be easily identified by means of different nonlinear responses. In the four selected species, there are three types of different functional groups (hydroxyl group, aldehyde group and ring ketone); one could easily obtain the distinguishing and connection among the testing species by comparison the static responses. In the case of the dynamic responses to ethanol and methanol, because of their identical hydroxyl group, there is a similar tendency in the curves.
Secondly, it was widely accepted that oxygen in air could be chemisorbed and decomposed as O2-, O- and O2-. At a constant temperature, there existed an equilibrium state at the surface of the SnO2 sensing material: O2↔ O2-(ad) ↔ O-(ad) ↔ O2- (ad). Semiconductor gas sensors monitor changes in the conductance during the interaction of a chemically sensitive material such as SnO2 with molecules to be detected in the gas phase; the reaction steps involved the low-temperature surface reactions and secondly, involved the high-temperature bulk reactions between point defects in the SnO2 crystal and oxygen (O2) in gas phase. The first step was adsorption and catalytic reactions at active sites (the latter involves intrinsic point defects such as oxygen vacancies and/or extrinsic point defects, like segregated metal atoms) and similar reactions at grain boundaries or at three-phase boundaries (e.g., at metallic contacts on surface metallic clusters). All of these reactions involved adsorbed negatively charged molecular (O2-) or atomic (O-) oxygen species as well as hydroxyl groups (OH) at different surface sites.
During the static measurement processes, the adsorbed oxygen results in oxidation of testing gases on the surface and in a decrease of the chemisorbed oxygen concentration, inducing an increase of the conductance. As seen from Fig. 3, it was found that gas identification in a rectangular temperature-modulated mode was related to the different reaction kinetics of the interacting gases on the tin-oxide surface. It is clear that, by temperature modulation, it became possible to provide the surface oxygen species at constant temperatures at which, in equilibrium conditions, they would not exist. In this way, the reaction with the reducing and oxidizing gases was dramatically influenced, e.g. at lower temperatures and at higher temperatures the responses to sample gases exhibited their characteristic wave shape due to the reaction with different oxygen species. So, from the above mentioned, we suggested that the dynamic nonlinear responses are beneficial to analyse the sensing mechanism of the sample gases.
Thirdly, it was also found that the operation temperature during the dynamic processes was lower than that of the static processes. For example, the static operation temperature using an applied potential of 7 V reaches 450 °C, whereas the dynamic temperature at operation frequency of 20 mHz was in the range of 300∼210 °C.Therefore, we suggested that a modulated temperature operation mode not only enhances the selectivity of a gas sensor but also reduces the overall power consumption.
Effect of the modulation temperature at frequency of 20 mHz
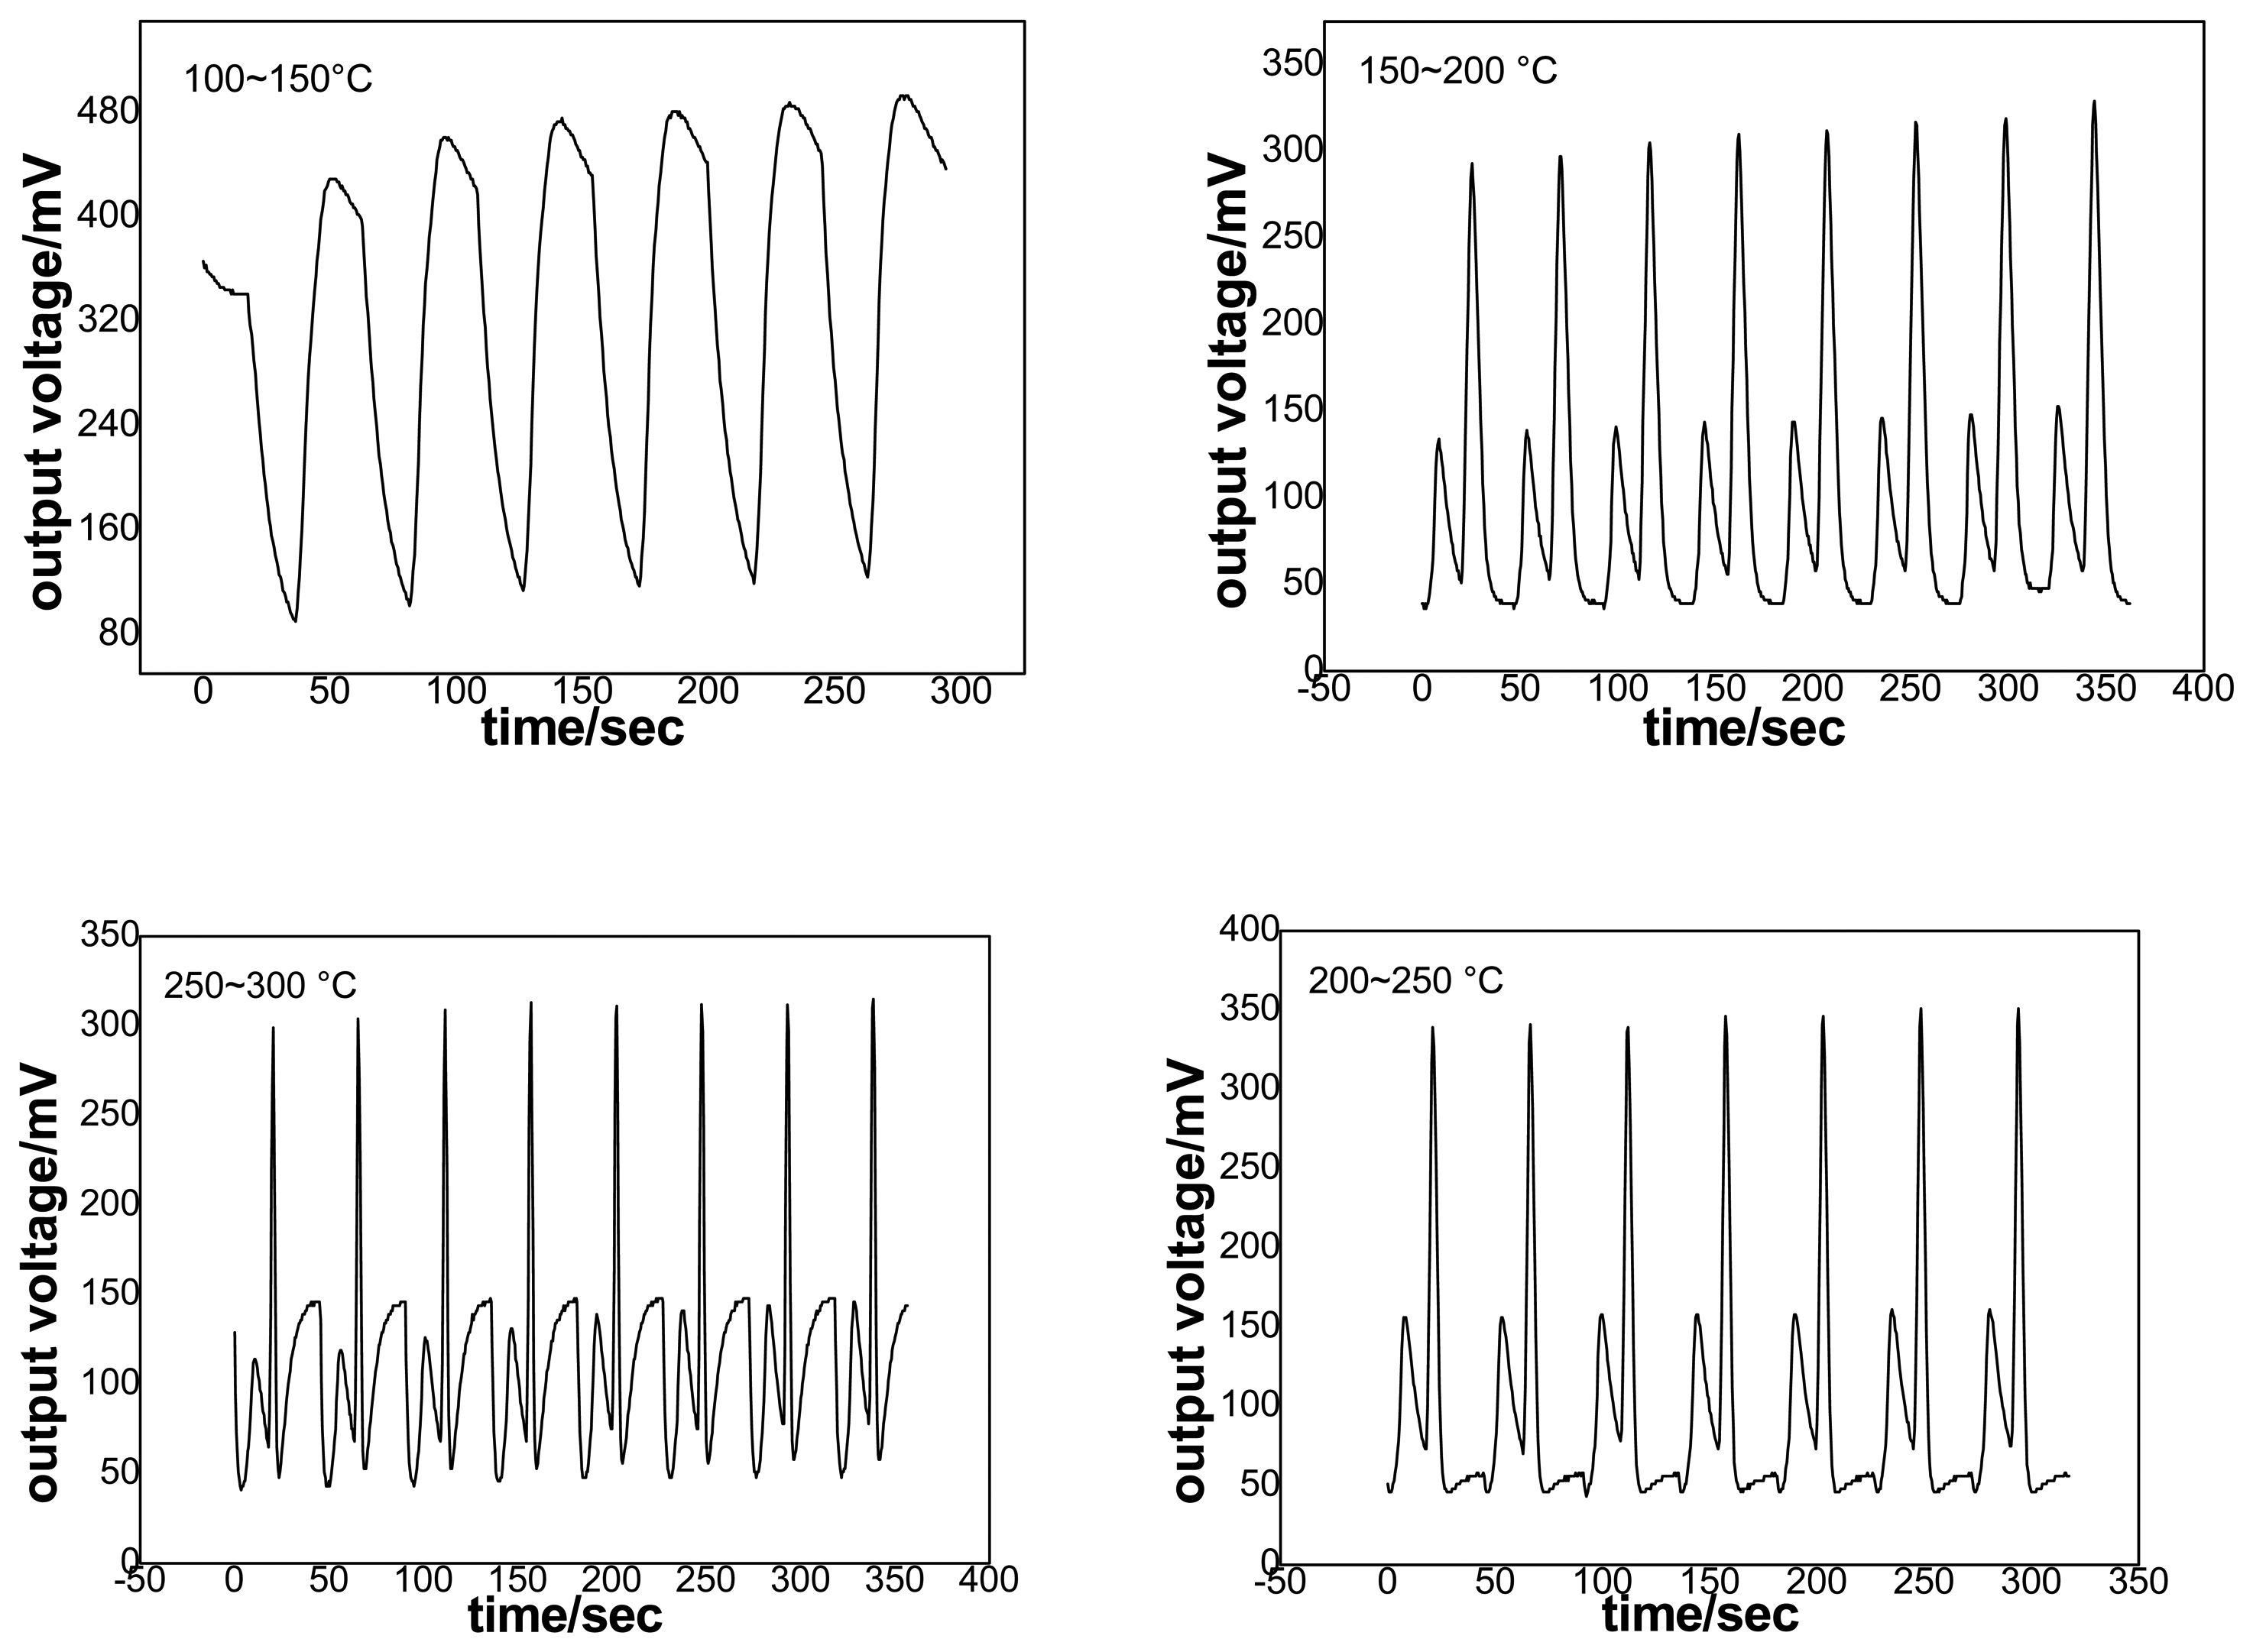
To optimize the selectivity of the temperature-modulated sensor, it was necessary to obtain a relationship between a given temperature and its conductance response in the presence of a specific gas. Fig. 4 reports the effect of a given temperature on the responses of 0.5 ppm acetone at a constant frequency of 20 mHz in a rectangular mode. As seen in the figure, the different responses at different operation temperatures could be easily observed. This case noted that the sensor exhibited an enhanced selectivity to acetone with increasing temperature. It was suggested that acetone can be identified by means of a relatively complete response between 250 °C and 300 °C. Obviously, there were different surface reaction mechanisms between acetone and chemisorbed oxygen at different given operation temperatures.
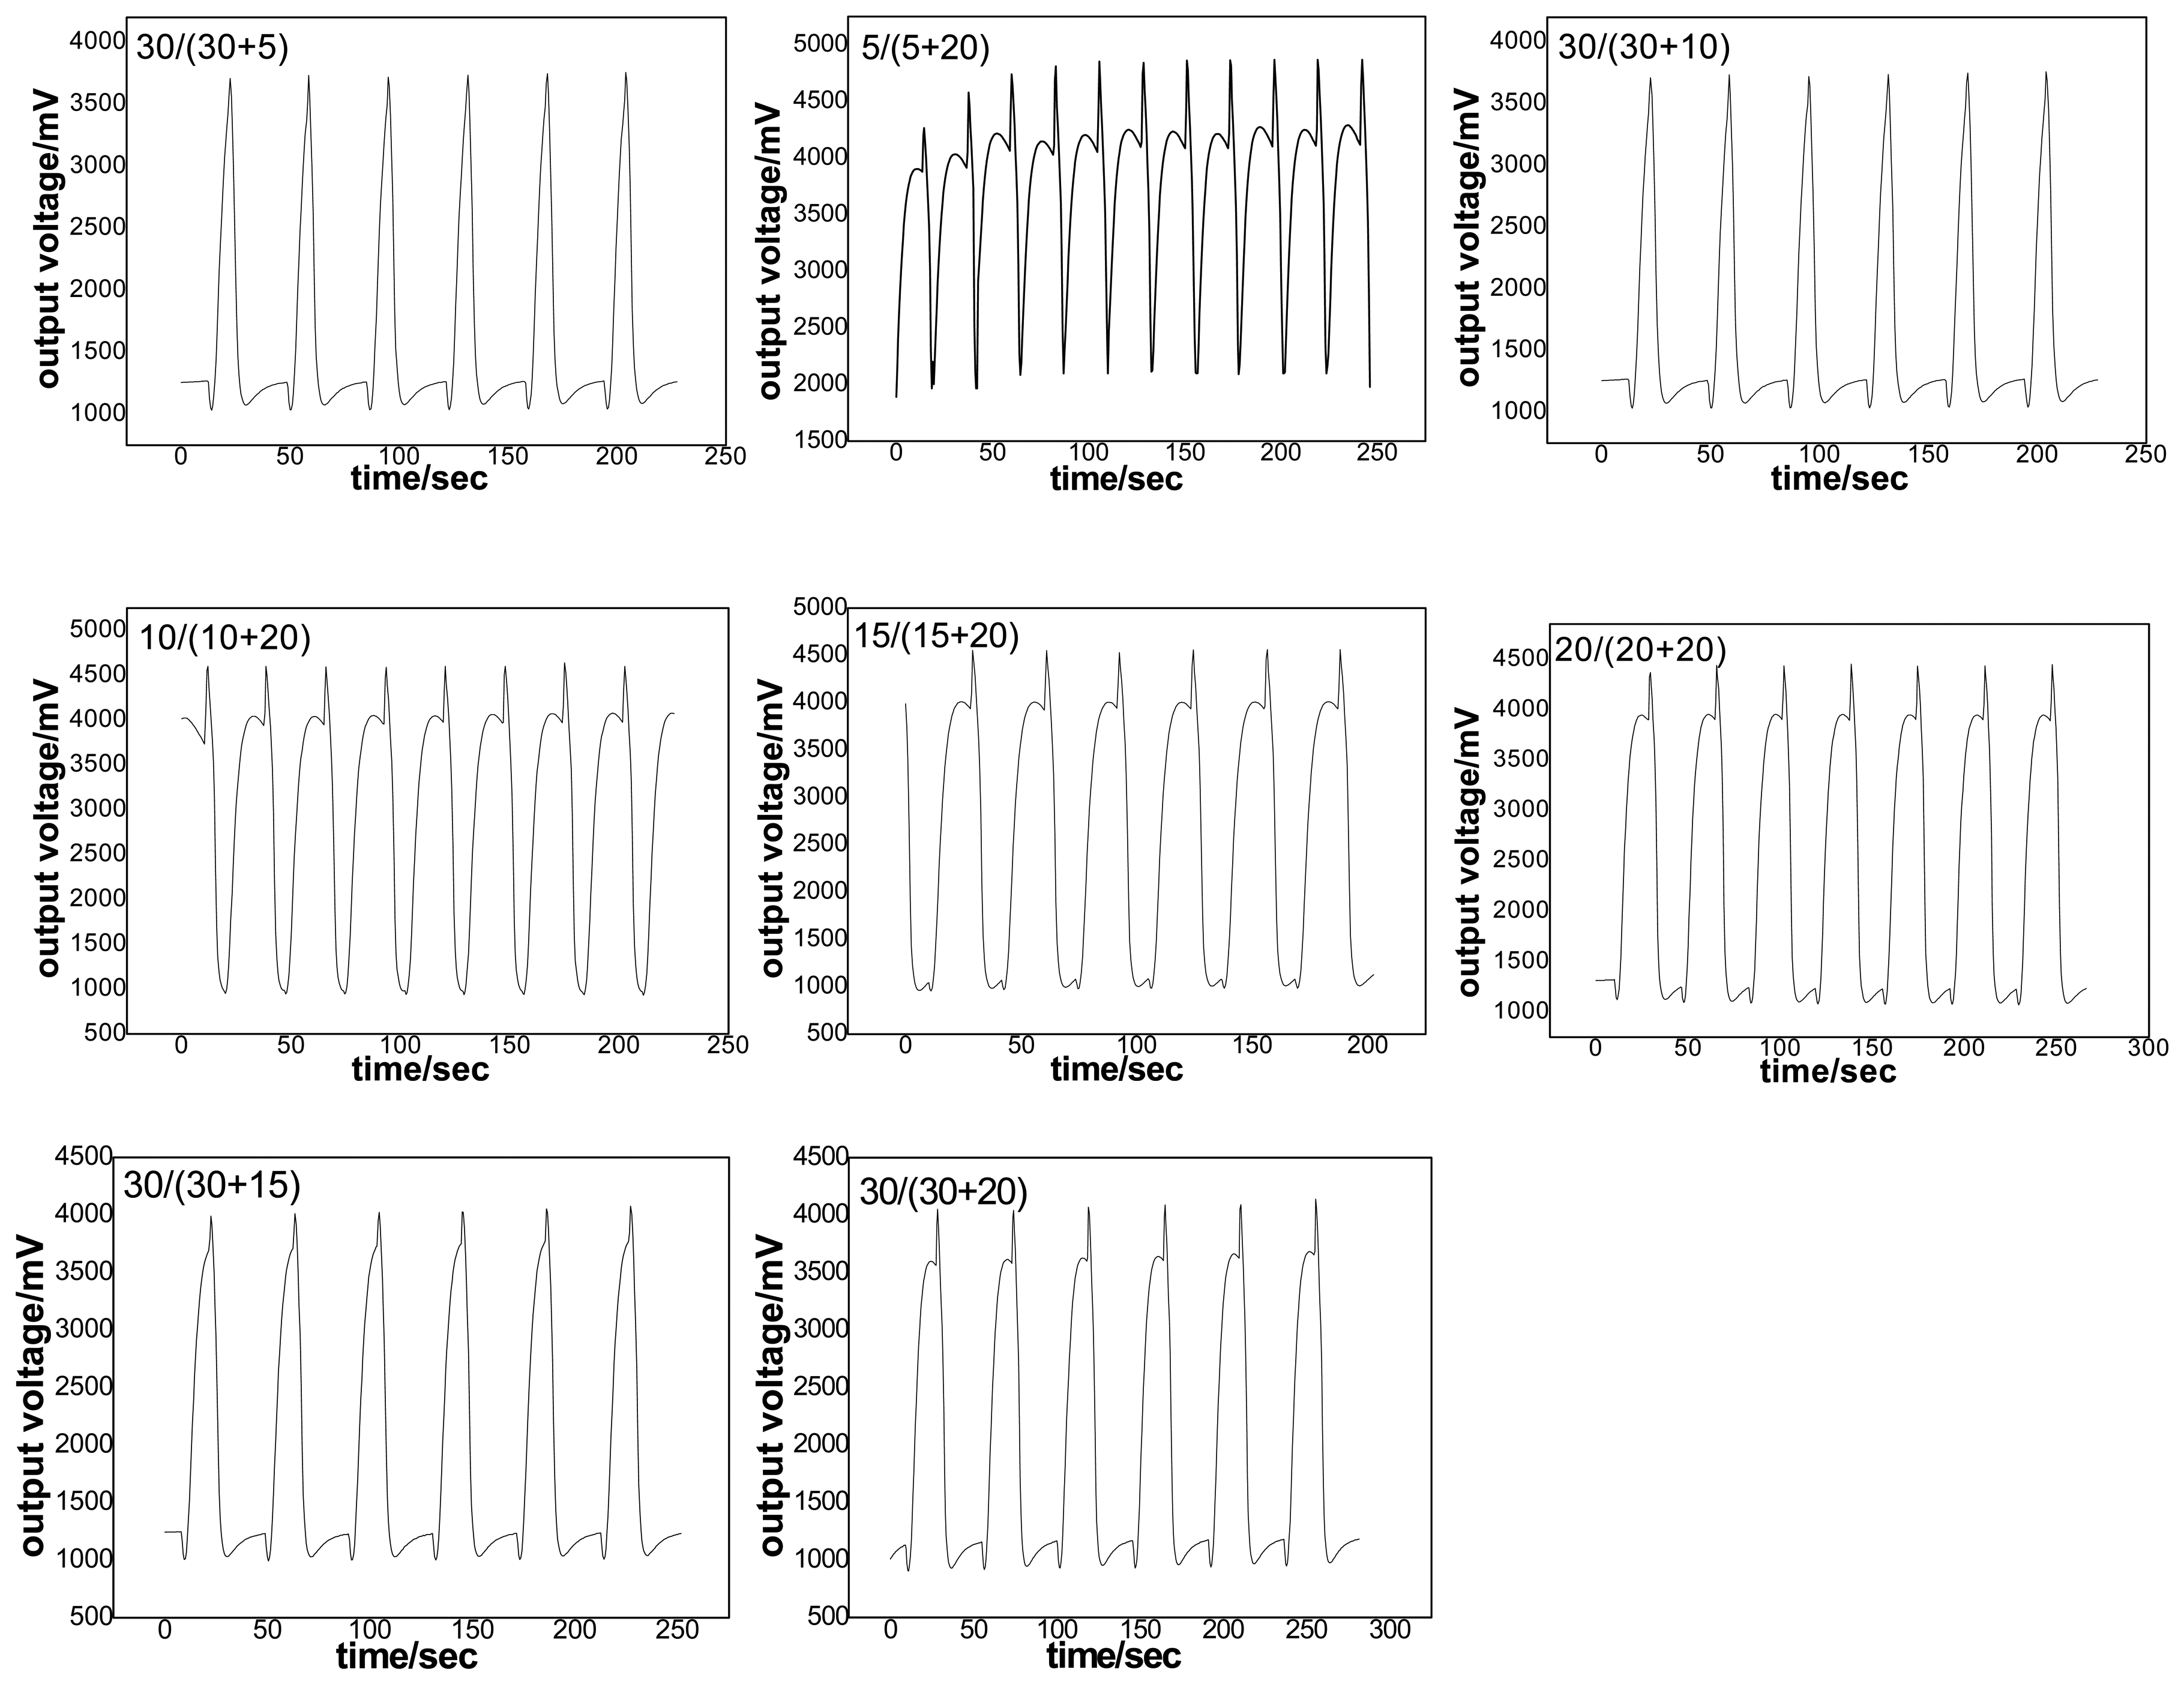
Effect of the duty ratio at an applied potential of 7 V
Fig. 5 clearly shows the time-dependent change shape of the resistance of the sensor in the presence of butanone in air at different duty ratios by controlling an applied potential of 7 V in a rectangular mode. As seen in the figure, one can easily observe the effects of electrical outage and switch-on on the dynamic responses. In the left part of the figure, the lower half of the response was influenced evidently by the state of switch-on electrical current. With the lengthening of the switch-on time (electrical outage time in thermal cycle), the response was appeared gradually. Inversely, the upper half of the response was influenced obviously by the state of electrical outage; the more the time of the electrical outage, the more evident the upper half of the response. Therefore, the duty ratio was beneficial to investigate the sensing mechanism, and it was in agreement with the analysis in the dynamic nonlinear response.
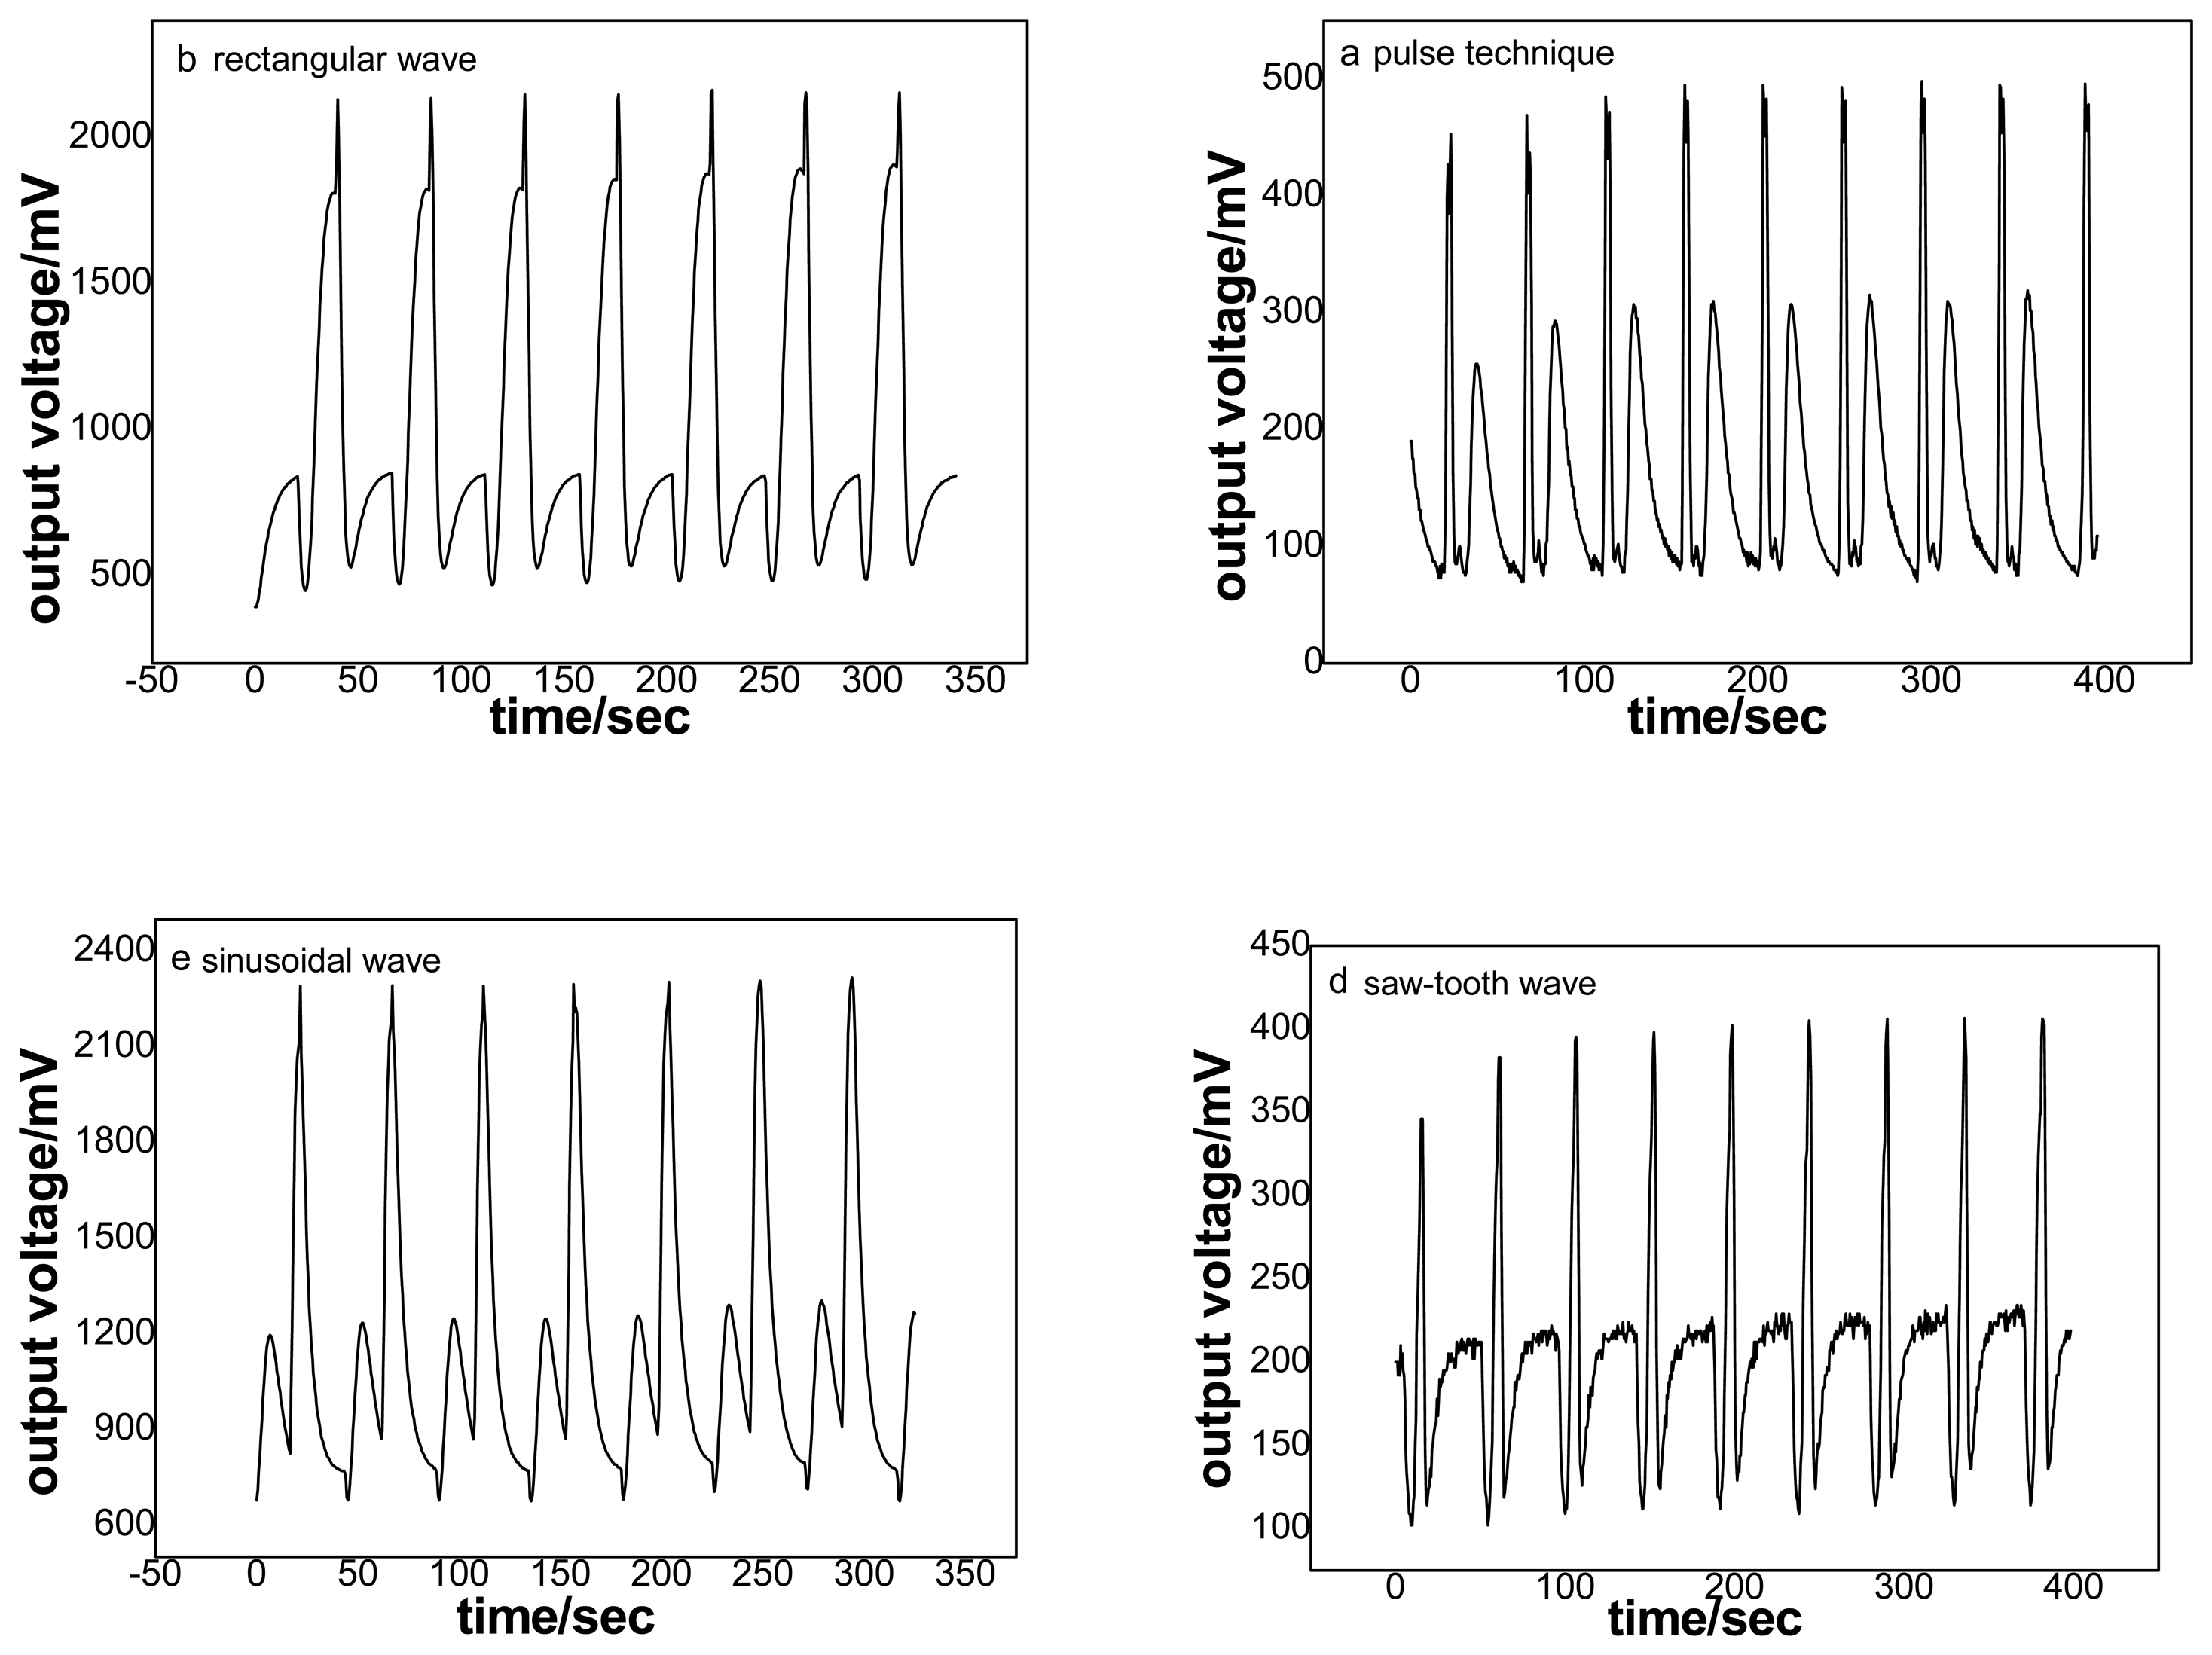
Effect of modulation waveform
In order to improve the detection, the modulation of the wave shape was carried out. The dynamic nonlinear responses to methanol are reported in Fig. 6 using different modulation waveforms. Although the object was commentarial, one could see that the nonlinear responses were different to each other. These experimental data are in agreement with A. Ortega's report. A. Ortega and his co-workers have reported that CO and CH4 could be detected by using pulse and triangular heating waveforms [7]. According to the analysis of the sections above, the change of the heating shape waveform had influence on the sensing behavior of the testing gas by means of the change of the sensing element's surface temperature.
Conclusions
The study carried out over the dynamic and static measurements has allowed to demonstrate the advantage of the former measures in order to obtain the maximization of the information extracted from a single gas sensor. Experimental test showed that the dynamic measurement was beneficial to facilitate the feature extraction algorithm as the most significant output signal to separate the testing gases. Meanwhile, a variety of influencing factors such as modulation temperature, duty ratio, heating shape waveform (rectangular, saw-tooth, pulse, sinusoidal) were investigated. It was found that the characteristic optimum oxidation temperatures of acetone were 250∼300 °C at a frequency of 20 mHz. At a frequency of 20 mHz, the temperature contrast reached a maximum which was beneficial for detecting butanone. Experimental data also showed that different waveforms could improve the detection if the separation of certain gases is not clear. Finally, all data showed that temperature was the most essential influencing factor.
Acknowledgments
This work was financially supported by the National Natural Science Foundation of China (project 60274061) and Anhui Province Natural Science Foundation (project 01041404), which are gratefully acknowledged.
References
- Hiranaka, Y.; Abe, T.; Murata, H. Gas-dependent response in the temperature transient of SnO2 gas sensors. Sensors and Actuators B 1992, 9, 177. [Google Scholar]
- Amamoto, T.; Yamaguch, T.; Matsuura, Y.; Kajiyama, Y. Development of pulse-drive semiconductor gas sensor. Sensors and Actuators B 1993, 13-14, 587. [Google Scholar]
- Aigner, R.; Auerbach, F.; Huber, P.; Müller, R.; Scheller, G. Sinusoidal temperature modulation of the Si-Planar-Pellistor. Sensors and Actuators B 1994, 18-19, 143. [Google Scholar]
- Nakata, S.; Nakamura, H; Yoshikawa, K. New strategy for the development of a gas sensor based on the dynamic characteristics: principle and preliminary experiment. Sensors and Actuators B 1992, 8, 187. [Google Scholar]
- Romppainen, P.; Lantto, V.; Leppavuori, S. Effect of water vapour on the CO response behaviour of tin dioxide sensors in constant temperature and temperature-pulsed modes of operation. Sensors and Actuators B 1990, 1, 73. [Google Scholar]
- Lantto, V.; Romppainen, P. Response of some SnO2 gas sensors to H2S after quick cooling. J. Electrochem. Soc. 1988, 135, 2550. [Google Scholar]
- Yoshikawa, K.; Kato, Y.; Kitora, M. Temperature-dependent dynamic response enables the qualification and quantification of gases by a single sensor. Sensors and Actuators B 1997, 40, 33. [Google Scholar]
- Nak-Jin, C.; Chang-Hyun, S.; Kap-Duk, S.; Dae-Sik, L.; Jeung-Soo, H.; Duk-Dong, L. Classification of workplace gases using temperature modulation of two SnO2 sensing films on substrate. Sensors and Actuators B 2002, 86, 251. [Google Scholar]
- Roth, M.; Hartinger, R.; Faul, R.; Endres, H.-E. Drift reduction of organic coated gas-sensors by temperature modulation. Sensors and Actuators B 1996, 36, 358. [Google Scholar]
- Lee, A.P.; Reedy, B. J. Temperature modulation in semiconductor gas sensing. Sensors and Actuators B 1999, 60, 35. [Google Scholar]
- Nakata, S.; Ozaki, E.; Ojima, N. Gas sensing based on the dynamic nonlinear responses of a semiconductor gas sensor: Dependence on the range and frequency of a cyclic temperature change. Analytica Chimica Acta 1998, 361, 93. [Google Scholar]
- Nakata, S.; Nakasuji, M.; Ojima, N.; Kitora, M. Characteristic nonlinear responses for gas species on the surface of different semiconductor gas sensors. Applied Surface Science 1998, 135, 285. [Google Scholar]
- Fort, A.; Gregorkiewitz, M.; Machetti, N.; Rocchi, S.; Serrano, B.; Tondi, L.; Ulivieri, N.; Vignoli, V. Selectivity enhancement of SnO2 sensors by means of operating temperature modulation. Thin Solid Films 2002, 418, 2. [Google Scholar]
- Aigner, R.; Dietl, M.; Katterloher, R.; Klee, V. Si-planar-pellistor: Designs for temperature modulated operation. Sensors and Actuators B 1996, 33, 151. [Google Scholar]
- Heilig, A.; Bârsan, N.; Weimar, U.; Schweizer-Berberich, M.; Göpel, W. Gas identification by modulating temperatures of SnO2-based thick film sensors. Sensors and Actuators B 1997, 43, 45. [Google Scholar]
- Cavicchi, R.E.; Suehle, J.S.; Kreider, K.G.; Gaitan, M.; Chaparala, P. Optimized temperature-pulse sequences for the enhancement of chemically specific response patterns from micro-hotplate gas sensors. Sensors and Actuators B 1996, 33, 142. [Google Scholar]
- Ortega, A.; Marco, S.; Perera, A.; Šundic, T.; Pardo, A.; Samitier, J. An intelligent detector based on temperature modulation of a gas sensor with a digital signal processor. Sensors and Actuators B 2001, 78, 32. [Google Scholar]
- Ionescu, R.; Llobet, E. Wavelet transform-based fast feature extraction from temperature modulated semiconductor gas sensors. Sensors and Actuators B 2002, 81, 289. [Google Scholar]
- Nakata, S.; Ojima, N. Detection of a sample gas in the presence of an interferant gas based on a nonlinear dynamic response. Sensors and Actuators B 1999, 56, 79. [Google Scholar]
- Huang, X.; Liu, J.; Shao, D.; Pi, Z.; Yu, Z. Rectangular mode of operation for detecting pesticide residue by using a single SnO2-based gas sensor. Sensors and Actuators B 2003, 96, 630. [Google Scholar]
- Huang, X.; Liu, J.; Pi, Z.; Yu, Z. Detecting pesticide residue by using modulating temperature over a single SnO2-based gas sensor. Sensors 2003, 361. [Google Scholar]
Figure 1.
Experimental set-up.

Figure 2.
Static responses to butanone, acetone, ethanol, methanol and formaldehyde. Experimental conditions: applied potential 7 V, sampling dosage 0.5 ppm.
Figure 2.
Static responses to butanone, acetone, ethanol, methanol and formaldehyde. Experimental conditions: applied potential 7 V, sampling dosage 0.5 ppm.

Figure 3.
Dynamic nonlinear responses to ethanol, methanol, formaldehyde and cyclohexanone. Experimental conditions: sampling dosage 0.5 ppm, applied potential 7 V, modulation frequency 20 mHz, rectangular temperature mode.
Figure 3.
Dynamic nonlinear responses to ethanol, methanol, formaldehyde and cyclohexanone. Experimental conditions: sampling dosage 0.5 ppm, applied potential 7 V, modulation frequency 20 mHz, rectangular temperature mode.

Figure 4.
Effect of temperature on the responses of 0.5 ppm acetone at a frequency of 20 mHz in a rectangular mode.
Figure 4.
Effect of temperature on the responses of 0.5 ppm acetone at a frequency of 20 mHz in a rectangular mode.

Figure 5.
Effect of duty ratio on the responses to ethanol at an applied potential of 7 V in a rectangular mode.
Figure 5.
Effect of duty ratio on the responses to ethanol at an applied potential of 7 V in a rectangular mode.

Figure 6.
Effect of modulation waveform on the dynamic response of methanol. Experimental conditions: applied potential 7 V, modulation frequency 20 mHz.
Figure 6.
Effect of modulation waveform on the dynamic response of methanol. Experimental conditions: applied potential 7 V, modulation frequency 20 mHz.

© 2004 by MDPI ( http://www.mdpi.net). Reproduction is permitted for non-commercial purposes.
Share and Cite
MDPI and ACS Style
Sun, Y.; Huang, X.; Meng, F.; Liu, J. Study of Influencing Factors of Dynamic Measurements Based on SnO2 Gas Sensor. Sensors 2004, 4, 95-104. https://doi.org/10.3390/s40670095
AMA Style
Sun Y, Huang X, Meng F, Liu J. Study of Influencing Factors of Dynamic Measurements Based on SnO2 Gas Sensor. Sensors. 2004; 4(6):95-104. https://doi.org/10.3390/s40670095
Chicago/Turabian StyleSun, Yufeng, Xingjiu Huang, Fanli Meng, and Jinhuai Liu. 2004. "Study of Influencing Factors of Dynamic Measurements Based on SnO2 Gas Sensor" Sensors 4, no. 6: 95-104. https://doi.org/10.3390/s40670095