1. Introduction
In molecular imprinting [
1], a highly cross-linked polymer is synthesized in the presence of a template compound that can be either a small molecule or a much larger species such as a microorganism [
2]. If this template does not interact with the polymerization reaction, it leaves behind adapted cavities in the material. In the case of small molecules these are usually distributed within the entire polymer bulk, whereas for larger analytes soft-lithographic techniques are preferred that lead to a surface pattern. The resulting materials are highly suitable to selectively re-incorporate the analyte by binding it reversibly via non-covalent interactions. Combining them with e.g. mass-sensitive devices, such as quartz crystal microbalances (QCM) or surface acoustic wave resonators (SAW), leads to highly effective sensor systems. Within this article we will cover both some aspects of mass-sensitive measuring technique as well as the capacity of imprinted materials as sensor layer for analytes ranging from small molecules to micro organisms [
3]. Xylene isomers, engine oil degradation, viruses and erythrocyte ghosts will serve as examples.
As previously mentioned, the imprinting techniques for small molecules and micro organisms differ from each other. Choosing a molecular template usually requires adding it to the entire reaction mixture, where it is incorporated into the bulk of the forming polymeric material and removed by evaporation or washing after hardening. Consequently, the interaction sites are distributed within the entire bulk of the material. Especially for small molecules this is very advantageous, as the amount of interaction sites is appreciably high. In contrast to this, micro organism imprinting usually is done exclusively on the surface of the respective polymer material. One reason is that the analyte-layer interaction then is not diffusion-hindered. The lower amount of interaction sites compared with bulk imprints, however, is no limitation, because already the interaction with a single analyte can lead to a detectable frequency shift on a mass-sensitive device.
Within this paper we will show the versatility and diversity of imprinting techniques with the examples of detecting analytes at both dimension scales mentioned, namely xylene detection and engine oil degradation sensing for small molecules as well as erythrocyte and human rhinovirus sensing on the other side.
2. Measuring Technique
Mass-sensitive devices rely on a piezoelectric substrate that transforms a mechanical oscillation into an electrical one, where the frequency is determined by material parameters and also prominently by the mass loading of the device. One aspect for successful sensor characterization is the design of suitable measuring cell setups.
Figure 1 in the upper right corner shows a QCM cell design based on casted silicone for micro organism detection. In this case the device is optimized towards low sample volumes, as especially in the case of virus sensing the sample amounts are generally limited. One aspect, however, has to be born in mind: especially in liquid phase, QCM shows substantial responses to temperature changes, mainly because the sample viscosity is usually highly temperature dependent. One strategy to overcome this problem, e.g. if only insufficient thermostating can be provided, is to use devices with more electrodes deposited on the same substrate. One can see a main reason for this also in
Figure 1: here, the frequency responses of a dual-channel QCM are given when changing the water temperature from 15°C to 25°C in steps on 1°C. As can bee seen, one degree of temperature change results in a frequency shift of about 40 Hz. This is not negligible, as the sensor responses attributed to imprinting effects usually reach values between 100 and 1000 Hz. However, the difference between the two channels in
Fig. 1 remains absolutely constant. So the combination of the small cell size with a single transducer substrate carrying all sensors leads to ideal compensation of the occurring physical effects, as demonstrated here by temperature/viscosity changes.
Screen-printed QCM devices can be improved by optimizing a further parameter: the electronic quality turned out to depend distinctly on the surface roughness of the electrodes.
Figure 2 shows three AFM scan lines over different electrodes, respectively, where each scan covers 50 μm. The uppermost graphic shows the roughness of a gold layer after screen printing and burning at 400°C. Evidently, the highest vertical distances reach up to about 250 nanometers with an average roughness of about 100 nm. Spinning the quartz for a minute at 6000 rpm after printing reduces this roughness to values around 40 nm with maximum distances being below 100 nm (as to be seen in the middle). Even further improvement can be achieved by placing the printed QCM into a chamber with an atmosphere saturated with dicholoromethane (lower part of
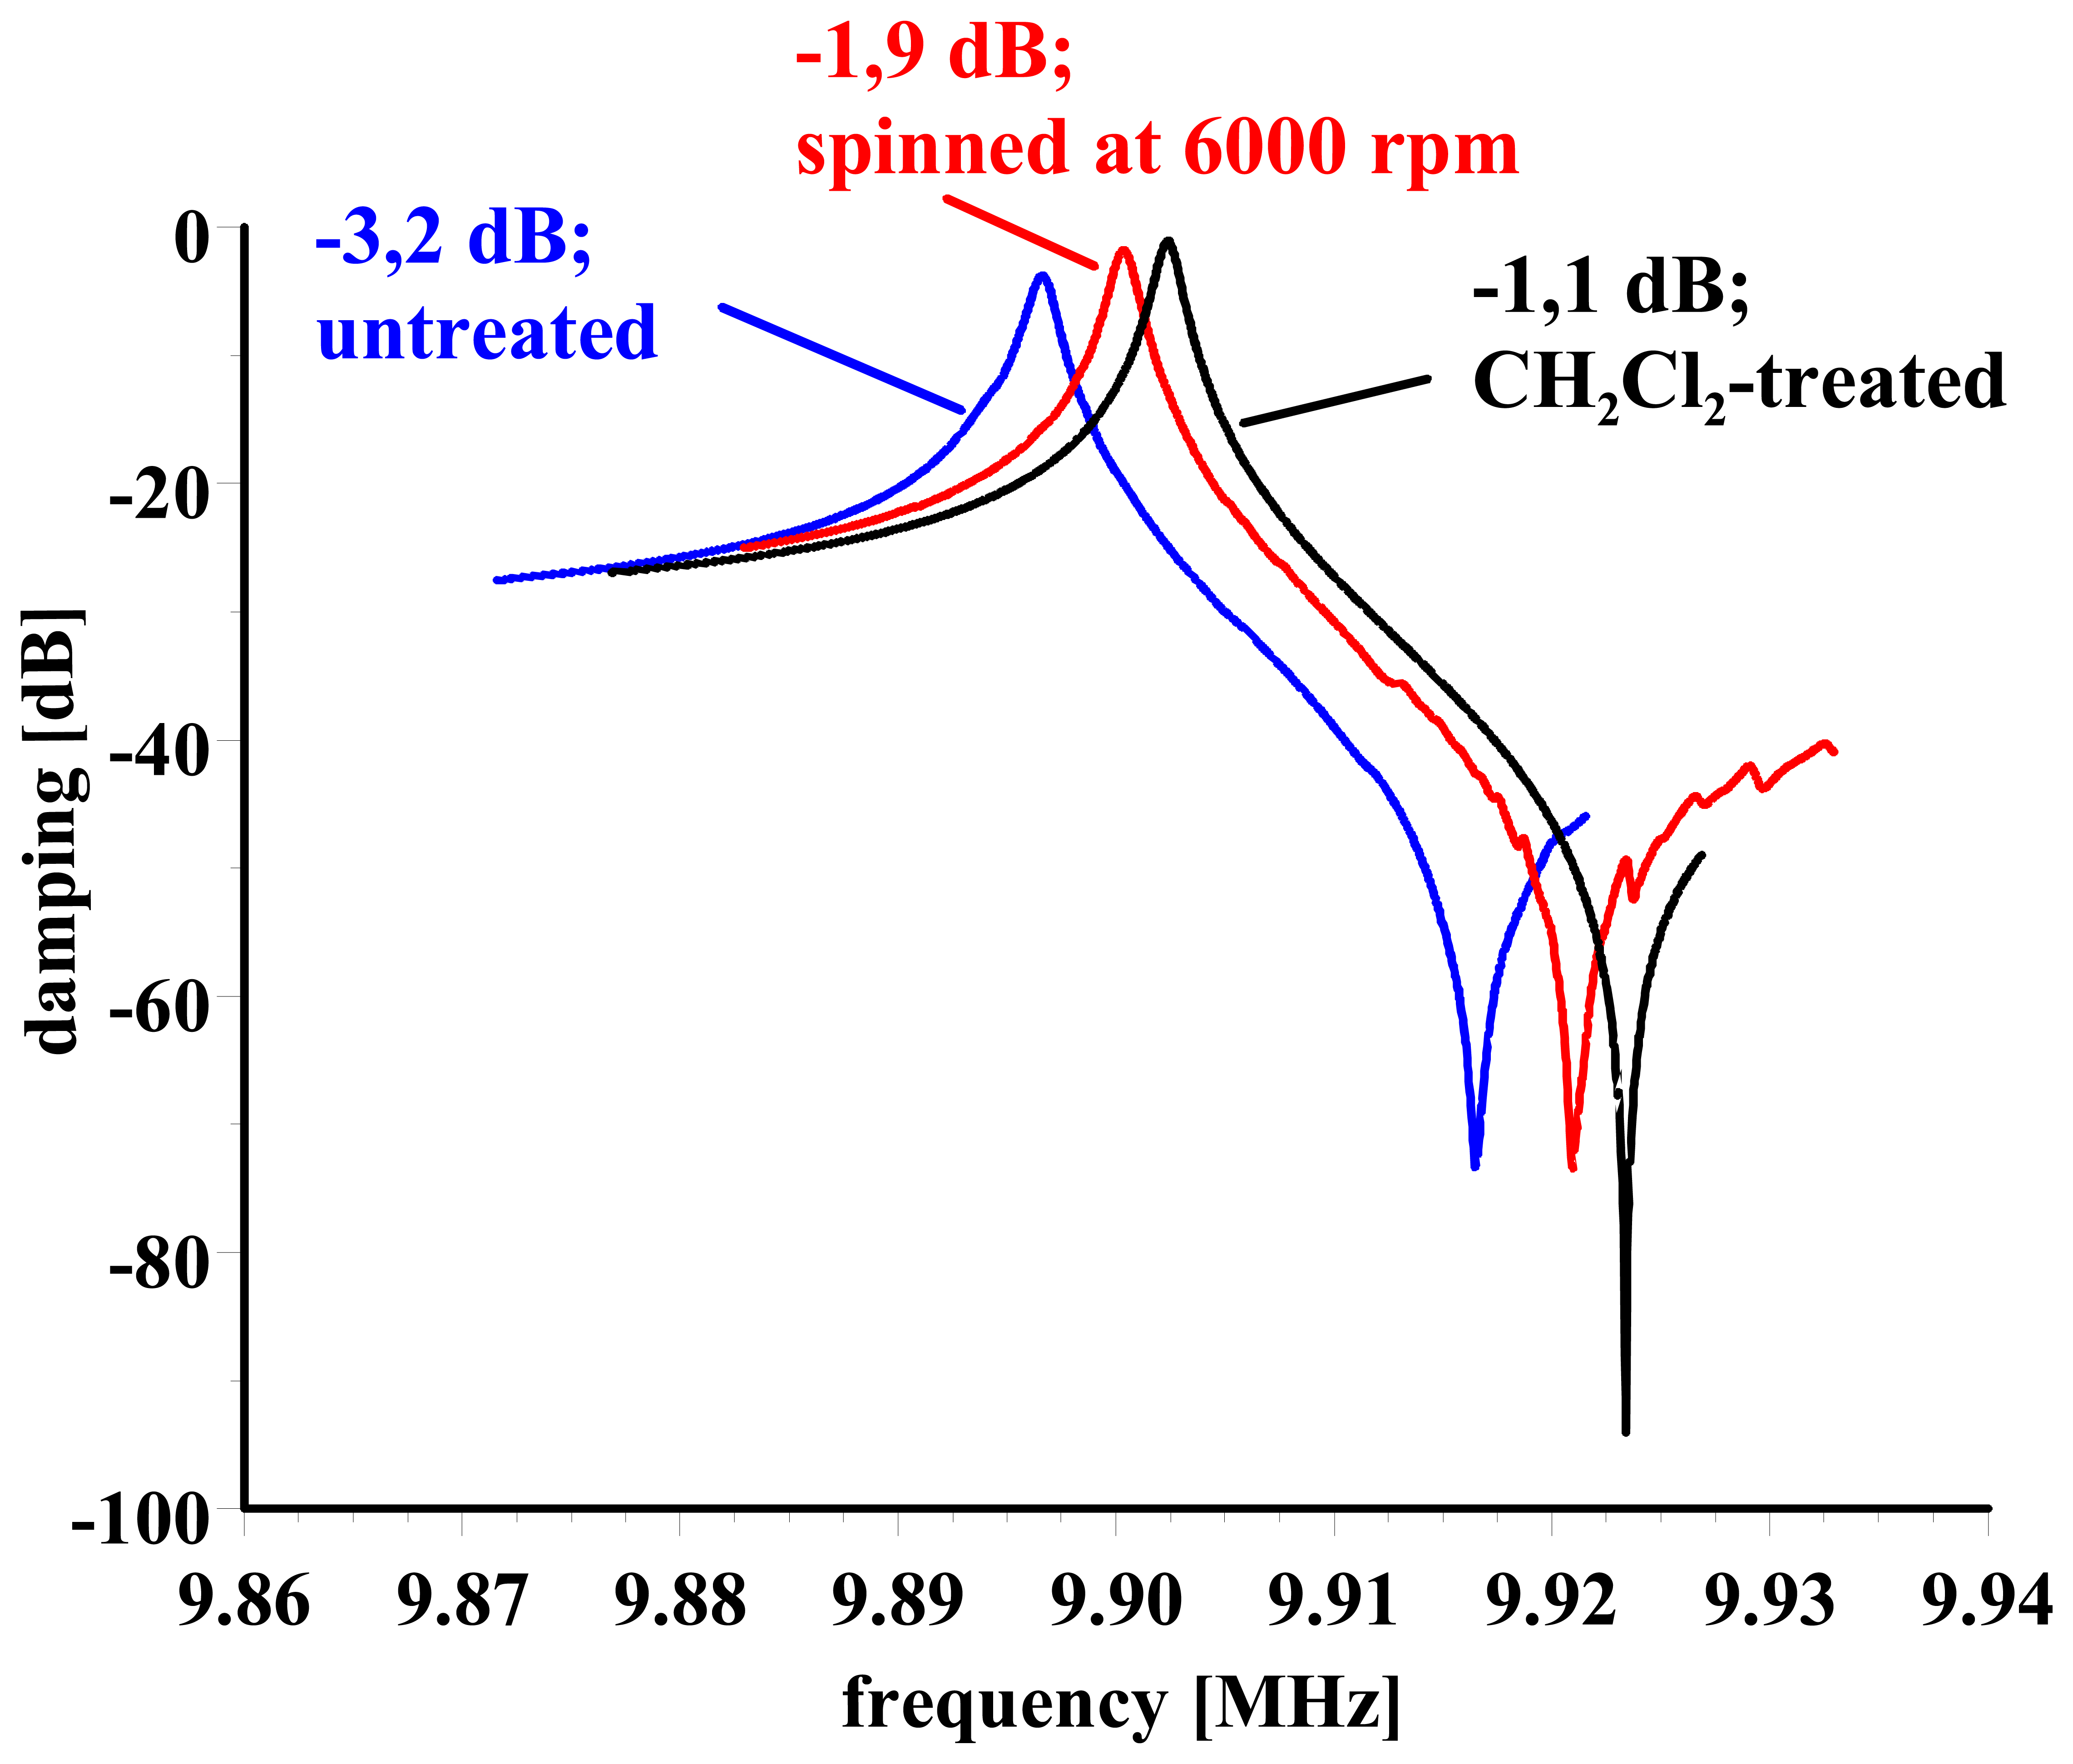
Fig. 2), a dilutor for the gold paste. After just one minute the roughness has dropped to 5 nanometres on an average. This reduction in surface unevenness has substantial impact on the electronic properties of the resulting devices, as can be seen in
Figure 3, where the impedance spectra obtained with a network analyzer for the three respective preparation methods are given: the as-prepared quartz has a damping of -3.2 dB, after spinning -1.9 are reached and exposing it to methylene chloride vapors leads to -1.1 dB. As the dB-scale logarithmic, these are substantial improvements. Lower electronic losses usually lead to a better electronic quality and frequency sharpness and therefore to reduced noise in the oscillator circuit.
3. Small Molecules
Molecular imprinting can lead to almost antibody-like selectivity (see e.g. for nandrolone imprints [
4]). One example for this is shown in
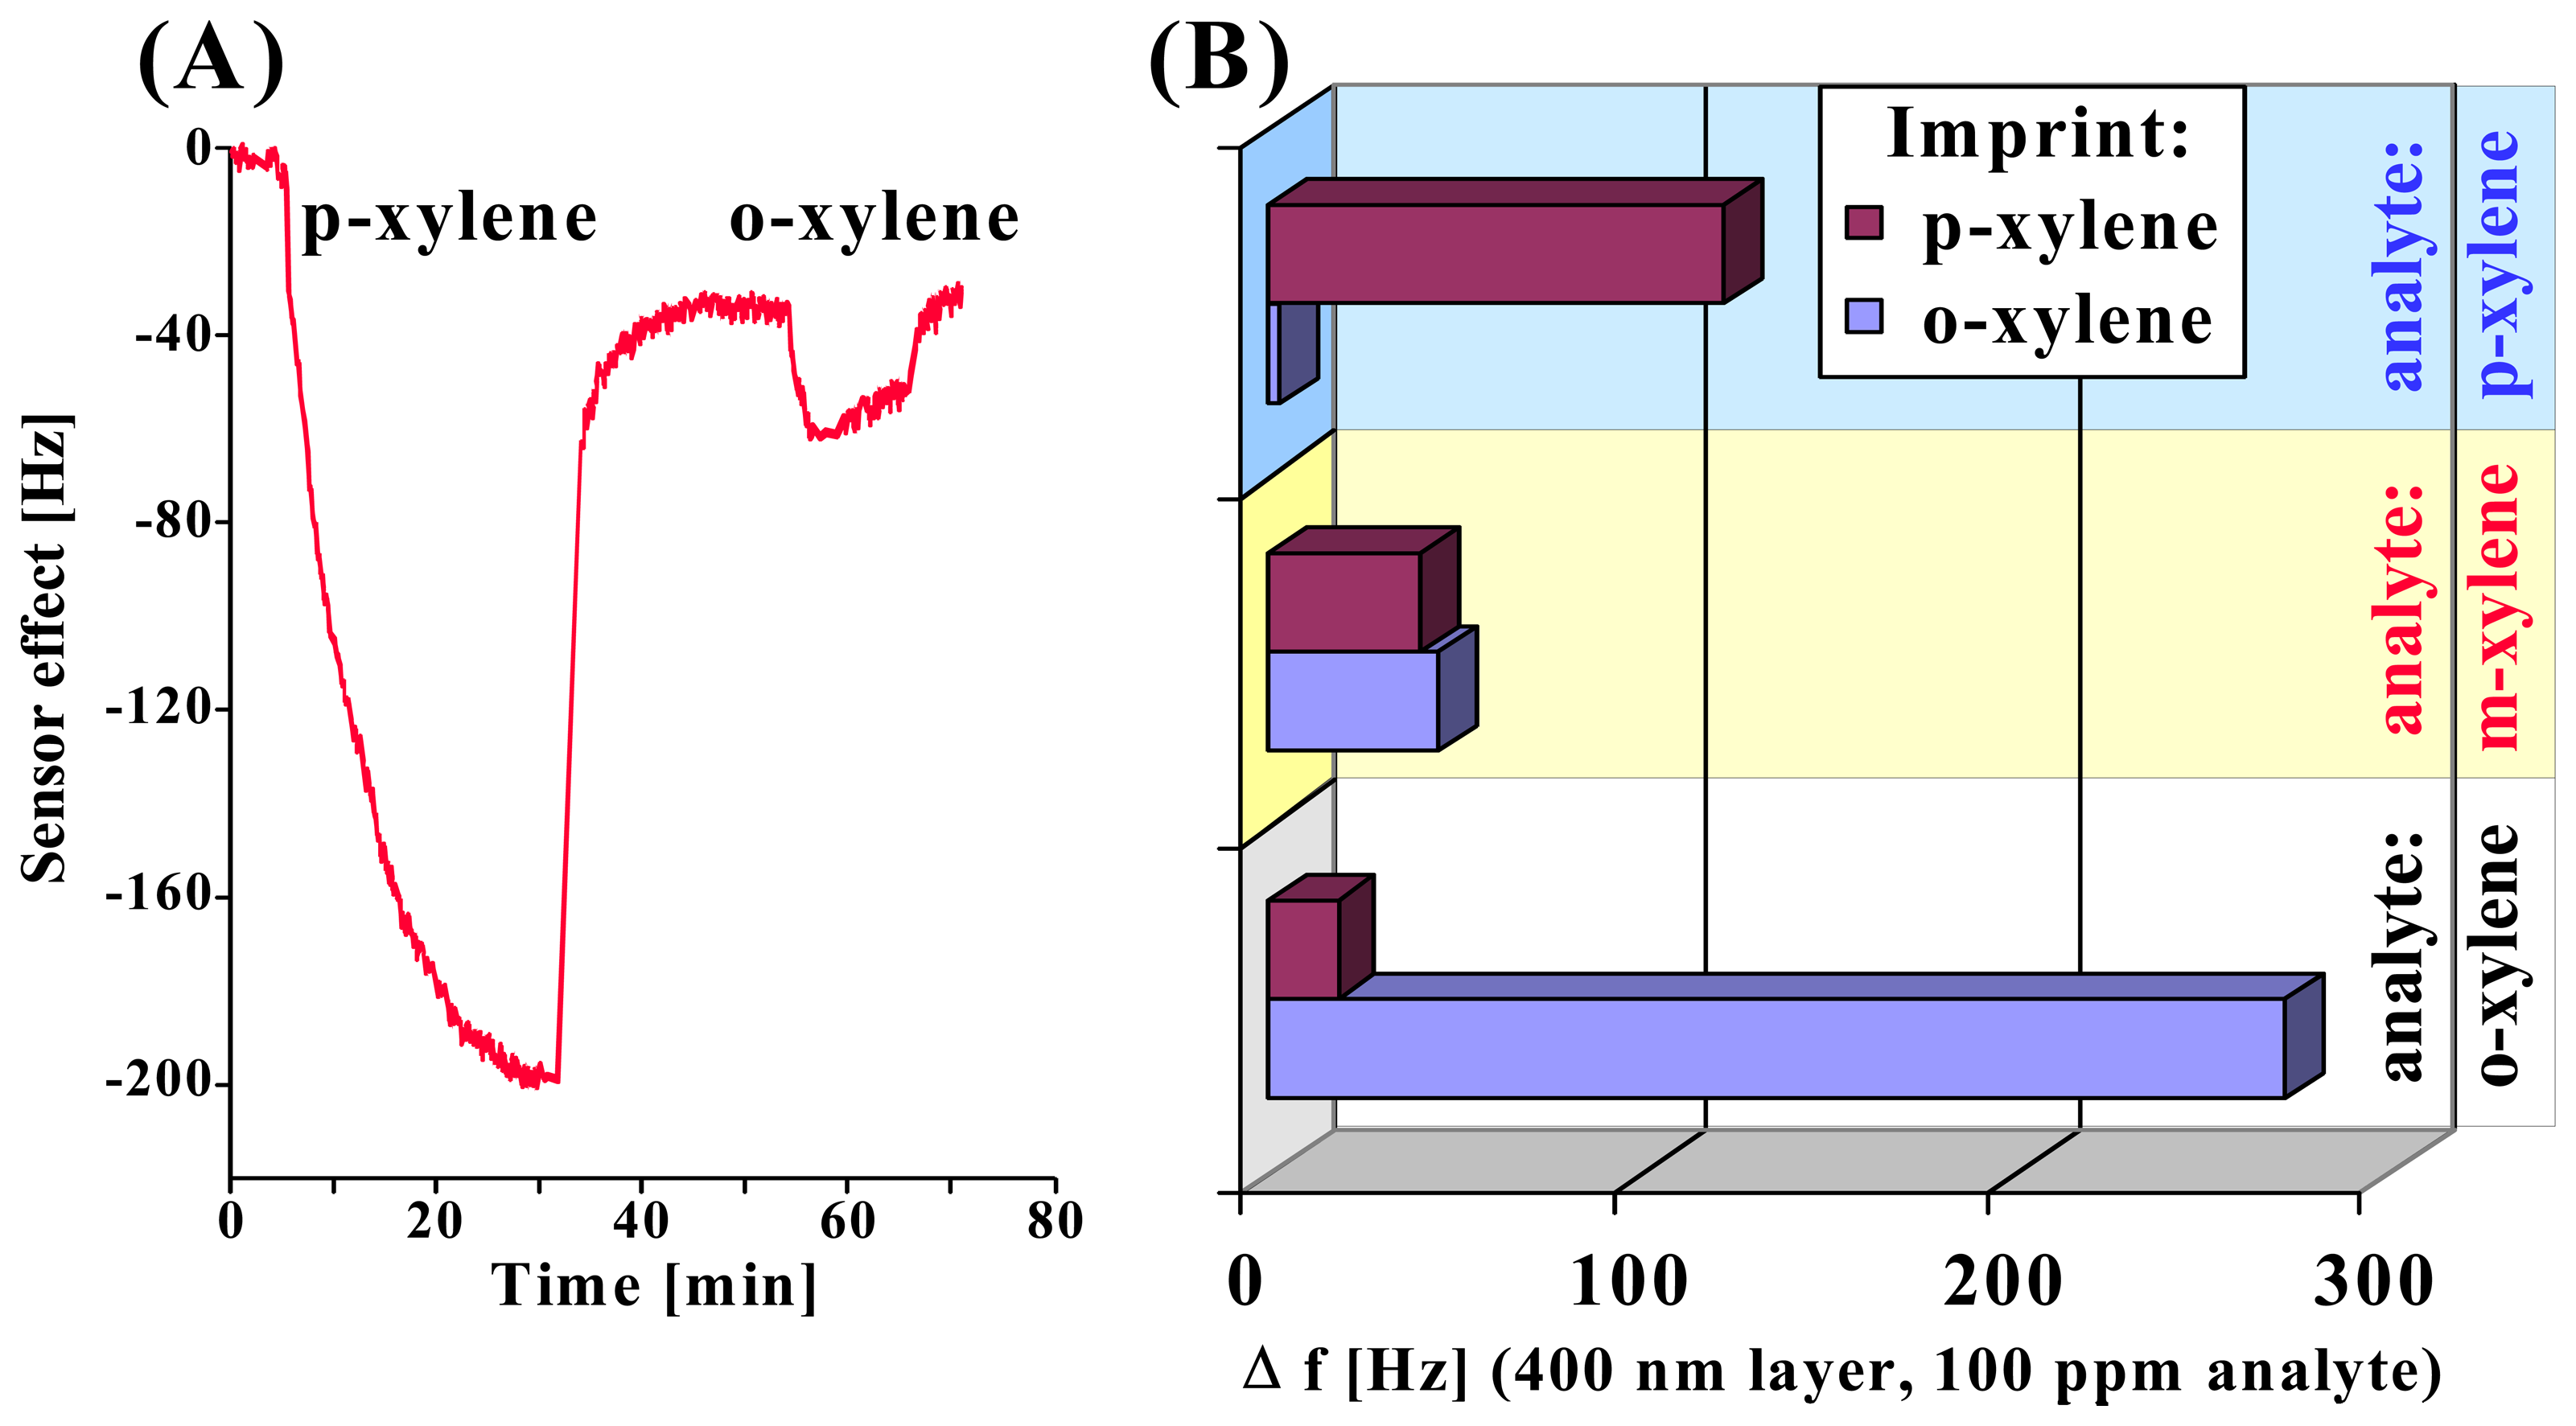
Figure 4: the left part – (A) shows the frequency responses of a 10-MHz-QCM coated with 8 kHz (i.e. 320 nm) of a p-xylene imprinted polyurethane layer towards p-xylene and o-xylene, respectively. Although the molar mass of the analytes as well as the vapor pressure are the same, the two compounds lead to very different sensor responses with a very appreciable selectivity factor. On the right-hand side – (B) – the selectivity of both the p- and the o-xylene imprint towards all xylene isomers is given. All sensor signals are normalized towards a layer thickness of 10 kHz (=400 nm) and an analyte concentration of 100 ppm in air. Both imprints clearly favor their respective template compound with very high selectivity over the other two components. In both cases the ortho/para-selectivity is somewhat superior to the one towards the m-isomer. A remarkable phenomenon, however, is the fact that both sensors lead almost to the same signal for m-xylene. Evidently, the geometrical difference between template and analyte – which is similar for both imprints – is correctly reproduced by the sensor responses.
One major advantage of imprinting techniques is the fact that they rely on self-organization processes to generate selectivity in a material. In contrast to the synthesis of supramolecular hollows (e.g. calixarenes [
5]) the geometrical shape and the chemical properties of the sensitive material are therefore determined directly by the analyte-to-be, which makes it possible to design chemical sensors for systems that would otherwise not be accessible. One example for this is oxidative degradation processes that e.g. occur in engine oils [
6]. Both organic and inorganic polymers have already proven their ability as coating materials for QCM. Further improvement of the sensor quality, however, can be achieved by using higher fundamental frequencies, as it is known that the frequency effects increase with the square of the device frequency [
7], whereas noise increases only linearly. We therefore coated shear-wave SAW devices based on Li tantalate as piezoelectric medium with titanate sol-gel-layers imprinted with capric acid that acts as model compound for oxidized base oil components. The table below shows the resulting frequency shifts both for the imprinted channel and a reference channel as a function of engine oil degradation time:
|
| Oil age: | 109 h | 136 h | 266 h |
|
| (1) Coated | -4.9 kHz | -4.3 kHz | -12.3 kHz |
|
| (2) Uncoated | 1.2 kHz | 4.6 kHz | 7.8 kHz |
|
| (3) Difference (1)-(2) | -6.1 kHz | -9.9 kHz | - 20.9 kHz |
|
The frequency of the uncoated sensor increases, whereas on the imprinted one it decreases. Of course, the reference signal in this case also depends mainly on the viscosity change during the degradation process in the test stand. However, the frequency shift is in contrast to a QCM, where an increase in sample viscosity always leads to a decrease in resonance frequency. On the other hand the imprint channel exhibits negative frequency shifts that are of course a consequence of mass incorporation into the sensitive layer. Once again, the sensor signal clearly depends on the degradation time of the oil. Compared with QCM measurements the sensor signals in this case are indeed much higher: titanate layers on QCM lead to a mass effect in the range of some kilohertz compared with some ten kHz for the STW.
4. Bioanalyte detection
Therefore, molecular imprinting leads to excellent sensitivities for the detection of small molecules, as shown with the examples above. Similar recognition abilities can be achieved when detecting biological species such as micro organisms [
8] or viruses [
9]. One example for this is the selective detection of different human rhinovirus serotypes: the HRV has an icosahedral structure with 30 nm diameter. Different serotypes have the same geometrical features; however, the amino acid composition of their outer protein shell differs from each other. These chemical differences can be detected with QCM. Our measurements with an HRV-1a imprint inducated a frequency effect of 370 Hz for HRV-1a, whereas HRV-2 leads to a responseof 110 Hz. Therefore, the imprint evidently prefers the template species with a very appreciable selectivity factor. This selectivity is even more impressive given the fact, that both analytes belong to the so-called minor group of HRV serotypes, whose members are chemically very closely related to each other.
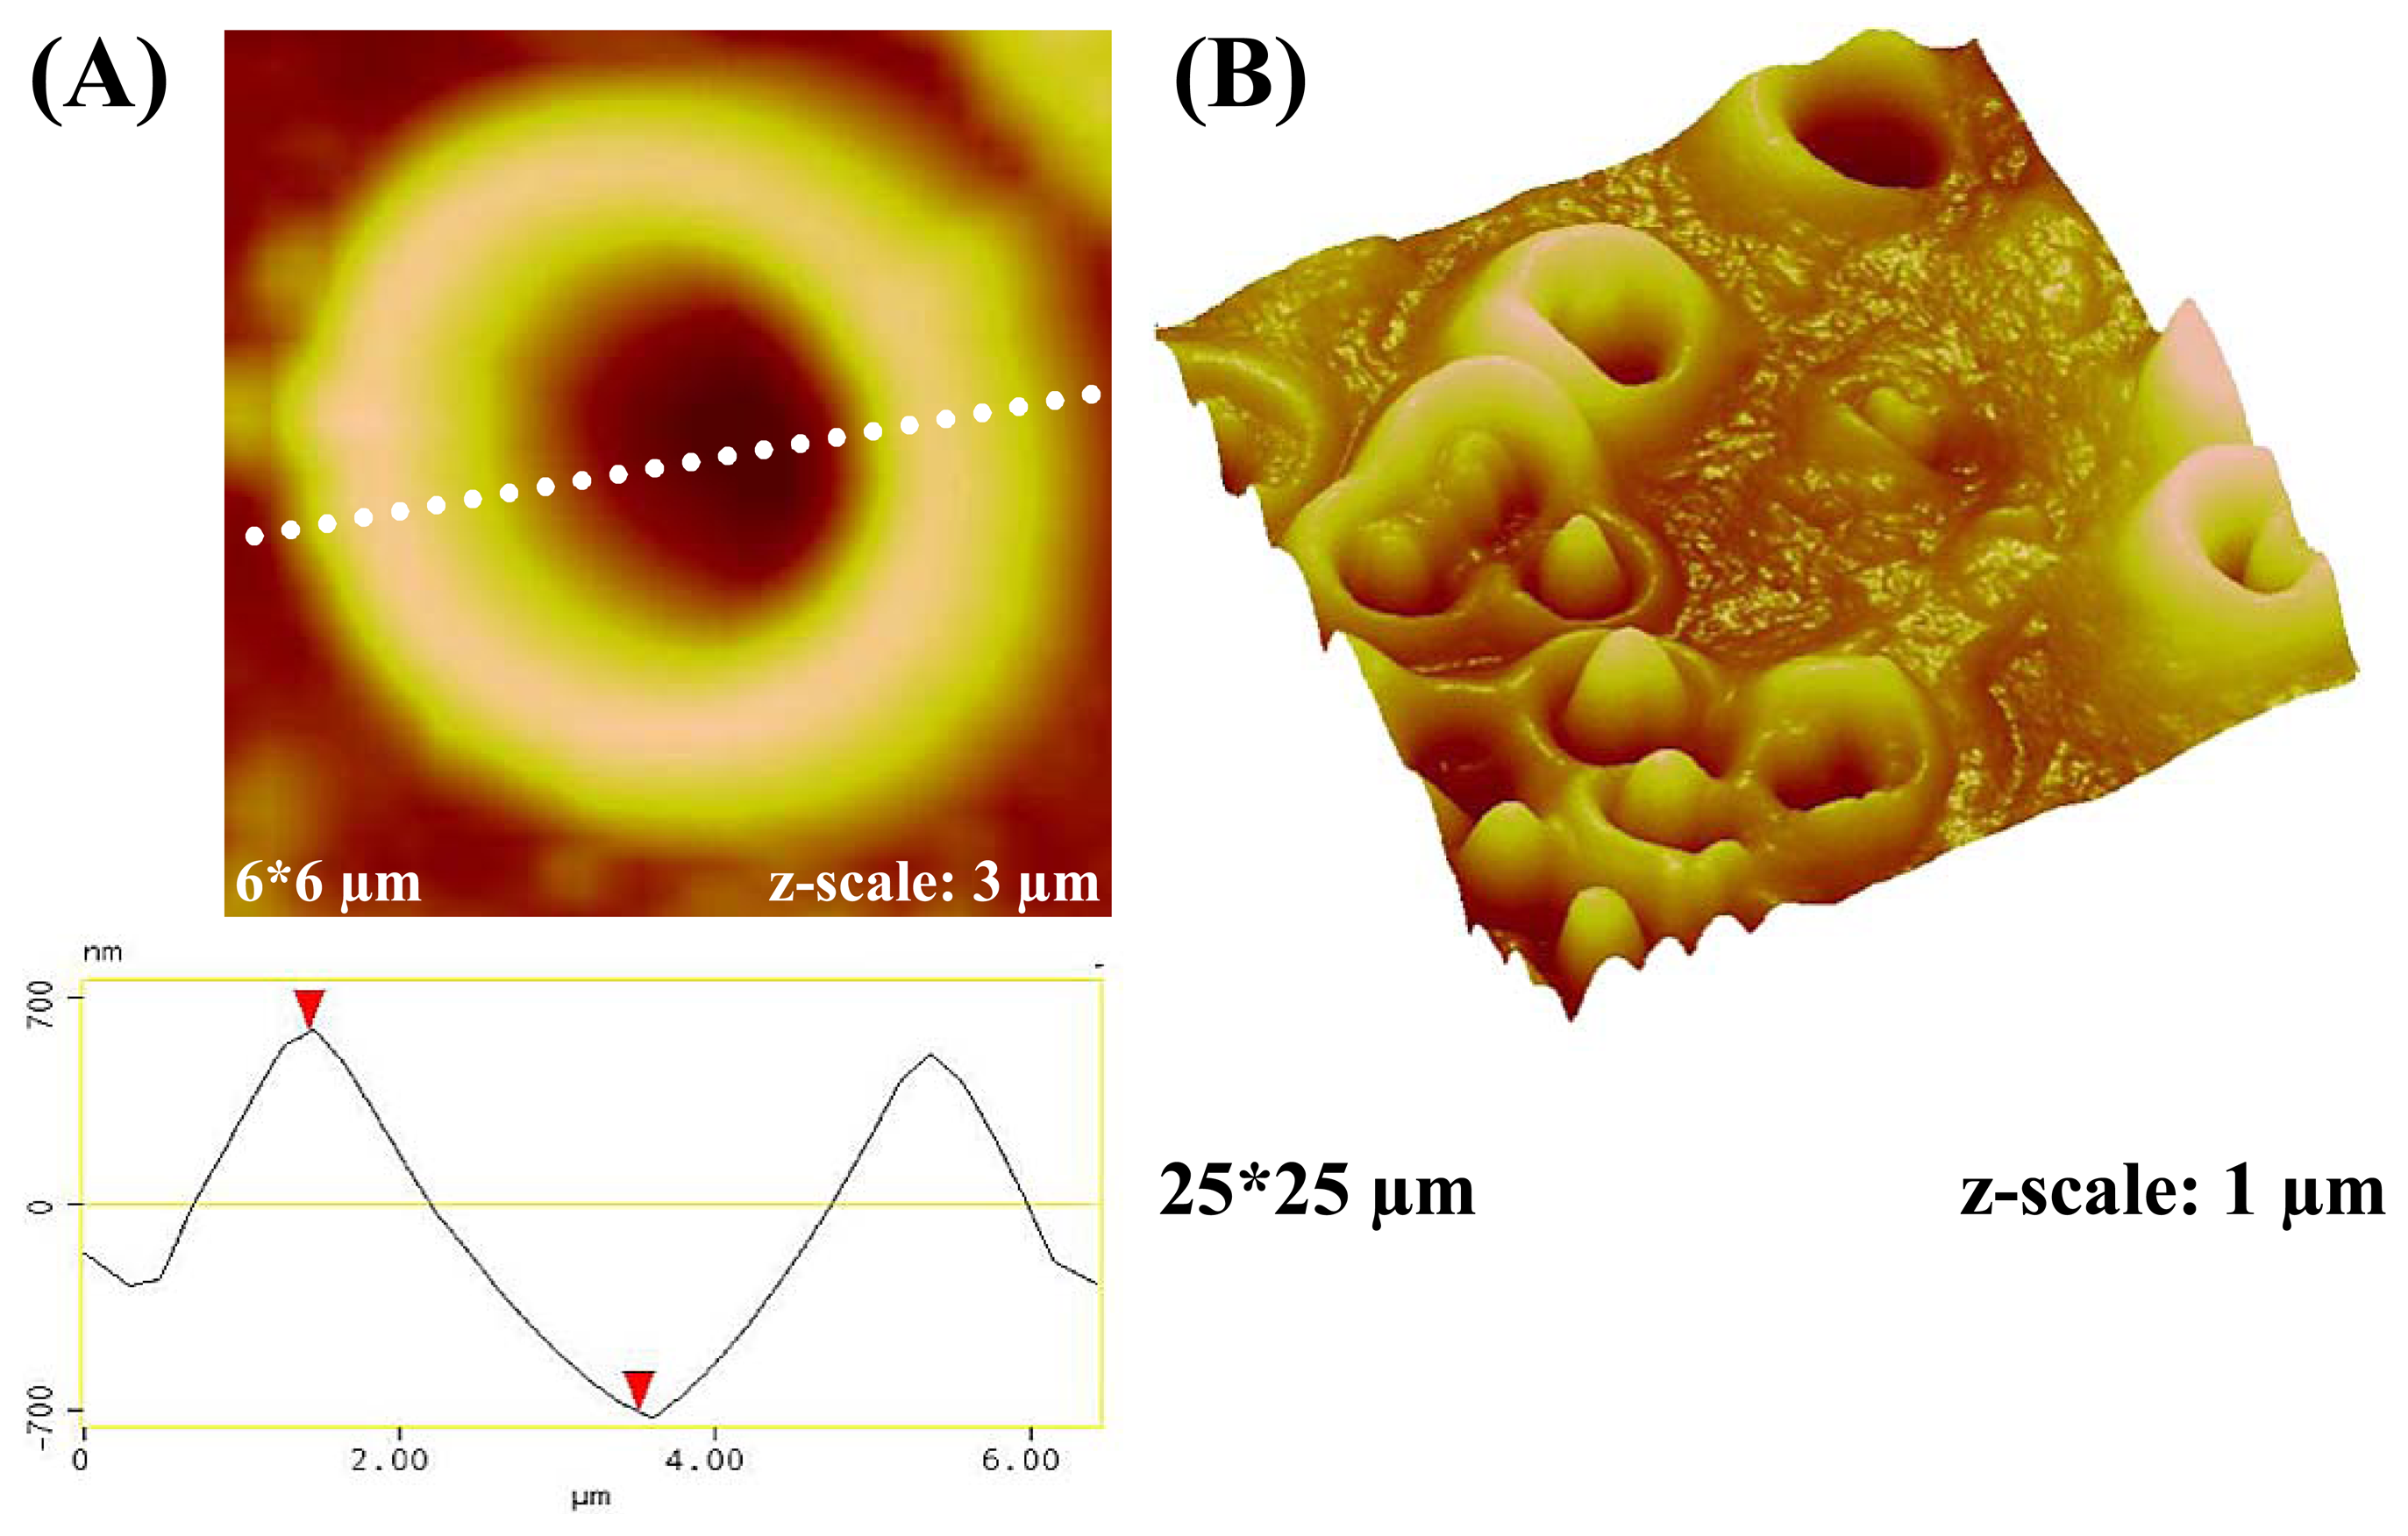
A further example for detecting geometrically similar species by imprinted layers via differences in surface chemistry is the selective sensing detection erythrocytes. Erythrocytes – the red blood cells (RBC) - are responsible for transporting both oxygen and carbon dioxide between lung and cells in human and animal organisms. They have a diameter of approximately 7μm (see also
Figure 5) but are very flexible and thus fit through the smallest veins. RBC's are classified in four blood groups (O, A, B, AB), with each of them being defined by a characteristic antigen on the cell surface. This is usually an oligosaccharide with six sugars, except for BG O that has one sugar less and is the precursor for all other groups (and thus present on any RBC). Groups A and B differ by the sixth sugar molecule, which is N-acteyl-D-galactosamine for A and D-galactoside for B.
RBCs are very elastic, so the quality of the imprint sites can be further improved by preparing erythrocyte ghosts [
10] as template, as they have higher form stability are easier to handle. Such ghosts consist exclusively of the outer membrane and are prepared by treating the cells with a hypertonic NaCl solution for a few minutes which makes cells bursting.
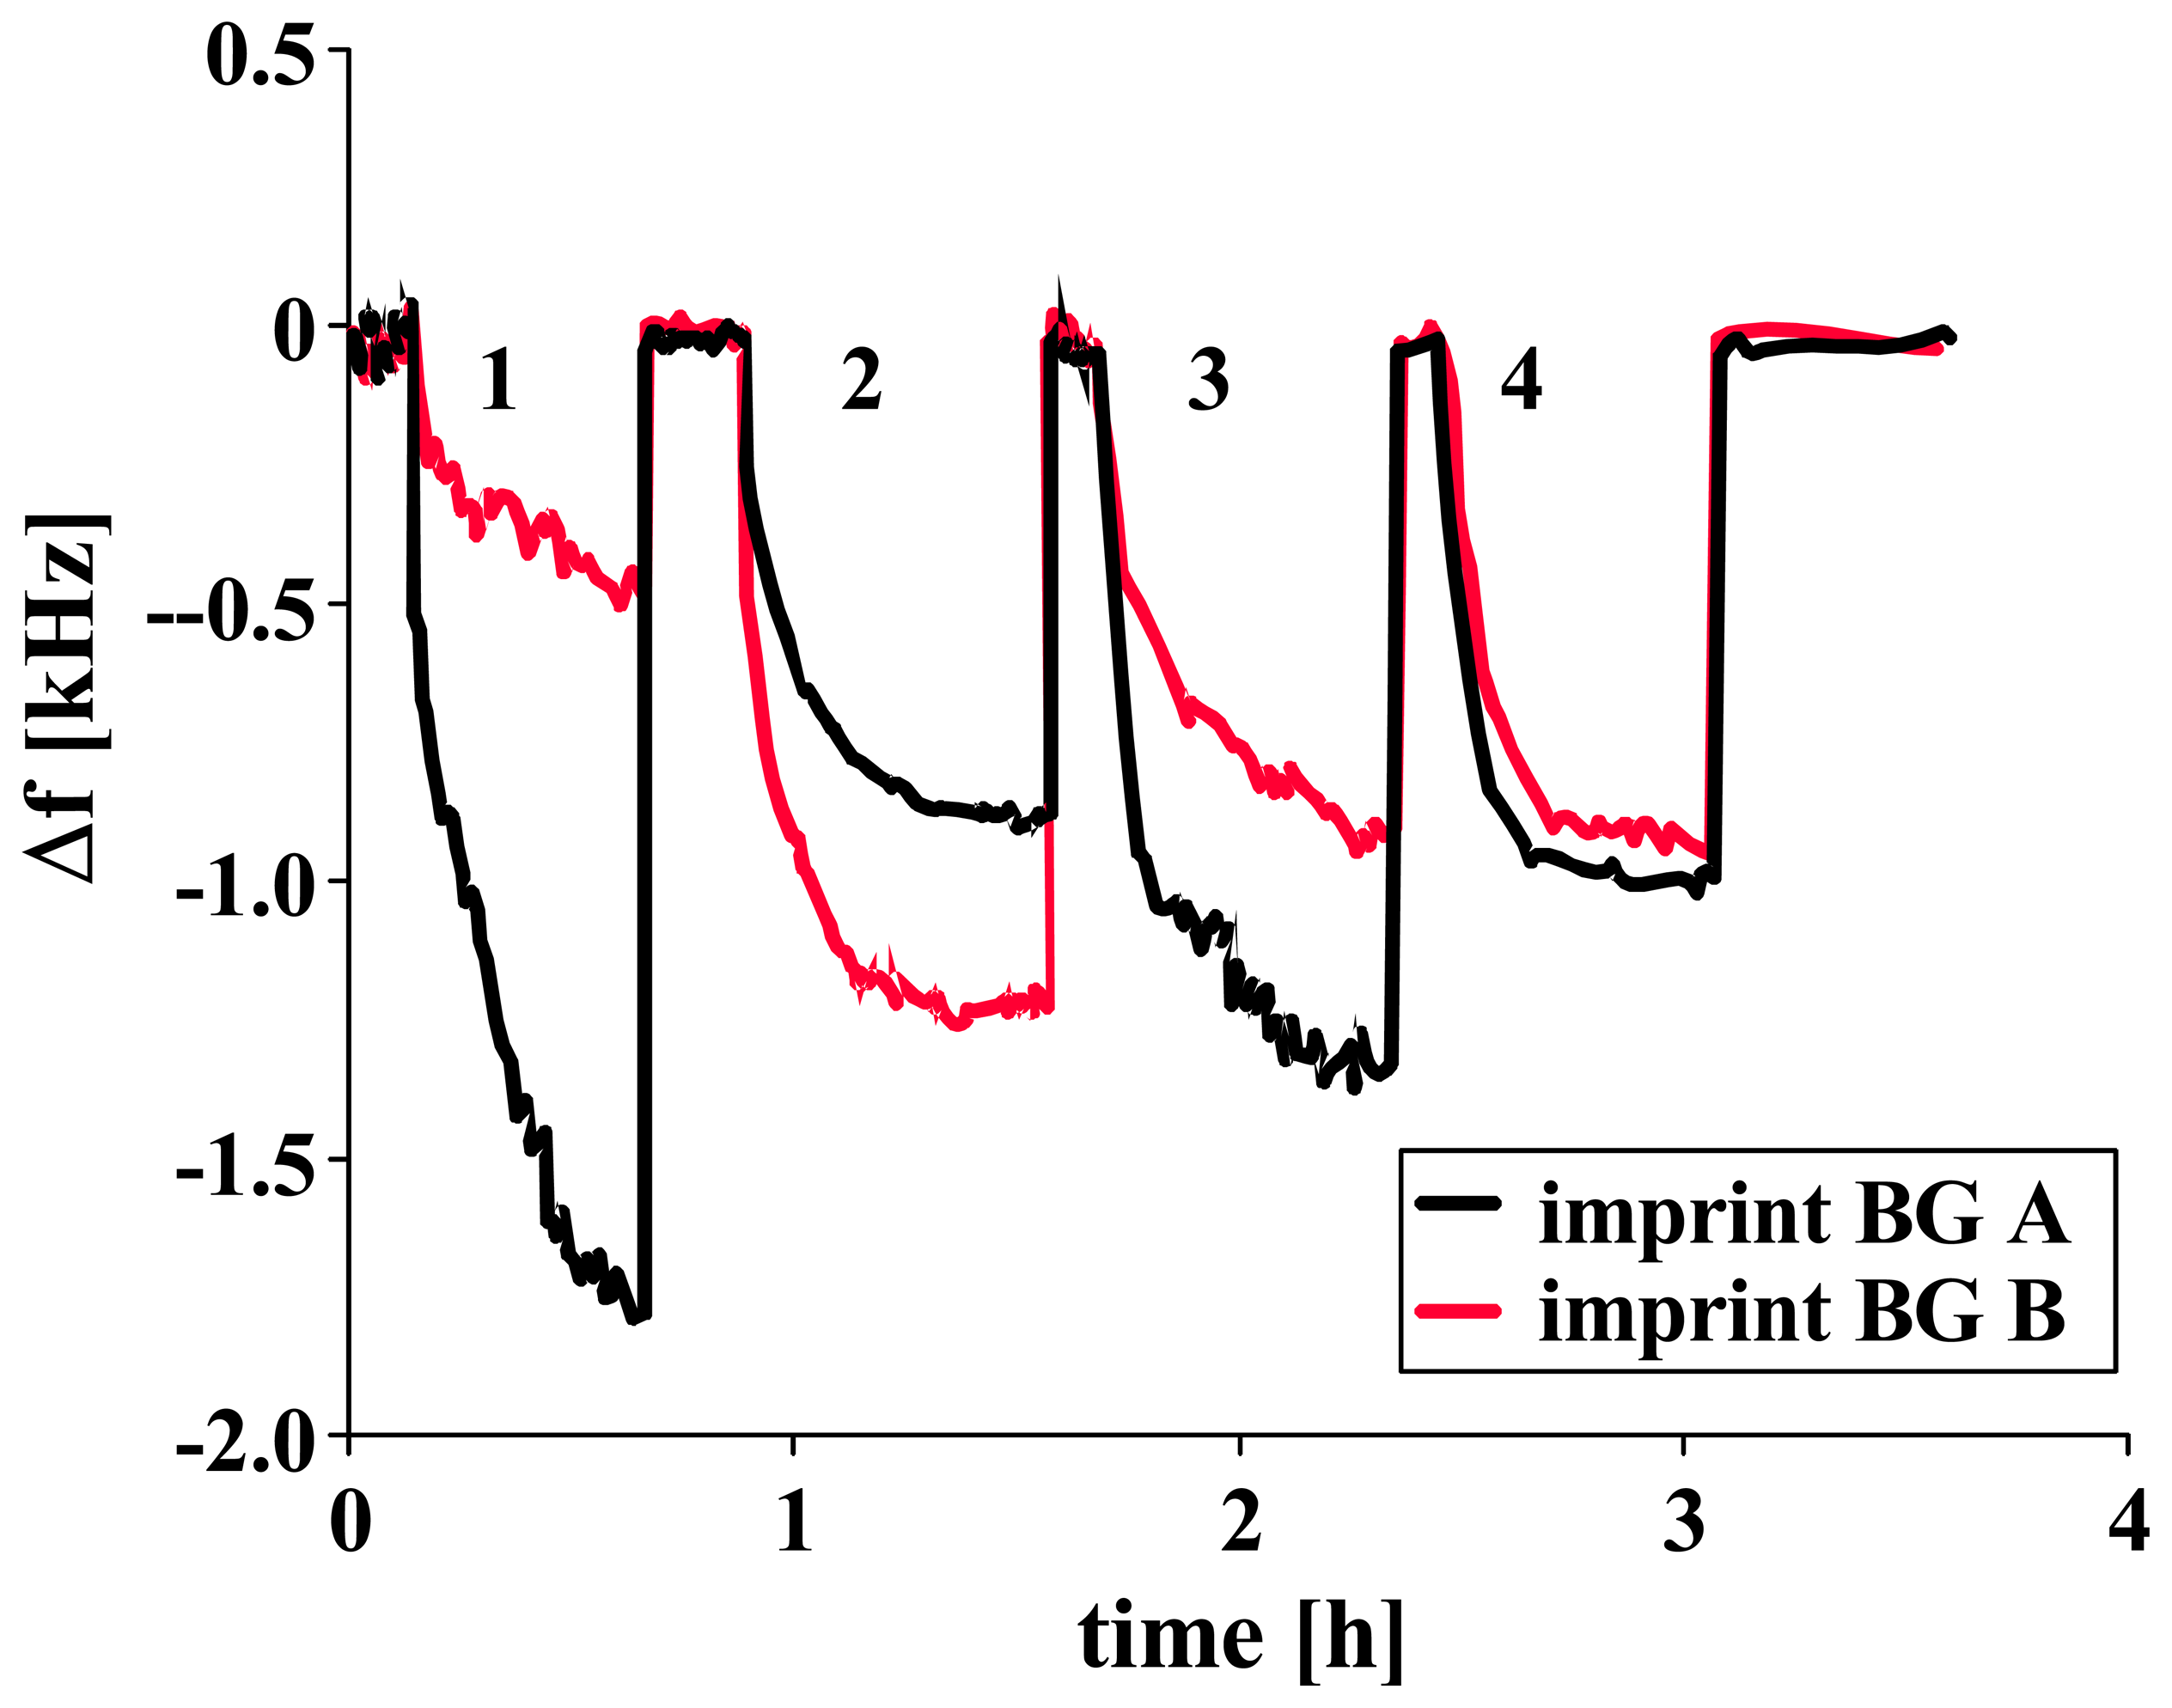
Figure 6 shows an AFM image of such a ghost in a polyurethane surface (A) and a respective imprint after washing with SDS (B). Due to the reduced elasticity, the pit in the middle of the cell is much more pronounced. Similarly, the structure is more accurately reproduced in the polymer surfaces. Ghost-imprinted polymers are excellently suited for erythrocyte detection, as can be seen in
Figure 7. Here, the QCM sensor curves are given for a quartz, where the electrodes have been coated with BG A and B erythrocyte ghost imprints, respectively, and exposed to suspensions containing RBCs of the four blood groups. Obviously each imprint clearly prefers the “own” template. The selectivity factor for blood group A is higher, because the antigen oligosaccharide concentration is higher for A than for B. However, both imprints yield similar signals for AB, which further supports chemical recognition, as AB erythrocytes contain both saccharides. Finally, the selectivity picture is completed for both imprints by the BG O signals, as each imprint clearly prefers the own template.
Conclusions
Imprinting strategies lead to highly selective polymers that have excellent properties for chemical sensor applications for analytes ranging from below 1 nm up to some μm. The ability to distinguish closely related species from each other is demonstrated with the selectivity between different xylene isomers on the molecular level. Larger analytes include different human rhinovirus (HRV) serotypes or erythrocytes of different blood groups. In both cases the analyte species share their geometrical features and differ exclusively by their respective surface chemistry. Nonetheless the surface imprints clearly distinguish both between different HRV serotypes and different blood groups. Imprints towards erythrocytes were realized by using cell ghosts as templates, because they are mechanically more rigid and stable and thus give more accurate images of the cell surface on the imprint. Finally, imprinting is also suitable for chemical sensing in highly complex mixtures, where very appreciable selectivity and sensitivity can be achieved by combining imprinted titanates with 100-MHz surface transverse wave resonators.
Experimental section
Xylene sensors
For the xylene imprints we mixed 210 μl of divinylbenzene (DVB), 90 μl of styrene, 3 mg of azo-isobutyronitrile (AIBN) and 4.4 mg biphenyl - a porogen - with 100μl template xylene and spin-coated the device of interest with it. Polymerization took place over night at 40°C in saturated solvent atmosphere. Finally, the biphenyl was removed by washing with o-xylene and drying at 150°C
Engine Oil Degradation
We synthesized degradation-sensitive titanate sol–gel layers by dissolving 50 μl tetrabutoxytitanate with 1 ml butanol and adding 10 mg of the template capric acid and 10 μl of water. After one hour pre-hydrolysis at 70 °C and three days at room temperature we added 6 μl of 0.1M HCl and 20 μl of water and heated at 70 °C for one hour followed by two days polymerization at room temperature. The resulting solution was drop-coated directly onto the sensitive area of the SAW.
HRV imprints
A diluted virus suspension in 10 mM Tris*HCl pH= 7.2 is used for stamp preparation. For this purpose 3 μl of this suspension are placed on a glass disc and incubated at 4°C for 30 min. Afterwards the stamp is spun off at 2000 rpm and covered with the modifier consisting of a 10 mM solution of phloroglucinol and phenylenediamine in THF. In parallel, a QCM is spin-coated with 15 μl of a 1:10 dilution of the polyurethane (50.4 mg bisphenol A, 11.1 mg phloroglucinol and 38.4 mg hexamethylene-diisocyanate) in THF at 3000 rpm to yield layer heights around 250 to 350 nm (10-14 kHz). The stamp is then immediately pressed into the material. After 48 hours of hardening, the QCM is put into water at 50°C for approx. 1h to lift off the stamp followed by stirring in 0.5 M HCl to unhinge the viruses from the polymer.
Erythrocyte imprints
Erythrocyte ghosts were produced by using the osmotic effect (lysis) by treating the RBC in a hypertonic NaCl solution for some minutes, which makes cells bursting. The cell contents were washed out by centrifugation in distilled water until the supernatant solution remained clear. After self-assembling on a stamp, the ghosts were pressed into a spin-coated polyurethane film consisting of 50.4 mg bisphenol A, 11.1 mg phloroglucinol and 38.4 mg hexamethylene-diisocyanate that have been mixed at room temperature and directly used for spin-coating. After polymerization over night, the stamp material can be removed by washing with hot water and the template with a 0.5% solution of sodium dodcyl sulfate in water.
Measurements
We prepared the QCM devices by screen printing the desired electrode pattern onto an AT-cut quartz blank and burning it at 400°C. For the final sensor setup, the quartz is introduced into a custom-made oscillator circuit as frequency-determining element. The resonance frequency is observed by the means of a laboratory frequency counter with a resolution of 0.1 Hz and transferred to the computer with a custom-made software.
AFM-images
A Veeco/digital instruments Nanoscope IIIa records all the images presented in this publication. All image correction was done with the AFM control software.

 and
and 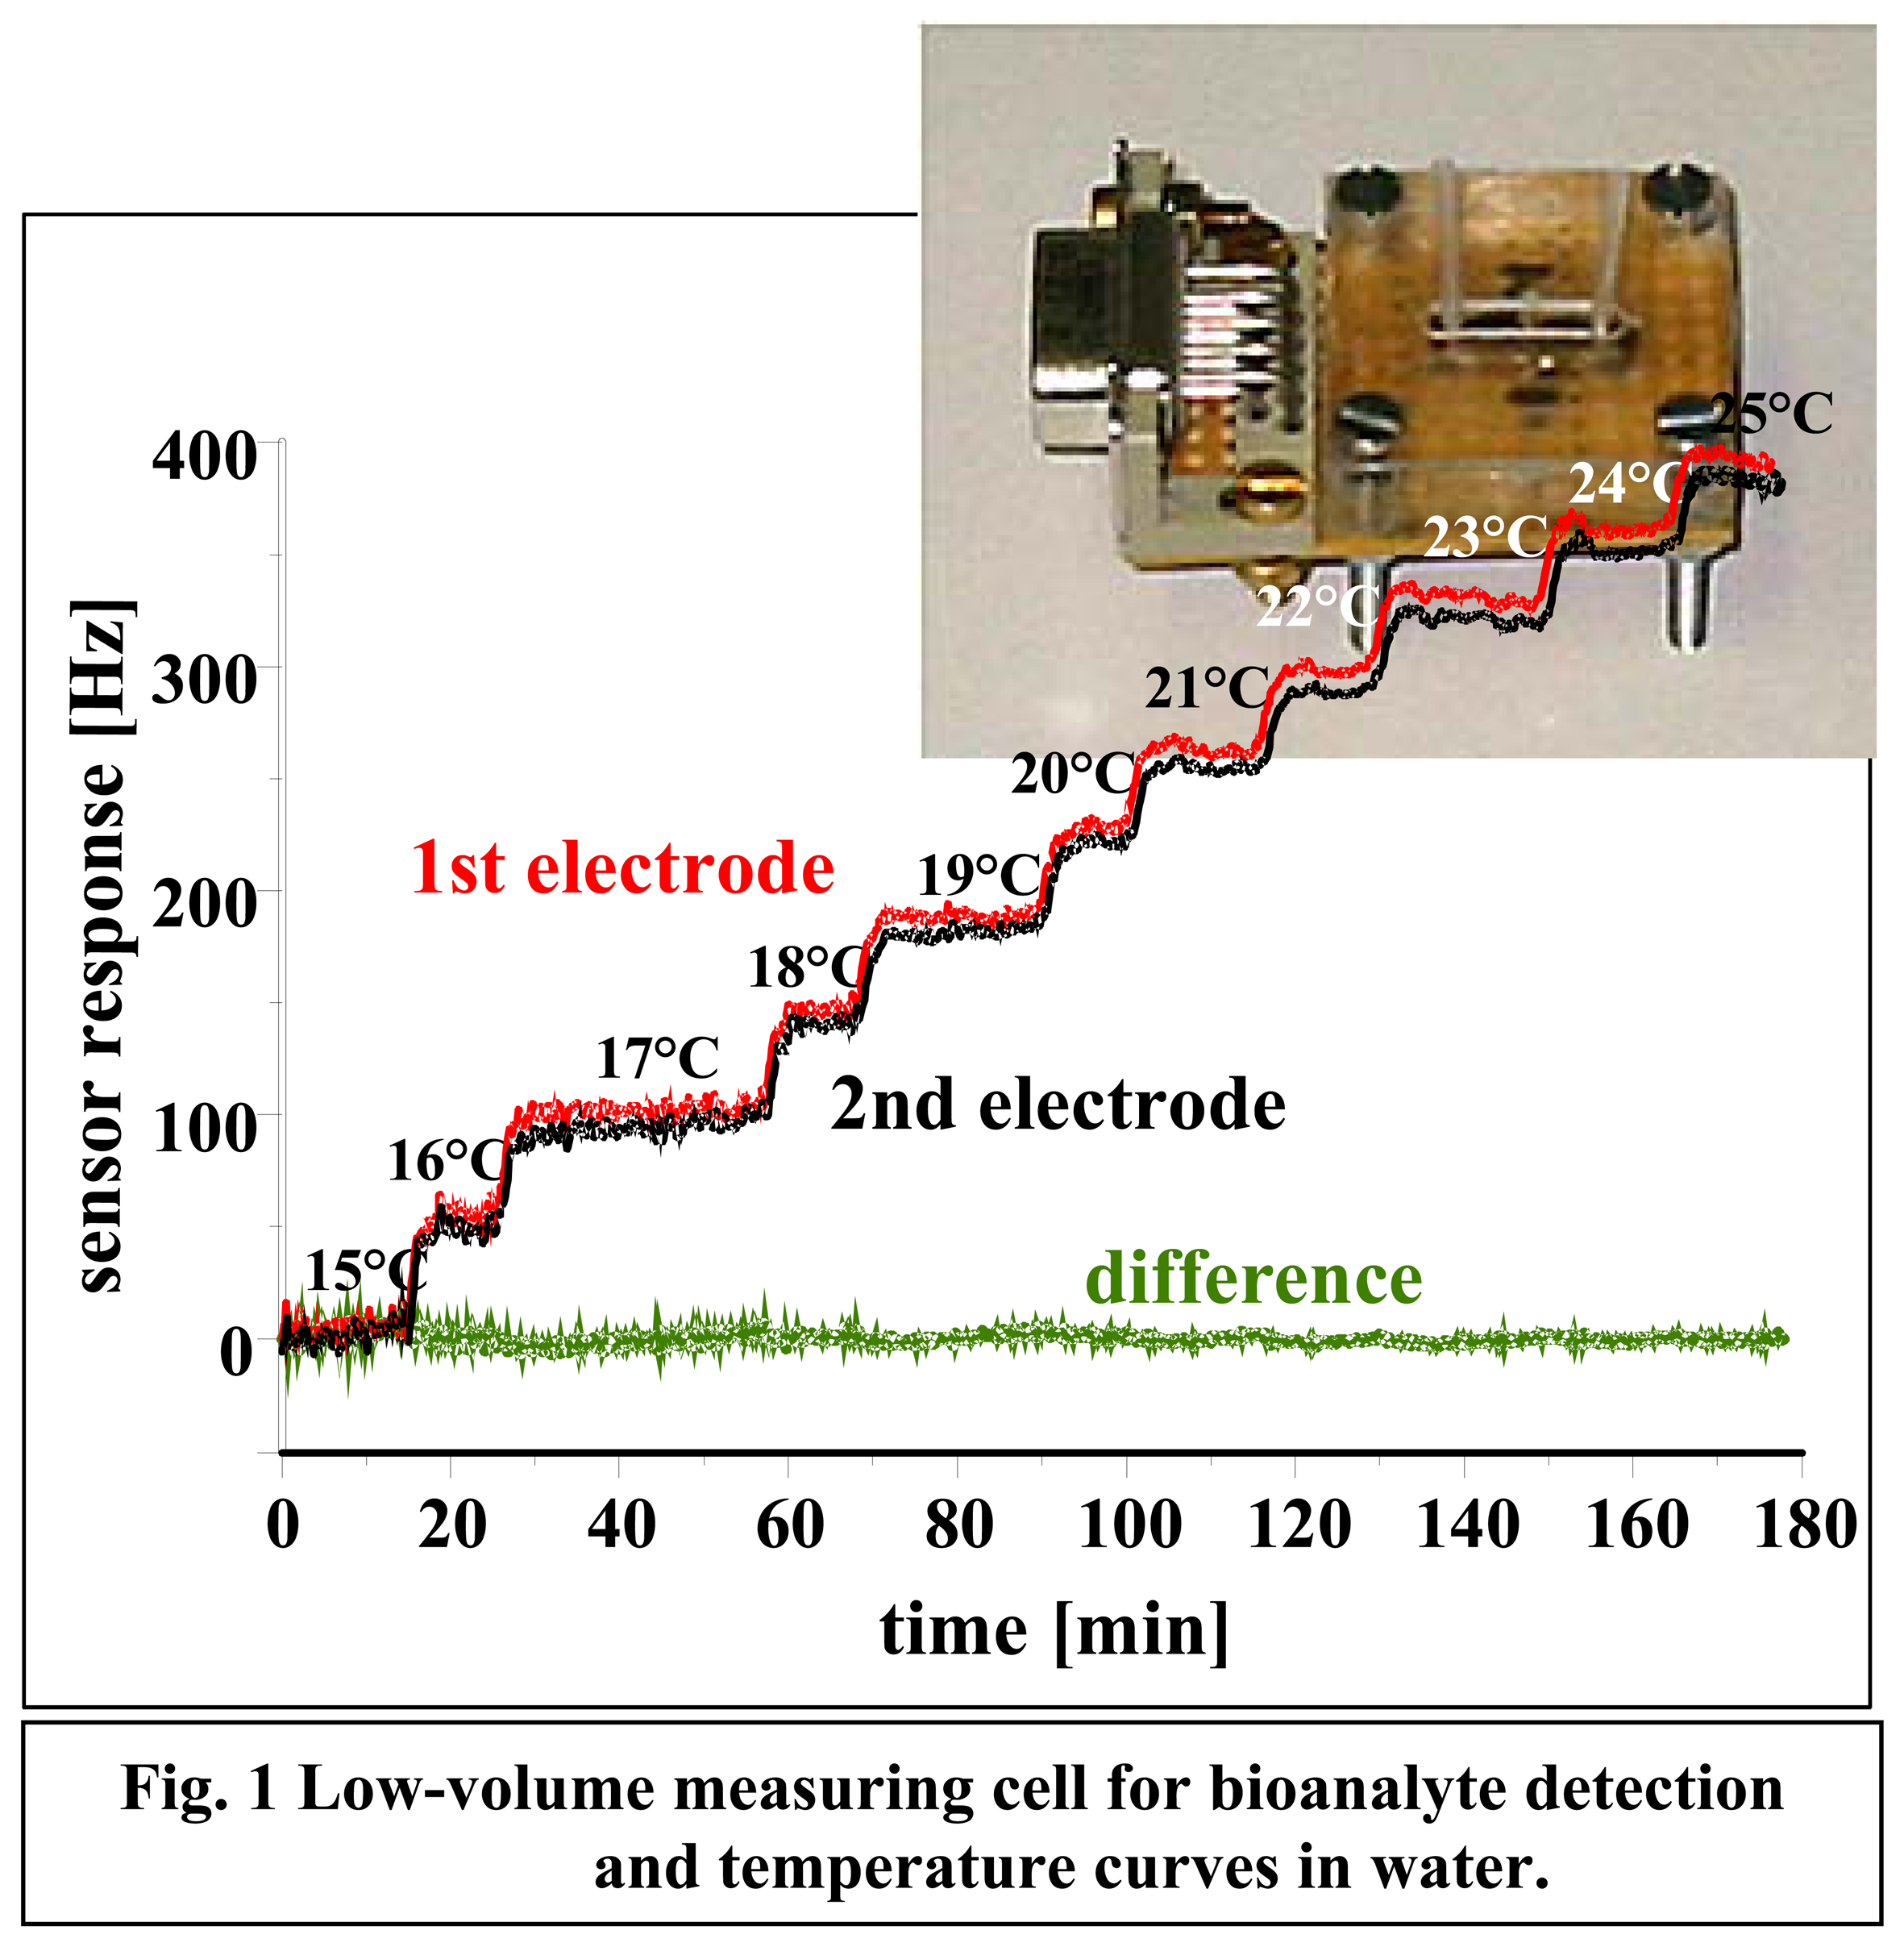


