Classification of Chinese Yellow Wines by ChemometricAnalysis of Cyclic Voltammogram of Copper Electrodes

Department of Biomedical Engineering, Zhejiang University, 38 ZheDa Road, Hangzhou 310027, P.R. China
*
Author to whom correspondence should be addressed.
Sensors 2005, 5(12), 529-536; https://doi.org/10.3390/s5120529
Submission received: 16 November 2005
/
Accepted: 27 November 2005
/
Published: 7 December 2005
Abstract
:A Chinese yellow wine classification method is proposed based on chemometric analysis of voltammogram of copper electrode. The main components in Chinese yellow wine are alcohol, amino acids and carbon hydrates. In strong alkaline solution copper electrode shows rich voltammetric responses to these components. Principal component analysis is employed to analyse voltammetric response of copper electrode to six Chinese wine samples in strong alkaline solution. The score plots show good discrimination of these wine samples. In order to compress the original voltammetric data, a windowed time slicing method is investigated in this study. It greatly reduces the input data number and the resulted PCA plot still has good discrimination ability.
Introduction
Electronic tongue, which is a mimic of mammalian gustation system, gives a qualitative evaluation of the tested samples [1-5]. It has been widely used for food analysis, process control, etc. Normally an electronic tongue comprises of a group of sensing elements and suitable chemometric algorithm that generates pattern recognition plots for simple or complex taste. The sensing elements should have partial specificity so that they respond broadly to a range of chemical compound, rather than to a specific one. The electronic tongue sensors usually are based on electrochemical methods, especially voltammetric method due to its high sensitivity and versatility, with a choice of potential range, wave form and electrode material. Winquist et al developed an electronic tongue for discrimination of tea [6]. The sensing elements in this electronic tongue are iridium, platinum, and rhodium electrodes. Large amplitude pulse voltammetry, small amplitude pulse voltammetry and staircase voltammetry were applied to these electrodes and principal component analysis (PCA) was used to evaluate the data. Winquist et al also developed an electronic tongue which is capable to monitor the freshness of milk [7,8]. In this case, five different electrodes: gold, platinum, palladium, iridium and rhodium were employed. Parra et al reported an electronic tongue devoted to the discrimination of red wines [9]. It consists of an array of electrochemical sensors made from carbon paste electrodes modified with three rare-earth bisphthalocyaninate compounds, including lutetium, gadolinium, and praseodymium bisphthalocyaninates. The voltammograms indicates that each sensing unit provides a particular response to each class of wine. In these approaches, the electronic tongues consist of an array of electrodes which have overlapped sensing properties.
Mikkelsen and Mikkelsen [10] proposed to classify beverage samples based on chemometric analysis of square wave voltammograms of unmodified single electrode. Their results show the discrimination of different juice samples with chemometric analysis of square wave voltammogram of platinum electrode. Here, the cross-selectivity of the sensor is obtained by the voltage scan during the voltammetry. Different components in the sample have different redox activities and are oxidized or reduced at the different potentials. The overall voltammogram is the colligated results related to all components in the tested sample. The advantage of this approach is that only one electrode is needed, which facilitates the implementation of electronic tongue. Nevertheless, the information available for further chemometric analysis is somehow limited. The selection of a suitable electrode plays an important role in this approach.
Chinese yellow wine, sometimes also called rice wine, is a main wine consumed in China, especially in South China. This rice brew is made from glutinous rice, wheat and pure water. The quality of Chinese yellow wine depends on the material used, ferment technology and also preservation and normally is judged by a human panel test. The main components of Chinese yellow wines are alcohol, amino acids and carbon hydrates. All these components are electrochemical active at copper electrode in alkaline solution [11,12]. In this paper, we report an electronic tongue for classification of Chinese yellow wines based on chemometric analysis of cyclic voltammogram of copper electrode. This approach is quite easy to be implemented and according to our knowledge, there is no such report in literatures up to now.
Experimental
The wine samples under study are six Chinese yellow wines produced in Shaoxing, Zhejiang Province, China and were purchased in local supermarkets (see Table 1). Three wines are Tower Brand with age of one, three and five years respectively. Another three wines are Kuaiji Mount Brand and the ages are one, three and five years.
Voltammetric measurements were performed by a CHI 660 electrochemical work station from CHI Instruments Inc., USA. The electrochemical cell consists of three electrodes. The working electrode was a pure copper foil (purity 99.999 %, from Guoyao Group Ltd, Shanghai, China) with working area of 4 mm2. Platinum electrode and silver/silver chloride electrode from CHI Instruments Inc., USA were used as the counter and reference electrode, respectively. The electrolyte used is either pure wine samples or a mixture of 4 ml 1 M NaOH and 1 ml tested wine sample. The measurements were performed at 25 °C room temperature. When not used, the wines were also kept at room temperature in dark.
All process control and data collecting were carried out using an IBM PC compatible computer via a RS232 series port communicating to the CHI electrochemical analytic station. During the voltammetry, the sample ratio is one data point per 1 mV.
A non-supervised multivariate method, principal component analysis (PCA), was used for the analysis of the voltammetric signals. During the measurement, each wine sample was divided in aliquots and then mixed with NaOH to obtain six replicates of each sample. The vials were measured in a random order. PCA was carried out in MatLab with a dedicated program developed in our laboratory. Two approaches were used to organize the PCA input matrix. In the first approach, the original anodic waves were used as the PCA input data. In the second approach, the original data were pre-processed by a windowed slicing method to reduce the amount of data processed by PCA.13
Results and Discussion
Preliminary voltammetric experiments were carried out in pure Chinese yellow wine samples with different electrode materials such as platinum, gold, and copper with potential range between -0.45 V to 0.8 V versus silver/silver chloride electrode. In all these cases, only electrode double layer capacitance charging/discharging current were observed, no any redox components detected. The main components in Chinese yellow wines are alcohol, glucose, maltose, polysaccharide, amino acids and pH value of these wines is around 5. Our results suggest that it is impossible to detect these components with platinum, gold, and copper electrode in acidic solution, which is in agreement with the literature report.
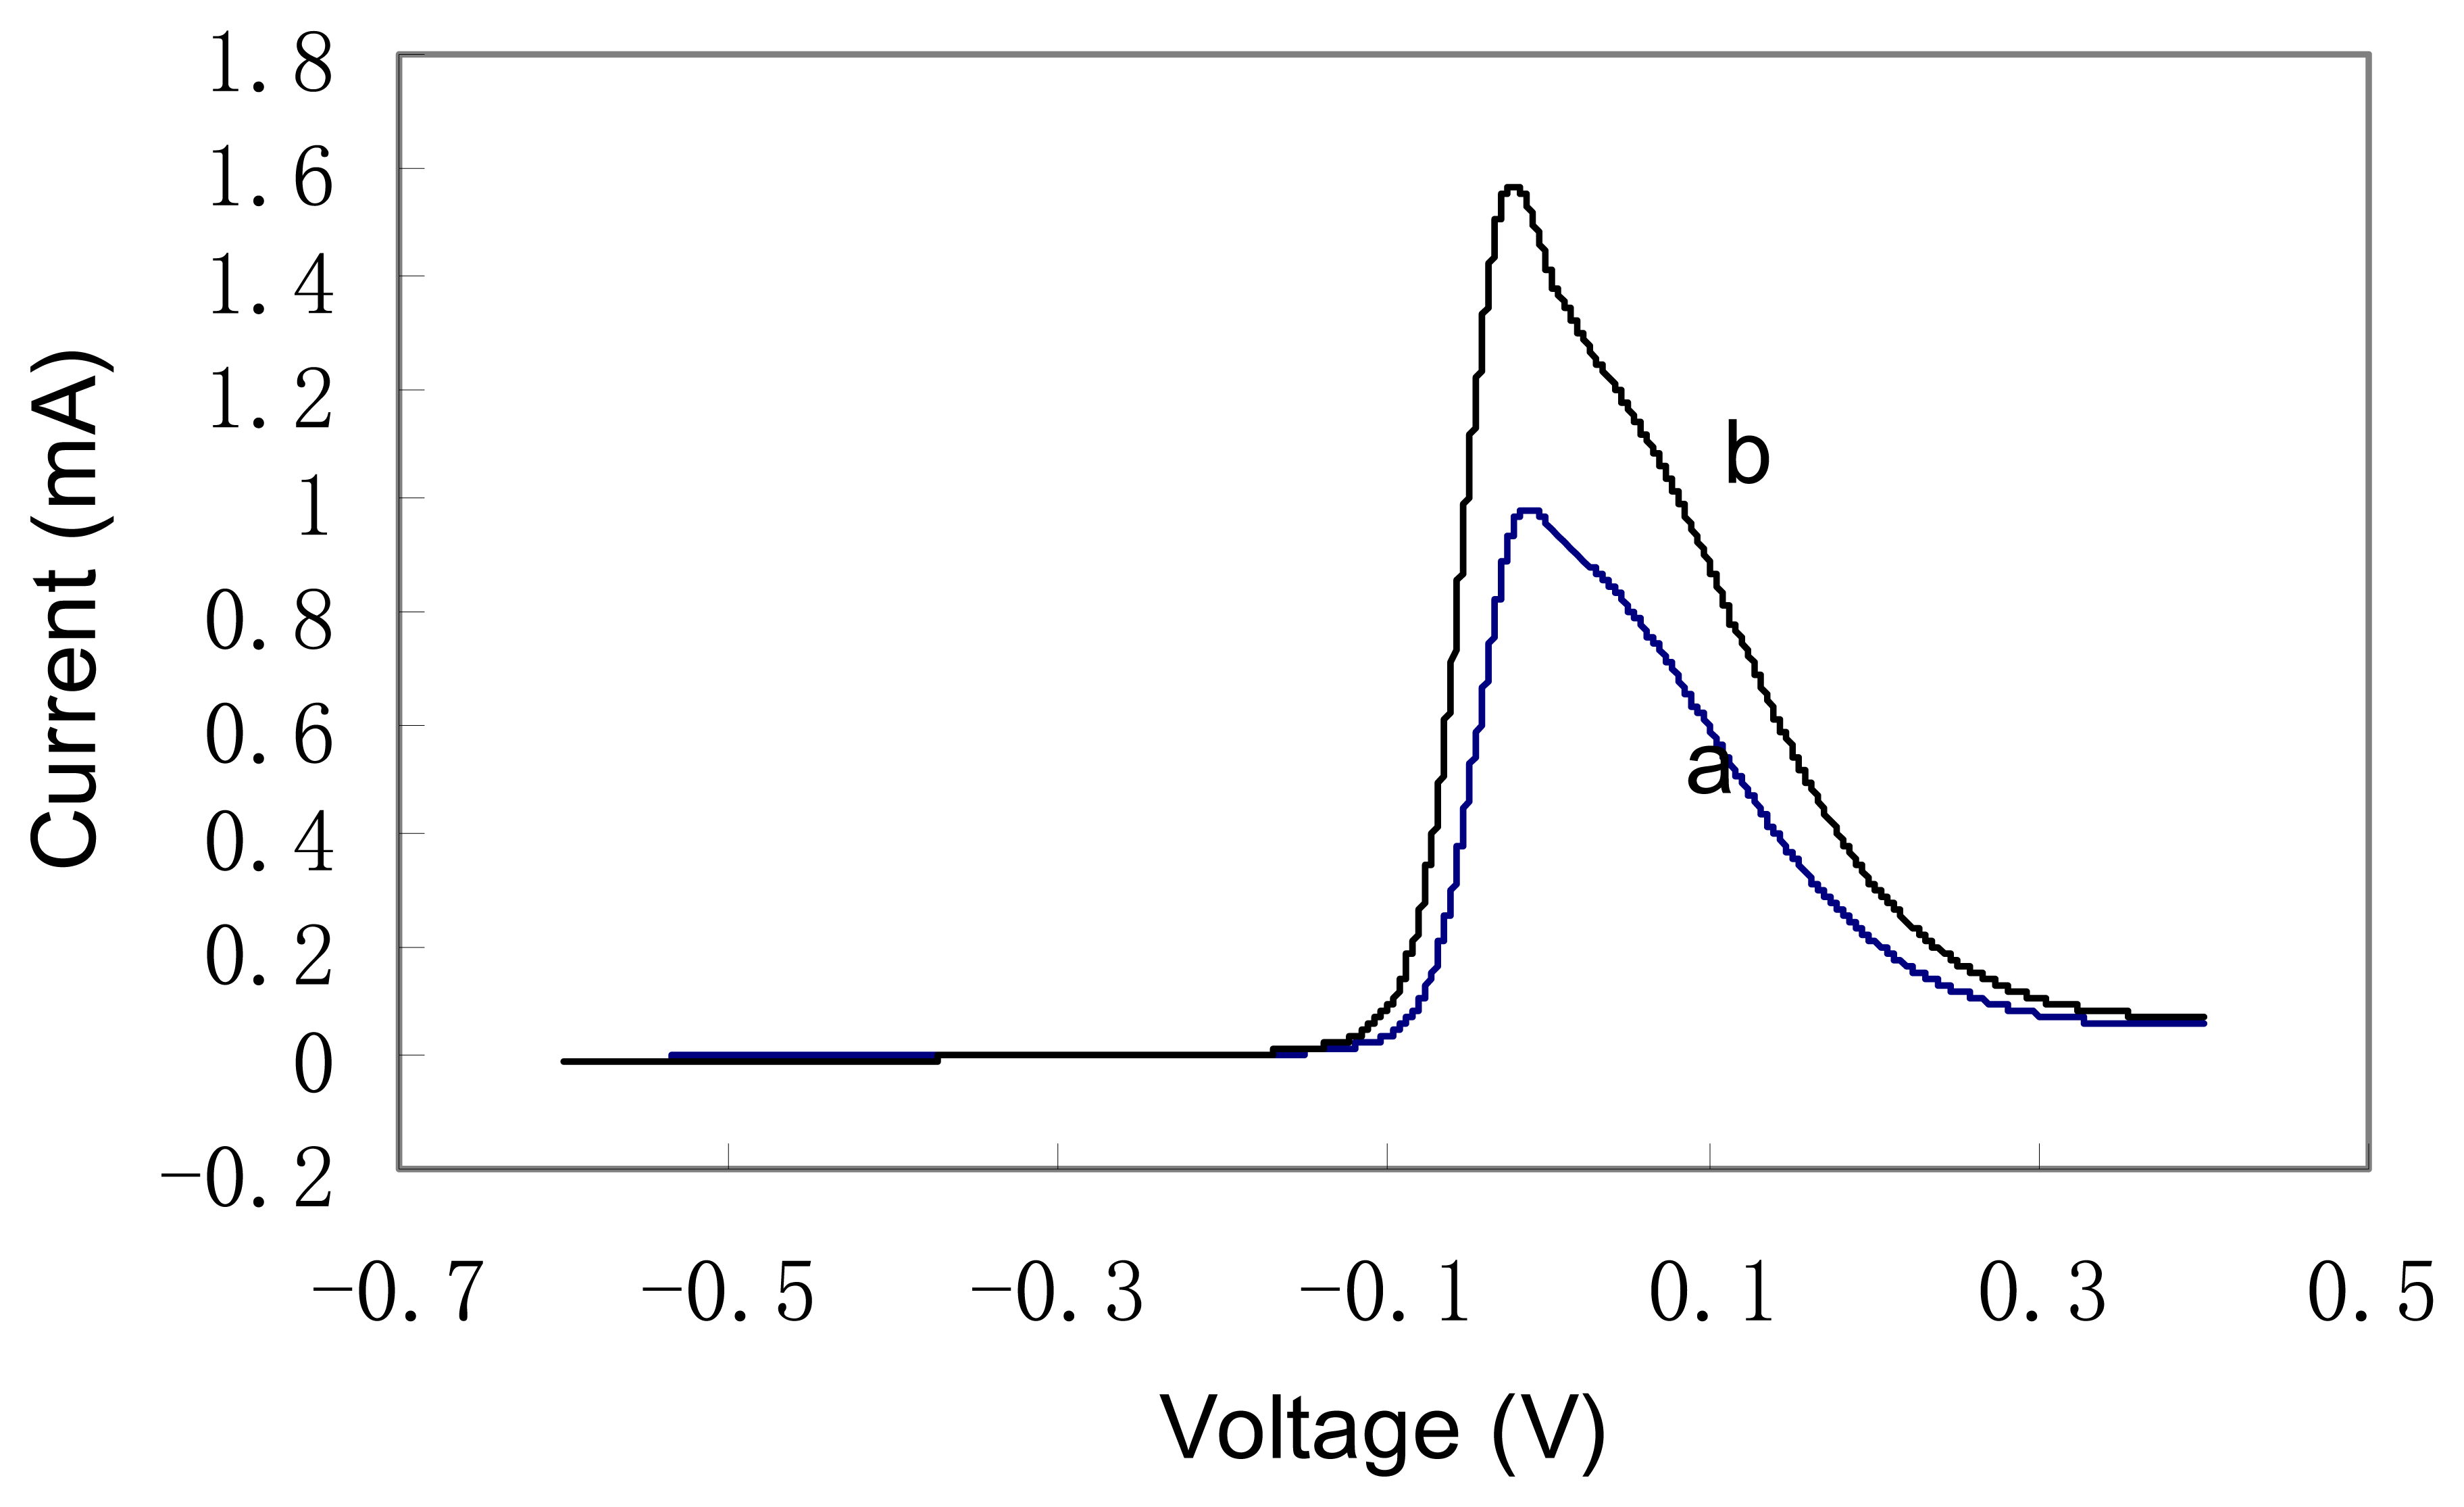
Figure 1 shows the typical anodic wave of cyclic voltammograms of copper electrode in a mixture of 4 ml 1 M NaOH solution and 1 ml Chinese yellow wine sample. The potential range is between -0.6 V to 0.4 V and the scan rate is 100 mV/sec. There is no stirring during the experiment. For curve (a) the wine sample is k1 and for cure (b) the wine sample is k3. It is shown in both curves that there is a large anodic peak between -0.1 V and 0.3 V. The oxidation of alcohol, carbohydrate at copper electrode in alkaline solution is based on Fleischmann mechanism [11]. Generally it is believed that the redox couple Cu(OH)2/CuOOH can catalyze the oxidation of absorbed enol group at relative low potential range in strong alkaline solution. In Chinese yellow wine samples, there are many alcohol, carbohydrate and amino acid components. Their oxidation potentials are quite close so it is impossible to obtain distinctive responses for each component. The large peak observed between -0.1 V to 0.3 V can be ascribed the colligated contribution from all these components. Meanwhile, the exact shape and position of oxidation peaks are slightly different for all six wine samples, which facilitate the further chemometric analysis for discrimination. (In figure 1 only voltammograms of two wine samples are shown for clarity.)
Different scan rates were tried to obtain large voltammogram varieties among the different wine samples. It is found that the scan rate of 100 mV/sec gives the largest variety. Square wave voltammetry were also investigated. Generally it is believed that square wave voltammetry suppresses the current contribution from double layer capacitance. However, in present case, since the anodic peak is quite large, the obtained square wave voltammograms do not show any improvement. In the further chemometric analysis, cyclic voltammograms were employed.
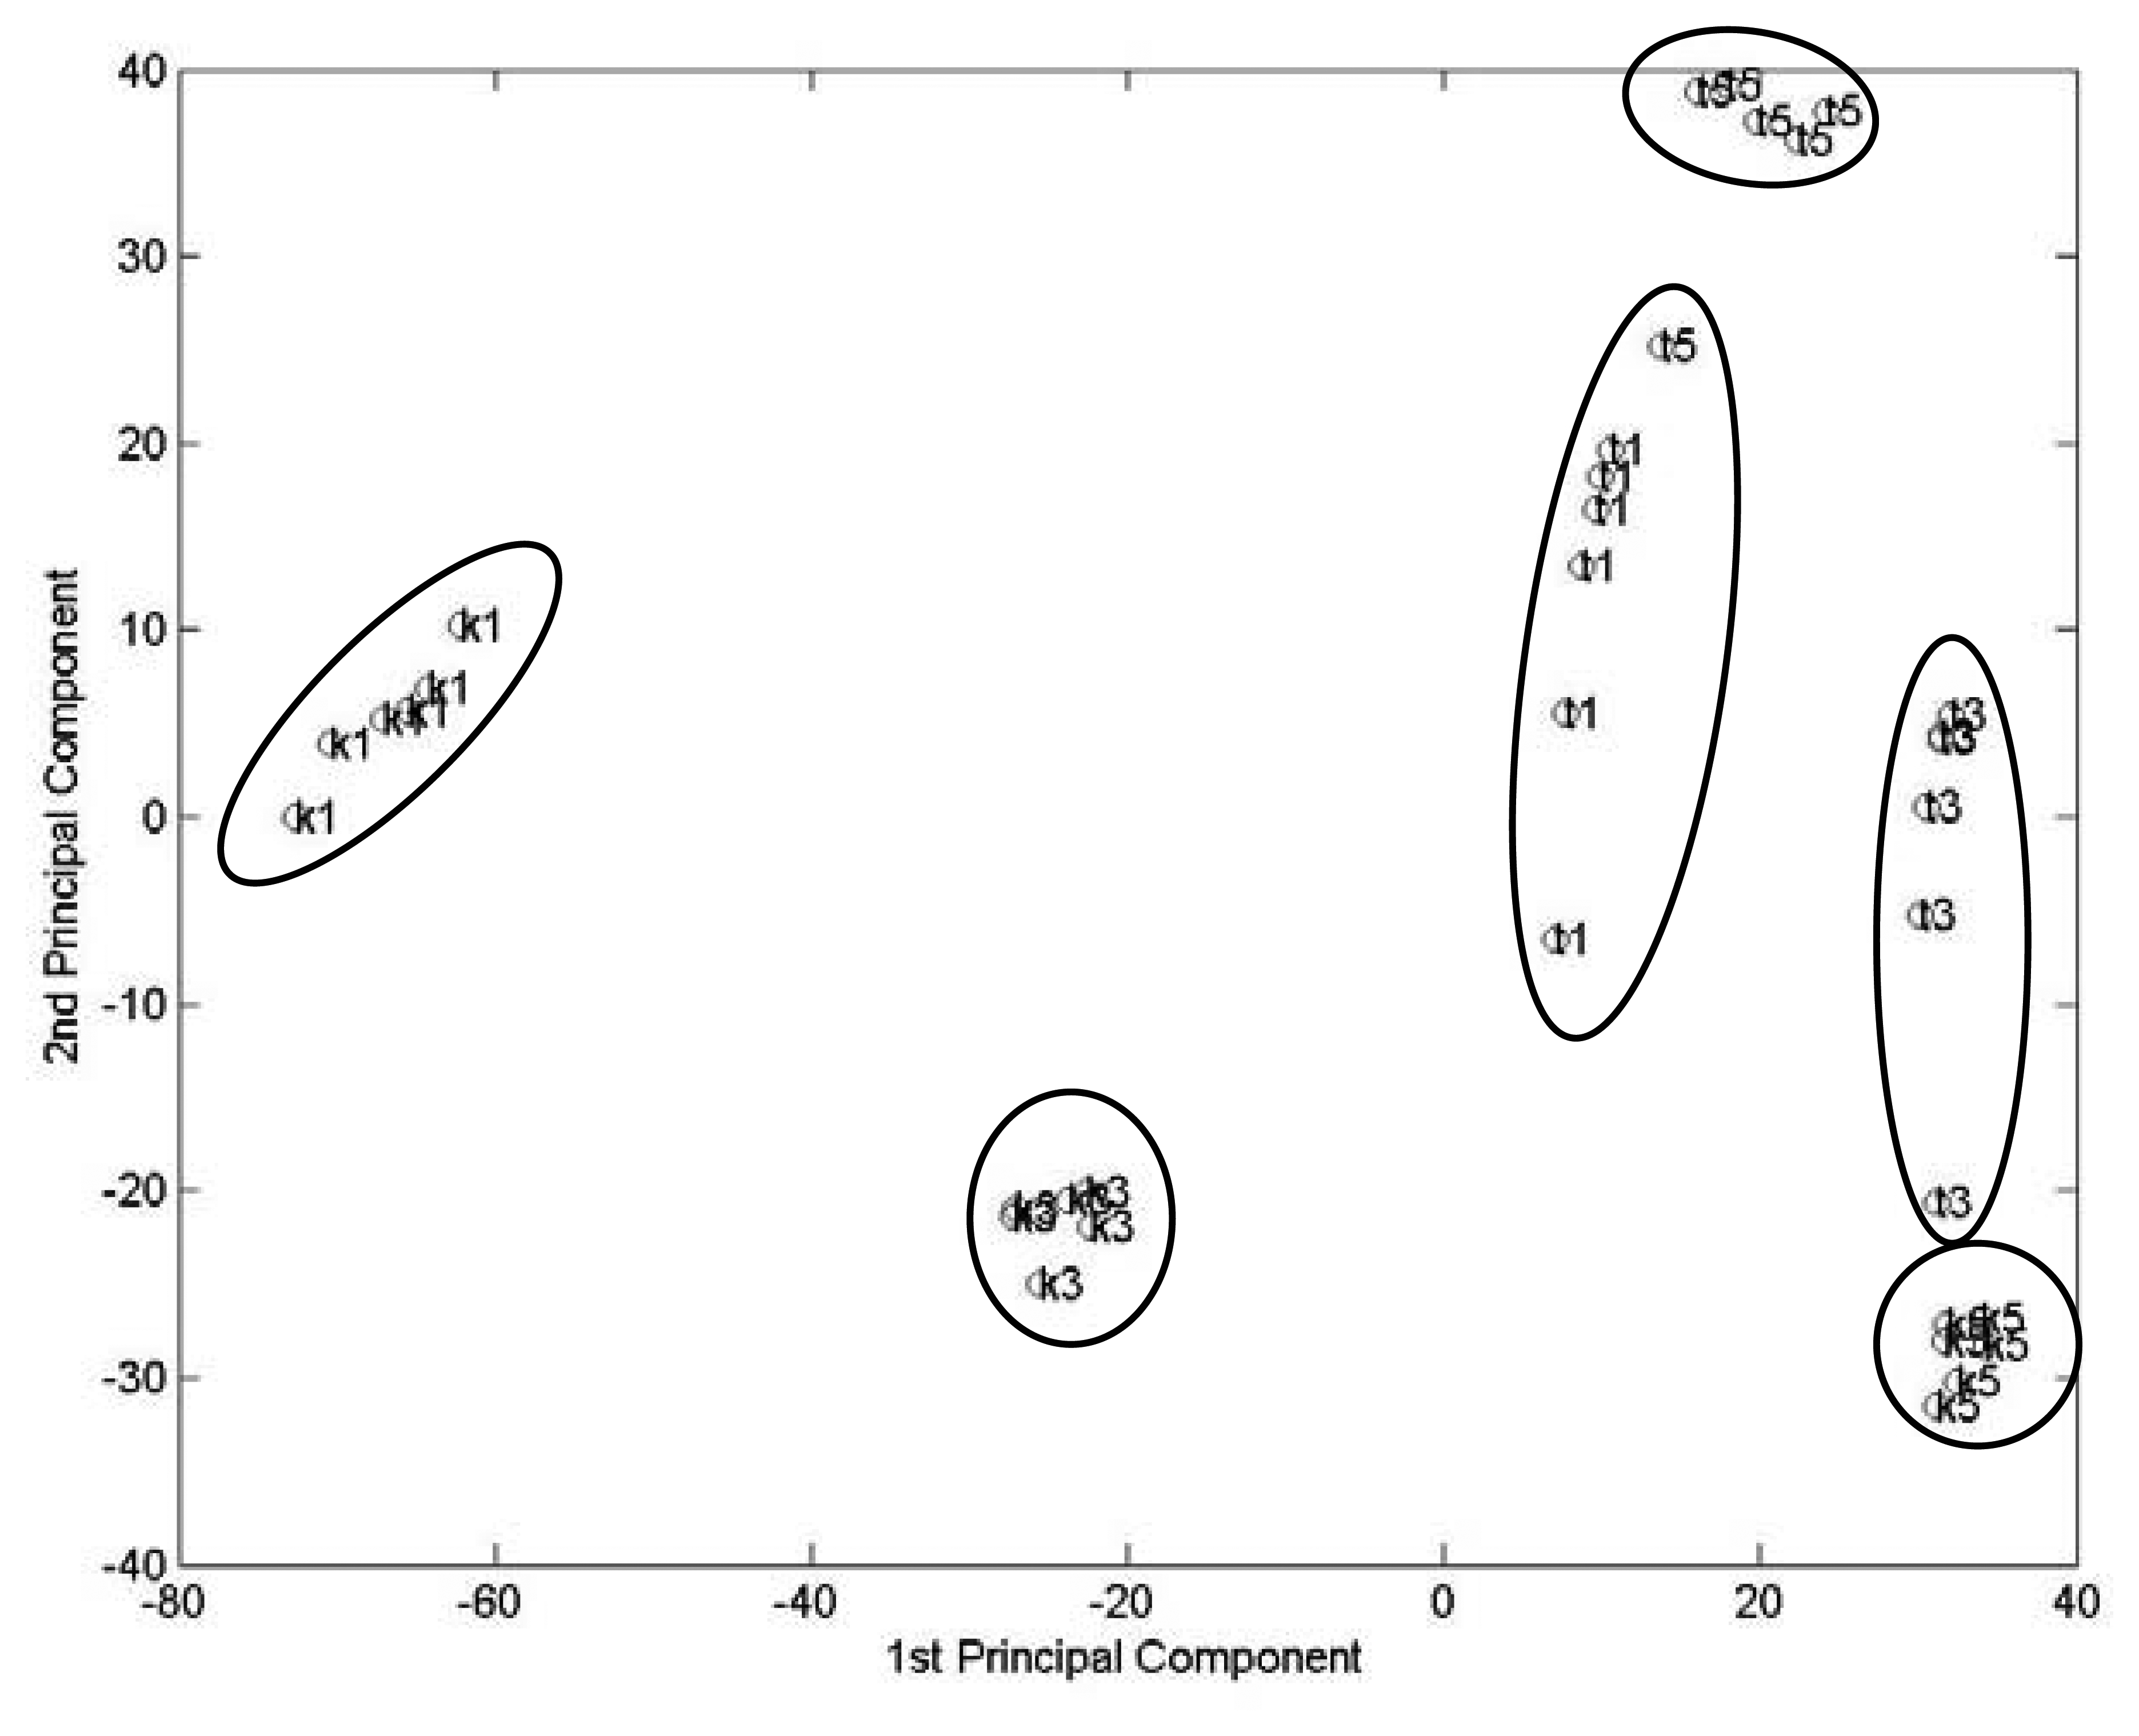
A non-supervised multivariate method, principal component analysis (PCA) was used for the analysis of the voltammetric signals. PCA was carried out in MatLab environment with a dedicated program developed in our laboratory. The input of the PCA analysis was organized as a 36 x 1000 matrix. 36 rows mean that there are six wine samples and for each sample six voltammetric measurements were carried out. Since the cyclic potential range is -0.6 V to 0.4 V and the data sampling ratio is one point per 1 mV, the length of one anodic wave is 1000. Figure 2 shows the two most important principal component plot. These two components account for 65 % and 25% of total variance, respectively. The plot shows totally discrimination of six wine samples. For Kuaiji Mount Brand wine samples, wines with different aged years show ordered position from left to right on the score plot. Tower Brand samples are relatively closed positioned at the right-up corner of the score plot.
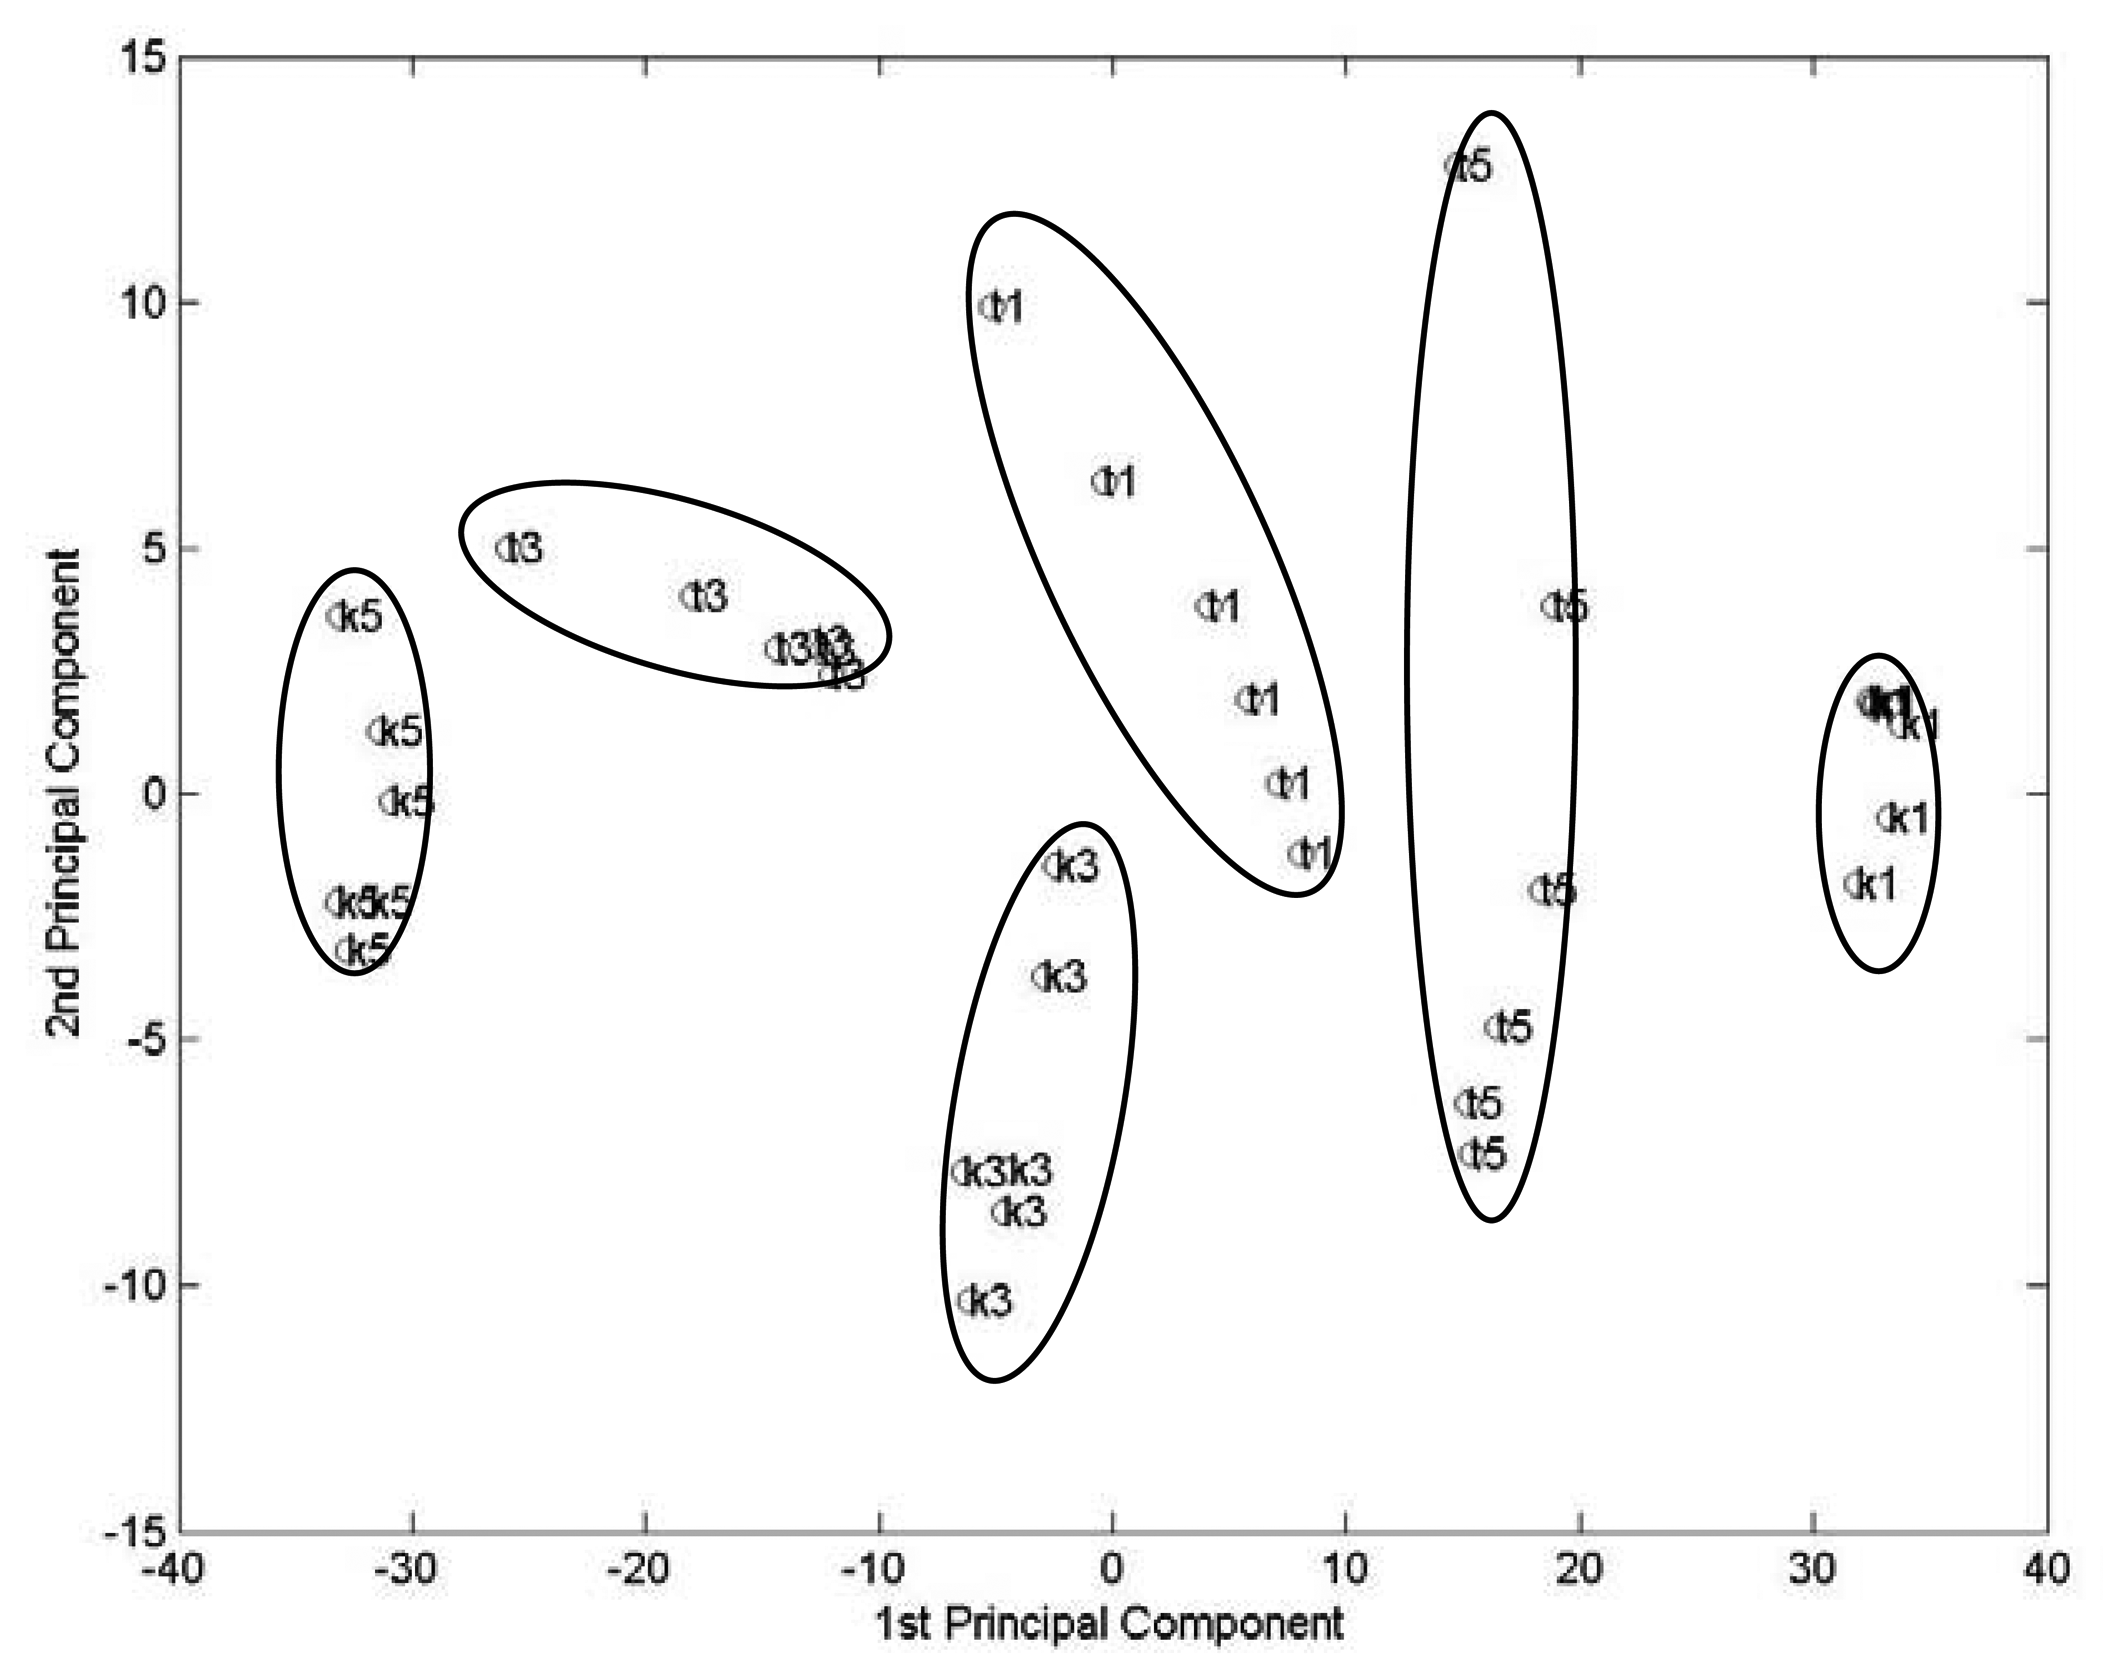
Since the main voltammetric responses are in the potential range between -0.1 V and 0.3 V, PCA analysis were also carried out with voltammetric response between these potential range. In this case, the input is a 36 x 400 matrix. Figure 3 is the resulted principal component plot. It is still possible to discriminate all six wine samples.
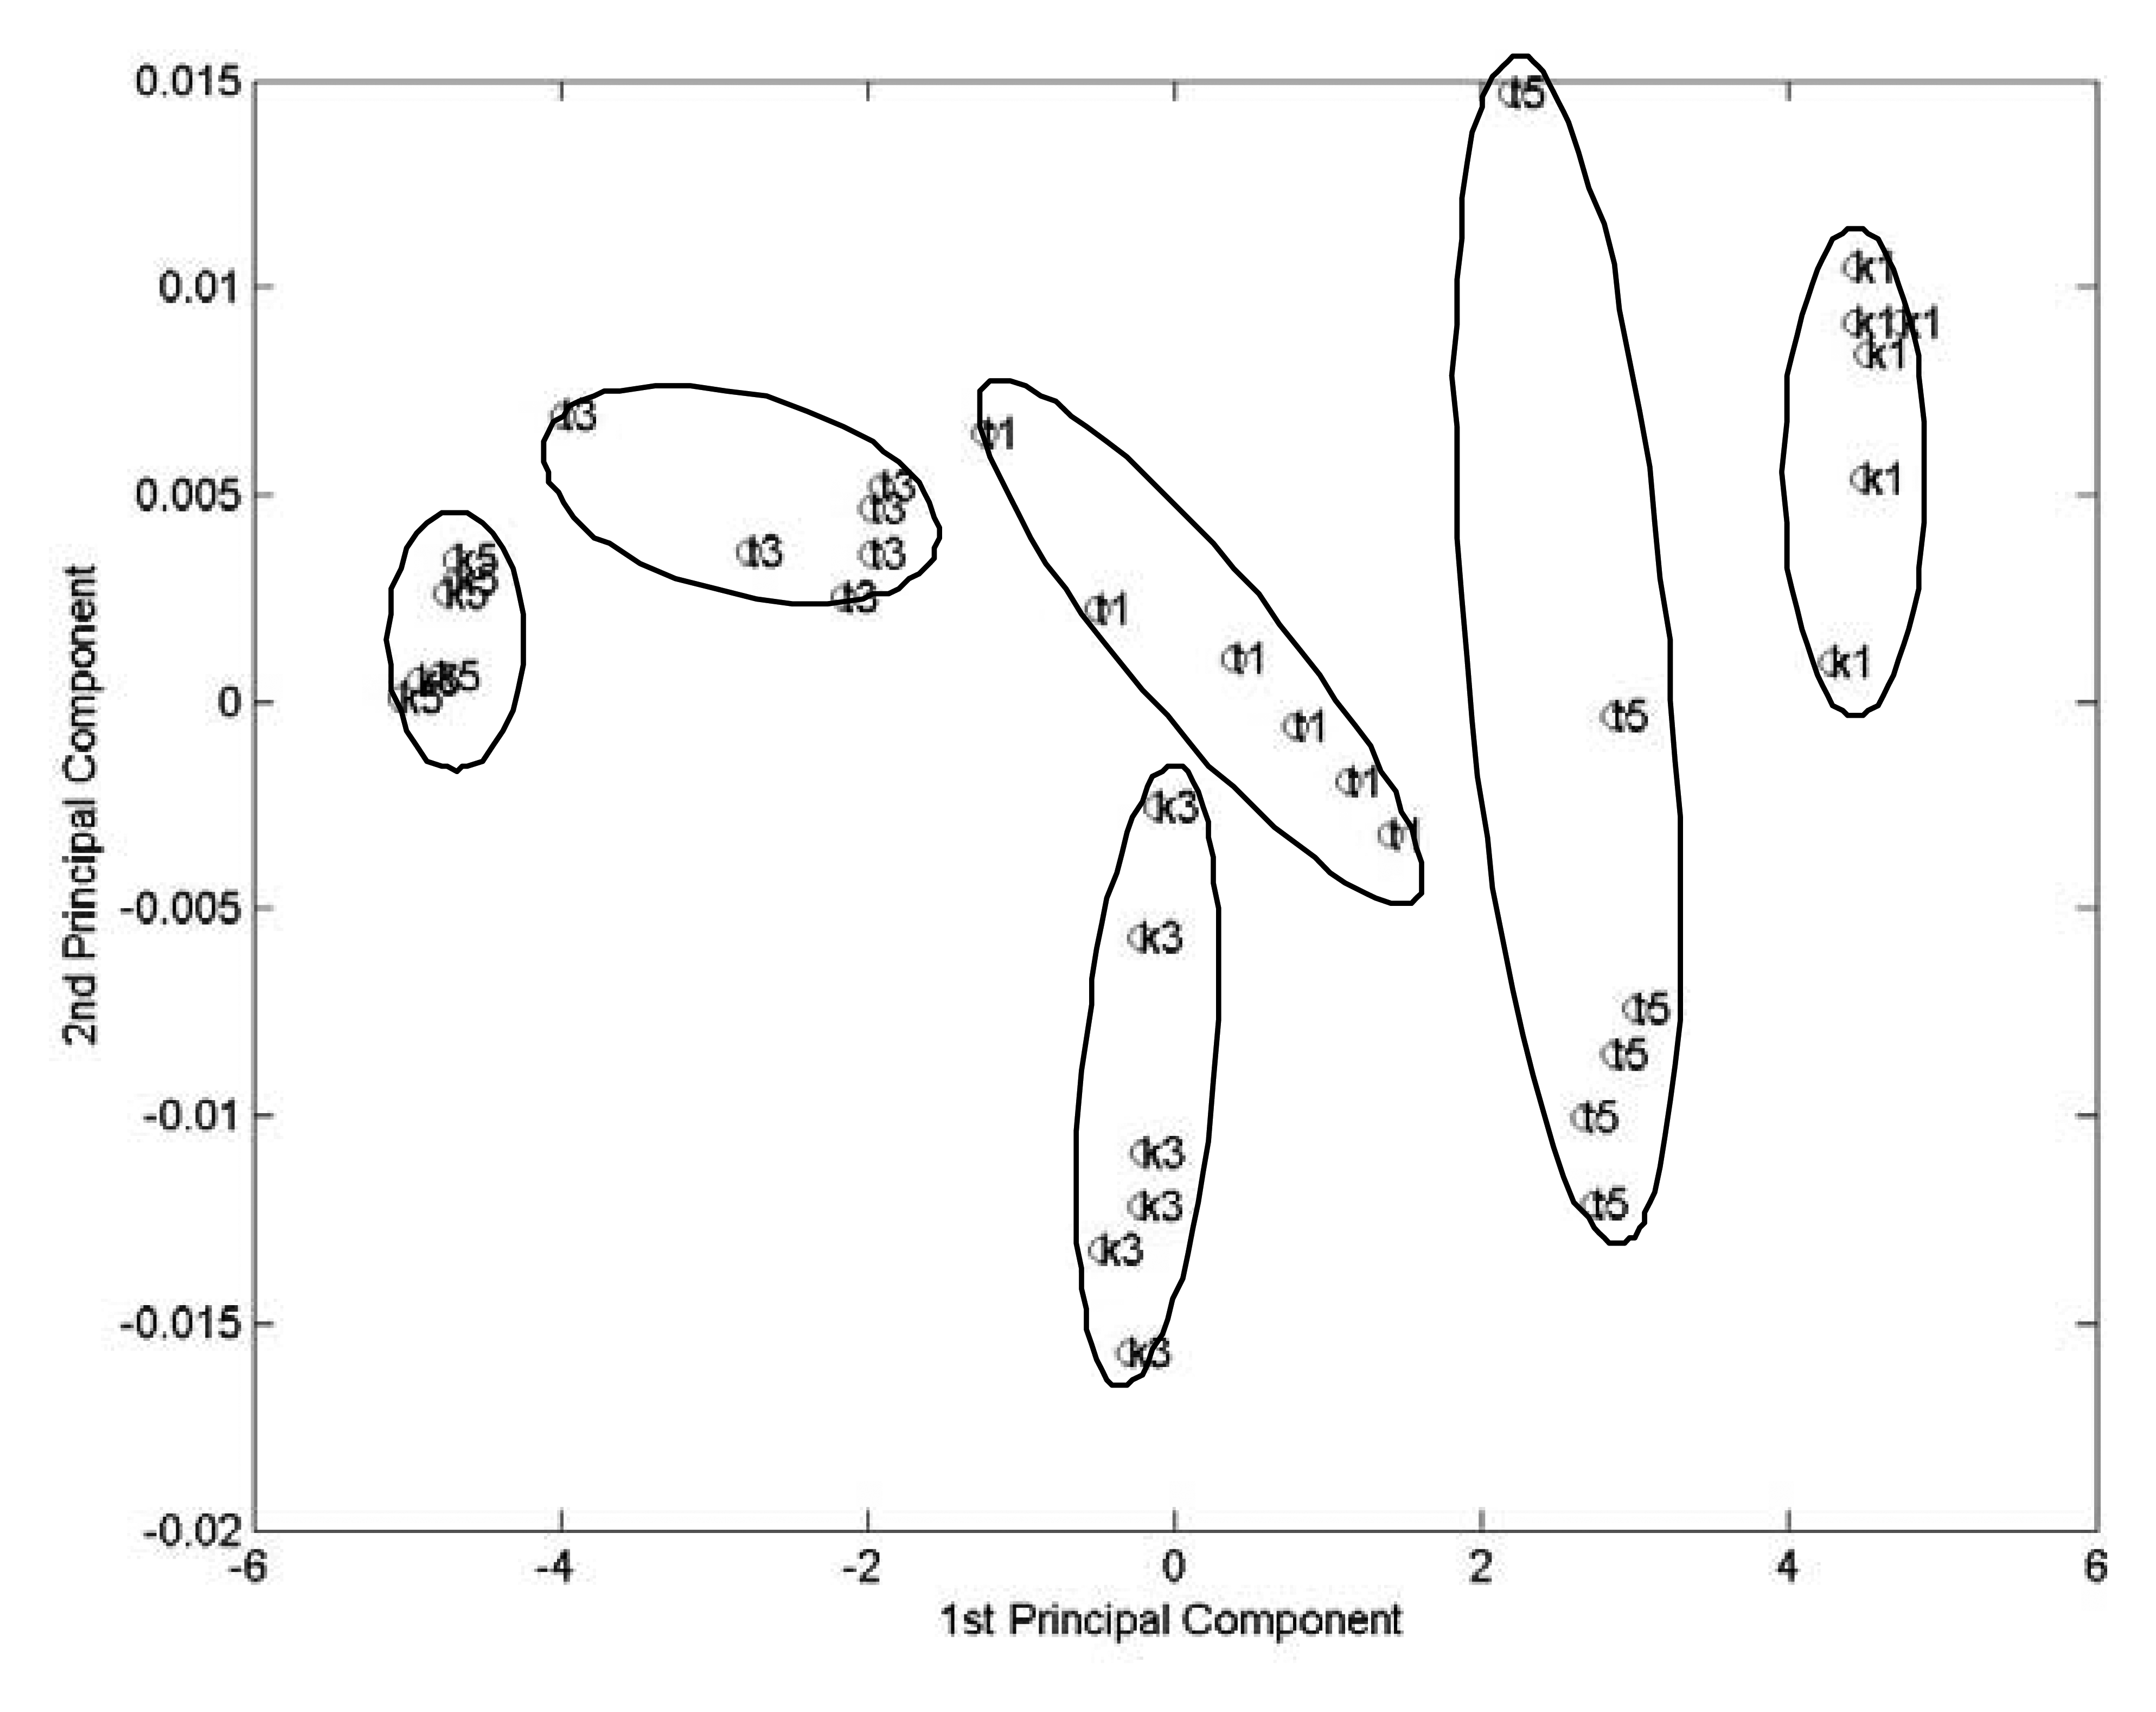
Voltammetric scan provides a rich response of the tested sample. However, it also produces a larger number of data. In PCA analysis, the amount of input data decides the computational time. In order to compress the input data set, a windowed time slicing method was implemented in this study. This method was first proposed by Gutierrez-Osuna [13]. In this case, the voltammogram is multiplied by N smooth, bell-shaped windowing function and integrated with respect to time. The idea behind this compression technique is to capture some information about the dynamic characteristics of the response. The windowing function employed in this study is:
Here ci is equally distributed between -0.6 V and 0.4 V. The number of windowing functions N is equal to 10 which was decided by try and error. After this windowed time slicing pre-processing, the input of PCA analysis is only a 36 × 10 matrix. This greatly reduces the data processed by PCA analysis. Figure 4 shows the resulted principal component plot. It shows a similar distribution of clusters to that obtained in figure 3.
Conclusions
In conclusion, we developed an electronic tongue for the classification of Chinese yellow wine samples. The sensing element of this electronic tongue is a copper electrode in strong alkaline solution. In strong alkaline solution copper electrode shows rich voltammetric responses to these wine samples. Principal component analysis is employed to analysis electrochemical responses. The score plots show good classification of these wine samples. In order to compress the original voltammetric data, a windowed time slicing method was also investigated in this study. It greatly reduces the input data number and the resulted PCA plot still has good discrimination ability. Since only one copper electrode is required, our electronic tongue is quite easy to be implemented. According to our knowledge, there is no such report in literatures up to now. Further application of this electronic tongue on other liquid samples is under investigation.
Acknowledgments
This work was supported by the National Natural Science Foundation of China (projects No. 30470470).
References
- Gardner, J.W.; Bartlett, P.N. A brief -history of electronic noses. Sensors and Actuators B. 1994, 18-19, 211–220. [Google Scholar]
- Legin, A.V.; Bychkov, E.A.; Seleznev, B.L.; Vlasov, Y.G. Development and analytical evaluationof a multisensors system for water-quality monitoring. Sensors and Actuators, B. 1995, 26, 377–379. [Google Scholar]
- Natalea, C.; Davidea, F.; D'Amicoa, A.; Sberveglierib, G.; Nellib, P.; Fagliab, G.; Perego, C. Complex chemical pattern recognition with sensor array: the discrimination of vintage years of wine. Sensors and Actuators, B. 1995, 25, 801–804. [Google Scholar]
- Liang, Y.; Lu, J.; Zhang, L.; Wu, S.; Wu, Y. Estimation of tea quanlity by infusion color difference analysis. Journal of the Science of Food and Agriculture 2005, 85, 286–292. [Google Scholar]
- Accettola, P.; Balsi, M.; D'Amoico, A.; NAtale, C.; Macagnano, A.; Sortino, F. Time-constant extracting filters for fast gas identification in electronic nose. Electronics Letters 2002, 38, 510–511. [Google Scholar]
- Ivarsson, P.; Holmin, S.; Hojer, N.; Krantz-Rulcker, C.; Winquist, F. Discrimnation of tea by means of a voltammetric electronic tongue and different applied waveforms. Sensors and Actuators, B. 2001, 76, 449–454. [Google Scholar]
- Winquist, F.; Krantz-Rulcker, C.; Wide, P.; Lundstrom, I. Monitoring of freshness of milk by an electronic tongue on the basis of voltammetry. Meas. Sci. Technol. 1998, 9, 1937–1946. [Google Scholar]
- Holmin, S.; Bjorefors, F.; Eriksson, M.; Krantz-Rulcker, C.; Winquist, F. Investigation of electrode materials as sensors in a voltammetric electronic tongue. Electroanalysis 2002, 14, 839–847. [Google Scholar]
- Parra, V.; Hernando, T.; Rodriguez-Mendez, M.; Saja, J. Electrochemical sensor array made from bisphthalocyanine modified carbon paste electrodes for discrimination of red wines. Electrochimica Acta 2004, 49, 5177–5185. [Google Scholar]
- Schreyer, S.; Mikkelsen, S. Chemometric analysis of square wave voltammograms for classification and quantitaion of untreated beverage samples. Sensors and Actuators, B 2000, 71, 147–153. [Google Scholar]
- Fleischmann, M.; Koryta, J.; Thrisk, H. Kinetics of electrodeposition and catalytic activity of thin films of ruthenium. Trans Faraday Soc. 1967, 63, 1261–1268. [Google Scholar]
- Fleischmann, M.; Koryta, J.; Thrisk, H. Electrocrystallization of ruthenium and electrocatalysis of hydrogen evolution. Trans Faraday Soc. 1972, 68, 2305–2315. [Google Scholar]
- Gutierrez-Osuna, R.; Nagle, H.T. A method for evaluating data-preprocessing techniques for odor classification with an array of gas sensors. IEEE Transactions on Systems, Man, and Cybernetics, B 1999, 29, 626–632. [Google Scholar]
Figure 1.
Typical anodic wave of cyclic voltammogram of two Chinese yellow wine samples (k1, k3) in alkaline solution obtained at a copper working electrode.
Figure 1.
Typical anodic wave of cyclic voltammogram of two Chinese yellow wine samples (k1, k3) in alkaline solution obtained at a copper working electrode.

Figure 2.
PCA score plot of the original anodic wave of copper electrode in six Chinese yellow wines mixed with 1 M NaOH solution. The potential range: -0.6 V to 0.4 V.
Figure 2.
PCA score plot of the original anodic wave of copper electrode in six Chinese yellow wines mixed with 1 M NaOH solution. The potential range: -0.6 V to 0.4 V.

Figure 3.
PCA score plot of the original anodic wave of copper electrode in six Chinese yellow wines mixed with 1 M NaOH solution. The potential range: -0.1 V to 0.3 V.
Figure 3.
PCA score plot of the original anodic wave of copper electrode in six Chinese yellow wines mixed with 1 M NaOH solution. The potential range: -0.1 V to 0.3 V.

Figure 4.
PCA score plot of the pre-processed anodic wave of copper electrode in six Chinese yellow wines mixed with 1 M NaOH solution.
Figure 4.
PCA score plot of the pre-processed anodic wave of copper electrode in six Chinese yellow wines mixed with 1 M NaOH solution.


| Sample | Brand | Aged year |
|---|---|---|
| K1 | Kuaiji Mount | One |
| K3 | Kuaiji Mount | Three |
| K5 | Kuaiji Mount | Five |
| T1 | Tower | One |
| T3 | Tower | Three |
| T5 | Tower | Five |
© 2005 by MDPI ( http://www.mdpi.org). Reproduction is permitted for noncommercial purposes.
Share and Cite
MDPI and ACS Style
Wu, J.; Liu, J.; Fu, M.; Li, G.; Lou, Z. Classification of Chinese Yellow Wines by ChemometricAnalysis of Cyclic Voltammogram of Copper Electrodes. Sensors 2005, 5, 529-536. https://doi.org/10.3390/s5120529
AMA Style
Wu J, Liu J, Fu M, Li G, Lou Z. Classification of Chinese Yellow Wines by ChemometricAnalysis of Cyclic Voltammogram of Copper Electrodes. Sensors. 2005; 5(12):529-536. https://doi.org/10.3390/s5120529
Chicago/Turabian StyleWu, Jian, Jun Liu, Min Fu, Guang Li, and Zhengguo Lou. 2005. "Classification of Chinese Yellow Wines by ChemometricAnalysis of Cyclic Voltammogram of Copper Electrodes" Sensors 5, no. 12: 529-536. https://doi.org/10.3390/s5120529