Article

Improvement of Amperometric Sensor Used for Determination of Nitrate with Polypyrrole Nanowires Modified Electrode

1
State Key Laboratory of Chemical Engineering, Chemical Engineering Research Center, School of Chemical Engineering and Technology, Tianjin University, Tianjin 300072, China
2
Chemistry Department of Dezhou University, Dezhou, Shandong 253011, China
*
Author to whom correspondence should be addressed.
Sensors 2005, 5(12), 580-593; https://doi.org/10.3390/s5120580
Submission received: 2 September 2005 / Accepted: 12 December 2005 / Published: 16 December 2005

Abstract

:
Polypyrrole(PPy) nanowire modified electrodes were developed by template-free electrochemical method based on graphite electrode. The modified electrode was characterized by their amperometric response towards nitrate ions. Before reduction of nitrate ions, electrochemical solid-phase extraction (EC-SPE) of nitrate in/on modified electrodes was conducted. It is found that the unusual nanowired structure of polypyrrole layer (instead of well known cauliflower structure) allows us to increase the effective surface area of the electrode and subsequently the sensitivity. And the effects of electrochemical preparation parameters of PPy nanowire modified electrodes on their corresponding characters were evaluated. The experimental results show that the electrochemical preparation parameters of the modified electrodes such as scan rate, polymerization potential, temperature of polymerization solution and polymerization time have significantly effects on the morphology of PPy nanowires and subsequently effective surface area of the electrode and electroreduction current density of nitrate. The determination sensitivity may be varied according to the modification parameters. Under a certain polymerization conditions, the corresponding sensitivity reaches 336.28 mA/M cm2 and the detection limit is 1.52×10⁻⁶ M. The proposed method was successfully applied in the detection of nitrate in the real samples.

1. Introduction

Conductive polymers have received considerable attention in recent years. They have unique optical, chemical, and electrical properties. They are very promising for practical applications in sensors and actuators, secondary batteries, electromagnetic shielding, anti-corrosions, and various electronic devices. Sensors and actuators assembled with conductive polymers nanowires have superior responding characters to their counterpart [1-3]. PPy nanowire, different from its counterpart of cauliflower structure, should be promising for a sensing application.
Nitrate usually exists in industrial wastewaters, polluted groundwater and radioactive solutions. Although nitrate itself is a non-toxic compound, it can be microbially reduced to nitrite, which is an essential precursor in the formation of nitrosamines, many of which have been shown to be potential carcinogens. The determination of nitrate has gained renewed attention in view of its relevance to pollution control. As a result, many methods for nitrate determination have been developed in recent years, for example, spectroscopic, chromatographic, and electrochemical detection, etc [4-9]. However, these methods are either laborious to perform or complicated or not sufficiently specific. Owing to the rapid response and simple use, sensors have been employed for analytical purpose [10-16]. Although some nitrate sensors based on PPy film have been developed [17-26], by our knowledge, the PPy nanowire modified sensors has not been reported. Recently PPy nanowires were successfully prepared on the electrode surface by templated-free method electrochemically in our laboratory. Modified with PPy nanowires, the electrode will have larger effective surface area and lower diffusion resistance than that modified with cauliflower PPy film. Electropolymerization parameters might affect the morphology of PPy. A detail study of these conditions enables optimization of the response of the prepared electrode to the NO3-, as well as aiding in the development of strategies toward the rational design of sensors. The PPy nanowires morphologies on the electrode surface are studied by scan electron microscopy. The selectivity, sensitivity and detection limit for the optimal PPy nanowires-based nitrate-selective electrode were improved greatly.

2. Experimental

Reagents

Pyrrole (Fluke) was purified by distillation under nitrogen atmosphere before use, stored at low temperature and protected from light. All other reagents were of analytical grade and were used without further purification. All solution were prepared with de-ionized water and deaerated with pure N2 for at least 20 min.

Apparatus

Polymerization of pyrrole and the electrochemical experiments are carried out in an environment of pure nitrogen using model PAR273A Electrochemical System (U.S.A.) controlled by a computer. SEM was taken at XL30 (PHILIPS, USA).

Preparation method of PPy nanowire modified electrodes

A three-electrode, one-compartment cell was used with a diameter of 6mm pretreated graphite rod working electrode, platinum wire counter electrode and saturated calomel reference electrode (SCE). Polymerization of pyrrole was performed by potential step or by cyclic voltammetry. Before polymerization conducted, electrolyte solutions were deaerated thoroughly with high purity nitrogen. Unless stated otherwise, all polymerization were conducted at ambient temperature and in aqueous solution containing 0.15 M pyrrole, 0.10 M LiClO4 and 0.10 M carbonate. The cauliflower PPy modified electrode was prepared by electropolymerization in electrolyte solutions just like above mentioned except no carbonate. The SEM pictures of the modified electrode surfaces were presented in figure 1.

Measurement

Freshly prepared PPy film electrodes were usually conditioned in 0.10 M HClO4 solution for 24-hour to remove the carbonate ions. Characterization of the modified electrode was conducted in a conventional three-electrode cell, and the electrodes used are the same as above mentioned. Supporting electrolyte is 0.50 M H2SO4. The corresponding electroreduction current density was obtained by electrochemical solid-phase extraction method [27-28]. In order to obtain the same electroreduction current coming from PPy, the PPy must be preoxidized to its original state before each determination. So, the double potential step process was used. The optimal EC-SPE conditions were determined by our experiment, the first potential step is to preoxidize the PPy nanowires at 0.85 V for 300s, while the nitrate ions is EC-SPE in/on the PPy nanowires, and the second potential step is to reduce the nitrate ions at -0.15 V for 100s. Unless stated otherwise, all experiments were conducted at ambient temperature.

3. Results and discussion

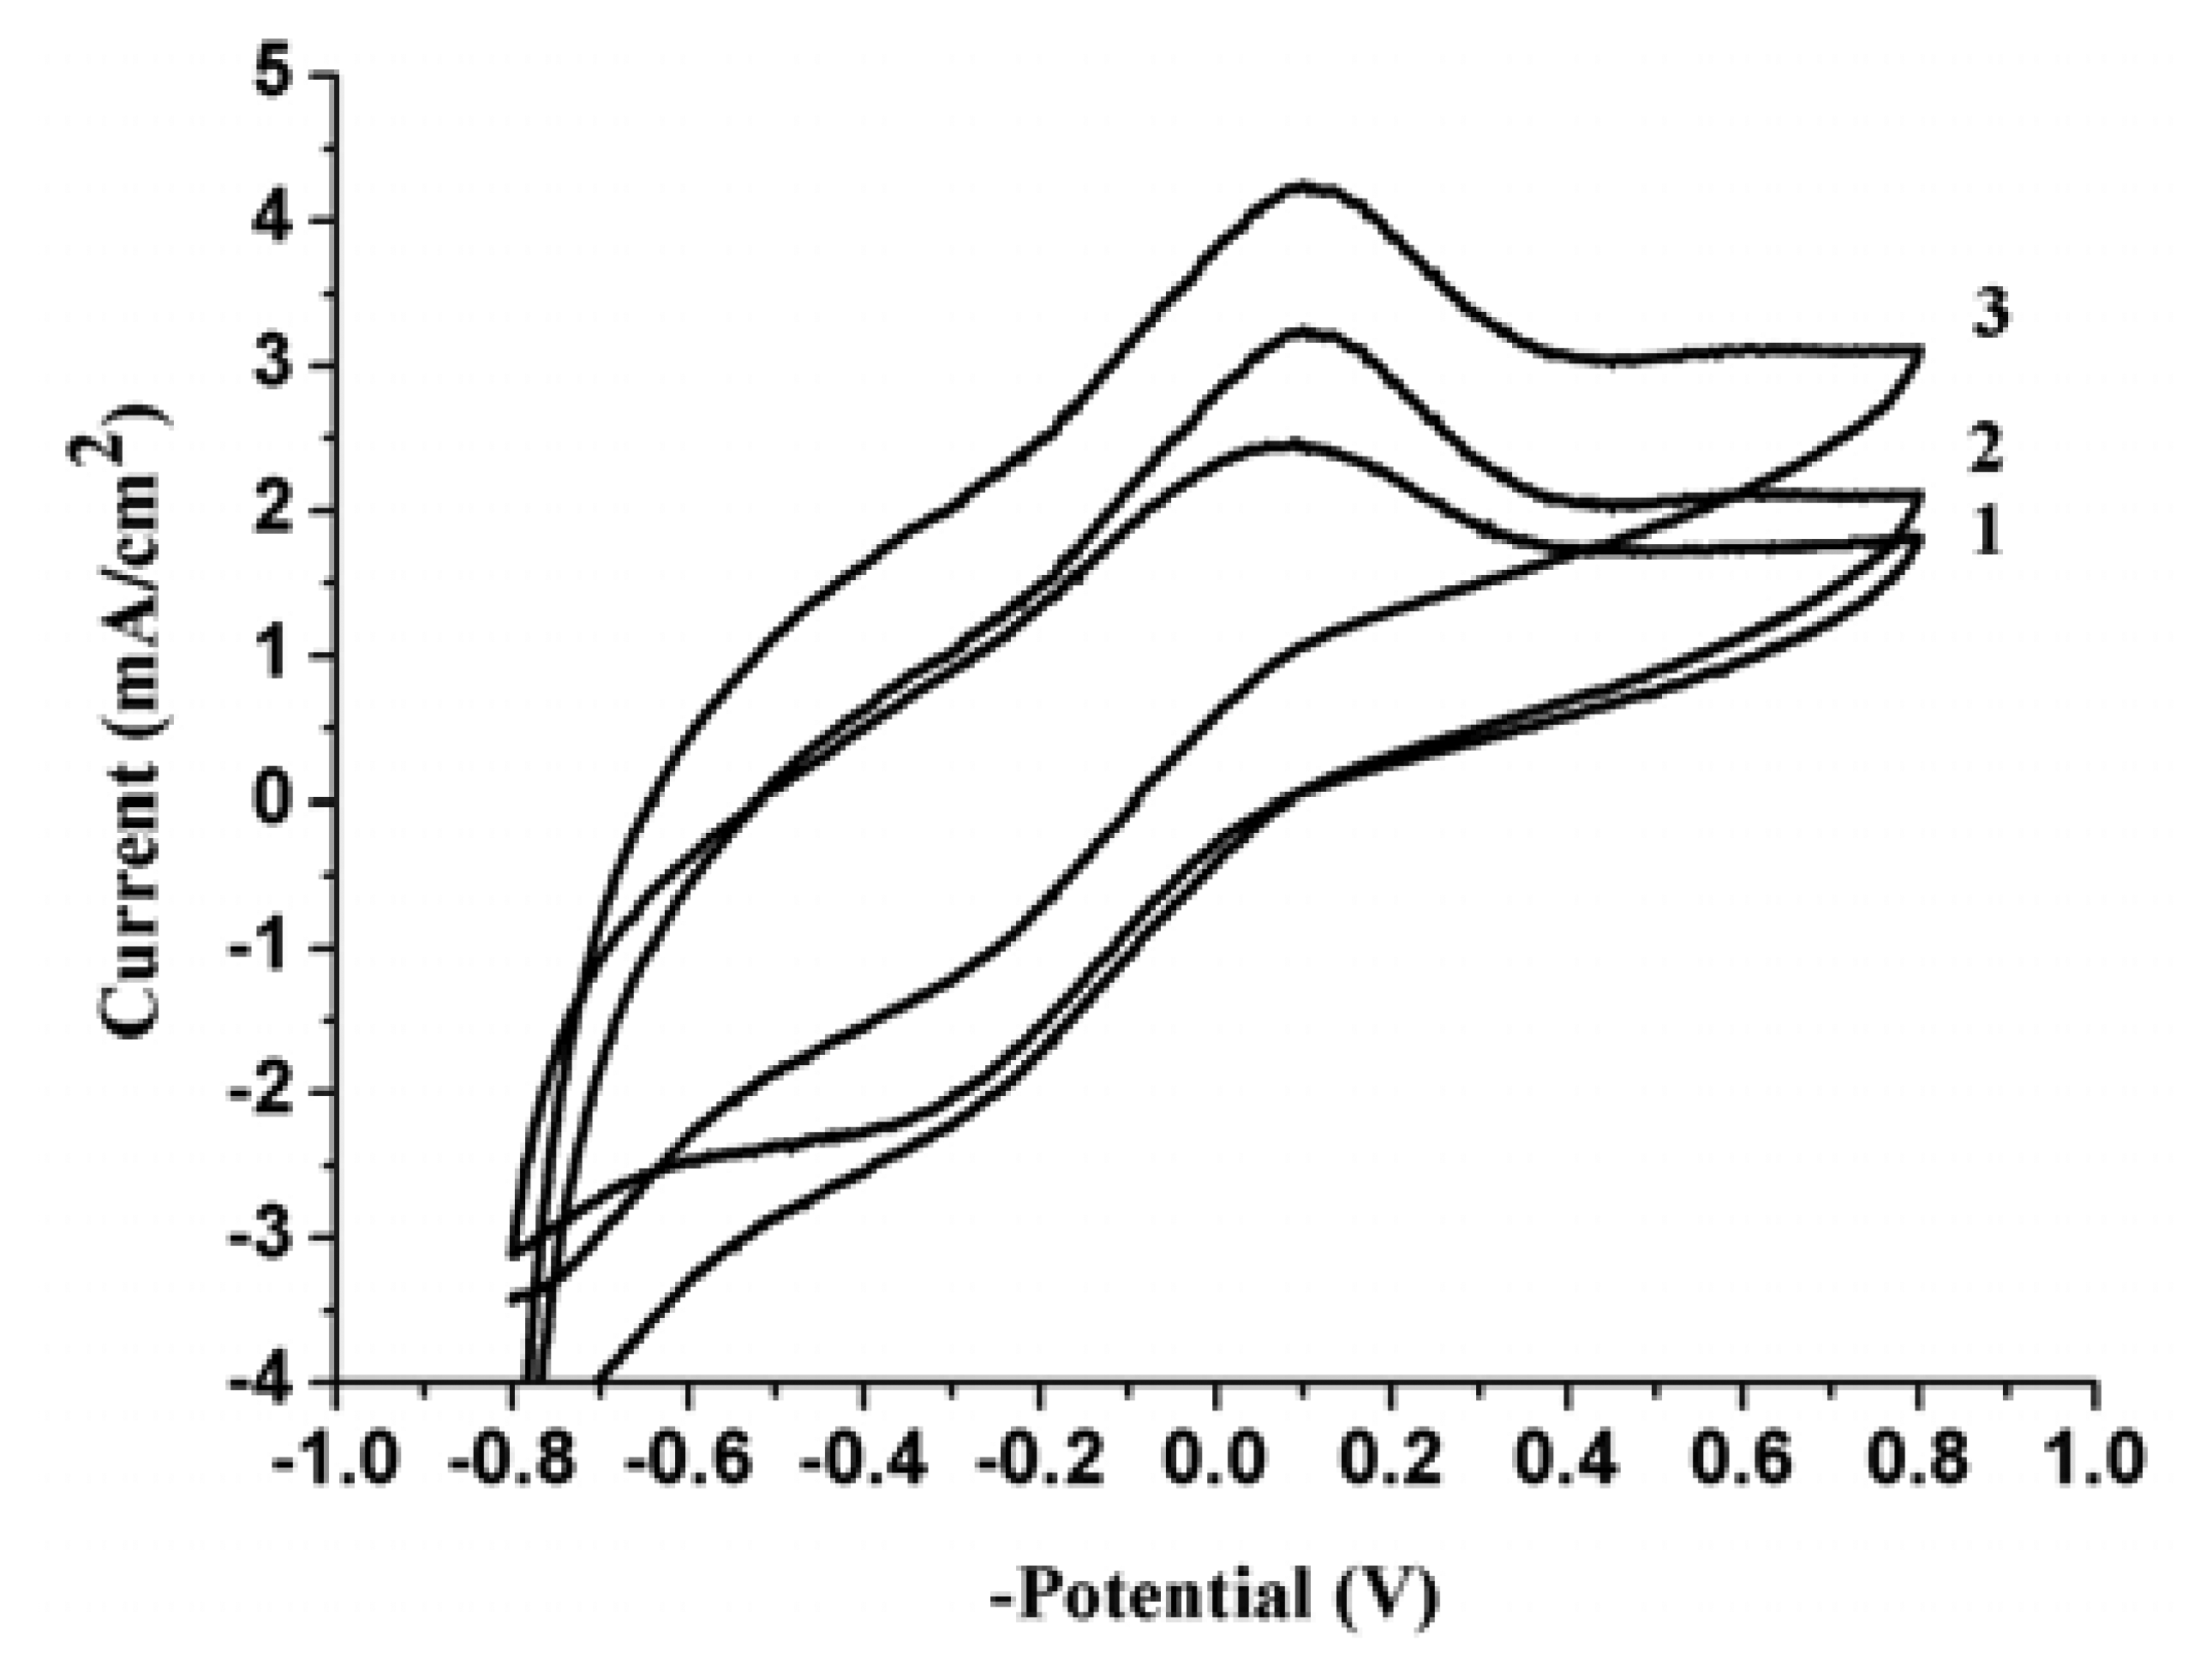
3.1. Cyclic voltammetry investigations of NO3- at PPy nanowires modified electrode

Figure 2 shows the cyclic voltammetric response of the nitrate reduction at PPy nanowire modified electrode. Curve 1 represents the cyclic voltammetric curve of the modified electrode in 0.50 M H2SO4 solution at scan rate of 5 mVs-1. Curve 2 and curve 3 represent the cyclic voltammetric curves of the modified electrode in 0.5 M H2SO4 solution containing 2.2 mM and 3.6 mM NaNO3, respectively, at scan rate of 5 mVs-1. This figure shows that the electroreduction of nitrate and PPy almost at the same potential. Consequently, this reduction peak at about -0.100 V can be attributed to the electroreduction of the nitrate and PPy. Based on this phenomenon, the determination of NO3- with this modified electrode should be practically.

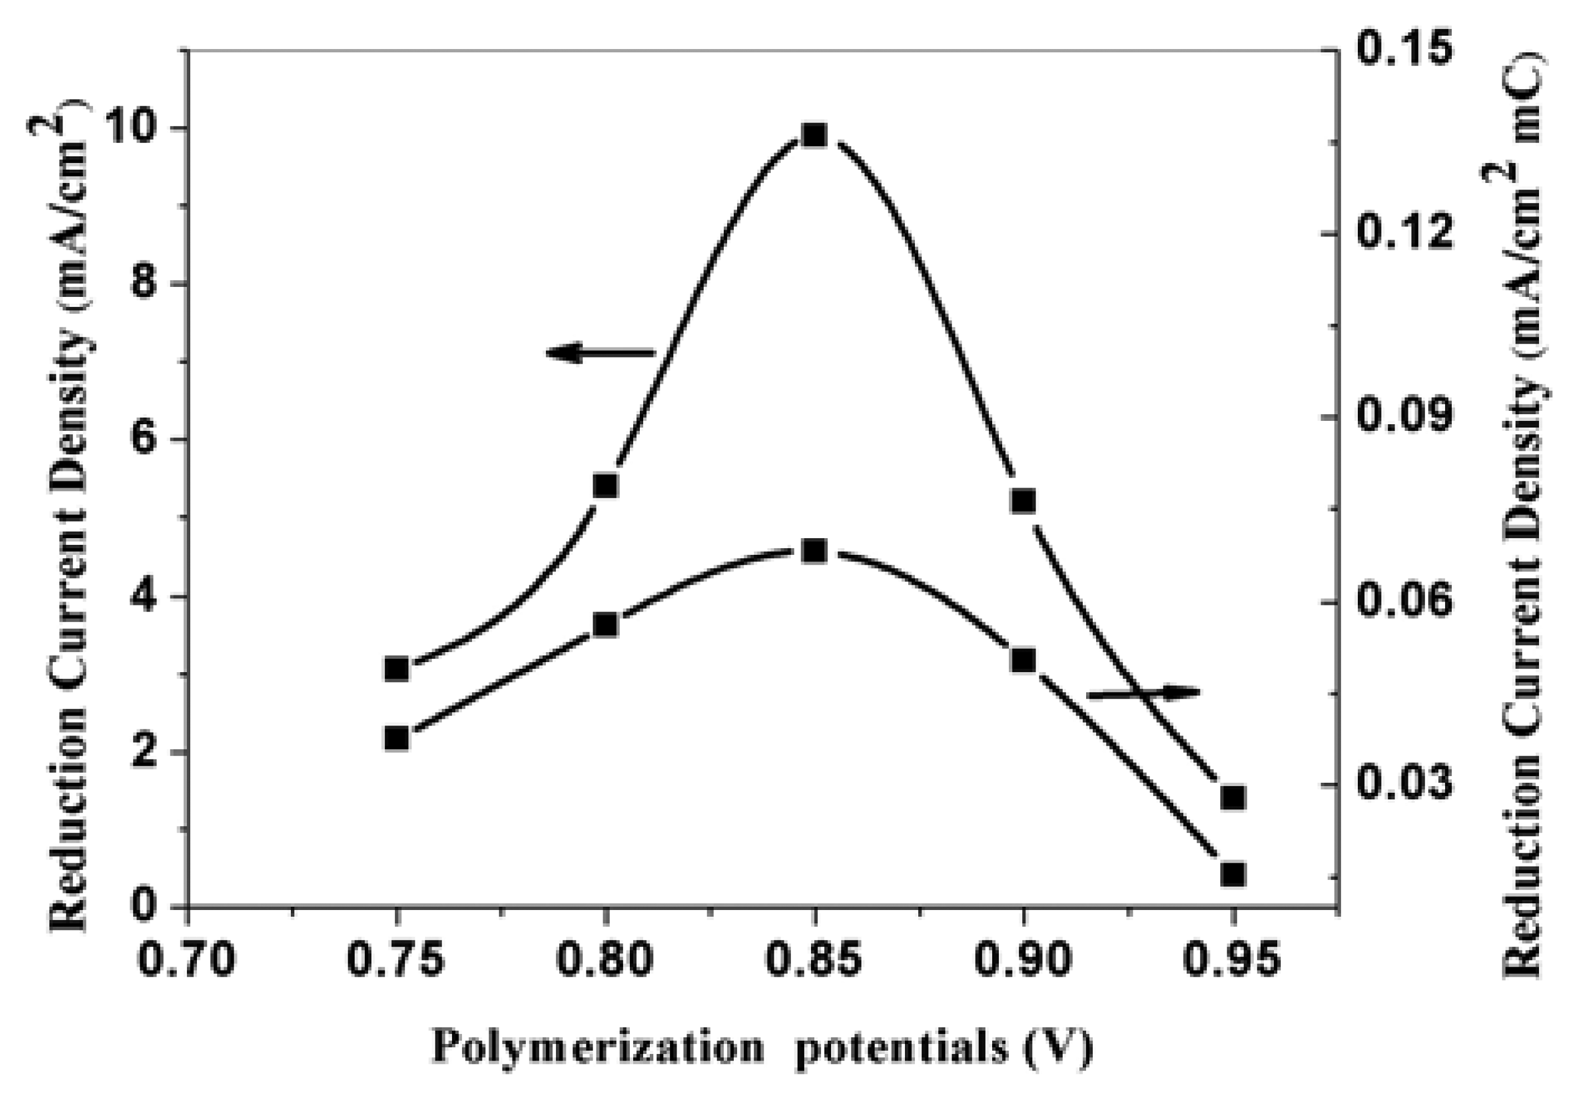
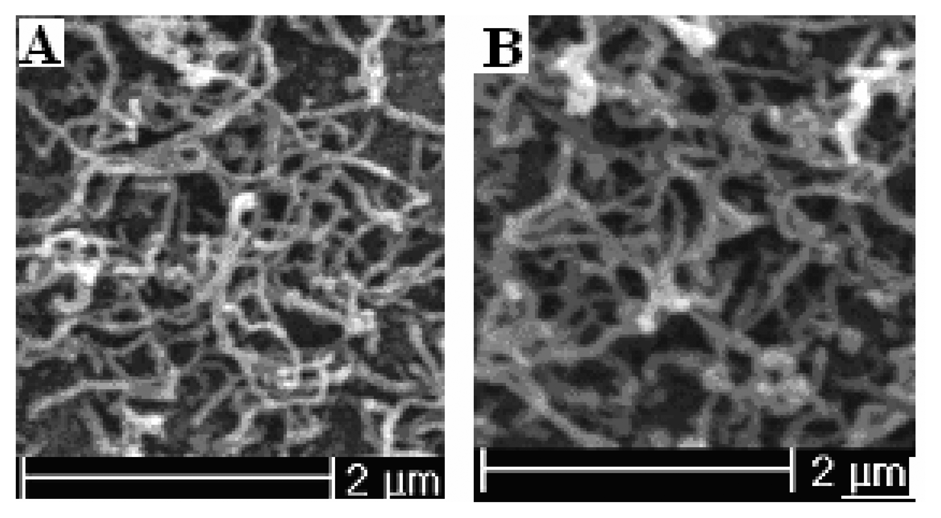
3.2. Effect of polymerization potential on the response characteristics

PPy nanowire modified electrodes were prepared potentiostatically under potential of 0.75 V, 0.80 V, 0.85 V, 0.90 V, and 0.95 V vs SCE for 150-second, respectively. Figure 3 is the SEM pictures of PPy nanowires at 0.75 V, 0.85 V, and 0.95 V. From the picture, we can know that the diameters of nanowires increase from 50 nm for 0.75 V up to 80 nm for 0.85 V, and further increased to about 300 nm for 0.95 V. The figure also clearly shows that the PPy formed at 0.95 V has a loose structure than that formed at low potentials. The relationship between the polymerization potential and the corresponding electroreduction current density of nitrate was shown in figure 4. In order to compare the real effect of polymerization temperature, the corresponding reduction current densities of the modified electrodes for a unit polymerization charge were also shown in the figure. The data are obtained by divided their current densities by polymerization charges. Figure 4 indicates that the corresponding electroreduction current densities of nitrate for a unite polymerization charge and total charge reaches the maximum when the polymerization potential is 0.85 V. When PPy is polymerized at low potentials, the reduction current densities at the modified electrodes increase with the increase of polymerizatyion potentials. This phenomenon is mainly due to the increase of effective surface areas of the modified electrodes. When PPy is polymerized at potential higher than 0.85 V, the corresponding current densities gets less with the polymerization potentials gets higher. This tendency is mainly attributed to the degradation of PPy at high potentials. The results indicate that the corresponding reduction current density is determined not only by the effective surface areas of the electrodes, but also the structure of the modified PPy nanowires.

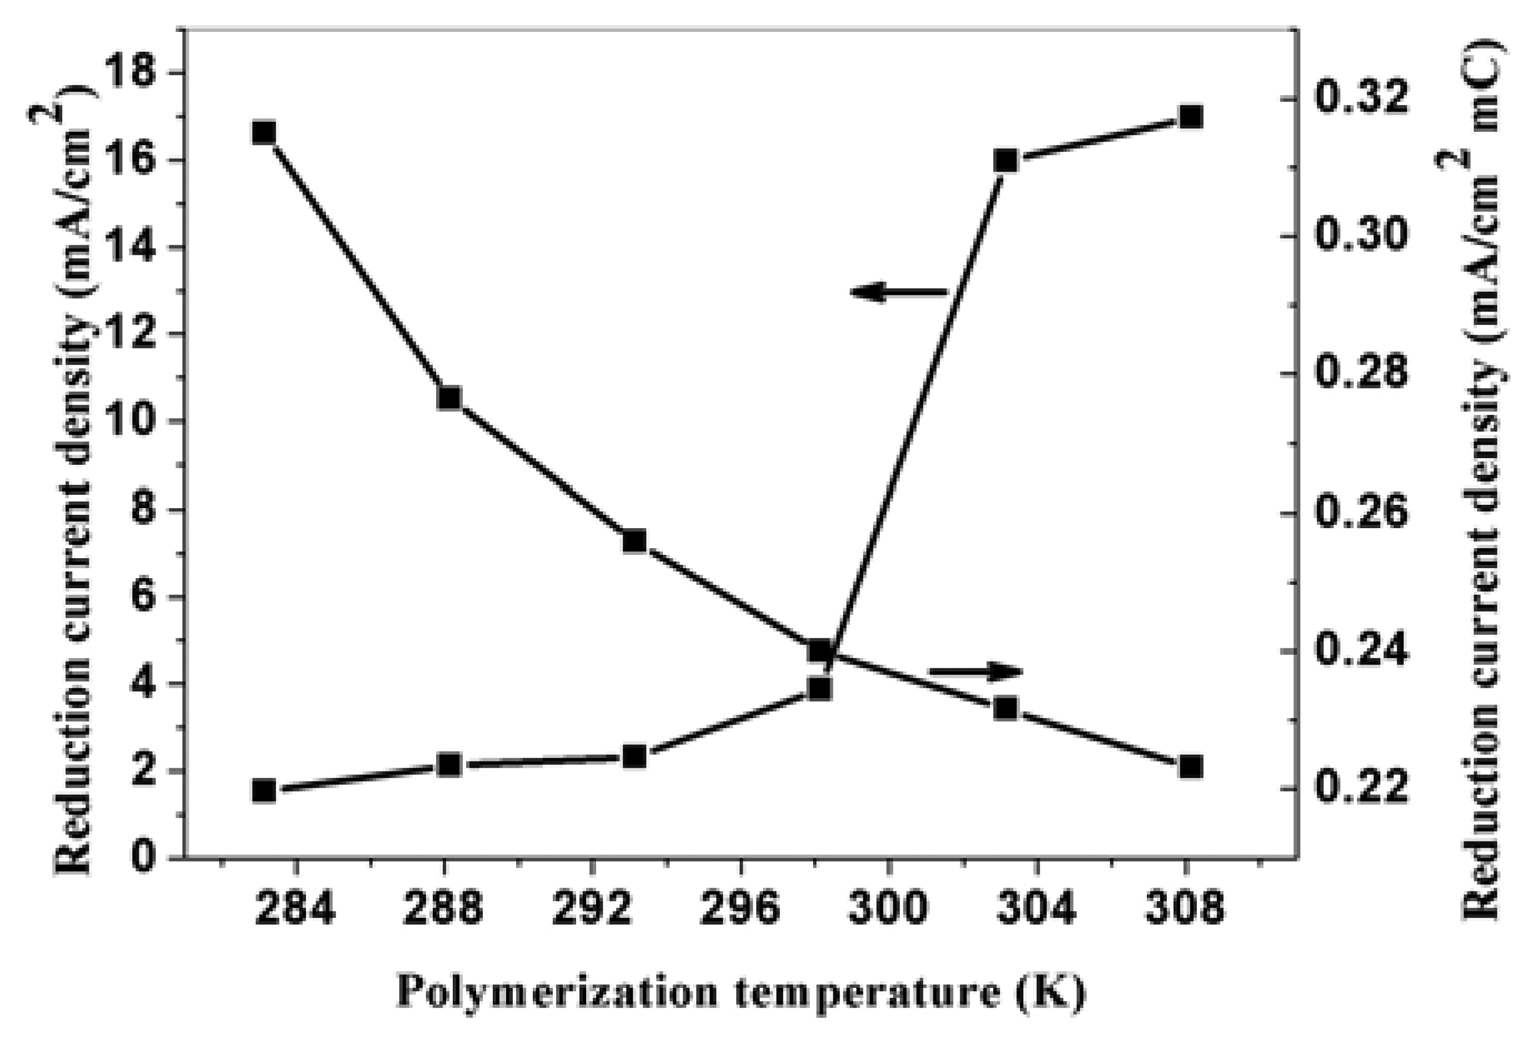
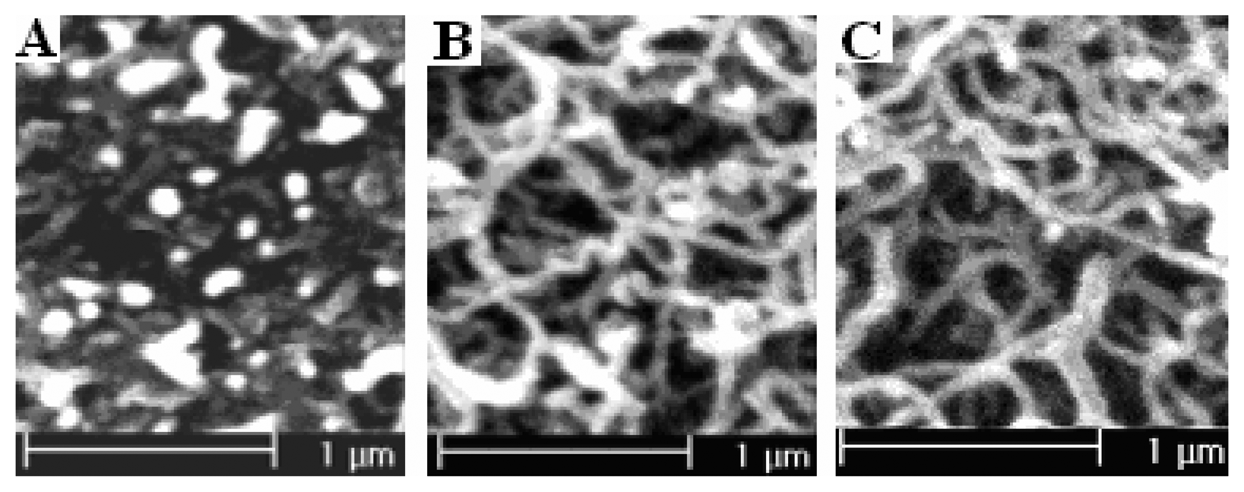
3.3. Effect of polymerization temperature on the response characteristics

Temperature has a significant effect on the polymerization rate of PPy. The higher the polymerization temperature is, the higher the polymerization rate, and thus the higher surface area electrode obtained. Figure 5 is the SEM pictures of PPy nanowires obtained at 283.15 K and 293.15 K potentiostatically under potential of 0.85 V vs SCE for 100-second. From the picture, we can know that the length of nanowires increases with the increase of the polymerization temperature, but the diameters have no obvious change. Figure 6 is the relationship between the polymerization temperature and the reduction current density of nitrate ions. As can be seen, the electroreduction current density for a unite polymerization charge at the modified electrode decreases with the increase of polymerization temperature. This is mainly attributed to the conductivity reduction of PPy prepared at higher temperature. Electroreduction current density for total charge increases with the increase of polymerization temperature. This is due to the increase of the effective surface of nanowires modified prepared at higher temperature. Under the same polymerization time, the polymerization charge increases with the increase of the temperature, which causes the increase of electroreduction current density of total charge. When the temperature is low, the polymerization reaction rate is very slow. So the suitable temperature to polymerize pyrrole is about 288.15 K. These results indicate that the corresponding reduction current density is also related to the conductivity of the modified PPy nanowires.

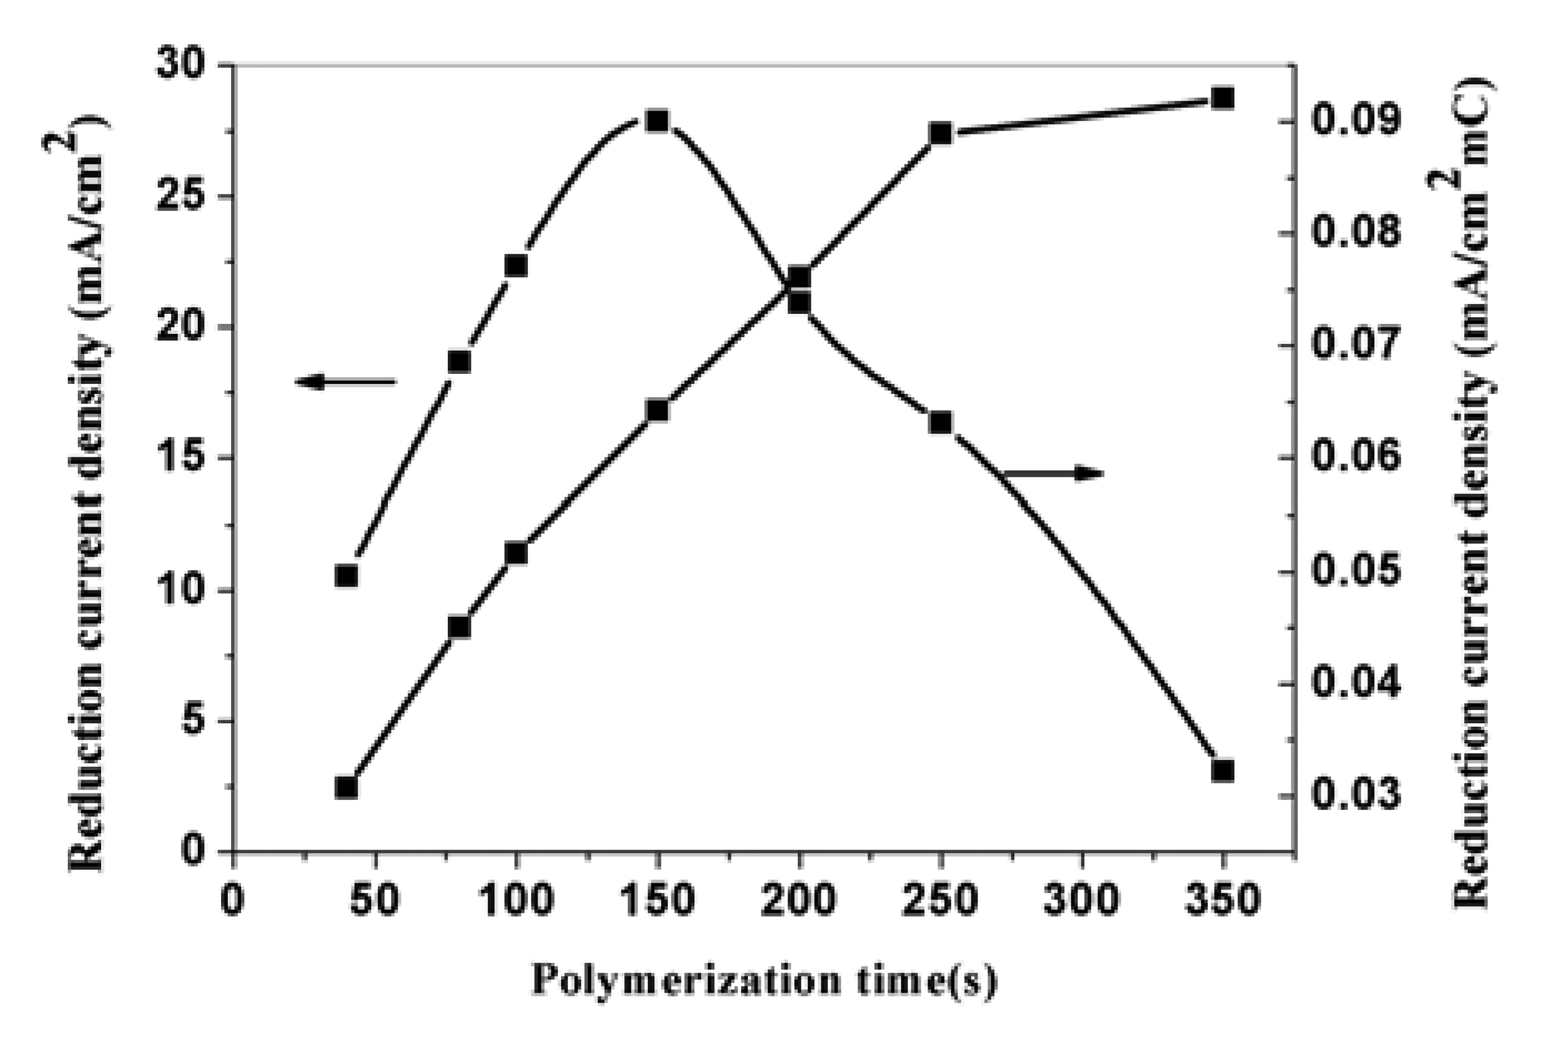
3.4. Effect of polymerization time on the response characteristics

Varying the polymerization time can effectively control the polymerization charge. At the same polymerization potential, the longer the polymerization time is, the more polymerization charge passes. Figure 7 is the SEM pictures of PPy nanowires prepared potentiostatically under potential of 0.85 V vs SCE with 40-second, 150-second, 350-second. The pictures clearly show that the diameters of the formed PPy nanowires almost have no change with the increase of polymerization time, but the length of nanowires increases. Figure 8 is the effect of polymerization time on the corresponding electroreduction current density. The corresponding currents of the electrodes indicate that the current density increases with the increase of polymerization time. The reason is that the effective area of the modified electrodes increases. The curve about corresponding current density for a unit charge in the figure shows that the current density firstly increases with the increase of polymerization time and then decreases when the time exceeds 150-second. This is due to the increase of effective surface for a unit charge at first, but when the polymerization time exceeds 150-second, the diffusion resistance increases with the increase of the thickness of film and the effective surface does not change obviously with the increase of polymerization time. In addition, the film is not well–adhered to the electrode surface when the film is too thick. So the suitable polymerization time to prepared modified electrode is 150-second ∼250-second.

3.5. Effect of scan rate, upper anodic potential limits and number of cyclic voltammetric during polymerization of PPy on response characteristics of modified electrodes

PPy nanowires modified electrodes were also prepared by cyclic voltammetric method (CV). The potential scan range is 0.00-0.80 V vs SCE and the scan rate is form 5 mVs-1 to 200 mVs-1. Figure 9 is the SEM pictures of PPy modified electrodes prepared at 5 mVs-1 and 200 mVs-1. From the picture, we can see that the diameters of nanowires prepared at different scan rate have no obviously difference and the lengths are obviously difference with various scan rates. When prepared with 200 mVs-1, it is more suitable to call the formed PPy as nanoparticles. Figure 10 is the relationship between the scan rate during polymerization of pyrrole and the corresponding electroreduction current density of nitrate. This figure shows that the lower the scan rate during polymerization of pyrrole is, the higher the electroreduction current density of nitrate is. This is caused by the higher effective surface area of the electrodes prepared at lower scan rate. The curve indicates that the corresponding current density is proportional to the amount of PPy formed at the electrode. Curve in figure 9 shows that the electrode prepared at scan rate of 50 mVs-1 has the highest corresponding reduction current density. The corresponding current of the electrodes might be affected by the aggregation state of PPy molecular chains which might be determined by the interval time of the applied potentials. The state of PPy molecular chain was determined by polymerization rate, deposition rate and its structural relaxation. PPy nanowires obtained at scan rate of 50 mVs-1 has favorable response towards electroreduction of nitrate.
The effect of upper anodic potential limits of cyclic voltammetric polymerization and the effect of scan number of cyclic voltammetric polymerization on the electroreduction current density is also studied. Figure 11 and figure 12 respectively show the corresponding electroreduction current density of nitrate at the PPy nanowire modified electrodes. Figure 11 shows the electroreduction current density reaches the maximum when the polymerization potential is 0.85 V. The reason is just as above mentioned. Figure 12 indicates that the electroreduction current densities at the modified electrodes increase with the increase of cyclic voltammetric scan number in polymerization process. When the polymerization charge is too large, the increase degree of the current density is getting less with the increase of polymerization charge. This result demonstrates that the increase degree of effective surface area of modified electrode is more significantly for a thin PPy film than that of thick film. When the polymerization charge is higher than a certain values, the effective surface area will no obviously increase.

3.6. Effect of test solution pH

The effect of pH on the response of NO3- at the modified electrode was investigated with pH at 0.5, 1.0, 1.5, 1.7, 2.5, 3.5, 5, 6 and 7.0, respectively. Figure 13 is the relationship between electroreduction current density and pH. The figure shows that the electroreduction current density of nitrate increases with the decreasing pH value until it reaches about 1.5. Further decrease the solution pH, the reduction currents has no obviously change. Therefore, the determination of NO3- was conducted under pH in the range of 0.5∼1.5.

3.7. Interference study

During redox process, anions or cations might be inserted or expelled from the conductive polymers. When doped with small anions, the motion of anions is predominate to maintain the electro-neutrality of the polymers. When the test solution contains coexisting anions, the coexisting anions will compete the adsorption site with nitrate ions, and so the determination of nitrate may be affected by coexisting anions. The effects of coexisting anions such as sulfate ions, perchlorate ions, phosphate ions and chloride ions, etc. on the electroreduction of nitrate current density were carried out. The experimental results demonstrate that the coexisting anion will low the responding current density of nitrate ions. The higher the charge and the higher the concentration of the coexisting ions are, the lower the electroreduction current density of nitrate is. The experimental results also show that the larger anions have less effect on the reduction current density while they pose the same charge. But when the concentration of coexisting anions is higher than 0.2 M, the electroreduction current density of nitrate ions almost does not change with the increase of concentration of coexisting anions. So, the effect of the coexisting anions can be controlled by adding enough coexisting anions and eliminated by standard calibration curve method.

3.8. Reproducibility and stability of the modified electrode in Determination of NO3-

The behavior of PPy nanowires modified electrode prepared by cyclic voltammetry (CV) between 0.00-0.85 V with three circles at scan rate of 50 mVs-1 has been characterized. Figure 14 shows the relationship between electroreduction current density and nitrate concentration. From the figure, we can conclude that there is good linearity and sensitive response between the nitrate concentration and the electroreduction current density. The slope of the corresponding curves (the sensitivity) is 336.27 mA/M cm2, linear correlation coefficient is 0.9978. Table 1 shows the static results from the analytical results (N=5). From the table, we can know that the standard deviation of the analytical method is 0.03962, and the relative standard deviation for 4×10⁻⁵ M is 1.896 % (N=5). The detection limit is 1.52×10⁻⁶ M (2s, confidence interval 95%).
The stability of the modified electrode was also investigated. The modified electrode had been stored in 0.1 M lithium perchlorate at room temperature for one month without any protection and the response current was almost the same for the determination of NO3-.

3.9. Applications

Two samples of water were collected from the underground water and drinking water of Tianjin district. The nitrate concentrations of the samples were determined by the proposed method. At the same tome, the contents of nitrate were also determined by Ion chromatographic method. The nitrate concentrations obtained from the two methods were listed in Table 2. The table shows that there are not obvious differences found between the proposed method and the ion chromatographic method.

4. Conclusions

The present work reveals that PPy nanowire is largely different from the cauliflower structure. The PPy nanowire modified electrodes have high effective surface area, low diffusion resistance and high electroactivity. The preparation conditions of nanowires have significantly effects on the morphology of PPy nanowires and then the electroreduction current density of nitrate. PPy nanowires modified electrode prepared under the optimal polymerization conditions can detect NO3- at the micromolar level. The sensitivity and the detection limit of the modified electrode are 336.28 mA/M cm2 and 1.52×10⁻⁶ M, respectively. The proposed method will be a promising way for the detection of NO3- in real samples.

References

  1. Liu, H. Q.; Kameola, J.; Czaplewski, D. A.; Craighead, H. G. Polymeric nanowire chemical sensor. Nano. Lett. 2004, 4, 671–675. [Google Scholar]
  2. Alam, M. M.; Wang, J.; Guo, Y. Y.; Lee, S. P.; Tseng, H. R. Electrolyte-gated transistors based on conducting polymer nanowire junction arrays. J. Phys. Chem. B. 2005, 109, 12777–12784. [Google Scholar]
  3. Ramanathan, K.; Bangar, M. A.; Yun, M. H.; Chen, W.; Mulchandani, A.; Myung, N. V. Individually addressable conducting polymer nanowires array. Nano. Lett. 2004, 4, 1237–1239. [Google Scholar]
  4. Tsikas, D.; Gutzki, F. M.; Rossa, S.; Bauer, H.; Neumann, C.; Dockendorff, K.; Sandmann, J.; Frölich, J. C. Measurement of nitrite and nitrate in biological fluids by gas chromatography-mass spectrometry and by the Griess assay: problems with the Griess assay-solutions by gas chromatography-mass spectrometry. Anal. Biochem. 1997, 244, 208–220. [Google Scholar]
  5. Stratford, M. R. L. Measurement of nitrite and nitrate by high-performance ion chromatography. Method. Enzymol. 1999, 301, 259–269. [Google Scholar]
  6. Di Matteo, V.; Pierucci, M.; Esposito, E. Methods for the determination of nitrite by high-performance liquid chromatography with electrochemical detection. J. Chromatogr. A. 1997, 789, 213–219. [Google Scholar]
  7. Hussein, W. R.; Guilbault, G. G. Nitrate and ammonium ion selective electrodes as sensors. I. In bacterial growth curves for isolation of nitrate and nitrite reductases from Escherichia coli. Anal. Chim. Acta. 1974, 72, 381–390. [Google Scholar]
  8. Davenport, R. J.; Johnson, D. C. Voltammetric determination of nitrate and nitrite ions using a rotating cadmium disk electrode. Anal. Chem. 1973, 45, 1979–1980. [Google Scholar]
  9. Casella, I. G.; Gatta, M. Electrochemical reduction of NO3- and NO2- on a composite copper thallium electrode in alkaline solutions. J. Electroanal. Chem. 2004, 568, 183–188. [Google Scholar]
  10. Da Silva, S.; Shan, D.; Cosnier, S. Improvement of biosensor performances for nitrate determination using a new hydrophilic poly(pyrrole-viologen) film. Sensor. Actuat. B-Chem. 2004, 103, 397–402. [Google Scholar]
  11. Jain, A. K.; Gupta, V. K.; Singh, L. P.; Raisoni, J. R. Chelating ionophore based membrane sensors for copper(II) ions. Talanta. 2005, 66, 1355–1361. [Google Scholar]
  12. Han, G. Y.; Shi, G. Q. Conducting polymer electrochemical actuator made of high-strength three-layered composite films of polythiophene and polypyrrole. Sensor. Actuat. B-Chem. 2004, 99, 525–531. [Google Scholar]
  13. Lei, J. P.; Ju, H. X.; Ikeda, O. A novel supramolecular assembly film of porphyrin bound DNA: Characterization and catalytic behaviors towards nitric oxide. Sensor. 2005, 5, 171–184. [Google Scholar]
  14. Da Rocha, J. R. C.; Angnes, L.; Bertotti, M.; Araki, K.; Toma, H. E. Amperometric detection of nitrite and nitrate at tetraruthenated porphyrin-modified electrodes in a continuous-flow assembly. Anal. Chim. Acta. 2002, 452, 23–28. [Google Scholar]
  15. Asghari, A.; Amini, M. K.; Mansour, H. R.; Salavati-Niasari, M.; Rajabi, M. Nitrate-selective membrane electrode based on bis(2-hydroxyanil)acetylacetone lead(II) neutral carrier. Anal. Sci. 2003, 19, 1121–1125. [Google Scholar]
  16. Badea, M.; Amine, A.; Palleschi, G.; Moscone, D.; Volpe, G.; Curulli, A. New electrochemical sensors for detection of nitrites and nitrates. J. Electroanal. Chem. 2001, 509, 66–72. [Google Scholar]
  17. Davis, J.; Moorcroft, M. J.; Wilkins, S. J.; Compton, R. G.; Cardosi, M. Electrochemical detection of nitrate at a copper modified electrode under the influence of ultrasound. Electroanal. 2000, 12, 1363–1367. [Google Scholar]
  18. Ugo, P.; Moretto, L. M.; Mazzocchin, G. A.; Guerriero, P.; Martin, C. R. Electrochemical preparation and characterization of an anion-permselective composite membrane for sensor technology. Electroanal. 1998, 10, 1168–1173. [Google Scholar]
  19. Cosnier, S.; Galland, B.; Innocent, C. New electropolymerizable amphiphilic viologens for the immobilization and electrical wiring of a nitrate reductase. J. Electroanal. Chem. 1997, 433, 113–119. [Google Scholar]
  20. Sun, B.T.; Fitch, P. G. Nitrate ion-selective sensor based on electrochemically prepared conducting polypyrrole films. Electroanal. 1997, 6, 494–497. [Google Scholar]
  21. Hutchins, R. S.; Bachas, L. G. Nitrate-selevtive electrode developed by electrochemically mediated imprinting/doping of polypyrrole. Anal. Chem. 1995, 67, 1654–1660. [Google Scholar]
  22. Cosnier, S.; Innocent, C.; Jouanneau, Y. Amperometric detection of nitrate via a nitrate reductase immobilized and electrically wired at the electrode surface. Anal. Chem. 1994, 66, 3198–3201. [Google Scholar]
  23. Kang, S. C.; Lee, K. S.; Kim, J. D.; Kim, K. J. Polypyrrole modified electrode as a nitrate sensor. Bull. Korean Chem. Soc. 1990, 11, 124–126. [Google Scholar]
  24. Rau, J. R.; Chen, S. C.; Sun, H. W. Characterization of a polypyrrole microsensor for nitrate and nitrite ions. Electrochim. Acta. 1994, 39, 2773–2779. [Google Scholar]
  25. Wu, J. C.; Mullett, W. M.; Pawliszyn, J. Electrochemically controlled solid-phase microextraction based on conductive polypyrrole films. Anal. Chem. 2002, 74, 4855–4859. [Google Scholar]
  26. Bruheim, I.; Liu, X. C.; Pawliszyn, J. Thin-film microextraction. Anal. Chem. 2003, 75, 1002–1010. [Google Scholar]
Figure. 1. SEM pictures of polypyrrole modified electrode surface. (A: Nanowires; B: cauliflower).
Sensors 05 00580f1
Figure 2. Cyclic voltammetric curves of PPy nanowire modified electrode with a scan rate at 5 mVs-1 in 0.5 M H2SO4 solution containing: (1) no NO3-; (B) 2.2 mM NO3-; (C) 3.6 mM NO3-.
Sensors 05 00580f2
Figure 3. The SEM pictures of polypyrrole nanowires prepared potentiostatically at different potentials (A) at 0.75 V; polymerization charge 81.58 mC; (B) at 0.85 V; polymerization charge 144.95 mC; (C) at 0.95 V; polymerization charge 191.56 mC.
Sensors 05 00580f3
Figure 4. The effect of polymerization potential on the corresponding electroreduction current density of nitrate at PPy nanowire modified electrode. Electrolyte: 0.5 M H2SO4; nitrate concentration: 0.015 M.
Sensors 05 00580f4
Figure 5. The SEM pictures of polypyrrole nanowires prepared potentiostatically at 0.85 V for 150-second at different temperature. (A) 283.15 K; polymerization charge 48.58 mC; (B) 293.15 K; polymerization charge 90.26 mC.
Sensors 05 00580f5
Figure 6. The effect of temperature on the corresponding electroreduction current density of nitrate at PPy nanowire modified electrode. Electrolyte: 0.5 M H2SO4; nitrate concentration: 0.015 M.
Sensors 05 00580f6
Figure 7. The SEM pictures of polypyrrole nanowires prepared potentiostatically at 0.85 V with different polymerization time (A) 40-second; Polymerization Charge 49.19 mC; (B) 150-second; Polymerization Charge 186.57 mC; (C) 350-second; Polymerization Charge 893.01 mC.
Sensors 05 00580f7
Figure 8. The effect of polymerization time on the corresponding electroreduction current density of nitrate at PPy nanowire modified electrode. 0.5 M H2SO4; nitrate concentration: 0.015 M.
Sensors 05 00580f8
Figure 9. The SEM pictures of polypyrrole nanowires prepared by cyclic voltammetry between 0.00-0.80 V. (A) at the scan rate of 5 mVs-1; polymerization charge 281.44 mC; (B) at the scan rate of 200 mVs-1; polymerization charge 16.254 mC.
Sensors 05 00580f9
Figure 10. The effect of electropolymerization scan rate on the corresponding electroreduction current density of nitrate at PPy nanowire modified electrode. Electrolyte: 0.5 M H2SO4; 0.015 M NaNO3.
Sensors 05 00580f10
Figure 11. The effect of electropolymerization of upper anodic potential limits (CV) at scan rate of 50 mVs-1 on the corresponding electroreduction current density of nitrate at PPy nanowire modified electrode. Electrolyte: 0.5 M H2SO4; 0.015 M NaNO3.
Sensors 05 00580f11
Figure 12. The effect of electropolymerization CV number at scan rate of 50 mVs-1 on the corresponding electroreduction current density of nitrate at PPy nanowire modified electrode. Electrolyte: 0.5 M H2SO4; 0.015 M NaNO3.
Sensors 05 00580f12
Figure 13. Relationship between electroreduction current density and pH at PPy nanowire modified electrode.
Sensors 05 00580f13
Figure 14. Relationship between electroreduction current density and nitrate ion concentration at PPy nanowire modified electrode. Supporting electrolyte: 0.50 M H2SO4.
Sensors 05 00580f14
Table 1. The comprehensive results about the amperometric determination of nitrate.
J(mA/cm2)Standard deviation
(SD)
MeanRSD(%)
4.947
4.932
4.9150.092584.88221.896
4.897
4.720
Table 2. Comparison between a standard Ion chromatography method and the proposed method for nitrate determination.
Samples(A) Proposed method
(10-4 mol 1-1)
(B) Ion chromatography
(10-4 mol 1-1)
(B-A)/B (%)
water1.1631.2214.75
River4.7424.8392.01
Average values of five determinations.

