Article

Electrochemical Sensors for Detection of Acetylsalicylic Acid

by
Veronika Supalkova
1,
Jiri Petrek
1,
Ladislav Havel
1,
Sona Krizkova
2,
Jitka Petrlova
2,
Vojtech Adam
2,
David Potesil
2,
Petr Babula
4,
Miroslava Beklova
5,
Ales Horna
6 and
Rene Kizek
2,*
1
Department of Plant Biology, Faculty of Agronomy, Mendel University of Agriculture and Forestry, Zemedelska 1, CZ-613 00 Brno, Czech Republic
2
Department of Chemistry and Biochemistry, Faculty of Agronomy, Mendel University of Agriculture and Forestry, Zemedelska 1, CZ-613 00 Brno, Czech Republic
3
Department of Analytical Chemistry, Faculty of Science, Masaryk University, Kotlarska 2, CZ-611 37 Brno, Czech Republic
4
Department of Natural Drugs University of Veterinary and Pharmaceutical Sciences, Palackeho 1-3, CZ-612 42 Brno, Czech Republic
5
Department of Veterinary Ecology and Environmental
6
Department of Food Engineering and Chemistry, Faculty of Technology, Tomas Bata University, CZ-762 72 Zlin, Czech Republic
*
Author to whom correspondence should be addressed.
Sensors 2006, 6(11), 1483-1497; https://doi.org/10.3390/s6111483
Submission received: 16 October 2006 / Accepted: 27 November 2006 / Published: 6 November 2006
(This article belongs to the Special Issue Sensors in Flow Analysis)

Abstract

:
Acetylsalicylic acid (AcSA), or aspirin, was introduced in the late 1890s and has been used to treat a variety of inflammatory conditions. The aim of this work was to suggest electrochemical sensor for acetylsalicylic detection. Primarily, we utilized square wave voltammetry (SWV) using both carbon paste electrode (CPE) and of graphite pencil electrode (GPE) as working ones to indirect determination of AcSA. The principle of indirect determination of AcSA bases in its hydrolysis on salicylic acid (SA), which is consequently detected. Thus, we optimized both determination of SA and conditions for AcSA hydrolysis and found out that the most suitable frequency, amplitude, step potential and the composition and pH of the supporting electrolyte for the determination of SA was 260 Hz, 50 mV, 10 mV and Britton-Robinson buffer (pH 1.81), respectively. The detection limit (S/N = 3) of the SA was 1.3 ng/ml. After that, we aimed on indirect determination of AcSA by SWV CPE. We tested the influence of pH of Britton-Robinson buffer and temperature on yield of hydrolysis, and found out that 100% hydrolysis of AcSA was reached after 80 minutes at pH 1.81 and 90°C. The method for indirect determination of AcSA has been utilized to analyse pharmaceutical drug. The determined amount of AcSA in the pharmaceutical drug was in good agreement with the declared amounts. Moreover, we used GPE for determination of AcSA in a pharmaceutical drug. Base of the results obtained from stationary electrochemical instrument we used flow injection analysis with electrochemical detection to determine of salicylates (SA, AcSA, thiosalicylic acid, 3,5-dinitrosalicylic acid and 5-sulfosalicylic acid – SuSA). We found out that we are able to determine all of detected salicylates directly without any pre-treatment, hydrolysis and so on at units of femtomoles per injection (5 μl).

1. Introduction

Salicylates, in the form of willow bark, were used as an analgesic during the time of Hippocrates [1], and their antipyretic effects have been recognized for more than 200 years [2]. Acetylsalicylic acid (AcSA, Fig. 1A), or aspirin, was introduced in the late 1890s [3] and has been used to treat a variety of inflammatory conditions [4,5]; however, the antiplatelet activity of this agent was not recognized until almost 70 years later [6-8]. There have been also demonstrated aspirin therapeutic benefit in a variety of cardiovascular diseases with its doses of 30 to 1500 mg/d [7-13]. The effect of salicylates on cancer treatment has been studied, too [5,14-17]. Moreover, inhibition of growth of bacteria Helicobacter pylori [18] and Staphyloccocus aureus [19] has been recently described.
A number of analytical approaches such as UV-Vis spectrometry [20], spectrofluorimetry [21-23], flow injection analysis [24-28] and high performance liquid chromatography (HPLC) [29-31] coupled with different detectors has been suggested for determination of acetylsalicylic acid. Each method has its advantages and limitations and may serve a particular need in analysis. In contrast, suggesting of electrochemical sensors is an attractive alternative method for electroactive species detection, because of its inherent advantages of simplicity, high sensitivity and relatively low cost [32,33]. There have been suggested both spectrophotometric [34-37] and amperometric [25,38,39] sensors for detection of AcSA, but the amperometric ones did used extra working electrode or hydrolysis of compound of interest.
The aim of this work was to suggest electrochemical sensor for acetylsalicylic detection. Primarily, we utilized square wave voltammetry (SWV) using both carbon paste electrode (CPE) and of graphite pencil electrode (GPE) as working ones to indirect determination of AcSA (a scheme of electrochemical cell is shown in Fig. 1B). The principle of indirect determination of AcSA bases in its hydrolysis on salicylic acid (SA), which is consequently detected. Thus, we had to optimize both determination of SA and conditions for AcSA hydrolysis. After that we optimized the detection of AcSA, we used the technique for indirect determination of AcSA in a pharmaceutical drug. Moreover, base of the results obtained from the stationary electrochemical instrument we utilized flow injection analysis with electrochemical detection to direct determine of AcSA and other salicylates (thiosalicylic acid – TSA, 3,5-dinitrosalicylic acid – DNSA and 5-sulfosalicylic acid – SuSA; Fig. 1) that can not be detected directly by SWV.

2. Material and methods

2.1. Chemicals

All chemicals were purchased from Sigma-Aldrich (St. Louis, USA). The stock standard solutions of compounds of interest (SA, AcSA, TSA, DNSA and SuSA) at 50 mg.ml-1 were prepared by methanol and stored in the dark at -20 °C. Working standard solutions were prepared daily by dilution of the stock solutions. The pH value was measured using pH-meter WTW (MultiLab Pilot; Weilheim, Germany), controlled by personal computer program (MultiLab Pilot). The pH-electrode (SenTix H, pH 0..14/0..100°C/3M KCl) was regularly calibrated by set of WTW buffers (MultiLab Pilot).

2.2. Preparation of pharmaceutical drug samples

The pharmaceutical drug (Acylpyrin, Slovakofarma, Medicamenta, Czech Republic) were used. The tablets were homogenised by an A 11 basic IKA analysis mill (IKA-Werke GmbH and Co. KG, Staufen, Germany). The homogenised samples (10 mg) were dissolved in 1 ml of methanol and analyzed (10 μl).

2.3. Electrochemical measurement

2.3.1. Preparation of carbon paste electrode and carbon lead electrode

The carbon paste was made of 70 % graphite powder (Aldrich, USA) and 30 % mineral oil (Sigma-Aldrich, USA; free of DNase, RNase and protease). The carbon paste was housed in a Teflon body having a 2.5 mm diameter of active disk surface. The electrode surface was polished before each determination with a soft filter paper prior to measurement; for more details see our previous published papers [42,43]. The pencil leads (a lead diameter = 500 μm, total length = 60 mm) were purchased from Kohinor (České Budějovice, Czech Republic). Immersing of 3 mm of the pencil lead into a solution resulted in an active electrode area of 4.91 mm2. The electrodes were used without any pre-treatment. They were polished mechanically by 0.1 μm of alumina (ESA Inc., USA) [44,45]. An using of graphite pencil electrode as working electrode has been also published in [46-49].

2.3.2 Electrochemical measurements

Electrochemical measurements were performed using an AUTOLAB 30 analyser (EcoChemie, The Netherlands) using a standard cell with three electrodes. The three-electrode system consisted of the carbon paste and/or the graphite pencil working electrode, an Ag/AgCl/3M KCl reference electrode and a carbon counter electrode. All experiments were carried out at laboratory temperature. The raw data were treated using the Savitzky and Golay filter (level 2) [50] and the moving average baseline correction (peak width 0.03) of the GPES software. Britton-Robinson buffer (pH 1.81) consisting of 0.4 M H3PO4, 0.4 M CH3COOH, and 0.4 M H3BO3 was used as supporting electrolyte. Its pH was adjusted by 0.2 M NaOH. The square wave voltammetric parameters were as follows: initial potential 0.7 V, end potential 1.5 V, other parameters (frequency, amplitude and step potential were optimised.

Cyclic voltammetry

The instrument, temperature, tool for data treatment and buffer used were the same as above. The three-electrode system included the carbon paste working electrode, an Ag/AgCl/3M KCl reference electrode and a carbon auxiliary electrode. The cyclic voltammetric parameters were as follows: initial potential of 0 V, vertex potential 1.2 V, end potential 0 V, step potential 5 mV.

2.4. Flow injection analysis with electrochemical detection

A flow injection system with electrochemical detection (FIA-ED) consisted of solvent delivery pumps operating in range of 0.001-9.999 ml.min-1 (Model 582 ESA Inc., Chelmsford, MA), a reaction coil (1 m) and a CoulArray electrochemical detector (Model 5600A, ESA, USA); see in Fig. 5A. The electrochemical detector includes two flow cells (Model 6210, ESA, USA). Each cell consists of four analytical cells containing working carbon porous electrode, two auxiliary and two referent electrodes (inset in Fig. 5A). The detector and the reaction coil were thermostated (30 °C). The sample (5 μl) was injected manually.

2.5. Statistical analysis

STATGRAPHICS® (Statistical Graphics Corp®, USA) was used for statistical analyses. Results are expressed as mean ± S.D. unless noted otherwise. Value of p < 0.05 was considered significant.

3. Results and discussion

Primarily, we were interested if certain derivatives of salicylic acid could interfere with the electrochemical determination of this compound. For this purpose, we utilized cyclic voltammetry because CV belongs to fundamental electrochemical techniques that can be used to study of basic electrochemical properties and behaviour of compounds of interest [51,52]. Salicylic acid gave the signal at potential of 1.09, which increased with increasing concentration and scan rate. The possible scheme of oxidation of SA is shown in Fig. 1C and described in [40,41].
After the measurement of SA, we analyzed four derivatives of salicylic acid, namely thiosalicylic acid, acetylsalicylic acid, 5-sulphosalicylic acid, and 3,5-dinitrosalicylic acid. We found out acetylsalicylic acid and 3,5-dinitrosalicylic acid did not give any electrochemical signal. On the other hand, thiosalicylic and 5-sulphosalicylic acids were electro-active and gave their signals at the potentials of 0.70 and 1.15 V, respectively. It clearly follow from the results obtained that electro-activity of salicylates strongly depends on the group bound to the salicylic acid. Only sulphur-substituted salicylic acid exhibited the electrochemical response, but the responses, the peak heights, were much lower in comparison with the nonsubstituted one. As for the potentials producing the signals, they were different enough to distinguish salicylic acid from its derivates. More details was published in [53].

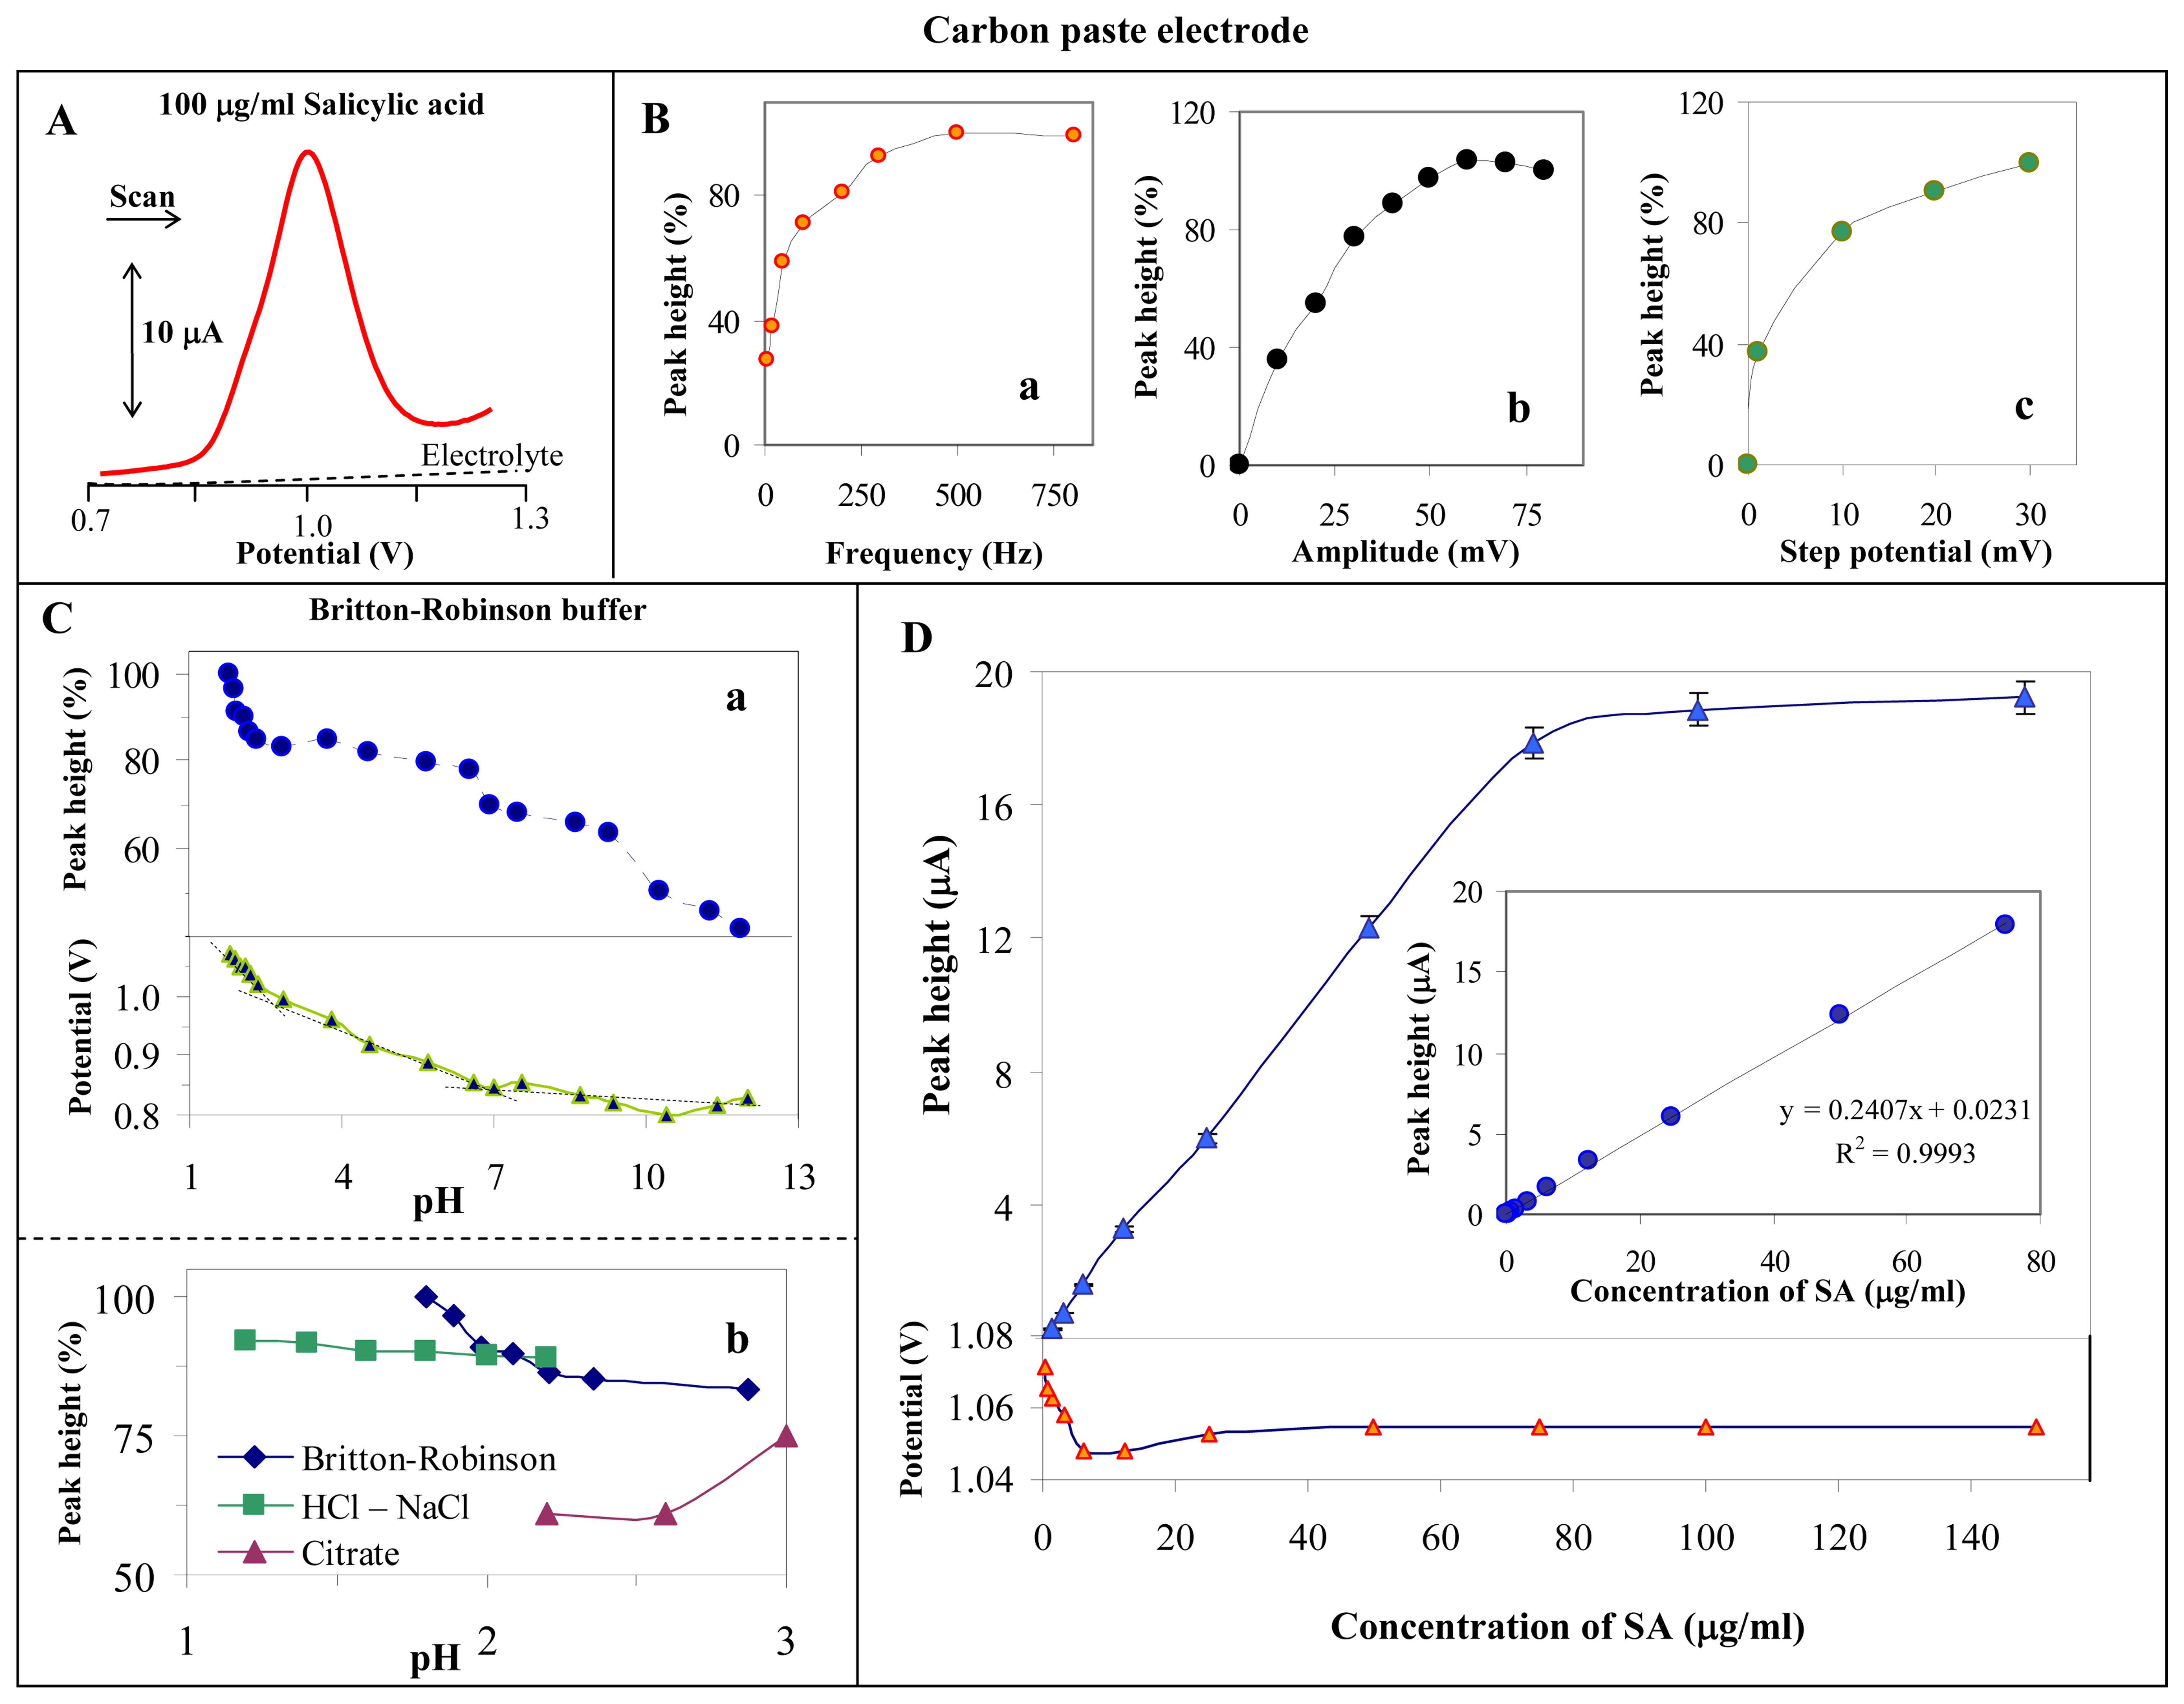
3.1. Study of electrochemical behaviour of salicylic acid on the surface of the carbon paste electrode

Recently Torreiro et al. published the paper on determination of salicylic acid on a glassy carbon electrode using differential pulse voltammetry [54]. Based on the results published that salicylic acid (SA) is an electroactive compounds and can be determine by differential pulse voltammetric technique, we attempted to utilize other voltammetric technique, particularly square wave voltammetry (SWV), for the determination of SA because of the advantages of these technique. Among these are its excellent sensitivity and the rejection of background currents. Another is the speed. This speed, coupled with computer control and signal averaging, allows for experiments to be performed repetitively and increases the signalto-noise ratio. Applications of square wave voltammetry include the study of electrode kinetics with regard to preceding, following, or catalytic homogeneous chemical reactions. Therefore, we applied this technique to study of behaviour of SA on the surface of carbon paste working electrode (CPE). SWV voltammogram of 100 μg/ml SA measured in the presence of Britton-Robinson buffer (pH 2.3) is shown in Fig. 2A. We proved that it is necessary to study an influence of frequency, amplitude and step potential on a height of studied signal during square wave voltammetric measurements due to increasing of sensitivity of an analysis [55]. Thus, we optimised above-mentioned SWV parameters and found out that the most suitable frequency, amplitude and step potential for the determination of SA was 260 Hz, 50 mV and 10 mV, respectively (Fig. 2B). In addition, Torreiro also described the influence of pH of a supporting electrolyte on a signal of SA [54]. Therefore we studied the influence of pH (1.8 – 11.8) of Britton-Robinson buffer on the height and potential of SA signal (Fig. 2Ca). We found out accord with Torreiro [54] that the highest signals of SA were obtained at acidic pH from 1 to 3. We also observed few break points on the curve of dependence of SA peak potential on different pH of Britton-Robinson buffer (Fig. 2Ca). The first break point at pH about 3 probably corresponds to the first pKa of SA (pKa1 = 2.97). A second break, which may correspond to second pKa, did not appear due to higher pKa value (pKa2 = 13.40). Besides that we were interested in the issue how could the different buffers influenced the analysis. Except Britton-Robinson we selected two other buffers HCl – NaCl and citrate buffer for our purposes, because these buffers could buffer lower pH (1 – 3), where we found out the highest signal of SA. Obtained dependences of SA peak height on pH of the tested buffers are shown in Fig. 2Cb. It is evident that the using of different buffers markedly influences the SA signal. The SA signal measured in the presence of citrate buffer was lower more than 35 % in comparison with Britton-Robinson ones. HCl – NaCl buffer did not much influence the SA signal. It is evident that the highest signal of SA was obtained at pH 1.8 in the presence of Britton-Robinson buffer. The phenomenon probably relates with different ionic strength of the studied buffers, which will be published elsewhere.
If we used the most suitable conditions for the determination of SA on CPE, we studied the dependence of SA peak height and potential on its concentration. Height of the signals linearly increased with increasing SA concentration up to 80 μM (y = 0.2407x + 0.0231; R2 = 0.9993), and then did not changed, which would be probably related to saturation of the electrode surface [56,57]. The detection limit (S/N = 3) of the SA was 1.3 ng/ml. The potential of the studied signal did not changed with increasing SA concentration (Fig. 2D).

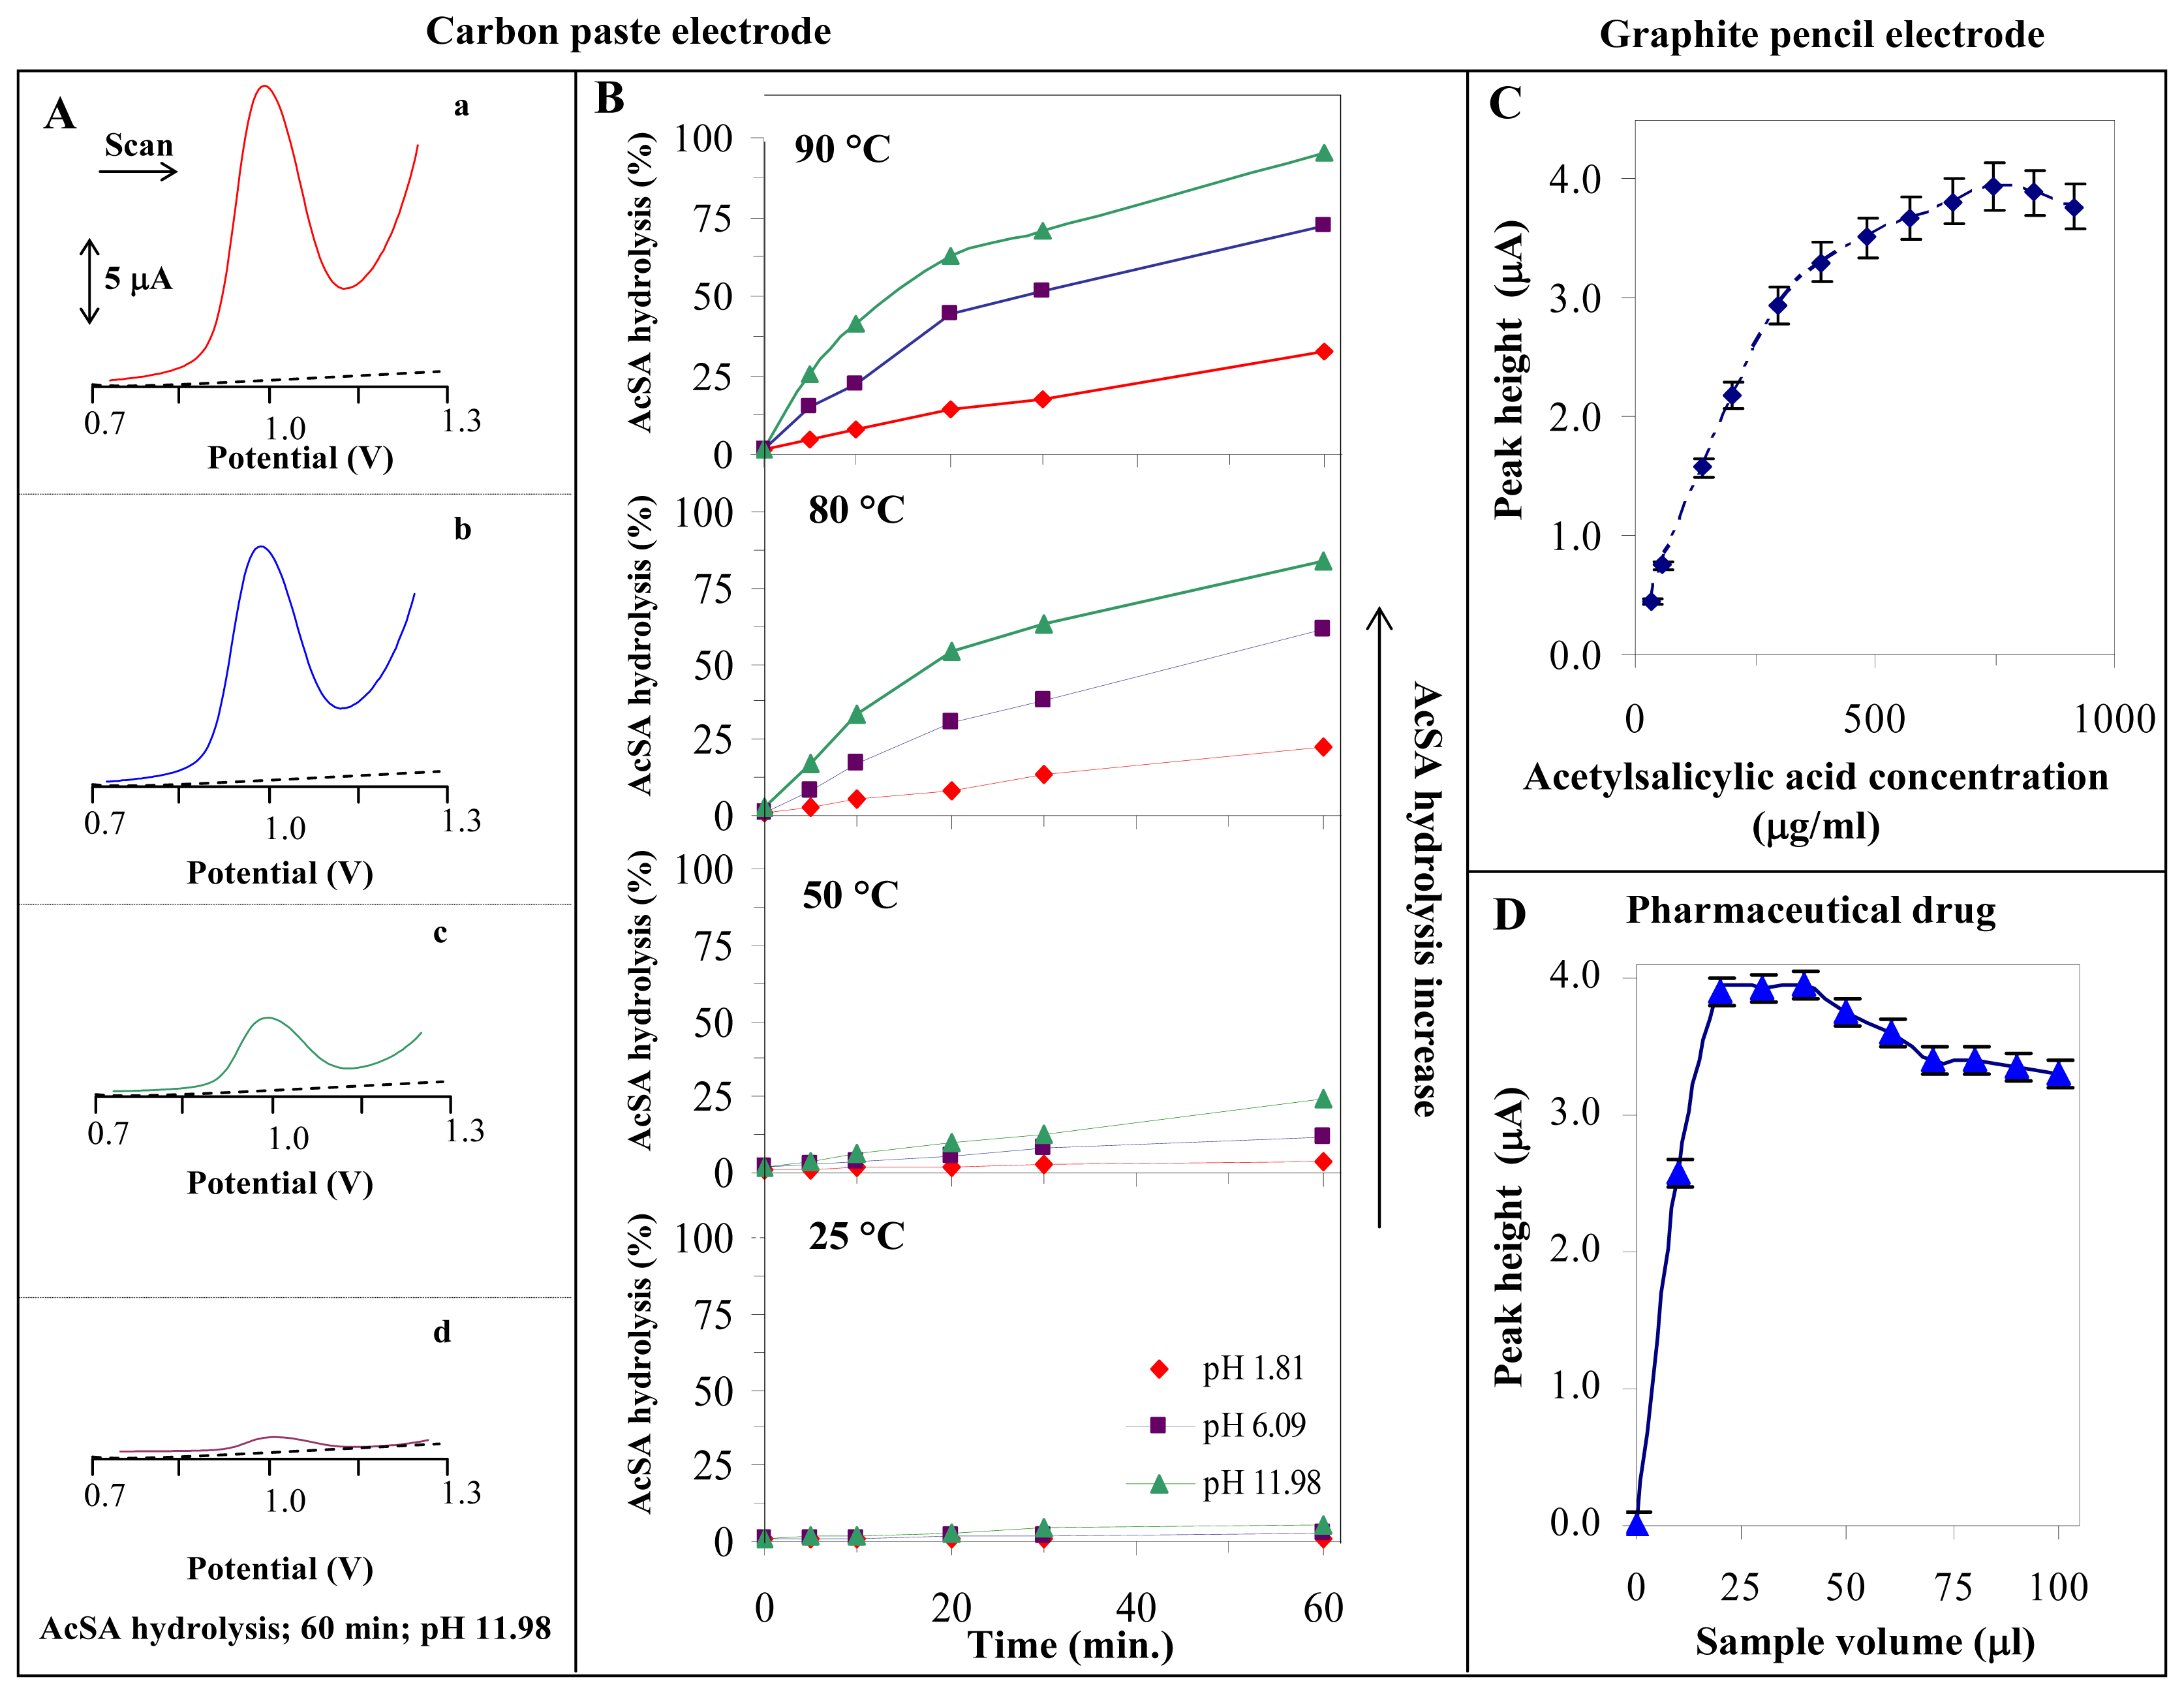
3.2. Indirect determination of acetylsalicylic acid

As we mentioned above, AcSA did not give any SWV signal on the surface of CPE, but it is common knowledge that it could be hydrolyzed on salicylic acid [58]. It has been published that a rapid hydrolysis (10 min, a boiling) proceeds at high pH (about 12) followed by neutral and acidic pH (about 2), where AcSA is the most stable [59]. On the base of these results we studied the stability of AcSA according to increasing pH and temperature of Britton-Robinson buffer. AcSA (900 μl of Britton-Robinson buffer and 100 μl of methanolic solution of AcSA; total concentration of AcSA was 5 mg.ml-1) were hydrolyzed at four different temperatures (25, 50, 80 and 90 °C) and at three different pH values (1.81, 6.09 and 11.98). We took 20 μl from the hydrolyzed solution at 0, 5, 10, 20, 30 and 60 min and analyzed it by SWV on the surface of CPE in the presence of Britton-Robinson buffer (pH = 1.8). We obtained a well developed signal at potential about 1.05 V (Figs. 3Aa,b,c,d). The rate of hydrolysis (%hydr.), which was calculated according to following equation:
% hydr . = [ S A ] 76.7 × 100 ,
where [60] is concentration of SA (μg.ml-1) plotted from calibration curve and 76.7 is value of maximal SA concentration, which could be obtained during 100% hydrolysis of 100 μg.ml-1 AcSA, increased with increasing pH and temperature of Britton-Robinson buffer (Fig. 3B).
After 60 minutes at 25 °C and pH of 11.98, only 5 % of AcSA hydrolyzed, at pH of 1.81 the hydrolysis was negligible (Figs. 3A,B). After 60 minutes at 50 °C, we observed the hydrolysis not only at pH 11.98 (15 %) but also at pH 1.81 (4 %). Moreover if we hydrolyzed AcSA at the highest tested temperatures (80 and 90 °C), we observed marked increase of %hydr. in comparison with other ones (80 °C – 85 % and 90 °C – 96 %; after 60 min. at pH of 11.98). 100% hydrolysis of AcSA was reached after 80 minutes at the highest temperature and pH (not shown).

3.3. Indirect determination of acetylsalicylic acid in a pharmaceutical drug by SWV CPE

The above-mentioned method for indirect determination of acetylsalicylic acid has been applied on analysis of a pharmaceutical drug (Acylpyrin). The tablets were homogenised by the same way as described in Section 2.3. We took 100 μl of the methanolic solution and added it to Britton-Robinson buffer (900 μl, pH 11.98). The mixture was shook on Vortex–2 Genie (450 rpm, Scientific Industries, USA) for 60 min at 90 °C. After that, the obtained extract (100 μl) was added to the supporting electrolyte (Britton-Robinson, pH 1.8) and analyzed by SWV CPE. The determined amount of AcSA in the pharmaceutical drug, which was plotted from the calibration curve, was in good agreement with the declared amounts (difference about 5 %).

3.4. A determination of acetylsalicylic acid in the pharmaceutical drug using SWV GPE

Here, we applied the GPE for a determination of acetylsalicylic acid in the pharmaceutical drug. We used the same conditions for AcSA hydrolysis as in section 3.4 (90 °C, 80 min, Briton-Robinson buffer of pH 1.81). The obtained voltammograms are shown in Fig. 4A. The dependence of the SA peak height on AcSA concentration was linear up to 300 μg/ml (y =0.0098x + 0.1231; R2 = 0.9914). The increase in SA peak height at AcSA concentration from 350 to 750 μg/ml was more gradually, but we also obtained a linear dependence (y = 0.0018x + 2.6317; R2 = 0.9919; Fig. 3C). The detection limit (S/N = 3) of AcSA was about 167 ng/ml (n = 5, R.S.D. 2.5%). After that, we attempted to determine AcSA in the pharmaceutical drug (Acylpyrin). The sample was prepared by the same way as in Section 2.3. An obtained extract was added to the supporting electrolyte (Britton-Robinson, pH 1.8) and analyzed by SWV GPE. We tested influence of different sample volumes on the SA peak height. The dependence obtained is shown in Fig. 3D. The signal increased up to 25 μl of an extract and then did not change much (Fig. 3D). The determined amount of AcSA in the pharmaceutical drug, which was plotted from the calibration curve, was in good agreement with the declared amounts (difference about 2 – 5 %).

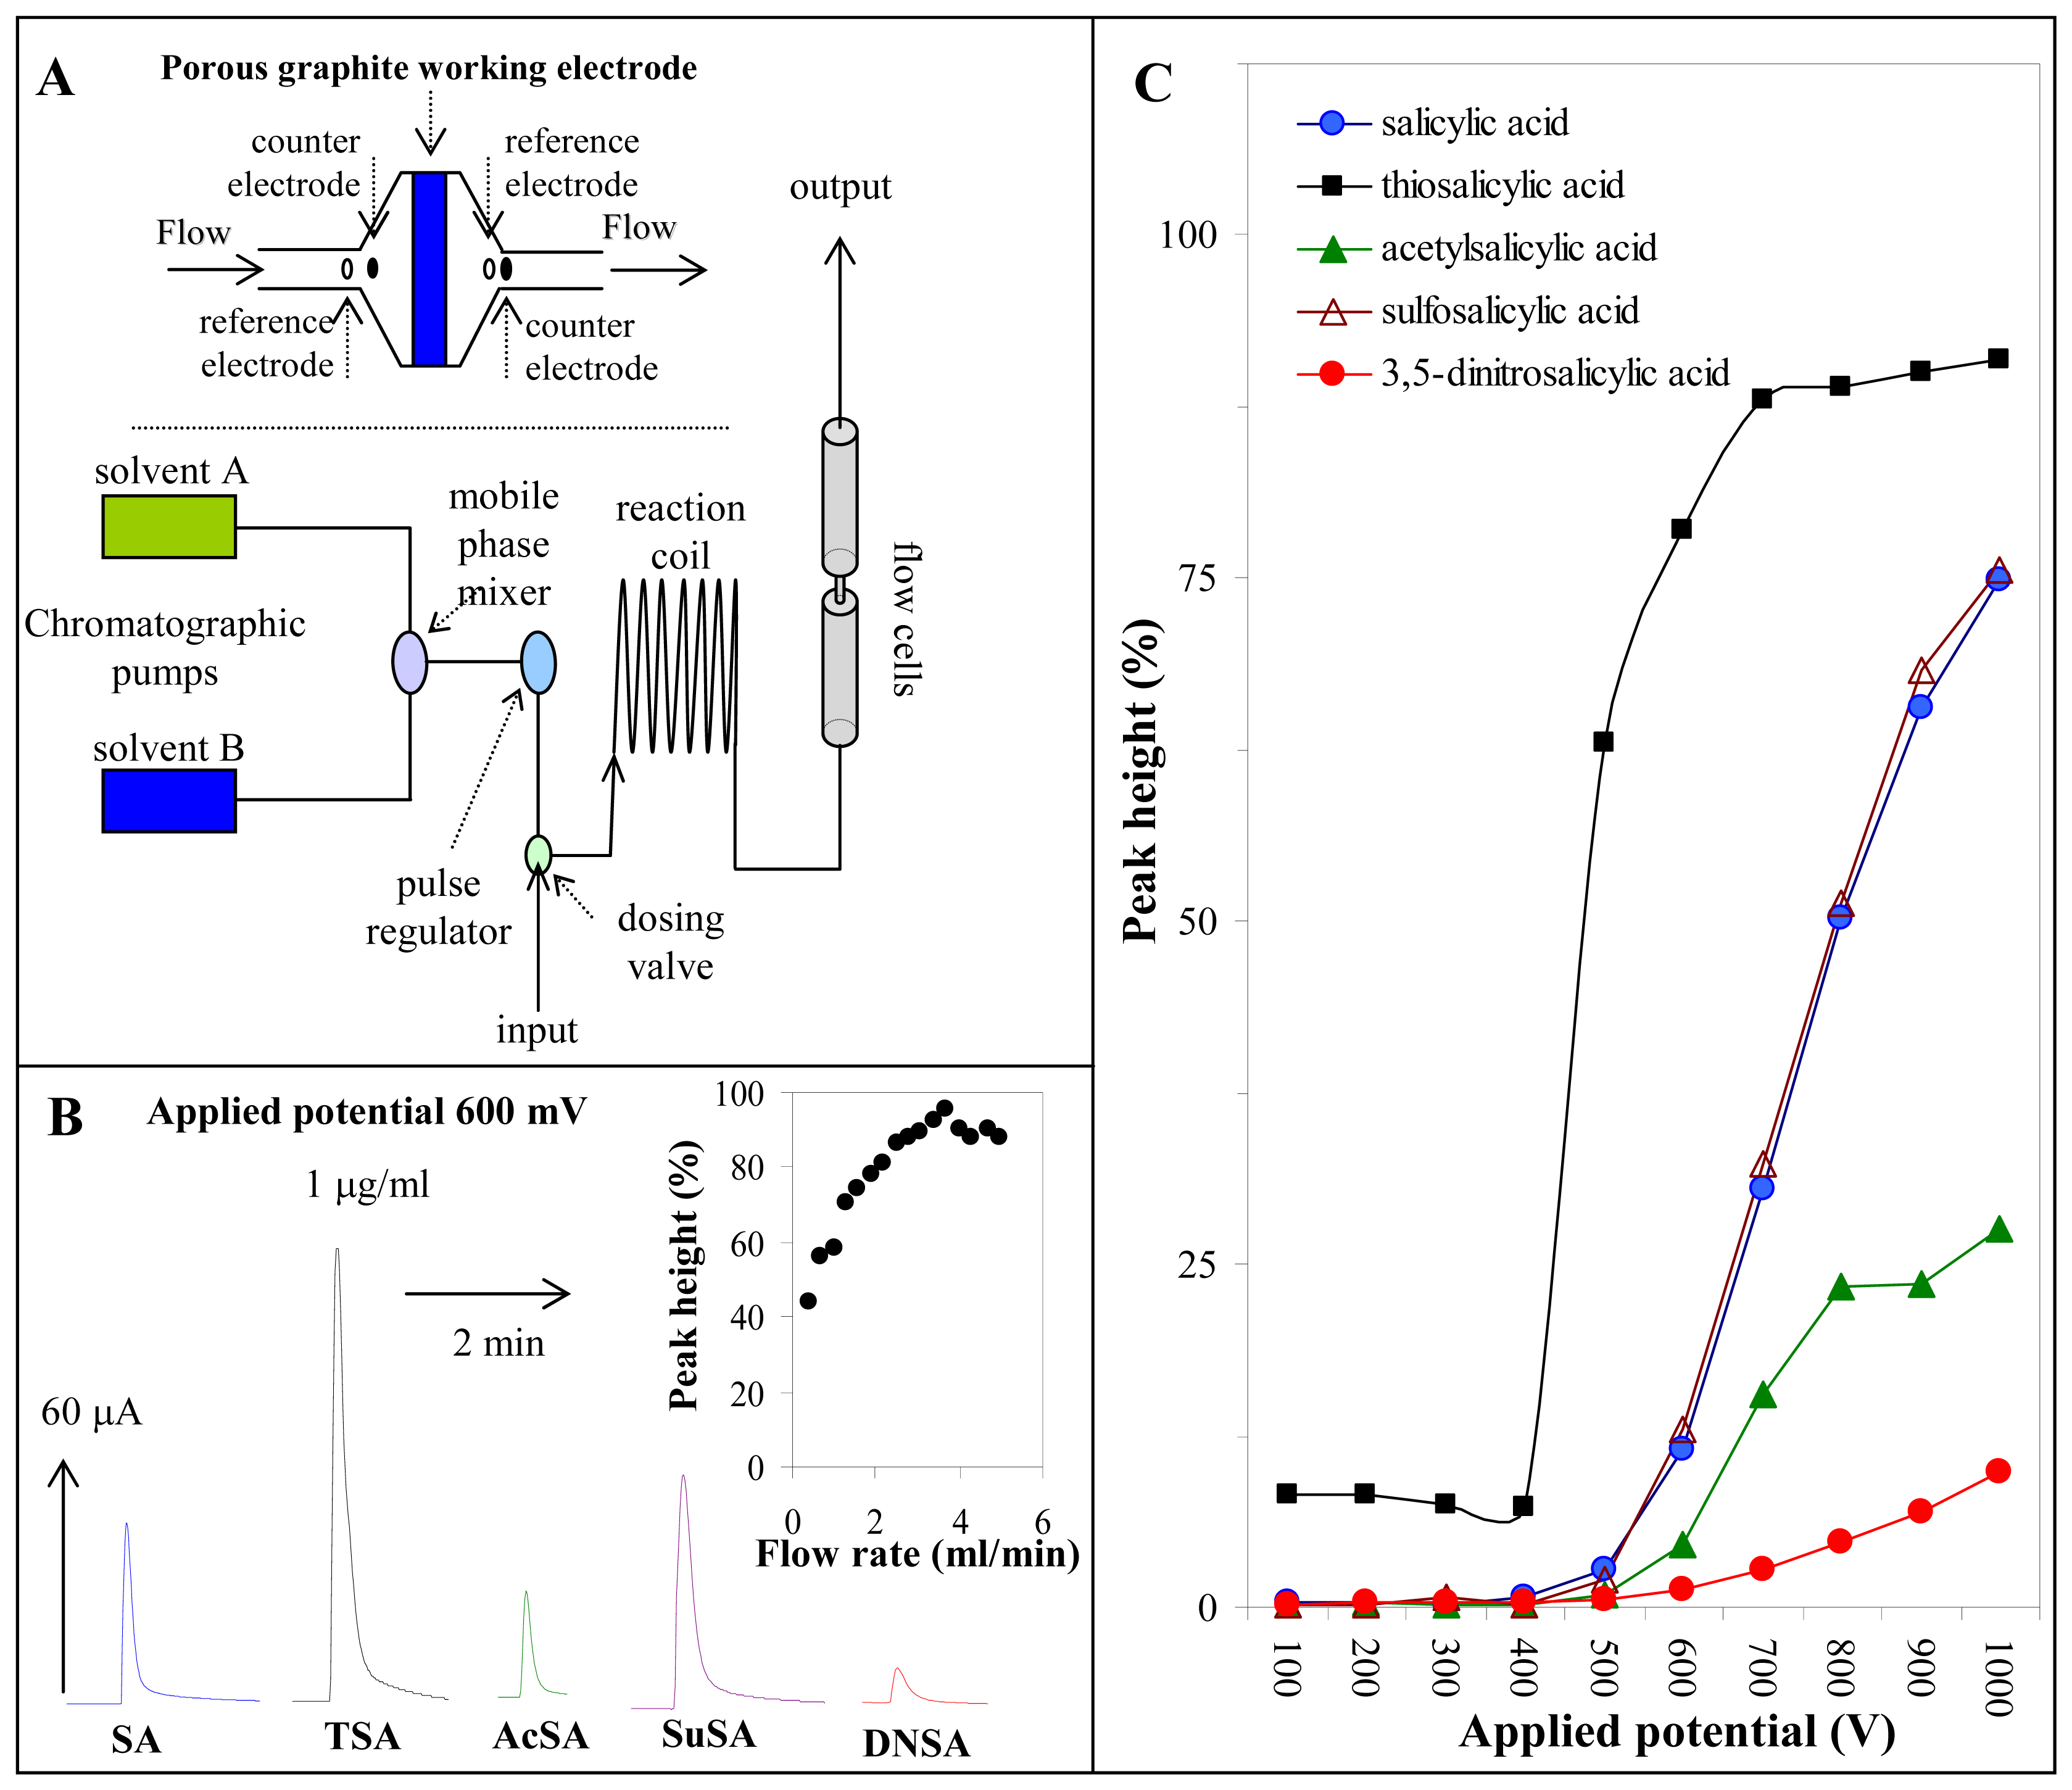
3.5. Determination of salicylates by flow injection analysis with electrochemical detection

As we mentioned above, the electrochemical determination of SA and/or AcSA is applicable to analysis of pharmaceutical drug and biological samples (willow tissues). Thus we decided to adopt the results obtained during determination of salicylates by flow injection analysis with electrochemical detection (FIA-ED; scheme of the instrument is shown on Fig. 4A). It was surprise for us that we were able to direct detect not only SA, which we expected, but also AcSA, which have to be hydrolyzed due to its analysis by steady state electrochemical instrument (Fig. 4B). Base of these results, we attempted to determine other salicylates, particularly, thiosalicylic acid – TSA, 3,5-dinitrosalicylic acid – DNSA and 5-sulfosalicylic acid – SuSA. The obtained FIA-ED records are shown in Fig. 4B. We found out that we are able to determine all of detected salicylates directly without any pre-treatment, hydrolysis and so on.
Consequently, we studied influence of flow rate (0.1 – 4 ml.min-1) of mobile phase consisted from Britton-Robinson buffer (pH 1.81) on sum of average peak heights of salicylates according to [61]. The obtained curve is shown in inset in Fig. 4B. The most suitable flow rate for determination of salicylates was 3.7 ml.min-1. In addition, optimal potential of working electrodes had to be found to achieve the most sensitive determination of the studied compounds. Thus we studied the dependence of salicylates current responses on potential in the range from 100 to 1000 mV. The resulting hydrodynamic voltammograms are shown in Fig. 4C. Height of current responses of the salicylates increased with increasing potential. Thus, we choose potential of 1000 mV as the most suitable to determine salicylates. We obtained strictly linear dependences of salicylates current responses on their concentration (Tab. 1). We were able to determine units of femtomoles per injection (5 μl).

4. Conclusion

The indirect determination of acetylsalicylic acid by square wave voltammetry on carbon electrodes is selective, sensitive and low-cost way how we could study this compound in different biological and environmental samples. Based on the results obtained we suggested flow electrochemical sensor to determine salicylates.

Acknowledgments

The authors wish to thanks to Dr. Frantisek Jelen for correction and peer reviewing of the manuscript. This work was supported by grants of the Grant Agency of the Czech Republic (No. 525/04/P132) and the Ministry of Education, Youth and Sports of Czech Republic (grant No. M06030), MSMT 6215712402 and IGA MZ 1A/8666-3.

References

  1. Pirker, R.; Huck, C.W.; Popp, M.; Bonn, G.K. Simultaneous determination of gentisic, salicyluric and salicylic acid in human plasma using solid-phase extraction, liquid chromatography and electrospray ionization mass spectrometry. J. Chrom. B 2004, 809, 257–264. [Google Scholar]
  2. Stone, E. An account of the success of the bark of the willow tree in the cure of agues. Philos. Trans. R. Soc. Lond. 1763, 53, 195–200. [Google Scholar]
  3. Dreser, H. Pharmakologisches über aspirin (acetylsalicylsäure). Pfluger&aposs Arch. 1899, 76, 306–319. [Google Scholar]
  4. Vaneke, J.R.; Flower, R.J.; Botting, R.M. History of aspirin and its mechanism of action. Stroke 1990, 21 Suppl. S, 12–23. [Google Scholar]
  5. Thun, M.J.; Henley, S.J.; Patrono, C. Nonsteroidal anti-inflammatory drugs as anticancer agents: Mechanistic, pharmacologic, and clinical issues. J. Natl. Cancer Inst. 2002, 94, 252–266. [Google Scholar]
  6. Weiss, H.J.; Aledort, L.M. Impaired platelet-connective-tissue reaction in man after aspirin ingestion. Lancet 1967, 2, 495–497. [Google Scholar]
  7. Awtry, E.H.; Loscalzo, J. Aspirin. Circulation 2000, 101, 1206–1218. [Google Scholar]
  8. Wong, S.; Appleberg, M.; Ward, C.M.; Lewis, D.R. Aspirin resistance in cardiovascular disease: A review. Eur. J. Vasc. Endovasc. 2004, 27, 456–465. [Google Scholar]
  9. Patrono, C. Aspirin as an antiplatelet drug. New Engl. J. Med. 1994, 330, 1287–1294. [Google Scholar]
  10. Fuster, V.; Dyken, M.L.; Vokonas, P.S.; Hennekens, C. Aspirin as a therapeutic agent in cardiovascula disease. Circulation 1993, 87, 659–675. [Google Scholar]
  11. Hennekens, C.H. Aspirin in the treatment and prevention of cardiovascular disease. Ann. Rev. Pub. Health 1997, 18, 37–49. [Google Scholar]
  12. Manson, J.E.; Stampfer, M.J.; Colditz, G.A.; Willet, W.C.; Rosner, B.; Speizer, F.E.; Hennekens, C.H. A prospective-study of aspirin use and primary prevention of cardiovascular-disease in women. JAMA - J. Am. Med. Assoc. 1991, 266, 521–527. [Google Scholar]
  13. Reilly, I.A.G.; Fitzgerald, G.A. Aspirin in cardiovascular-disease. Drugs 1988, 35, 154–176. [Google Scholar]
  14. Shen, S.C.; Ko, C.H.; Hsu, K.C.; Chen, Y.C. 3-OH flavone inhibition of epidermal growth factor-induced proliferation through blocking prostaglandin E-2 production. Int. J. Cancer 2004, 108, 502–510. [Google Scholar]
  15. Kelloff, G.J.; Schilsky, R.L.; Alberts, D.S.; Day, R.W.; Guyton, K.Z.; Pearce, H.L.; Peck, J.C.; Phillips, R.; Sigman, C.C. Colorectal adenomas: A prototype for the use of surrogate end points in the development of cancer prevention drugs. Clin. Cancer Res. 2004, 10, 3908–3918. [Google Scholar]
  16. Hardwick, J.C.H.; van Santen, M.; van den Brink, G.R.; van Deventer, S.J.H.; Peppelenbosch, M.P. DNA array analysis of the effects of aspirin on colon cancer cells: involvement of Rac1. Carcinogenesis 2004, 25, 1293–1298. [Google Scholar]
  17. Martnett, J. Aspirin and the potential role of prostaglandins in colon cancer. Cancer Res. 1992, 52, 5575–5589. [Google Scholar]
  18. Wang, W.H.; Wong, W.M.; Dailidiene, D.; Berg, D.E.; Gu, Q.; Lai, K.C.; Lam, S.K.; Wong, B.C.Y. Aspirin inhibits the growth of Helicobacter pylori and enhances its susceptibility to antimicrobial agents. Gut 2003, 52, 490–495. [Google Scholar]
  19. Kupferwasser, L.I.; Yeaman, M.R.; Nast, C.C.; Kupferwasser, D.; Xiong, Y.Q.; Palma, M.; Cheung, A.L.; Bayer, A.S. Salicylic acid attenuates virulence in endovascular infections by targeting global regulatory pathways in Staphylococcus aureus. J. Clin. Invest. 2003, 112, 222–233. [Google Scholar]
  20. Matias, F.A.A.; Vila, M.M.D.C.; Tubino, M. Quantitative reflectance spot test for the determination of acetylsalicylic acid in pharmaceutical preparations. J. Braz. Chem. Soc. 2004, 15, 327–330. [Google Scholar]
  21. Criado, A.; Cardenas, S.; Gallego, M.; Valcarcel, M. Continuous flow spectrophotometric determination of paracetamol in pharmaceuticals following continuous microwave assisted alkaline hydrolysis. Talanta 2000, 53, 417–423. [Google Scholar]
  22. Arancibia, J.A.; Olivieri, A.C.; Escandar, G.M. First- and second-order multivariate calibration applied to biological samples: determination of anti-inflammatories in serum and urine. Anal. Bioanal. Chem. 2002, 374, 451–459. [Google Scholar]
  23. Moreira, A.B.; Dias, I.L.T.; Neto, G.O.; Zagatto, E.A.G.; Kubota, L.T. Solid-phase fluorescence spectroscopy for the determination of acetylsalicylic acid in powdered pharmaceutical samples. Anal. Chim. Acta 2004, 523, 49–52. [Google Scholar]
  24. Quintino, M.S.M.; Angnes, L. Bia-amperometric quantification of salbutamol in pharmaceutical products. Talanta 2004, 62, 231–236. [Google Scholar]
  25. Rover, L.; Garcia, C.A.B.; Neto, C.D.; Kubota, L.T.; Galembeck, F. Acetylsalicylic acid determination in pharmaceutical samples by FIA-potentiometry using a salicylate-sensitive tubular electrode with an ethylene-vinyl acetate membrane. Anal. Chim. Acta 1998, 366, 103–109. [Google Scholar]
  26. Garrido, J.M.P.J.; Lima, J.L.F.C.; Matos, C.D. Flow injection determination of acetylsalicylic acid in pharmaceutical preparations with an amperometric detector. Collect. Czech. Chem. Commun. 2000, 65, 954–962. [Google Scholar]
  27. Quintino, M.D.M.; Corbo, D.; Bertotti, M.; Angnes, L. Amperometric determination of acetylsalicylic acid in drugs by batch injection analysis at a copper electrode in alkaline solutions. Talanta 2002, 58, 943–949. [Google Scholar]
  28. Catarino, R.I.L.; Conceicao, A.C.L.; Garcia, M.B.Q.; Goncalves, M.L.S.; Lima, J.L.F.C.; dos Santos, M.M.C. Flow amperometric determination of pharmaceuticals with on-line electrode surface renewal. J. Pharmaceut. Biomed. 2003, 33, 571–580. [Google Scholar]
  29. Satinsky, D.; Neto, I.; Solich, P.; Sklenarova, H.; Conceicao, M.; Montenegro, B.S.M.; Araujo, A.N. Sequential injection chromatographic determination of paracetamol, caffeine, and acetylsalicylic acid in pharmaceutical tablets. J. Sep. Sci. 2004, 27, 529–536. [Google Scholar]
  30. Stolker, A.A.M.; Niesing, W.; Hogendoorn, E.A.; Versteegh, J.F.M.; Fuchs, R.; Brinkman, U.A.T. Liquid chromatography with triple-quadrupole or quadrupole-time of flight mass spectrometry for screening and confirmation of residues of pharmaceuticals in water. Anal. Bioanal. Chem. 2004, 378, 955–963. [Google Scholar]
  31. Franeta, J.T.; Agbaba, D.; Eric, S.; Pavkov, S.; Aleksic, M.; Vladimirov, S. HPLC assay of acetylsalicylic acid, paracetamol, caffeine and phenobarbital in tablets. Farmaco 2002, 57, 709–713. [Google Scholar]
  32. Prasek, J.; Adamek, M.; Hubalek, J.; Adam, V.; Trnkova, L.; Kizek, R. New Hydrodynamic Electrochemical Arrangement for Heavy Metals Detection Using Thick-Film Chemical Sensor Electrodes. Sensors 2006, 11, 1498–1512. [Google Scholar]
  33. Babula, P.; Huska, D.; Hanustiak, P.; Baloun, J.; Krizkova, S.; Adam, V.; Hubalek, J.; Havel, L.; Zemlicka, M.; Horna, A.; Beklova, M.; Kizek, R. Flow Injection Analysis Coupled with Carbon Electrodes as the Tool for Investigation of Affecting and Content of Naphthoquinones in Biological Samples. Sensors 2006, 11, 1466–1482. [Google Scholar]
  34. Vidal, A.D.; Barrales, P.O.; Diaz, A.M. Simultaneous determination of paracetamol, caffeine and propyphenazone in pharmaceuticals by means of a single flow-through UV multiparameter sensor. Microchim. Acta 2003, 141, 157–163. [Google Scholar]
  35. Loh, H.C.; Ahmad, M.; Taib, M.N. A novel salicylic acid optical fibre probe fabrication. Sens. Actuator B-Chem. 2005, 107, 59–63. [Google Scholar]
  36. Vidal, A.D.; Reyes, J.F.G.; Barrales, P.O.; Diaz, A.M. UV spectrophotometric flow-through multiparameter sensor for the simultaneous determination of acetaminophen, acetylsalicylic acid, and caffeine. Anal. Lett. 2002, 35, 2433–2447. [Google Scholar]
  37. Ruiz-Medina, A.; Fernandez-de Cordova, M.L.; Ortega-Barrales, P.; Molina-Diaz, A. Flow-through UV spectrophotometric sensor for determination of (acetyl)salicylic acid in pharmaceutical preparations. Int. J. Pharm. 2001, 216, 95–104. [Google Scholar]
  38. Pasekova, H.; Sales, M.G.; Montenegro, M.C.; Araujo, A.N.; Polasek, M. Potentiometric determination of acetylsalicylic acid by sequential injection analysis (SIA) using a tubular salicylate-selective electrode. J. Pharm. Biomed. Anal. 2001, 24, 1027–1036. [Google Scholar]
  39. Kubota, L.T.; Fernandes, J.C.B.; Rover, L.; Neto, G.D. Determination of acetylsalicylic acid by FIA-potentiometric system in drugs after on-line hydrolysis. Talanta 1999, 50, 661–667. [Google Scholar]
  40. Ai, S.Y.; Wang, Q.J.; Li, H.; Jin, L.T. Study on production of free hydroxyl radical and its reaction with salicylic acid at lead dioxide electrode. J. Electroanal. Chem. 2005, 578, 223–229. [Google Scholar]
  41. Stradins, J.; Hasanli, B. Anodic Voltammetry of Phenol and Benzenethiol Derivatives.1. Influence of Ph on Electrooxidation Potentials of Substituted Phenols and Evaluation of Pk(a) from Anodic Voltammetry Data. J. Electroanal. Chem. 1993, 353, 57–69. [Google Scholar]
  42. Kizek, R.; Masarik, M.; Kramer, K.J.; Potesil, D.; Bailey, M.; Howard, J.A.; Klejdus, B.; Mikelova, R.; Adam, V.; Trnkova, L.; Jelen, F. An analysis of avidin, biotin and their interaction at attomole levels by voltammetric and chromatographic techniques. Anal. Bioanal. Chem. 2005, 381, 1167–1178. [Google Scholar]
  43. Masarik, M.; Kizek, R.; Kramer, K.J.; Billova, S.; Brazdova, M.; Vacek, J.; Bailey, M.; Jelen, F.; Howard, J.A. Application of avidin-biotin technology and adsorptive transfer stripping square-wave voltammetry for detection of DNA hybridization and avidin in transgenic avidin maize. Anal. Chem. 2003, 75, 2663–2669. [Google Scholar]
  44. Wang, J.; Kawde, A.N.; Sahlin, E. Renewable pencil electrodes for highly sensitive stripping potentiometric measurements of DNA and RNA. Analyst 2000, 125, 5–7. [Google Scholar]
  45. Ly, S.Y.; Jung, Y.S.; Kim, M.H.; Han, I.K.; Jung, W.W.; Kim, H.S. Determination of caffeine using a simple graphite pencil electrode with square-wave anodic stripping voltammetry. Microchim. Acta 2004, 146, 207–213. [Google Scholar]
  46. Bond, A.M.; Mahon, P.J.; Schiewe, J.; VicenteBeckett, V. An inexpensive and renewable pencil electrode for use in field-based stripping voltammetry. Anal. Chim. Acta 1997, 345, 67–74. [Google Scholar]
  47. Perdicakis, M.; Aubriet, H.; Walcarius, A. Use of a commercially available wood-free resin pencil as convenient electrode for the ‘voltammetry of microparticles’ technique. Electroanalysis 2004, 16, 2042–2050. [Google Scholar]
  48. Ozsoz, M.; Erdem, A.; Kara, P.; Kerman, K.; Ozkan, D. Electrochemical biosensor for the detection of interaction between arsenic trioxide and DNA based on guanine signal. Electroanalysis 2003, 15, 613–619. [Google Scholar]
  49. Fojta, M.; Havran, L.; Billova, S.; Kostecka, P.; Masarik, M.; Kizek, R. Two-surface strategy in electrochemical DNA hybridization assays: Detection of osmium-labeled target DNA at carbon electrodes. Electroanalysis 2003, 15, 431–440. [Google Scholar]
  50. Bromba, M.U.A.; Ziegler, H. Application hints for Savitzky-Golay digital smoothing filtres. Anal.Chem. 1981, 53, 1583–1586. [Google Scholar]
  51. Kizek, R.; Vacek, J.; Trnkova, L.; Klejdus, B.; Havel, L. Application of catalytic reactions on a mercury electrode for electrochemical detection of metallothioneins. Chem. Listy 2004, 98, 166–173. [Google Scholar]
  52. Petrlova, J.; Potesil, D.; Mikelova, R.; Blastik, O.; Adam, V.; Trnkova, L.; Jelen, F.; Prusa, R.; Kukacka, J.; Kizek, R. Attomole voltammetric determination of metallothionein. Electrochim. Acta 2006, 51, 5112–5119. [Google Scholar]
  53. Petrek, J.; Havel, L.; Petrlova, J.; Adam, V.; Potesil, D.; Babula, P.; Kizek, R. Analysis of salicylic acid in willow barks and branches by an electrochemical method. Russ. J. Plant. Physiol. 2006, in press. [Google Scholar]
  54. Torriero, A.A.J.; Luco, J.M.; Sereno, L.; Raba, J. Voltammetric determination of salicylic acid in pharmaceuticals formulations of acetylsalicylic acid. Talanta 2004, 62, 247–254. [Google Scholar]
  55. Vacek, J.; Andrysik, Z.; Trnkova, L.; Kizek, R. Determination of azidothymidine - an antiproliferative and virostatic drug by square-wave voltammetry. Electroanalysis 2004, 16, 224–230. [Google Scholar]
  56. Gattrell, M.; Kirk, D.W. A study of the oxidation of phenol at platinum and preoxidized platinum surfaces. J. Electrochem. Soc. 1993, 140, 1534–1540. [Google Scholar]
  57. Gattrell, M.; Kirk, D.W. A study od electrode passivation during aqueous phenol electrolysis. J. Electrochem. Soc. 1993, 140, 903–911. [Google Scholar]
  58. Lopez-Cueto, G.; Ostra, M.; Ubide, C. The acetylsalicylic acid-bromine system for multicomponent kinetic determinations. Anal. Bioanal. Chem. 2002, 374, 915–922. [Google Scholar]
  59. Connors, K.A.; Amidon, G.L.; Kennon, L. Chemical stability of pharmaceuticals; Wiley, 1979. [Google Scholar]
  60. Achuo, E.A.; Audenaert, K.; Meziane, H.; Hofte, M. The salicylic acid-dependent defence pathway is effective against different pathogens in tomato and tobacco. Plant Pathol. 2004, 53, 65–72. [Google Scholar]
  61. Potesil, D.; Zelena, J.; Petrlova, J.; Adam, V.; Vacek, J.; Klejdus, B.; Zehnalek, J.; Trnkova, L.; Havel, L.; Kizek, R. Simultaneous femtomole determination of cysteine, reduced and oxidized glutathione, and phytochelatin in maize (Zea mays L.) kernels using highe-performance liquid chromatography with electrochemical detection. J. Chromatogr. A 2005, 1084, 134–144. [Google Scholar]
Figure 1. (A) Structure of salicylic acid (SA), acetylsalicylic acid (AcSA), thiosalicylic acid (TSA), 3,5-dinitrosalicylic acid (DNSA) and 5-sulfosalicylic acid (SuSA). (B) A scheme of electrochemical cell. (C) The possible scheme of oxidation of SA; for other details see in Ref. [40,41].
Sensors 06 01483f1
Figure 2. (A) Square wave voltammogram of SA (100 μg/ml) measured on the surface of carbon paste electrode in the presence of Britton-Robinson buffer (pH 2.3). (B) Influence of different SWV parameters on SA signal (a) frequency; (b) amplitude; (c) step potential step. (Ca) Changes of SA peak height and potential with increasing pH of Briton-Robinson buffer (pH from 1.8 to 11.98); (Cb) influence of Britton-Robinson, HCl-NaCl and Citrate buffers (pH from 1 to 3) on SA peak height. (D) Dependence of SA peak height and potential on its concentration (1.5 – 150 μg/ml); in inset (1.5 – 80 μg/ml). SWV parameters were as follows: supporting electrolyte Britton-Robinson buffer (pH 2.3 – Figs. A and B, pH 1.81 – Fig. D), concentration of SA 100 μg/ml except D; frequency 200 Hz and amplitude 25 mV and potential step 5 mV (except B and D, where we used frequency 260 Hz, amplitude 50 mV, potential step 10 mV), initial potential +0.7 V, end potential +1.5 V. The peak height of 100% corresponds to 18 μA.
Sensors 06 01483f2
Figure 3. Hydrolysis of acetylsalicylic acid by heat and pH treatment. (A) SWV voltammograms of SA measured on CPE after 60 min of hydrolysis in the presence of Britton-Robinson buffer pH 11.98 (a) 90 °C; (b) 80 °C; (c) 50 °C; (d) 25 °C. (B) Dependence of changes in SA peak height on temperature, time of hydrolysis and pH of Britton-Robinson buffer. Indirect determination of acetylsalicylic acid by SWV GPE. (C) Dependence of changes in SA peak height on concentration of hydrolyzed AcSA (35 – 920 μg/ml). Pharmaceutical drug. (D) Dependence of SA peak height on volume of the hydrolyzed sample. SWV parameters were as follows: supporting electrolyte Britton-Robinson buffer (pH 1.8); frequency 260 Hz, amplitude 50 mV, potential step 10 mV, initial potential +0.7 V, end potential +1.5 V.
Sensors 06 01483f3
Figure 4. Flow injection analysis. (A) Scheme of flow injection system with electrochemical detection; in inset – detailed scheme of electrochemical cell. (B) FIA-ED records of the salicylates (1 μg/ml); in inset – dependence of flow rate on sum of average peak heights of salicylates. (C) Influence of current responses of salicylates on potential (100, 200, 300, 400, 500, 600, 700, 800, 900 and 1000 mV) – hydrodynamic voltammogram. FIA-ED parameters – reaction coil (1 m); flow rate of 3.7 ml.min-1 (except inset in C); potential of 600 mV (except D), mobile phase: Britton-Robinson buffer (pH 1.8); column and detector temperature: 30 °C; salicylates concentration: 1 μg.ml-1; 5 μl samples was injected.
Sensors 06 01483f4
Table 1. Regression characteristics and limits of detections of all studied salicylates (n = 5).
A compound of interestRegression equationaR2bLOD (nM)cLOD (fmol)
SAy = 17.811x – 1.90080.99800.1950.977
AcSAy = 3.5721x + 0.35210.99870.5272.63
TSAy = 7.0741x – 1.79020.99640.5292.64
SuSAy = 4.0618x + 0.83220.99850.4272.13
DNSAy = 0.0382x – 0.0580.998850.6253
a… regression coefficient
b… limit of detection (3 S/N)
c… limit of detection (3 S/N) per injection (5 μl)

