Introduction
Quartz crystal nanobalance (QCN) sensors are considered as powerful mass-sensitive sensors to determine materials in the sub-nanogram level. Polymers which play a key role in a variety of fields, including chemical sensors [
1], membrane-separation technology [
2] and solid-phase extraction techniques [
3] have gained wide theoretical and practical applications in the area of sensors as well. In the last few years, there has been an increasing amount of attention paid to the application of polymer-coated quartz crystal nanobalance (QCN) sensors [
4-
6]. The QCN comprises a thin vibrating AT-cut quartz wafer sandwiched between two metal excitation electrodes. When a small amount of mass is adsorbed at the quartz electrode surface, the frequency of the quartz is changed. Sauerbrey's equation is used to relate the frequency change (Δ
f) to the mass loading (Δ
m):
where
F0 is the fundamental resonant frequency of the unloaded quartz crystal (10 MHz),
A is the electrode area (0.21 cm
2), ρ
q is the density of quartz (2.65 g cm
-3) and μ
q is the shear modulus of quartz (2.95*10
11 dyn cm
-2). With these constants, we obtain:
When the surface of a quartz crystal electrode is coated by a polymer capable of interaction with the environment of interest, a sensor sensitive to this component can be constructed. The performance characteristics of the QCN sensor (such as selectivity, response time and reversibility) will depend on the chemical nature and physical properties of the polymeric coating.
Polymer coated quartz crystals have been studied as sensors for various gases [
7-
9]. For the development of a chemical sensor, selective, sensitive and stable sensing materials have to be found. Unfortunately, the construction of an entirely selective chemical sensor is almost unrealizable, since along with the analyte, other compounds usually interfere. As a matter of fact, the major drawback of the polymer-modified QCN sensors is a lack of selectivity, since there is no discrimination between the sources of the mass changes. Using pattern recognition techniques is the key of the data processing of the signals of a non-selective sensor. In this regard, the characteristic information contents of the signal have to be recorded. Different chemometric tools could be applied for this purpose. Fuzzy clustering [
10], partial least squares (PLS) [
11,
12], Principal Component Analysis (PCA) [
13,
14] and Artificial Neural Network (ANN) [
14,
15] have been widely used for the classification of analytes. In recent years, considerable interest has risen on the use of quartz crystals as sensors in conjunction with associated pattern recognition techniques in distinguishing various kinds of compounds.
Polystyrene is a low priced and widely available material. Besides, polystyrene is a hard and glassy polymer hence, it neither generates a significant damping nor does it show significant viscoelastic contributions to the frequency shift of the quartz even at higher coating thickness. We developed a method of a thin polystyrene-coated QCN sensor for the determination of benzene, toluene, ethylbenzene and xylene (BTEX compounds).
Experimental
Reagents and materials
Benzene, toluene, ethylbenzene and xylene (BTEX) were all purchased from Merck (Germany) and used without any further purification. Polystyrene was supplied by Tabriz Petrochemical Co.
Instrumentation
Ten megahertz AT-cut quartz crystals with gold electrodes on both sides were purchased from International Crystal Manufacturer (ICM, Oklahoma, USA). A home-made QCN apparatus was used for frequency measurements as shown in
Figure 1. The oscillator circuit used was based on that designed based on Bruckenstein and Shay system which was modified by A. Mirmohseni and G.G. Wallace [
16-
18]. However, some modification of the original design was also carried out to improve the mass sensitivity and stability.
Procedures
All measurements were carried out in a glass cell with an internal volume of 38 ml. Hamilton microliter syringes (Hamilton Bonaduz AG Switzerland) were used for analyte injection and dispensing polymer solution cast on the gold electrode of the quartz crystal. A certain volume of analyte was injected into the cell and the frequency shift of crystal was recorded. The concentration of injected analyte in the cell was calculated in mg l
−1 using its density, purity percent and volume [
19]. The difference between the highest and the lowest value was used to plot calibration curve for each analyte. A flow of air was purged through the cell to desorb analyte and recover the electrode. All measurements were carried out at room temperature (25 °C).
Polymer coating
A solution casting method was used to cast the polymer film on the top of the quartz crystal electrode. The gold coated quartz electrode was coated using a 3 μl solution of polystyrene in chloroform (various concentrations). The film thickness varied corresponding to the polymer solution concentration. In order to regenerate the electrode, the polymeric coating was dissolved in chloroform and dried by acetone.
Data processing
The principal component analysis (PCA) method is widely used to classify compounds and mixtures. PCA contains an orthogonalization procedure such as singular-value decomposition (SVD) that decomposes the primary data matrix by projecting the multi-dimensional dataset onto new coordinates base formed by the orthogonal directions with data maximum variance. The data matrix consists of a number of experiments, each consisting of a number of variables. The eigenvectors of the data matrix are called principal components and they are uncorrelated among them. Sensor signals can be expressed as the linear combination of eigenvectors. Generally, the k-th principal component, PC
k, is a linear combination of the n response vectors X
n,j for the analyte under study, where n is the number of the variables, j indicates different samples and the coefficients (a
n,k) are called loading (
Eq. 3).
The magnitude of each eigenvector is expressed by its own eigenvalue, which gives a measure of the variance related to that principal component. The variance is related to the quantity of information which is supplied by the component. By elimination of the less important eigenvectors, it is possible to achieve fewer vectors without any considerable information loss. So, during data processing, the results are transformed in a plane or in a space of the first two or three eigenvectors. The coordinates of the data in the new base are called their score. The scores plot is usually used for the classification of the data clusters. In this study, the input data of the primary matrix are the normalized and standardized response of the QCN sensor at various time windows.
PCA calculations used a singular-value decomposition algorithm and were performed with the MATLAB software version 6.5. The operating system was Microsoft Windows XP.
Results and discussion
Sensors have to fulfill many requirements such as selectivity, sensitivity and reversibility in the working range. For this mean, construction of a QCN sensor having a good character to analysis BTEX compounds was investigated.
Development and amount of coating material
First, the optimum amount of polystyrene that have to be coated on the QCN surface was investigated. The coating thickness depends on the polymer concentration. The thickness of coating was estimated by the difference between the frequencies of the bare crystal, and the coated crystal after solvent evaporation.
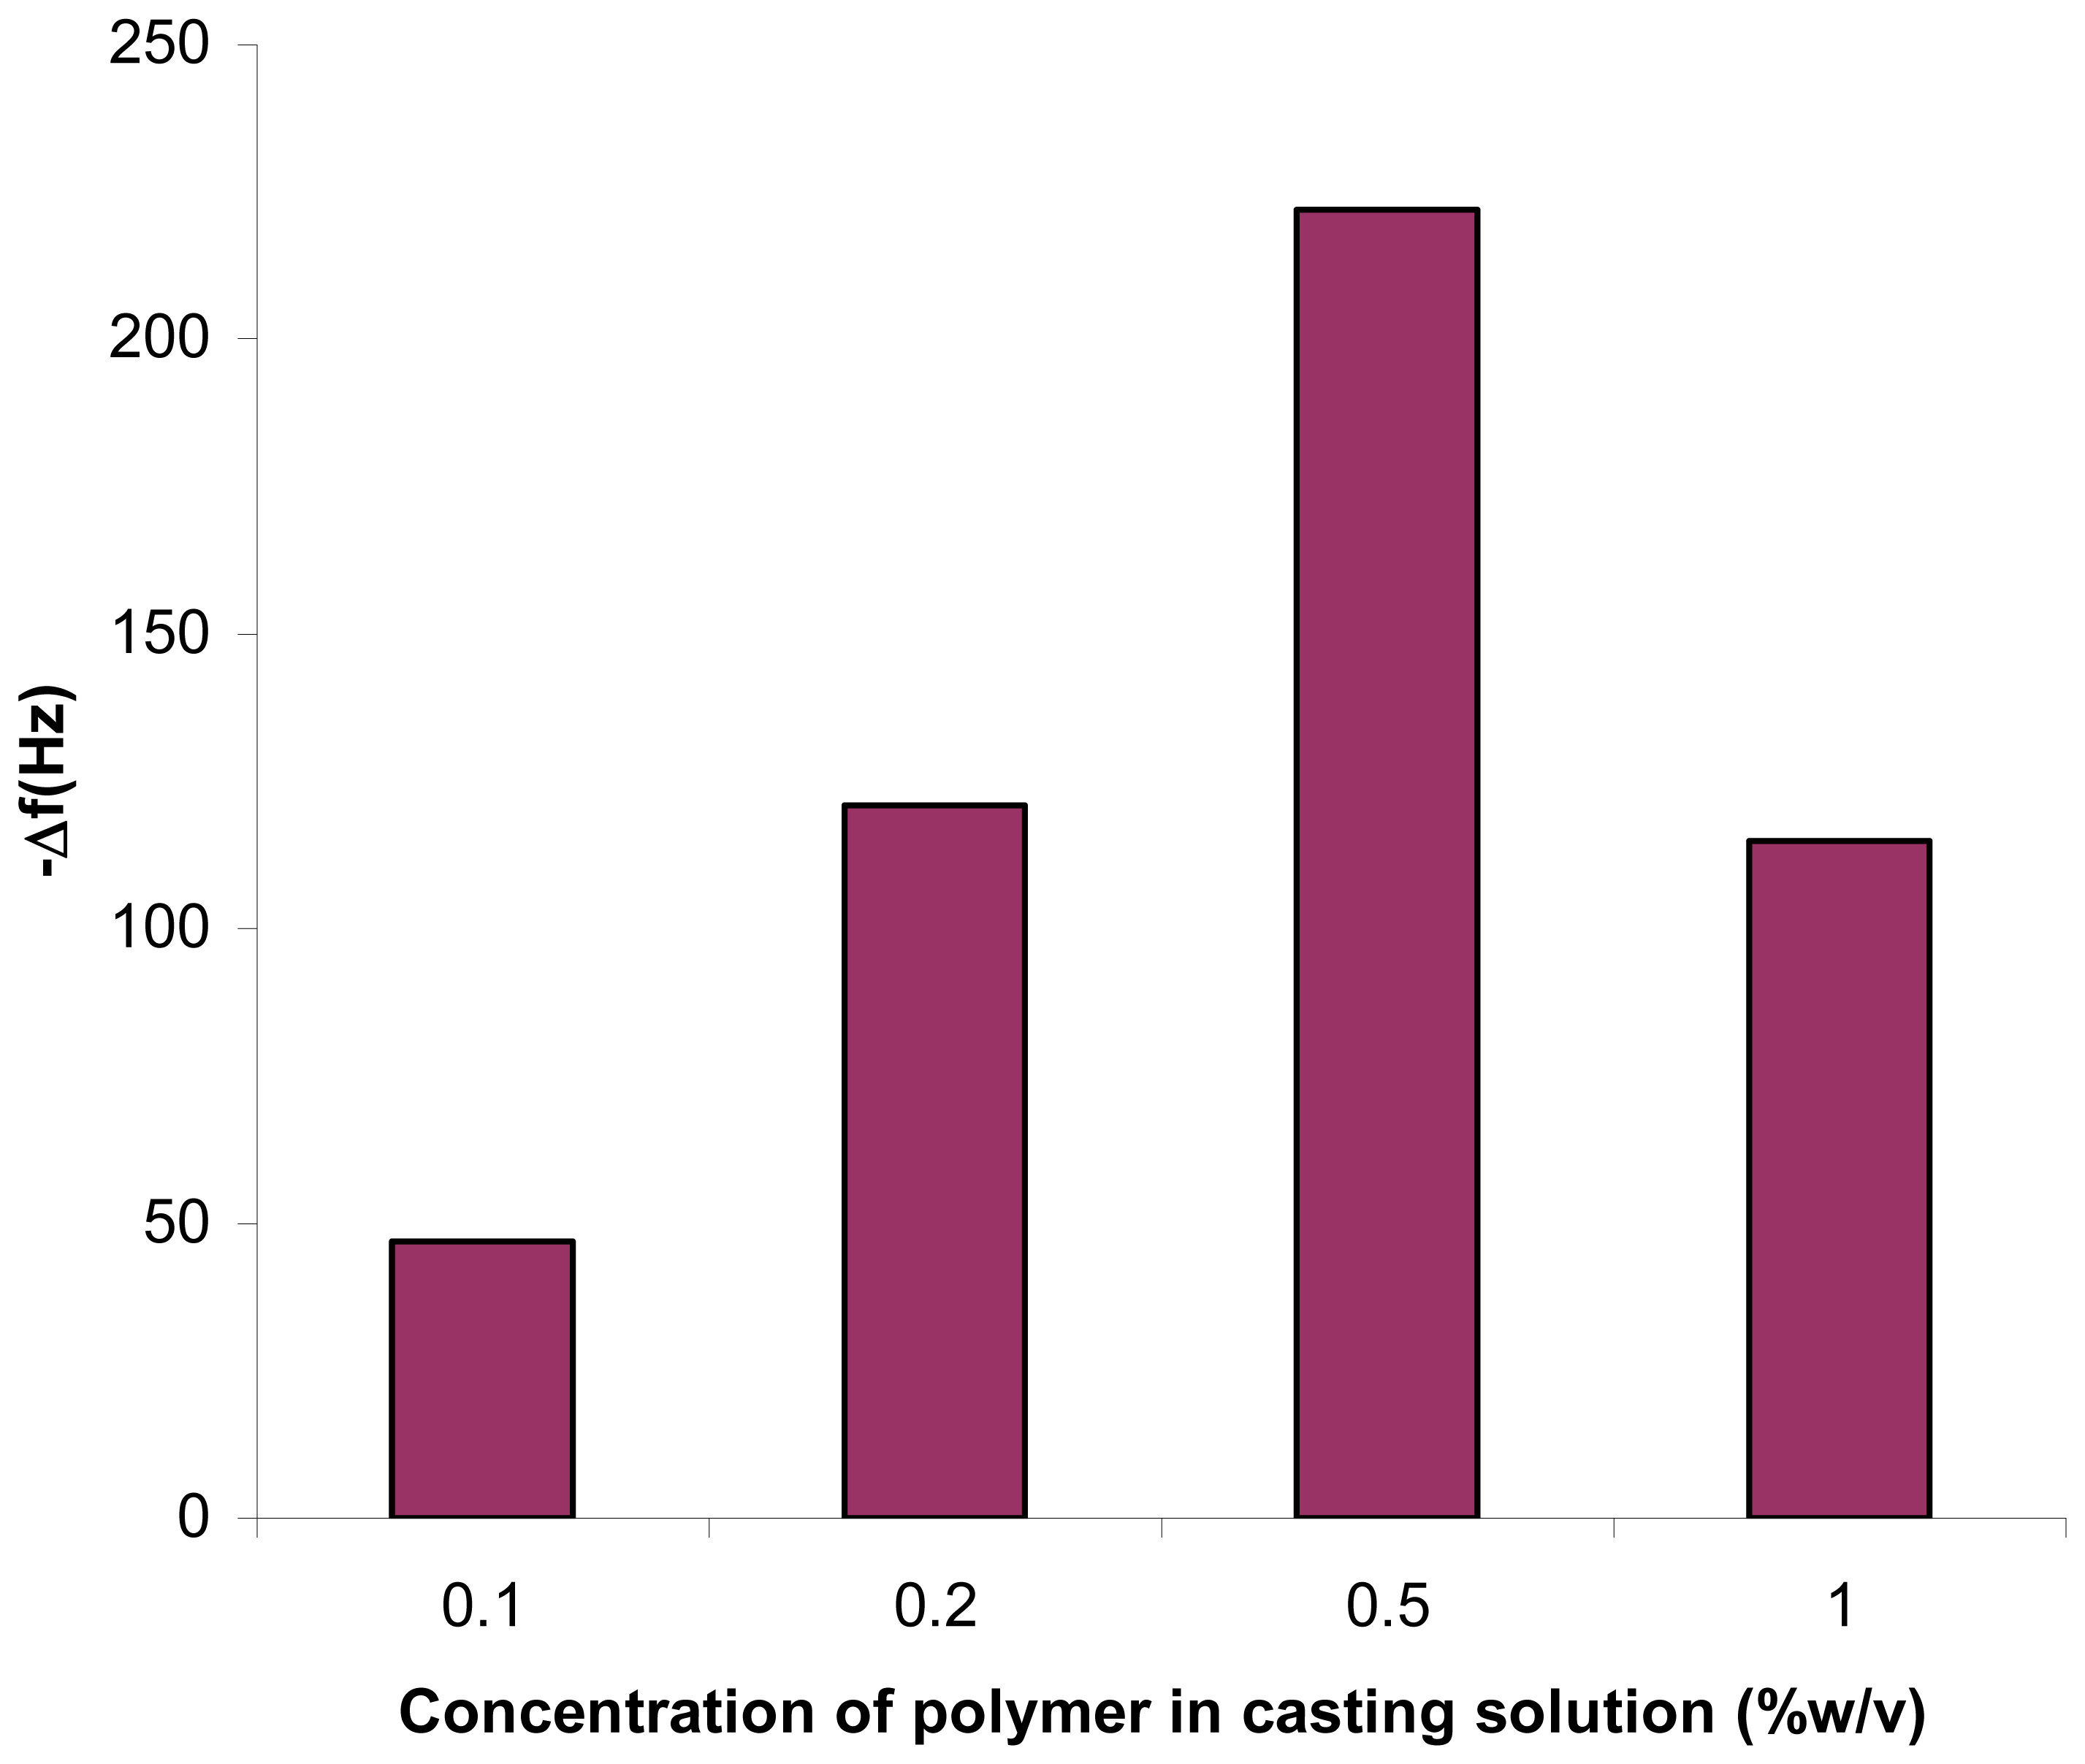
The QCN was coated with 3 μl of diverse concentration of polystyrene solutions. The QCN-coated with different amounts of polystyrene were exposed to 15 mg L
-1 toluene.
Figure 2 shows the responses of the QCN coated with different amounts of polystyrene. The QCN crystal with a thicker polystyrene coating exhibited a larger frequency response for the same concentration of toluene (15 mg l
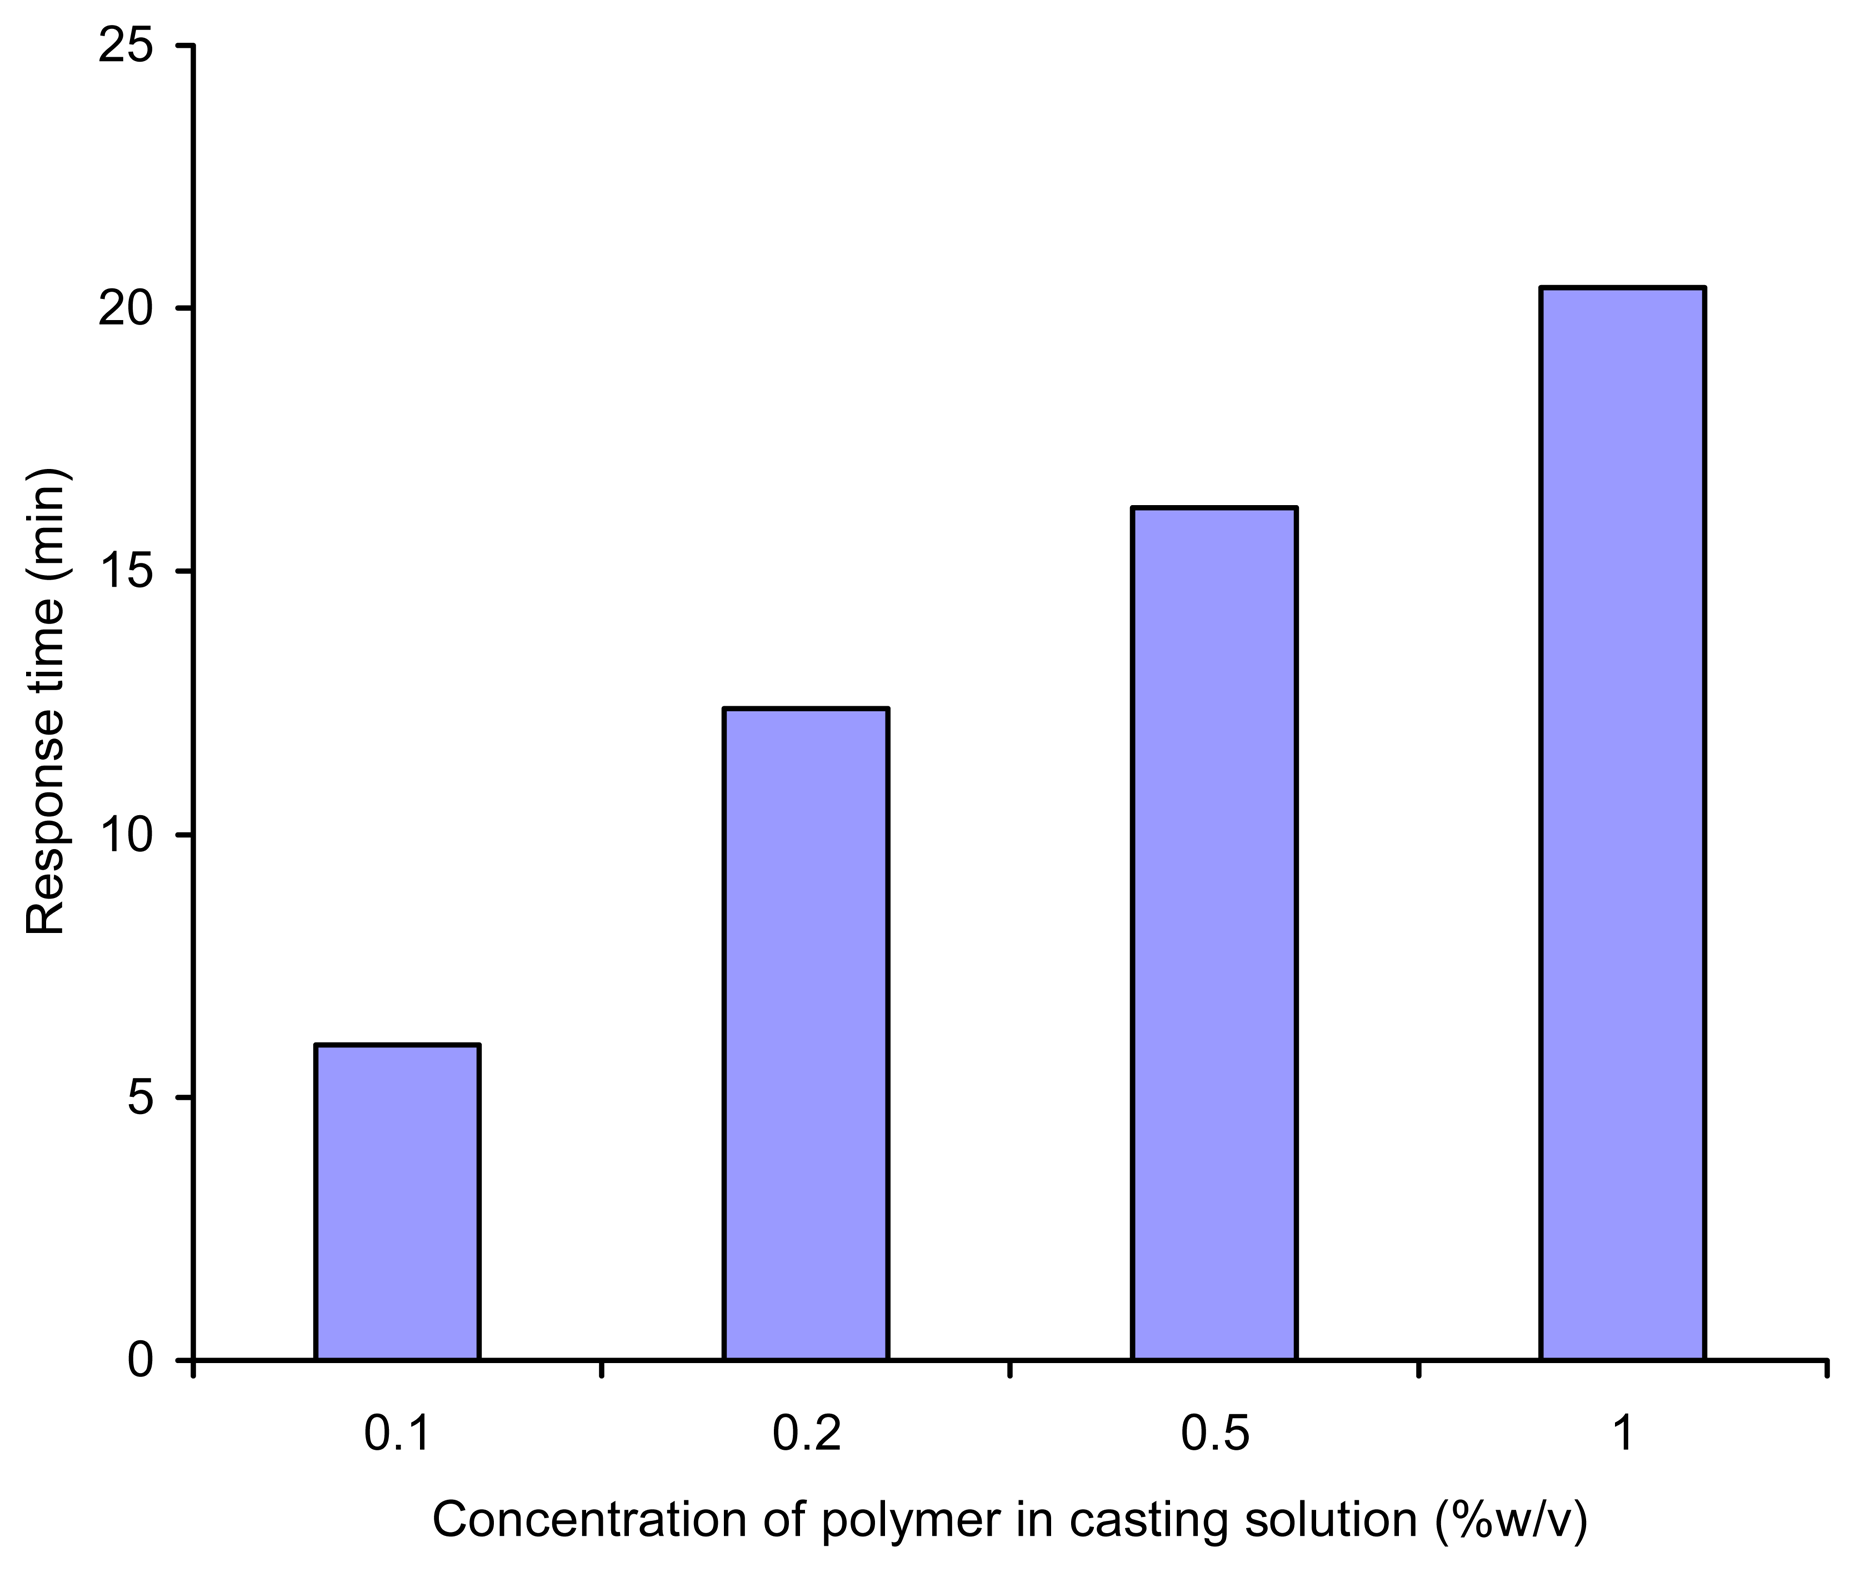
-1) below 0.5%w/v, but above 0.5%w/v the response tended to level off. This behavior implies that there is a limit of the adsorption of gas molecules in a small area of adsorbent. On the other hand, the response time obtained for the crystal having different thickness of polystyrene showed that the QCN crystal with a thicker coating exhibit a high response time for the same concentration of toluene (
Figure 3). Besides, too much coating would disturb the resonance stability and occasionally leads to a failure in the quartz crystal oscillation. Based on these results, we decided that the QCN in all subsequent experiments should be modified using 3 μl of 0.5%w/v polystyrene solution (with approximately 104 nm thickness). So, it had a significant response and its response time was less than 16 min.
Sensor response
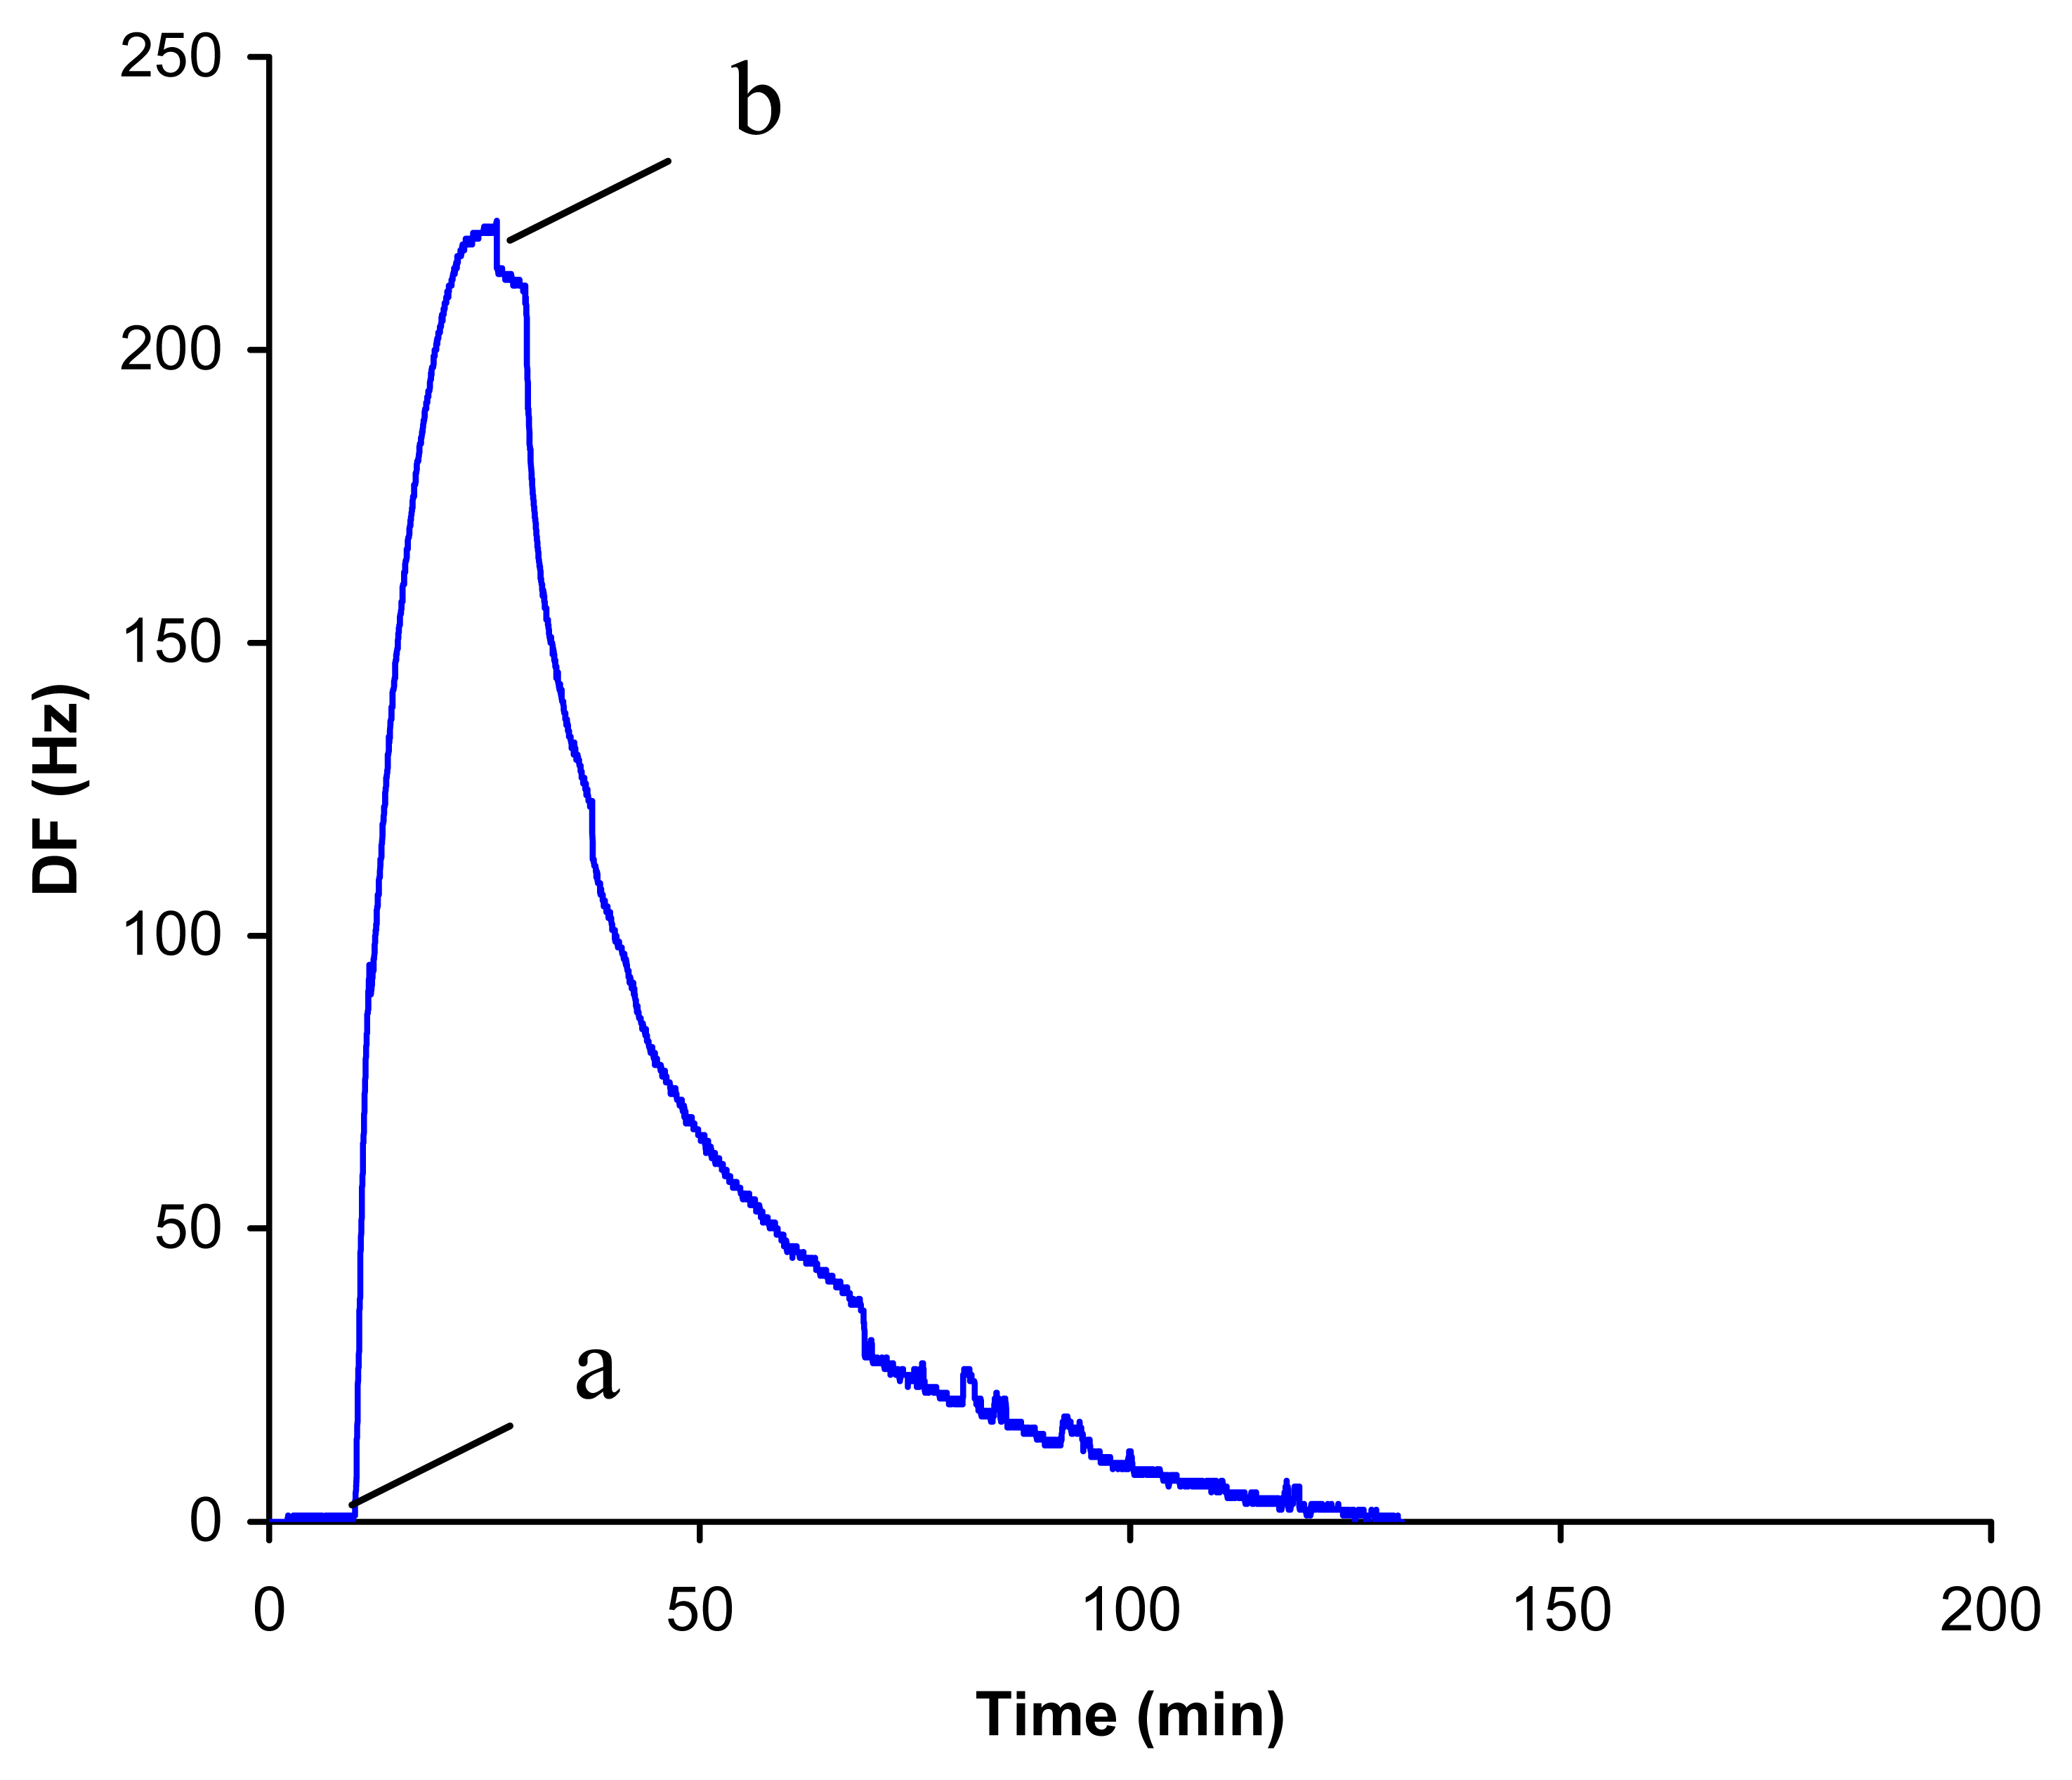
Typical QCN sensor responses over the measuring time for toluene, with a concentration of 15 mg l
-1, are illustrated in
Figure 4. The negative frequency shifts arise from the analyte exposure. A plateau is reached after a period of time, indicating a maximum adsorption onto the QCN surface.
After turning back to the purge cycle, the frequency goes back to a value approximating the basic line.
k is considered as a value for reversibility of the sensor response [
19],
where
t90 is the Δ
f-value at 90% after starting the adsorption or desorption process. For an ideal fast reversible response,
k must be 1.
Table 1 shows the reversibility of the polystyrene-coated QCN sensor at two different concentrations of analytes. It can be concluded that the polystyrene shows a good reversibility with all analytes. This implies that the polystyrene-coated QCN crystal sensor can be repeatedly reused for the detection of examined organic vapors.
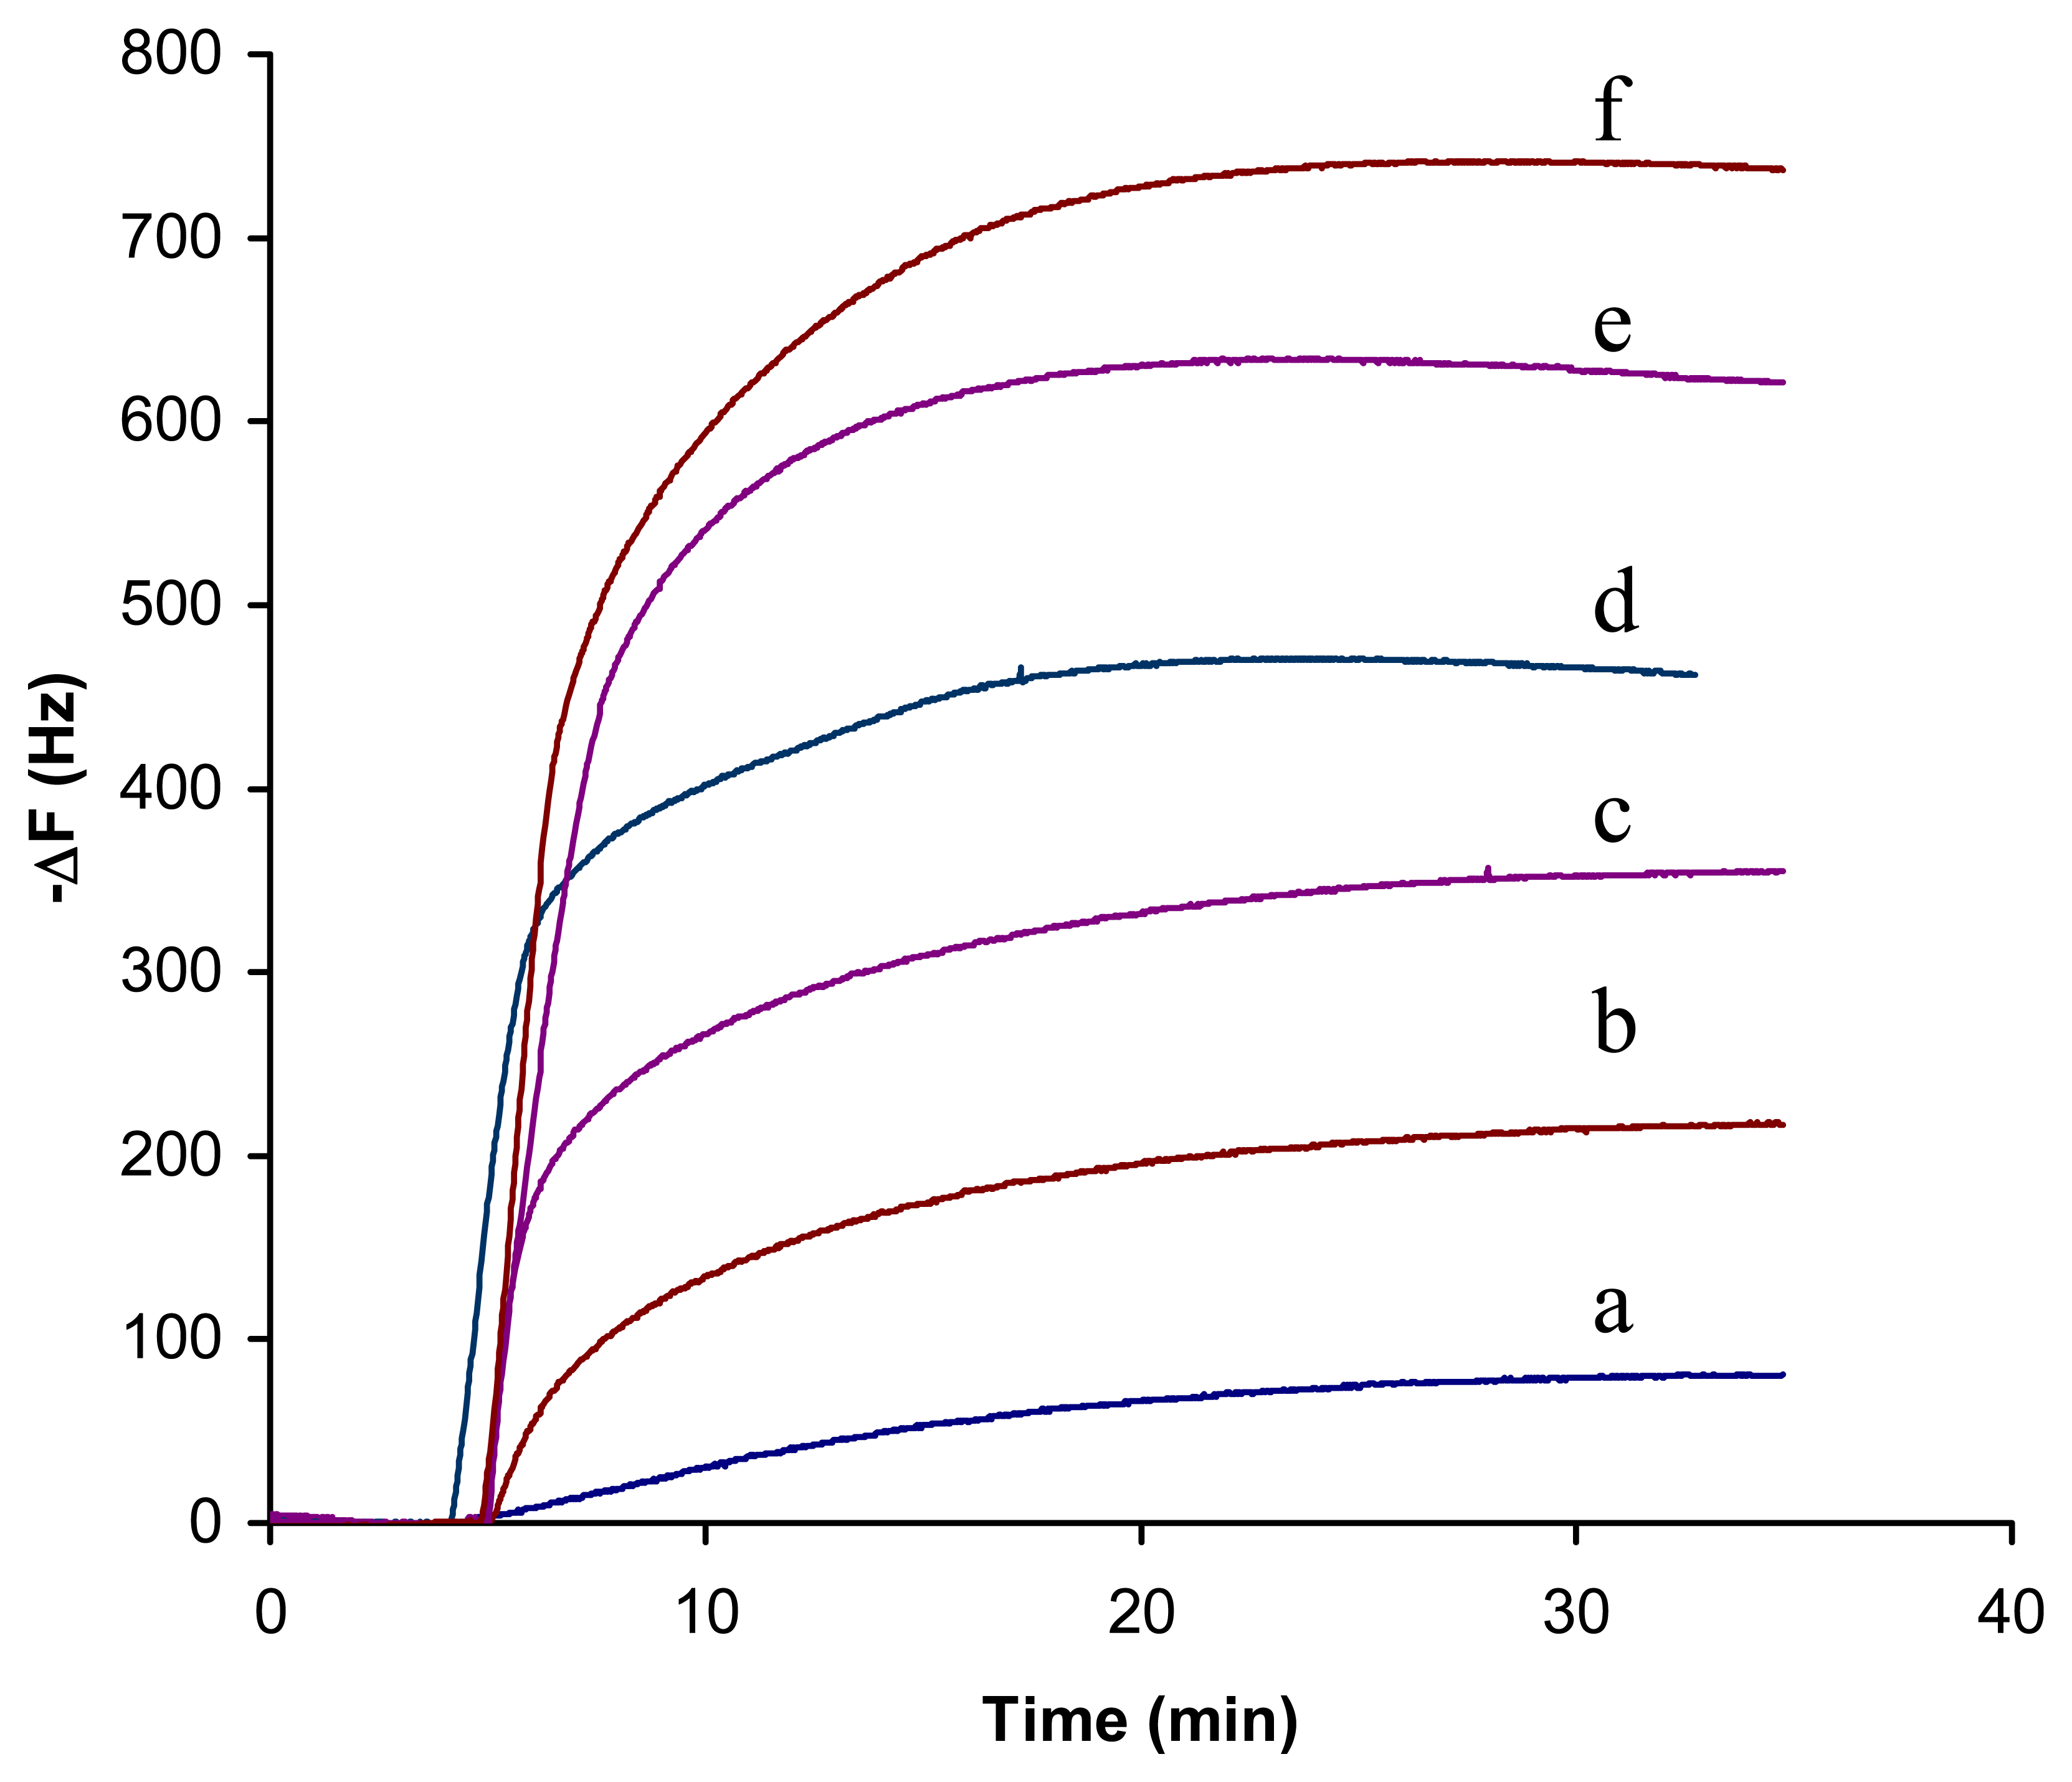
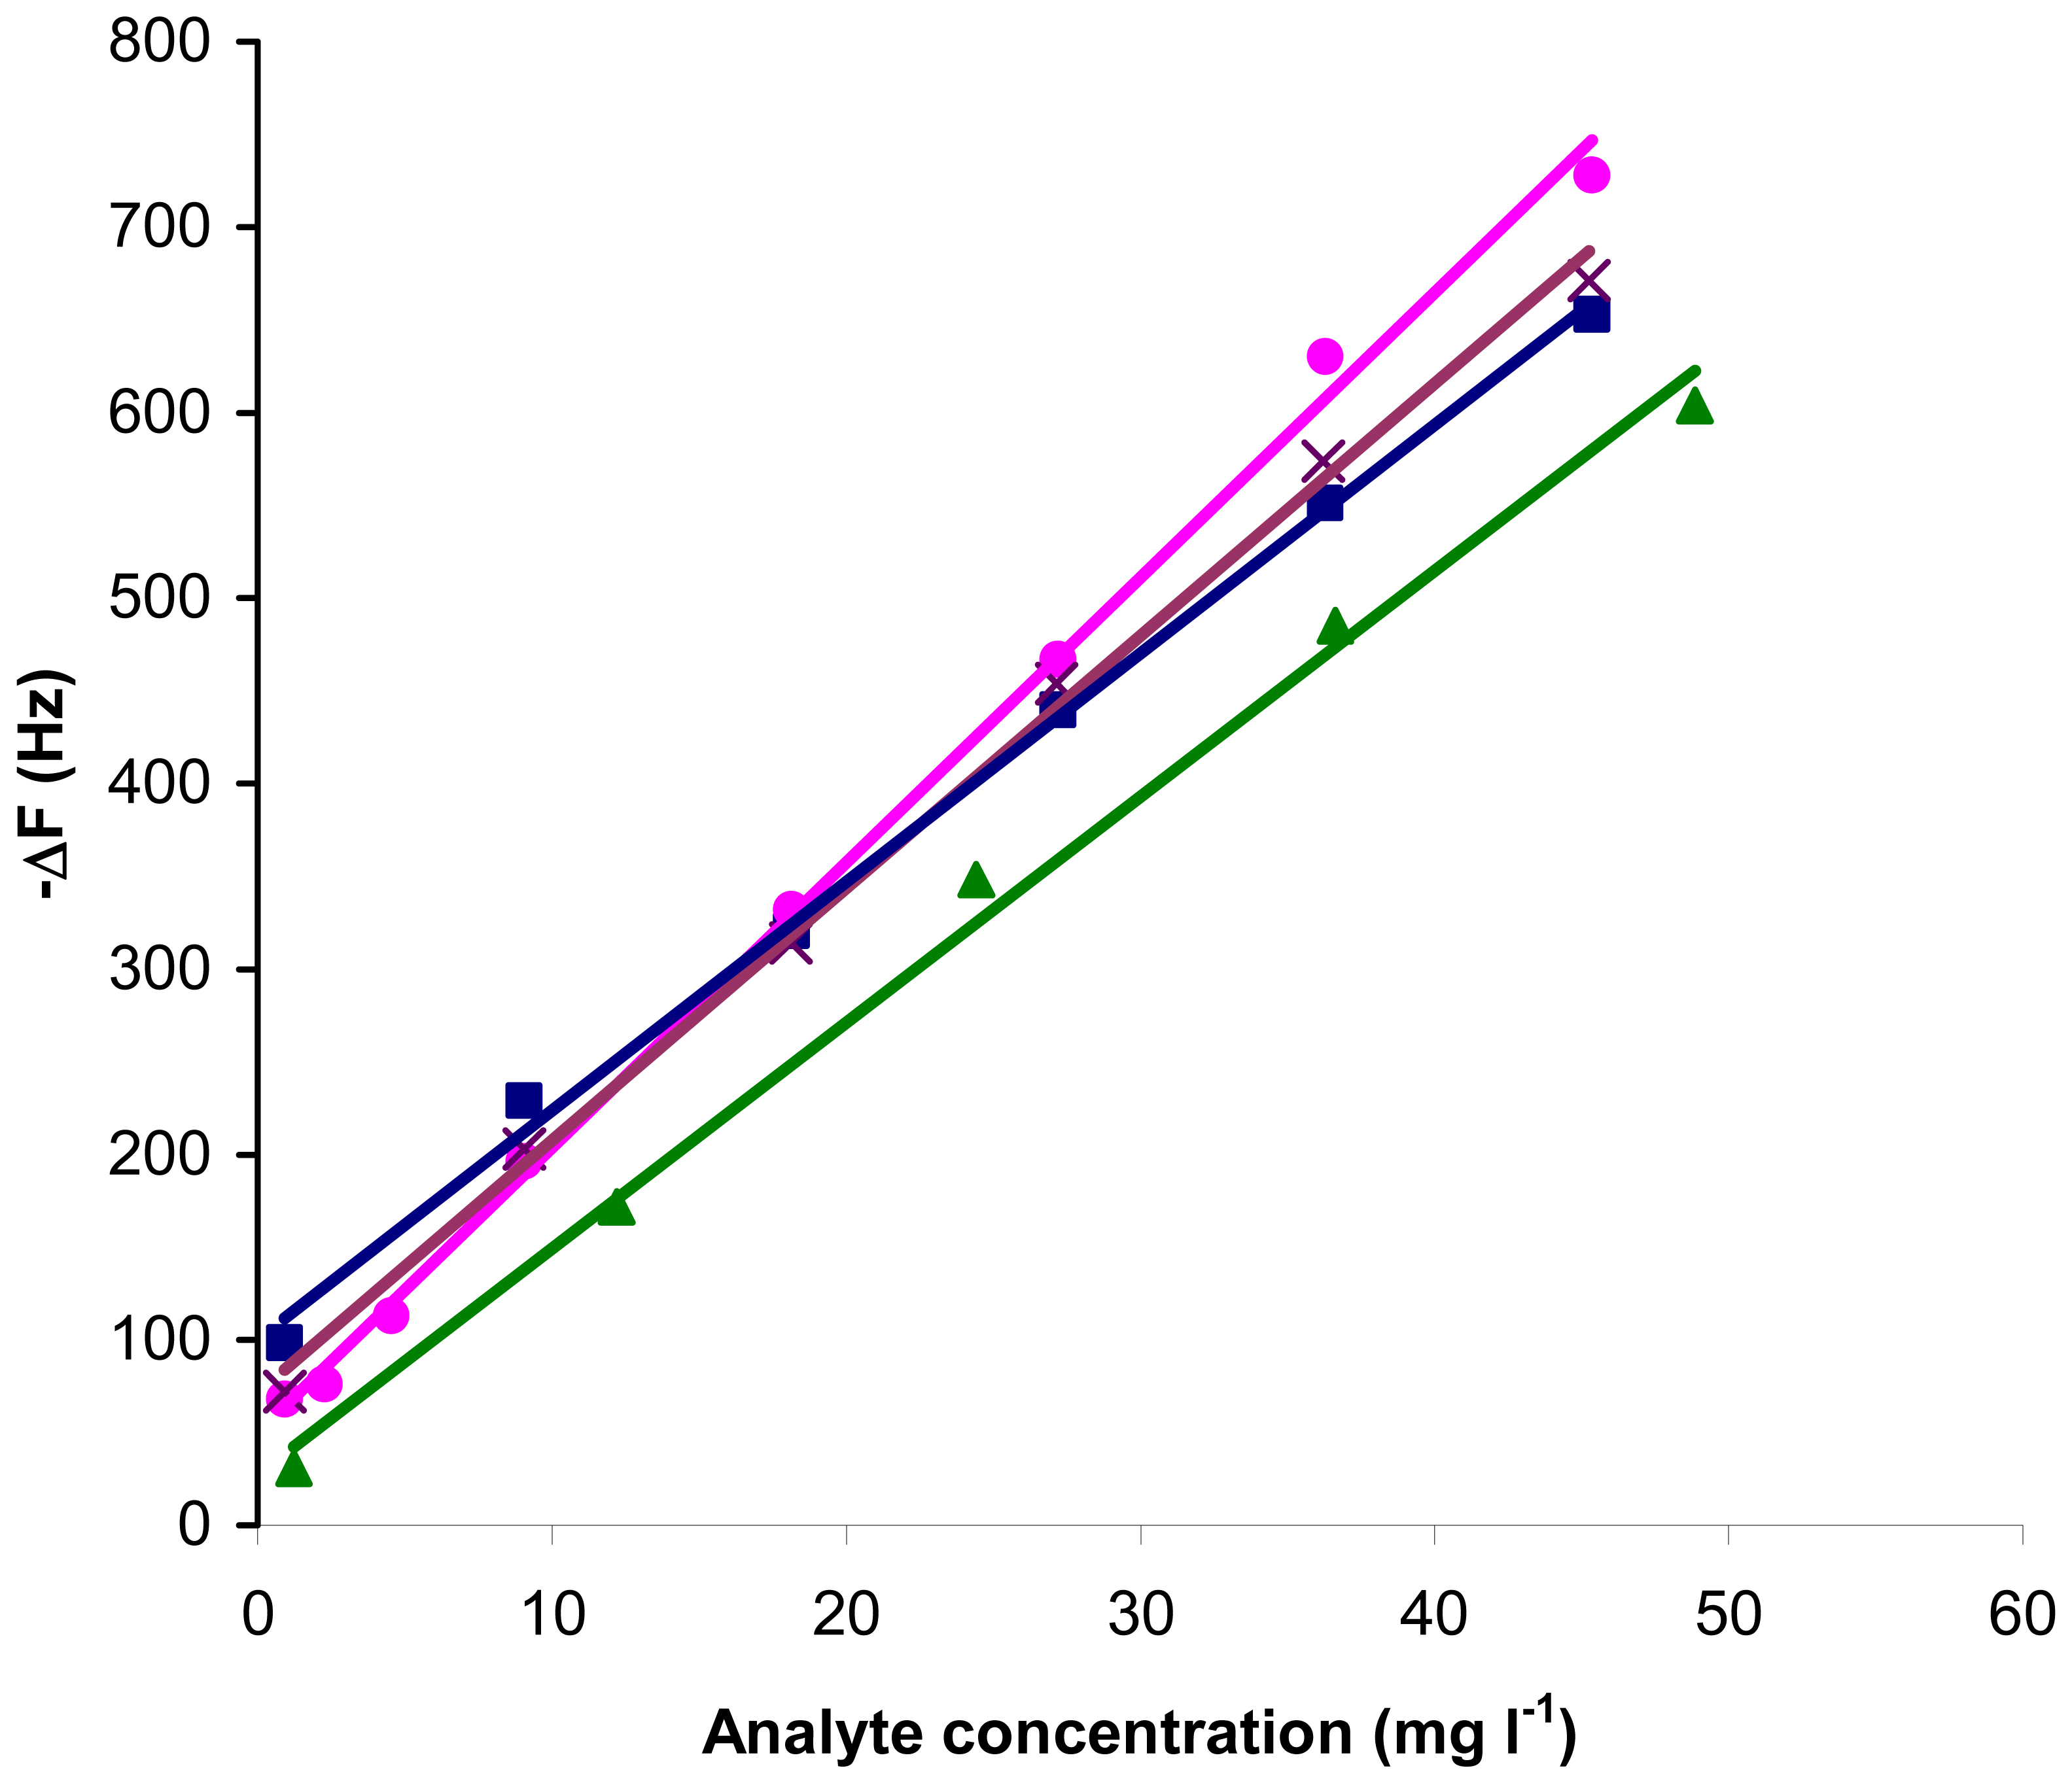
Figure 5 shows the frequency change Δ
f as a function of time for different concentrations of toluene, indicating that Δ
f increases monotonically with increasing gas concentration. This result strongly suggests that it is possible to prepare the gas sensor using a polystyrene-coated QCN for BTEX compounds. The frequency shifts used for plotting the calibration curves corresponded to the difference between the highest and the lowest values observed. Plots of the frequency shifts as a function of BTEX compounds concentration are shown in
Figure 6. As shown in
Figure 6, in the range of about 1-45 mg l
-1 there was a good linear relationship. The value of 0.9975, 0.9977, 0.9946 and 0.9971 was calculated for correlation coefficients of benzene, toluene, ethylbenzene and xylene, respectively.
The determination of the minimal concentration level of analytes that could be registered with the designed QCN sensor has been carried out. The frequency stability of an oscillator consists in its capacity to maintain the frequency of the output signal constant with time. The study showed that the base-line noise of the applied system was 1 Hz. The frequency-change limit necessary to detect an analyte is set at a signal-to-noise ratio of 3, three times the base line noise. Thus, the lower limit detection (LLD) of the QCN for BTEX was 1 mg l-1.
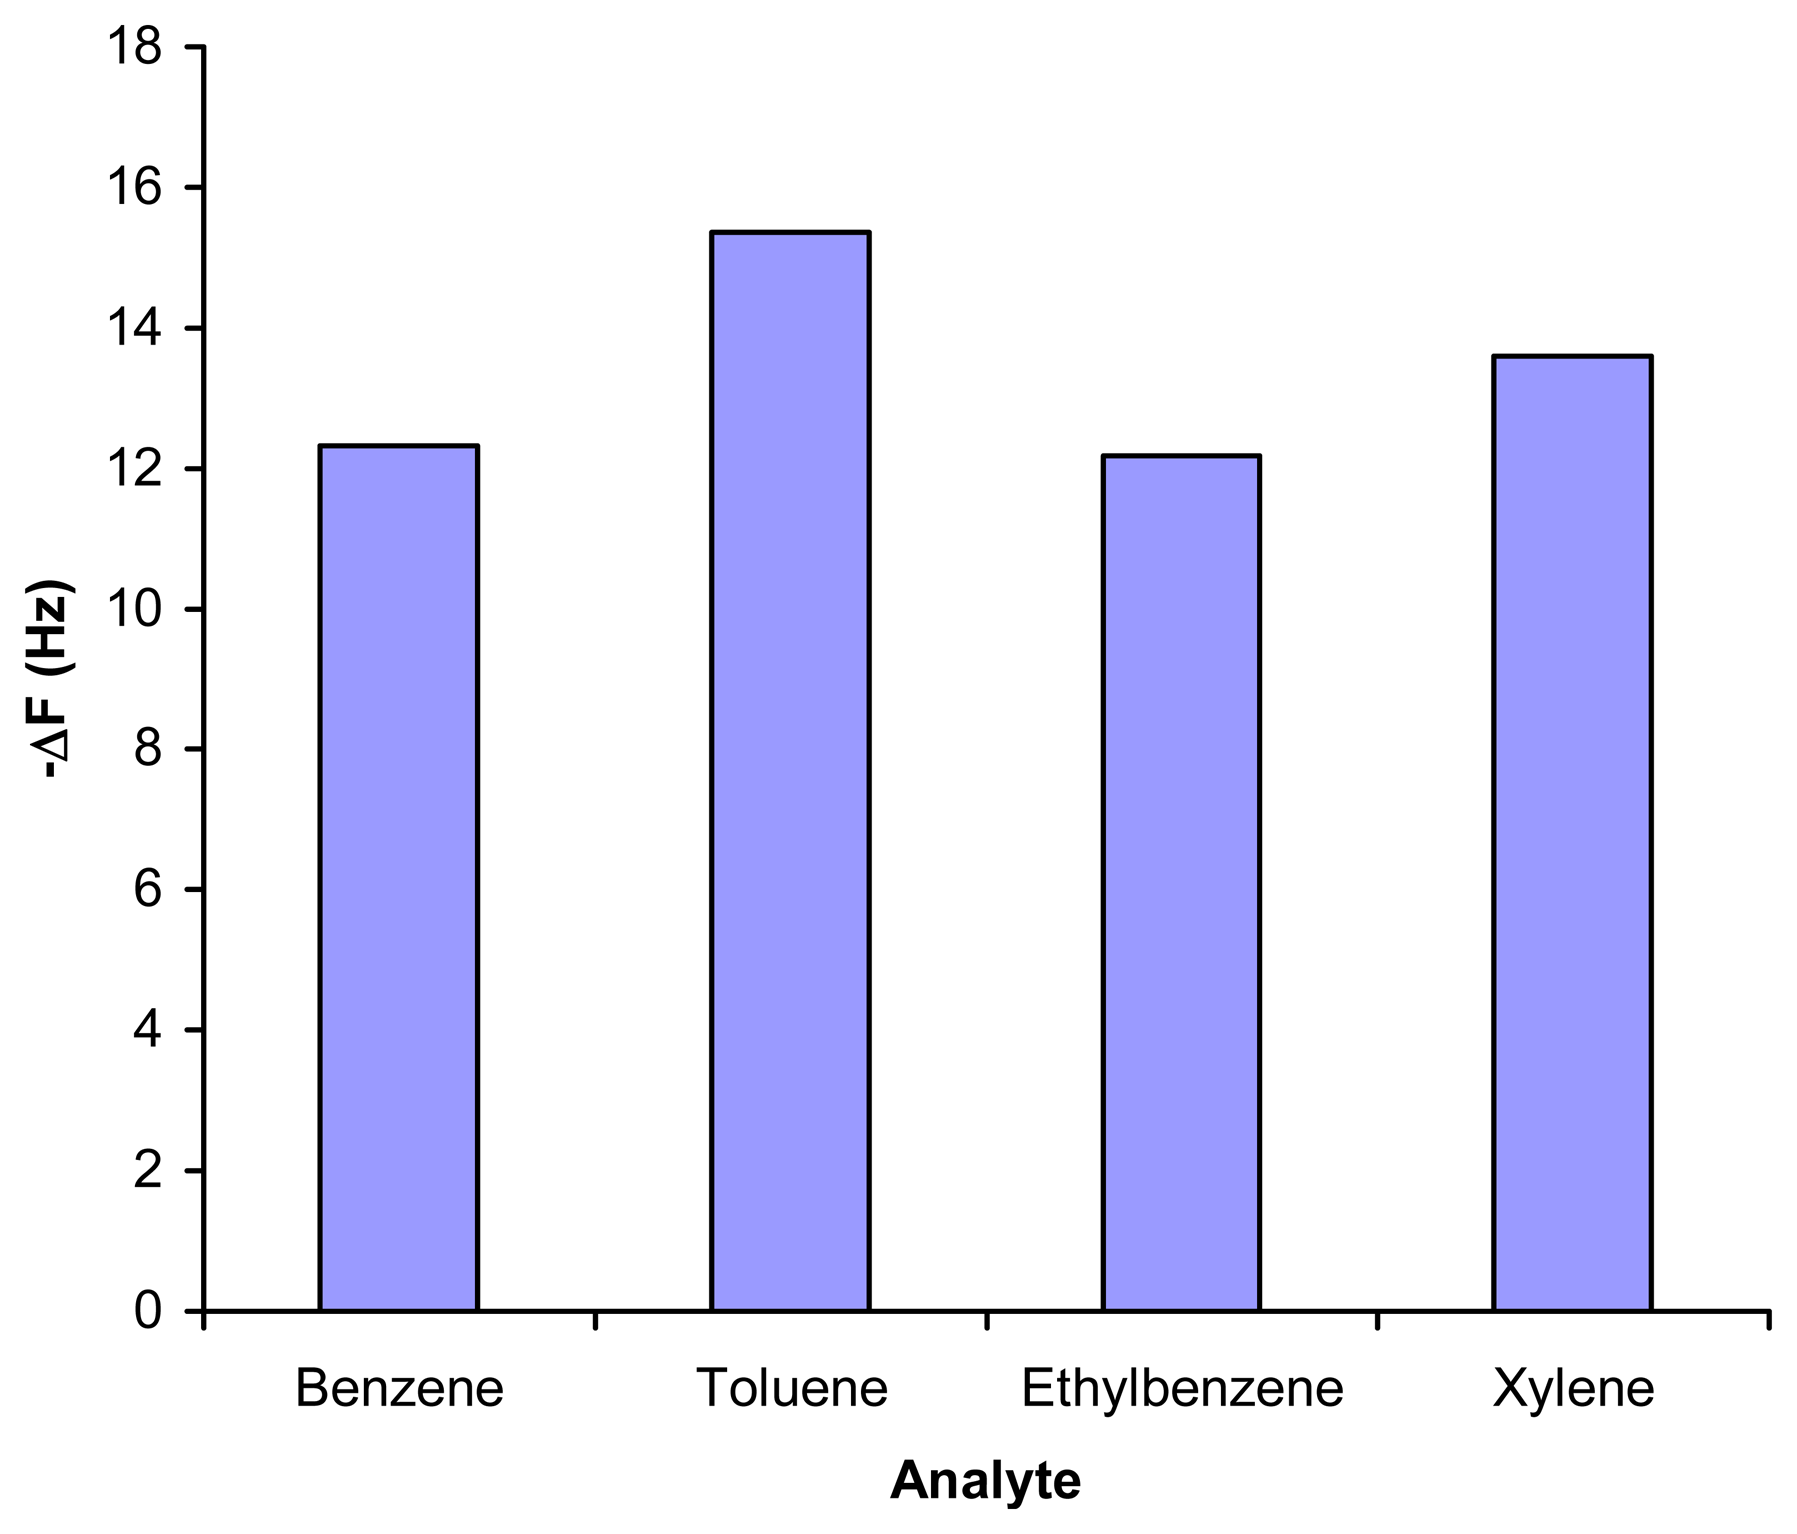
The sensitivity of each polymer towards each BTEX gas is expressed as the slope of the calibration curve. The bar graph (
Figure 7) illustrates the sensivity of the QCN sensors towards the examined analytes. As expected the sensors showed different sensitivities to the BTEX gases.
The sensor coated with polystyrene was alternatively exposed four times to the presence of BTEX compounds at the concentrations of 9.0 mg l-1. The relative standard deviations (RSDs) for BTEX compounds were 10.54%, 5.84%, 10.66% and 10.30%, respectively.
Identification of gases using principal component analysis
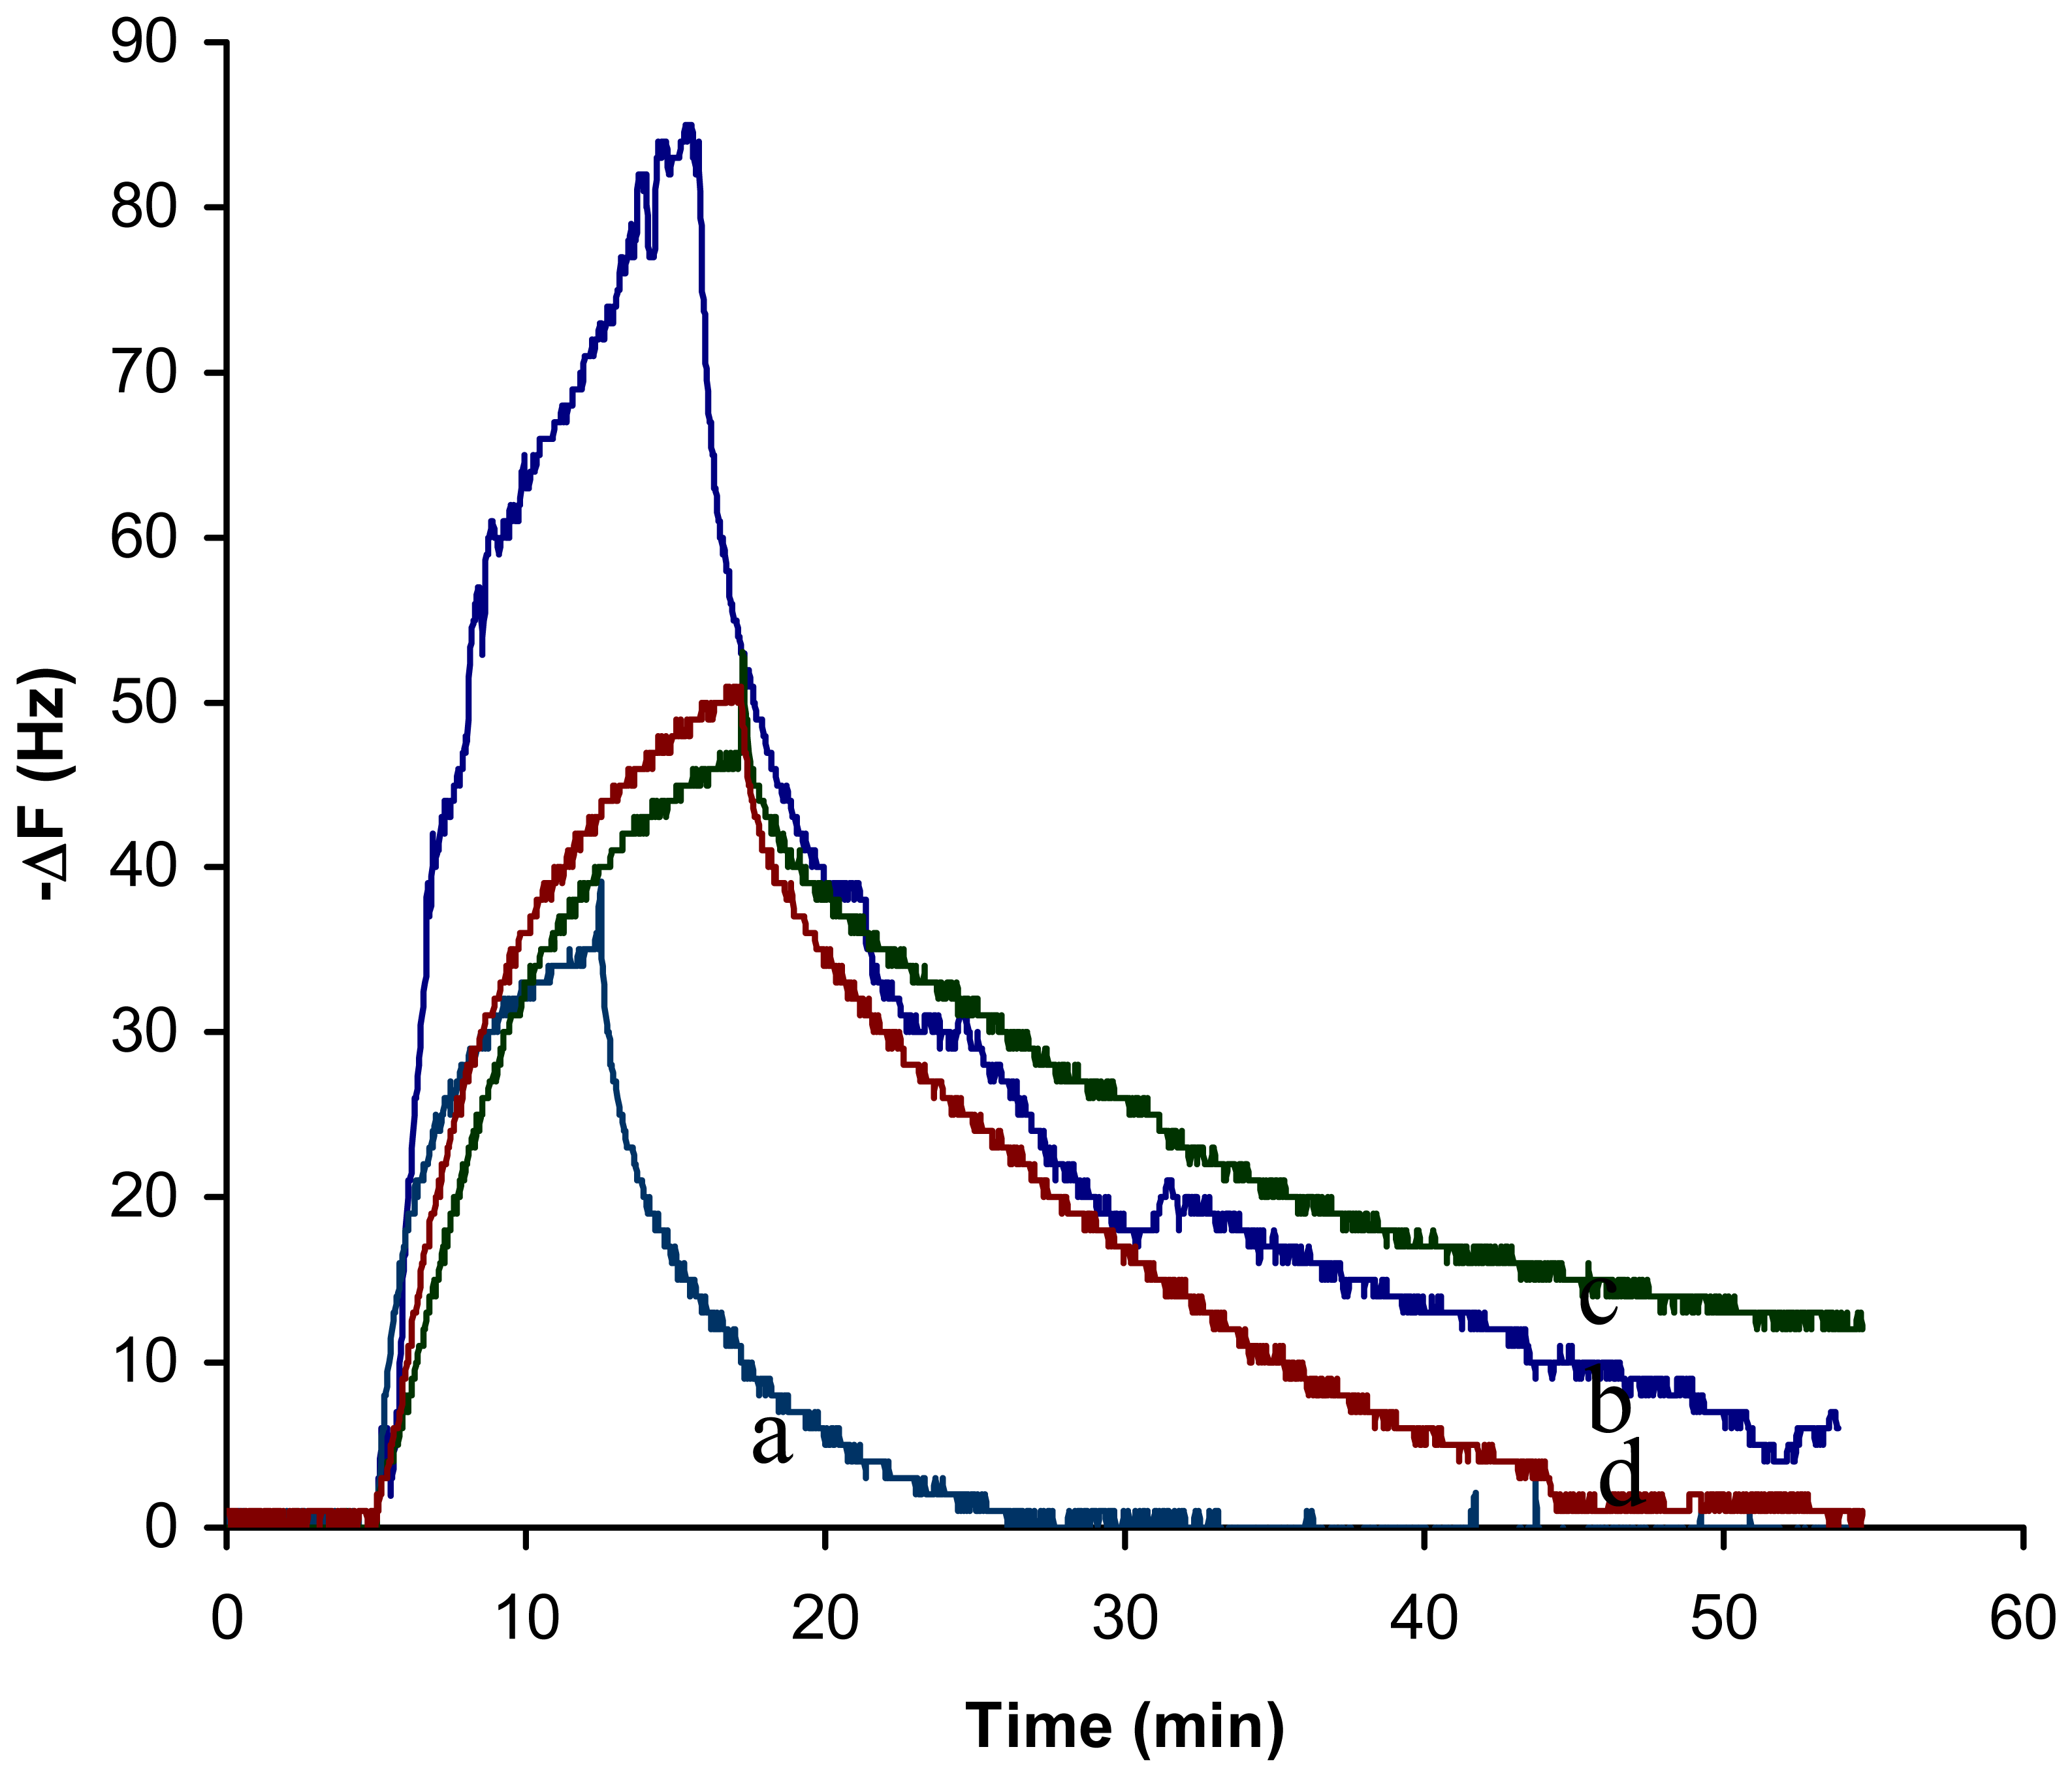
In this study, we concentrated on finding a gas sensor that also possesses an excellent selectivity for BTEX compounds. There is generally no applied rule to find selective sensing materials for the development of QCN sensors. To establish the ability of the polystyrene-coated QCN to discriminate between the BTEX gases a principal component analysis (PCA) was carried out. It can be seen from
Figure 8 that the shape of the transient responses of sensor is different from gas to gas. So, in order to distinguish gases using principal component pattern recognition analysis, we focused our attention to the different shape of each transient response.
The input variable used is the frequency of the crystal at every 20 s for 20 min after gas injection in the cell. All compounds were exposed to the cell at least twice and for four different concentrations including 15.2, 18.3, 21.3 and 24.4. To account for the different response magnitudes from the different concentrations, the responses were normalized and standardized to give a response vector of unity in each case, and subjected to PCA.
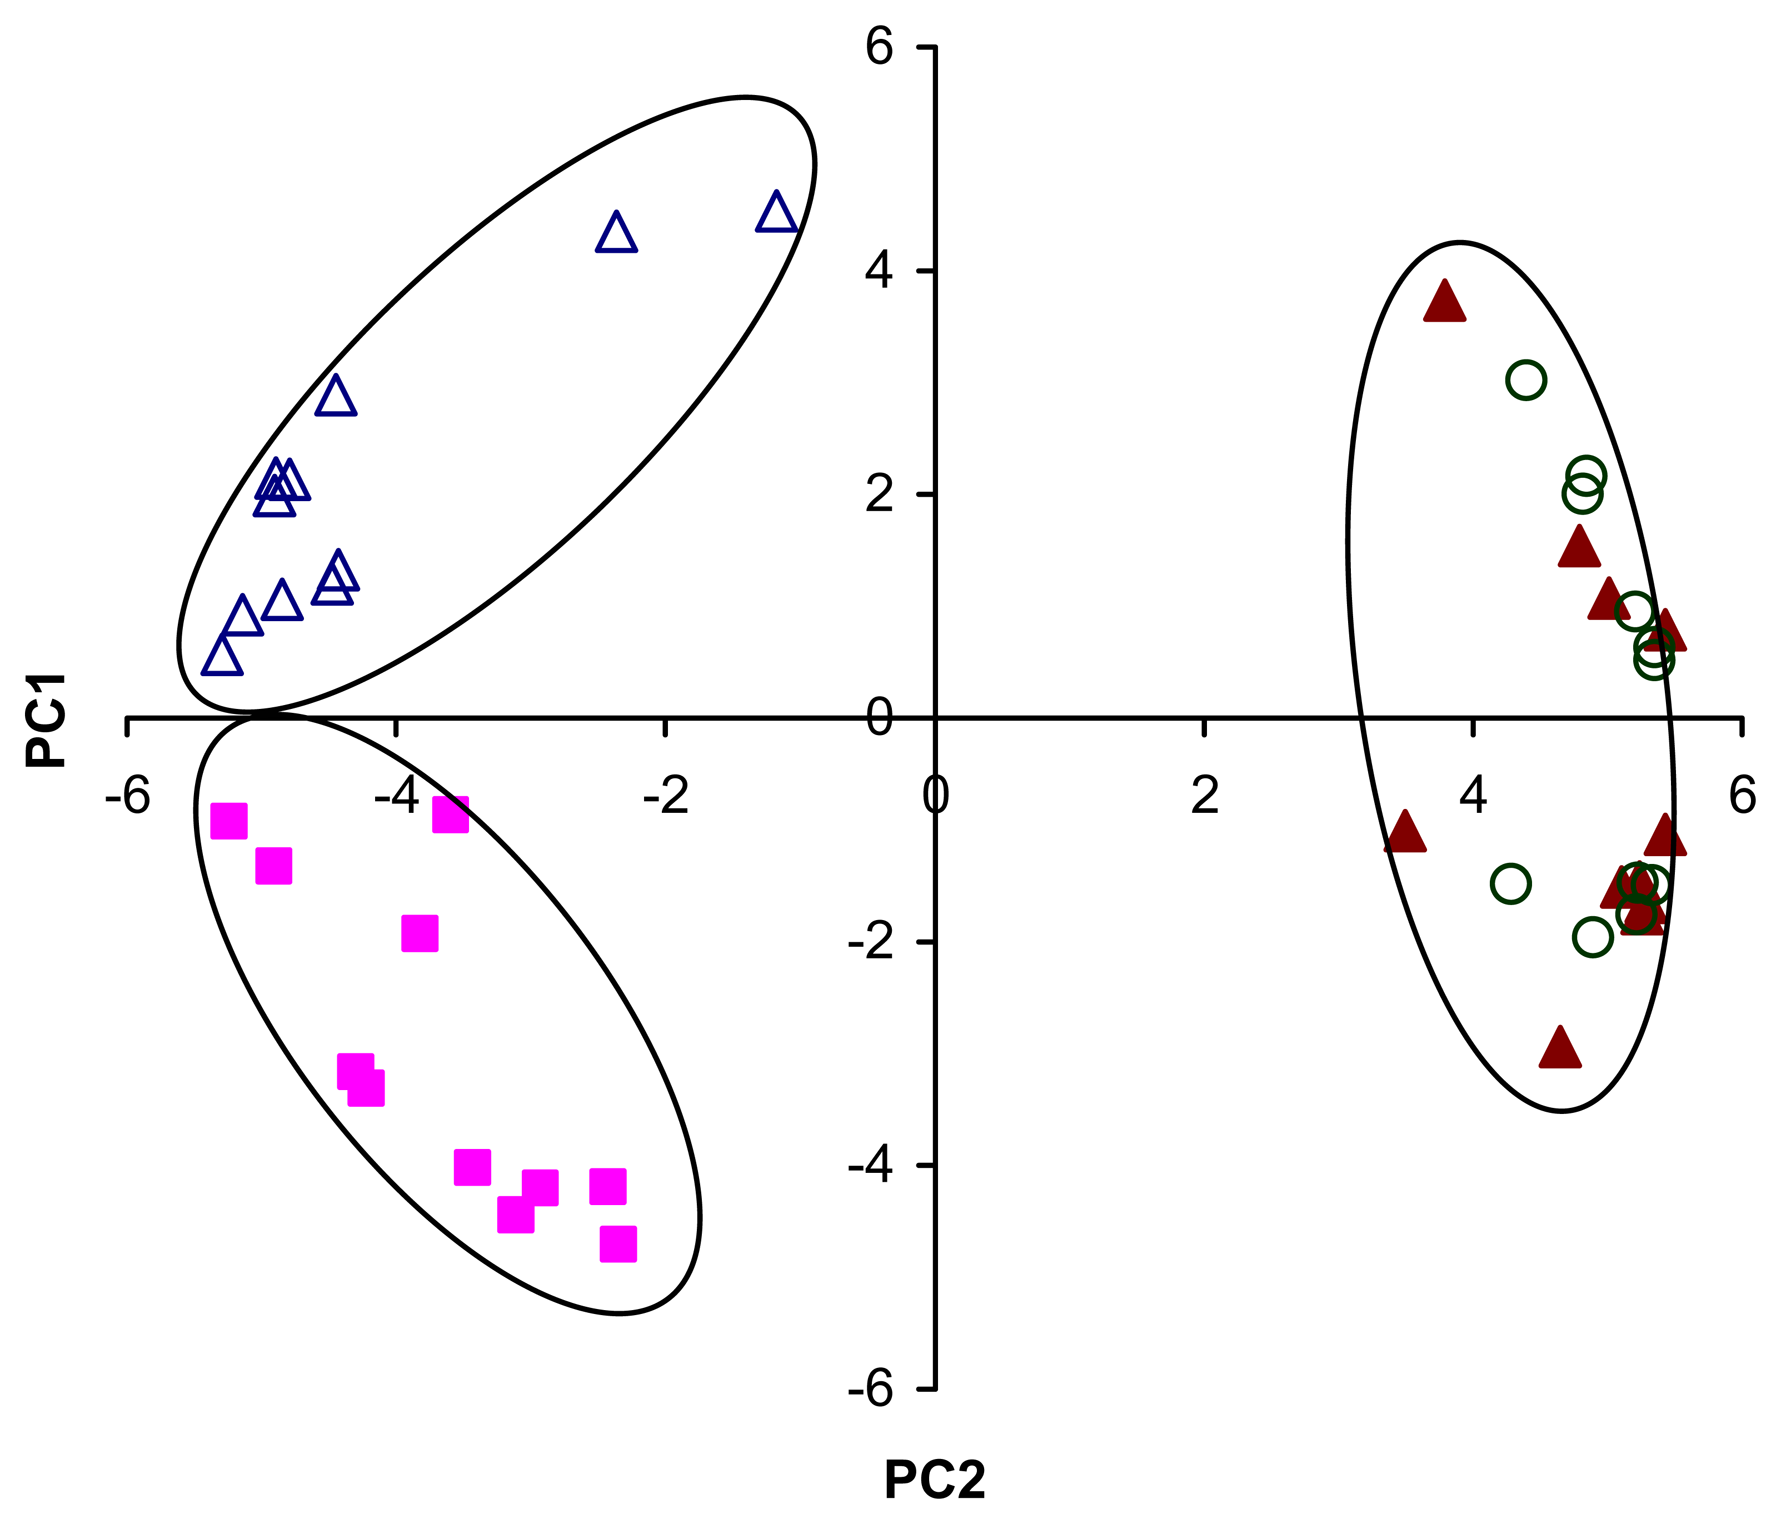
The results of the principal component analysis indicated that most of the information close to 90% is provided by PC1 and PC2.
Figure 9 is the plot of the PCA data for different concentrations of BTEX compounds. It is clear that an easy discrimination of the toluene and benzene was possible because they were specimen data clustered in two different regions, independent of their concentrations. In the case of ethylbenzene and xylene it is impossible to discrimination them. This result is because of the similar response profile of the polystyrene-coated QCN towards xylene and ethylbenzene (
Figure 8).


