Mathematical Modeling of Biosensors Based on an Array of Enzyme Microreactors

1
Faculty of Mathematics and Informatics, Vilnius University, Naugarduko 24, 03225 Vilnius, Lithuania
2
Institute of Mathematics and Informatics, Akademijos 4, 08663 Vilnius, Lithuania
3
Department of Chemistry and Bioengineering, Vilnius Gediminas Technical University, Sauletekio al. 11, 10223 Vilnius, Lithuania
*
Author to whom correspondence should be addressed.
Sensors 2006, 6(4), 453-465; https://doi.org/10.3390/s6040453
Submission received: 30 July 2005
/
Accepted: 4 January 2006
/
Published: 7 April 2006
Abstract
:This paper presents a two-dimensional-in-space mathematical model of biosensors based on an array of enzyme microreactors immobilised on a single electrode. The modeling system acts under amperometric conditions. The microreactors were modeled by particles and by strips. The model is based on the diffusion equations containing a non-linear term related to the Michaelis-Menten kinetics of the enzymatic reaction. The model involves three regions: an array of enzyme microreactors where enzyme reaction as well as mass transport by diffusion takes place, a diffusion limiting region where only the diffusion takes place, and a convective region, where the analyte concentration is maintained constant. Using computer simulation, the influence of the geometry of the microreactors and of the diffusion region on the biosensor response was investigated. The digital simulation was carried out using the finite difference technique.
Introduction
Biosensors are sensors that use biological components, usually enzymes, which catalyse the interaction with an analyte [1-3]. The amperometric biosensors measure the Faradaic current that arises on a working indicator electrode by direct electrochemical oxidation or reduction of the products of the biochemical reaction [4,5]. In amperometric biosensors the potential at the electrode is held constant while the current is measured. Amperometric biosensors are known to be reliable, cheap and highly sensitive for environment, clinical and industrial purposes [6,7].
In some applications of biosensors, enzymes are archival and only available in every limited quantity or are the products of combinatorial synthesis procedures and thus, are only produced in microgram to milligram quantities. These include point-of-care testing [8], high throughput drug discovery [9], detection of biological warfare agents [10], astrobiology [11] and others. Such applications of biosensors require high-density arrays of microvolume reaction vessels. Because of this, miniaturization of biosensors is a very important trend in biotechnology. The application of arrays of microreactors is one way of miniaturization.
Since it is not generally possible to measure the concentration of a substrate inside enzyme domains with analytical devices, starting from seventies various mathematical models of amperometric biosensors have been developed and used as an important tool to study and optimise analytical characteristics of actual biosensors [12-16]. The goal of this investigation is to make a model allowing an effective computer simulation of a biosensor system based on an array of enzyme microreactors immobilised on a single electrode.
The developed model is based on diffusion equations [17,18], containing a non-linear term related to the Michaelis-Menten kinetics of the enzymatic reaction. The model involves three regions: an array of microreactors where enzyme reaction as well as mass transport by diffusion takes place, a diffusion limiting region where only the diffusion takes place, and a convective region, where the analyte concentration is maintained constant. The enzyme microreactors were modeled by identical particles (right cylinders) and by strips (right longitudinal quadrangular prisms) distributed uniformly on the electrode surface.
Using a computer simulation the influence of the geometry of the microreactors as well as of the diffusion region on the biosensor response was investigated. The computer simulation was carried out using the finite difference technique [19].
Principal structure
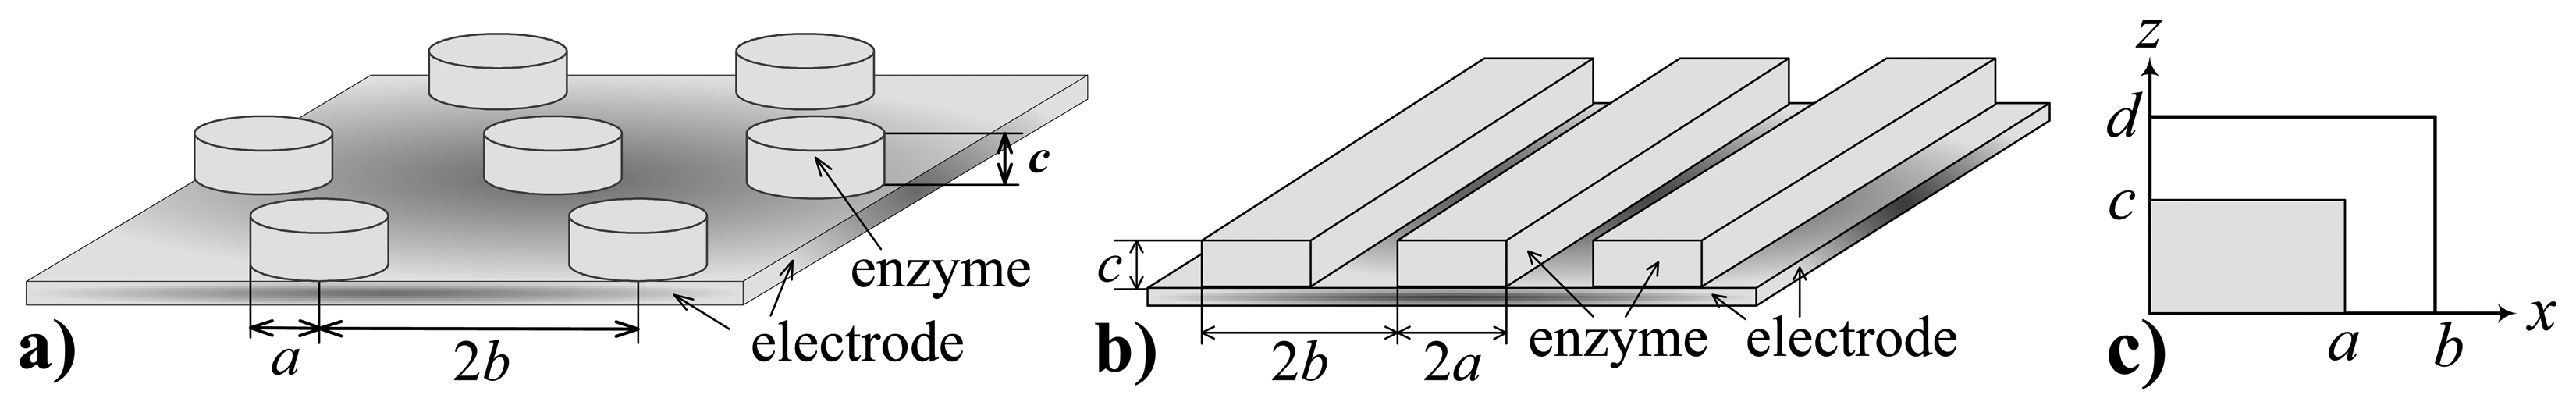
We investigate two shapes of the enzyme microreactors immobilised on a single electrode. In the case of the first type of the biosensor geometry, the microreactors were modeled by identical enzyme filled right cylinders. Fig. 1a shows a biosensor system, where the enzyme cylinders of radius a and height c are arranged in a rigid hexagonal array. The distance between the centres of two adjacent cylinders equals 2b.
Assuming the uniform distribution of the enzyme microreactors on the electrode surface, the biosensor may be divided into equal hexagonal prisms with regular hexagonal bases. For simplicity, it is reasonable to consider a circle of radius b whose area equals to that of the hexagon and to regard of one of the cylinders as a unit cell. Due to the symmetry of the unit cell, we may consider only a half of the transverse section of the unit cell. We assume also that the mass transport during the biosensor action obeys a finite diffusion regime. The profile of the biosensor at Y-plane is depicted in Fig. 1c. A very similar approach has been used in modeling of partially blocked electrodes [20,21] and in modeling of surface roughness of the enzyme membrane [22].
In the second case the microreactors were modeled by identical strips distributed uniformly on the electrode surface. Fig. 1b shows a biosensor, where enzyme microreactors are right quadrangular prisms of base 2a by c distributed uniformly so, that the distance between adjacent prisms equals to 2(b – a). Due to the uniform distribution of the enzyme strips, it is reasonable to consider only a unit consisting of a single strip together with the region between two adjacent strips. Because of the symmetry and the relatively great length of the unit cell we may consider only the transverse section of a half of the unit. Fig. 2c represents the profile also for that kind of microreactors.
Mathematical model
Consider a scheme where the substrate (S) is enzymatically converted to the product (P) [3],
We have discussed two different types of the geometry of the enzyme microreactors: cylinders and strips. However, the profile at Y-plane (Fig. 1c) is the same for both types of the microreactors. Nevertheless, the corresponding mathematical models have to be formulated differently. In the case of the cylinders (Fig. 1a), we formulate a two-dimensional-in-space (2-D) model in cylindrical coordinates, while in the next case (Fig. 1b) we formulate 2-D model in Cartesian ones.
In the profile (Fig. 1c), parameter b stands for the half width (radius) of the entire unit cell, while a stands for the half width (radius) of the enzyme microreactor. c is the height of the microreactor. The fourth parameter d is the thickness of the diffusion layer.
The diffusion region surrounding the microreactors is known as the Nernst diffusion layer [23]. According to the Nernst approach, the diffusion takes place in a finite layer of the buffer solution.
Away from it, the solution is in motion and uniform in concentration. The thickness of the Nernst layer remains unchanged with time. If a substrate is well-stirred and in powerful motion, then rather often the Nernst diffusion layer is neglected [13,24]. However, in practice, the zero thickness of the Nernst layer can not be achieved [5,23]. Because of this, we assume that the mass transport during the biosensor action obeys a finite diffusion regime.
Let Ω and Ω0 be open regions corresponding to the entire domain to be considered and enzyme region, respectively, and Γ - the bulk solution/enzyme border,
where x and z stand for the space in both systems of coordinates: Cartesian and cylindrical.
Let Ω̅ and Ω̅0 denote the corresponding closed regions. Coupling the enzyme-catalysed reaction in the enzyme region with the two-dimensional-in-space mass transport by diffusion, described by Fick's law, leads the system of the reaction-diffusion equations (t > 0),
where t stands for time, Δ is the Laplace operator, Se(x, z, t), Sb(x, z, t), (Pe(x, z, t), Pb(x, z, t)) are the substrate (reaction product) concentrations in the enzyme and bulk solution, respectively, De, Db are the diffusion coefficients, Vmax is the maximal enzymatic rate and KM is the Michaelis constant. The expression of the Laplace operator depends on the system of coordinates [17].
In the domain presented in Fig. 1c, z = 0 represents the electrode surface, and Γ corresponds to the bulk solution/enzyme interface. The biosensor operation starts when the substrate appears over the surface of the enzyme region. This is used in the initial conditions (t = 0),
where S0 is the concentration of substrate in the bulk solution.
The following boundary conditions express the symmetry of the biosensor:
In the scheme (1) the product (P) is an electro-active substance. The electrode potential is chosen to keep the zero concentration of the product at the electrode surface. The substrate (S) does not react at the electrode surface. This is used in the boundary conditions (t > 0) given by
On the surface Γ we define the matching conditions (t > 0),
where n stands for the normal direction.
In a special case when a = b, the model (3)-(8) describes an operation of flat membrane biosensors [2,3,25].
The measured current is accepted as a response of a biosensor in a physical experiment. The current depends upon the flux of the electro-active substance (product) at the electrode surface, i.e. on the border z = 0. Consequently, the density i(t) of the biosensor current at time t can be obtained explicitly from the Faraday's and Fick's laws. In the case of the Cartesian coordinates, i(t) is expressed as follows:
where ne is a number of electrons involved in a charge transfer, and F is the Faraday constant. The following expression defines i(t) in the case of the cylindrical coordinates:
where φ is the third cylindrical coordinate.
Digital simulation
Close mathematical solutions are not usually possible when analytically solving multi-dimensional non-linear partial differential equations with complex boundary conditions. Therefore, the problem was solved numerically [18,24]. The finite difference technique was applied for discretization of the mathematical model [19].
We introduced an uniform discrete grid in all directions: x, z and t [22,25,26]. Using the alternating direction method, an implicit finite difference scheme has been built as a result of the difference approximation of the model. The resulting systems of linear algebraic equations were solved efficiently because of the tridiagonality of their matrices. Having a numerical solution of the problem, the density of the biosensor current was calculated easily. The software was programmed in JAVA language [27].
The mathematical model as well as the numerical solution of the model was evaluated for different values of the maximal enzymatic rate Vmax, substrate concentration S0 and the geometry of the enzyme microreactors.
We assumed the upper layer of the thickness δN = d - c from the enzyme region as the Nernst diffusion layer. The thickness δN of the Nernst layer depends upon the nature and stirring of the buffer solution. Usually, the more intensive stirring corresponds to the thinner diffusion layer. In practice, the zero thickness of the Nernst layer can not be achieved. In a case when the solution to be analysed is stirred by rotation of the enzyme electrode, the thickness δN of the Nernst diffusion layer may be minimized up to 0.02 mm by increasing the rotation speed [5,23]. That thickness of the Nernst layer, δN = d - c = 0.02 mm, we used to simulate the biosensor action changing other parameters.
The following values of the parameters were default in the numerical simulation of all the experiments:
The steady-state biosensor current i∞ (the biosensor response) as well as the time moment of occurrence of the steady-state current (response time) were assumed and analysed as ones of the most important characteristics of biosensors.
In digital simulation, the biosensor response time was assumed as the time when the absolute current slope value falls below a given small value normalised with the current value. In other words, the time needed to achieve a given dimensionless decay rate ɛ is used:
Consequently, the current at the response time tR was assumed as the steady-state biosensor current i∞. In calculations, we used ɛ = 10-4. However, the response time tR as an approximate steady-state time is very sensitive to the decay rate ɛ, i.e. tR → ∞, when ɛ → 0. Because of this, we employed a half of steady-state time to investigate the behaviour the response time [17]. The resultant relative output signal function i*(t) can be expressed as follows:
where i(t) is the output current density at time t as defined in (9) and (10), iR is assumed as the steady-state current i∞. Let us notice, that 0 ≤ i*(t) ≤ 1 at all t ≥ 0, i*(0) = 1 and i*(tR) = 0. Let t0.5 be the time at which the reaction-diffusion process reaches the medium, called half-time of steady-state or, particularly, half of the time moment of occurrence of the maximal current, i.e., i*(t0.5) = 0.5.
The adequacy of the mathematical and numerical models was evaluated using known analytical solutions for amperometric biosensors with a single flat enzyme layer. At relatively low concentrations of the substrate, S0 ≪ KM, the steady-state current can be calculated as follows [12]:
where c is the thickness of the enzyme layer. The dimensionless factor σ2 is known as the diffusion modulus (Damköhler number) [17,18]. In the case of flat biosensors the diffusion modulus σ2 essentially compares the rate of enzyme reaction (Vmax/KM) with the diffusion through the enzyme layer (c2/De). The biosensor response is known to be under diffusion control when σ2 ≫ 1. If σ2 ≪ 1, then the enzyme kinetics predominates in the response. The model (3)-(8) is applied to the enzyme membrane biosensors when a = b is assumed.
In the case of very high substrate concentration, S0 ≫ KM, the stationary current is expressed as follows [28]:
The numerical solution of the model (3)-(8) was compared with the analytical ones (15) and (17), accepting a = b = c = d = 0.1 mm at various values of Vmax: 1, 10, 100, 1000 μM/s and two values of S0: 10-8, 0.1 M. In all the cases, the relative difference between the numerical and analytical solutions was less than 1%.
Results and discussion
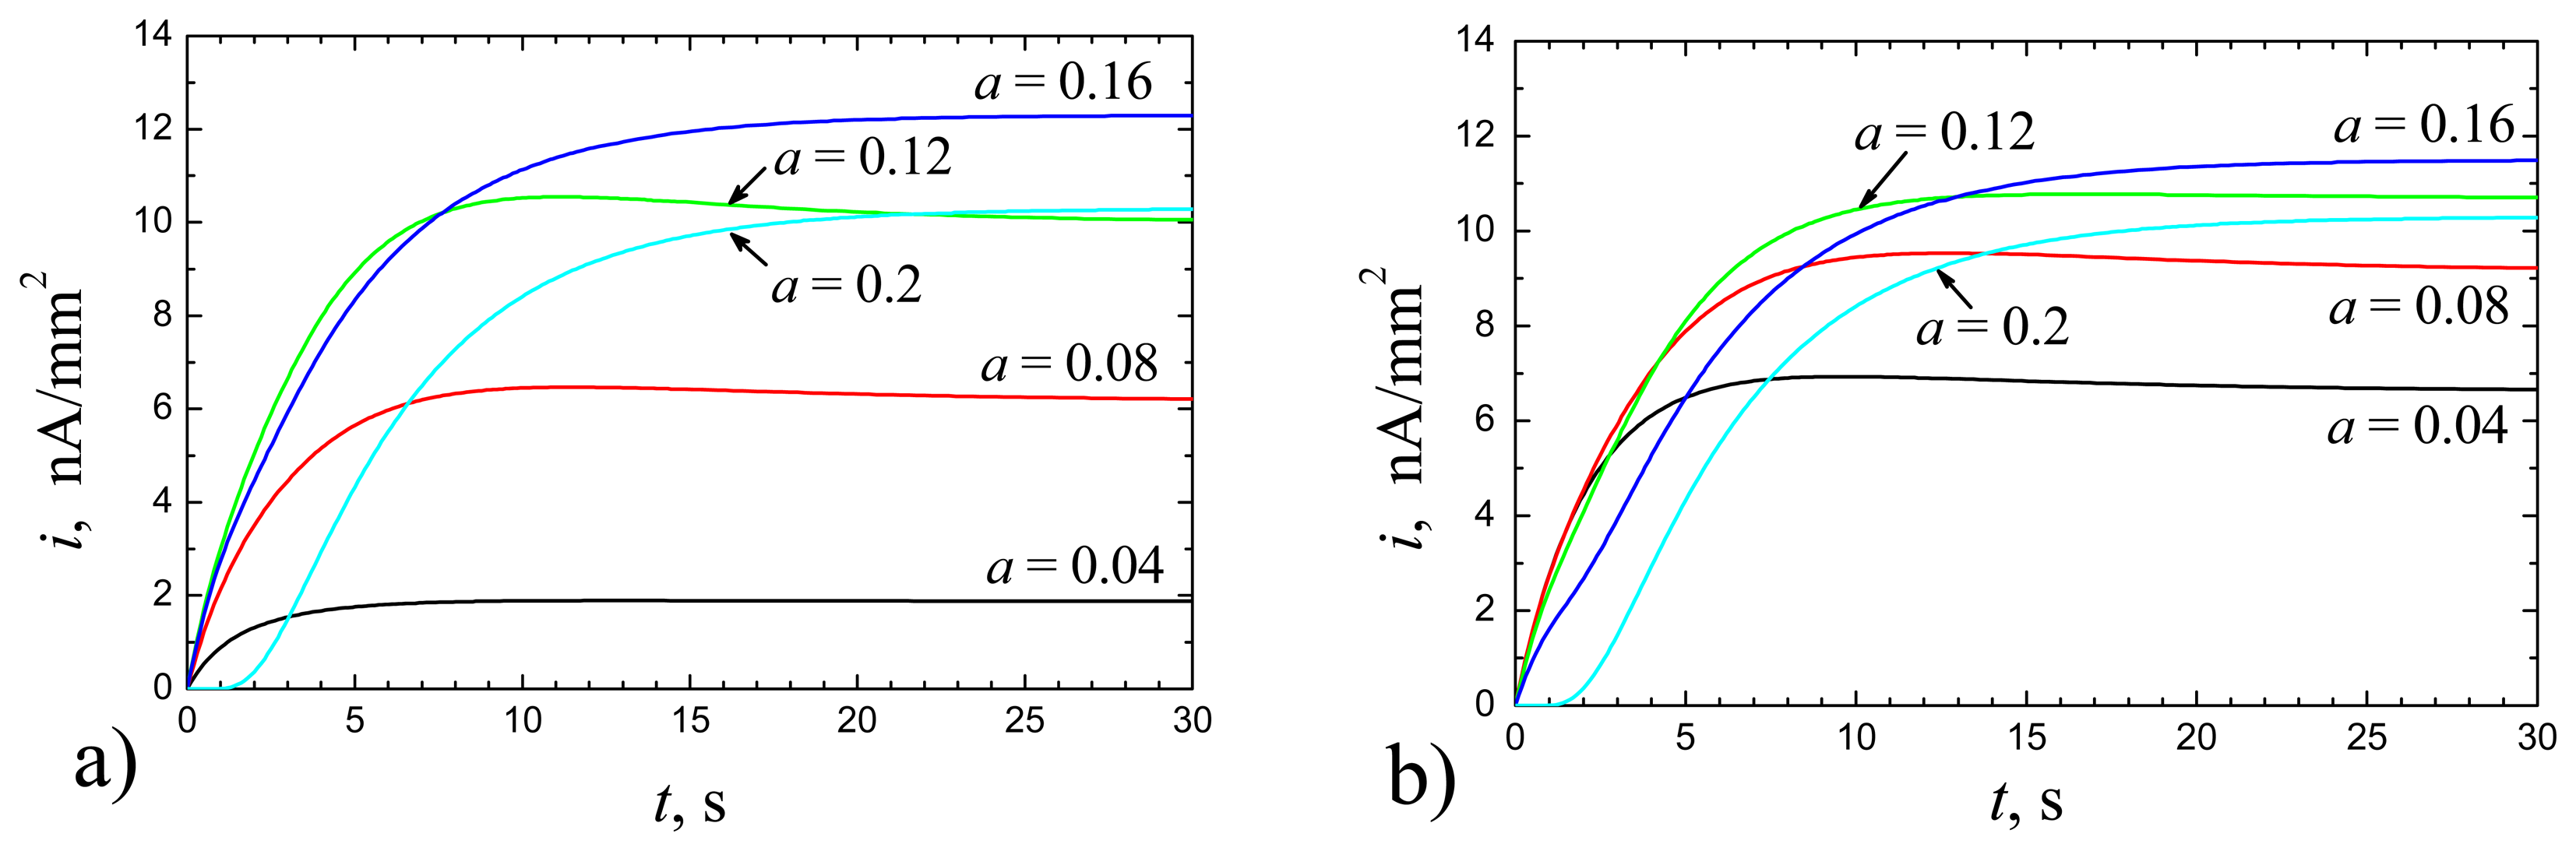
Using numerical simulation, the influence of the geometry of the enzyme microreactors on the steady-state current was investigated. Firstly, we calculated values of the biosensor current at different values of the half-width a of the enzyme microreactors keeping all other parameters constant. Fig. 2 shows the dynamics of the biosensor current i at the height c = 0.1 mm of the microreactors, b = 2c = 0.2 mm, d = c + δN = 0.12 mm, Vmax = 100 μM/s, S0 = 20 μM and five values of the half-width a of the microreactors: from 0.2b to b. The enzyme microreactors were modeled by cylinders (Fig. 2a) and by strips (Fig. 2b).
One can see in Fig. 2, that the half-width a of the enzyme microreactors significantly effects the biosensor current i as well as the response time. In the case of continuous membrane (a = b = 0.2 mm), the biosensor current is a monotonous increasing function of time t. However, when a < b, i is a non-monotonous function of t. Fig. 2 shows, that the steady-state biosensor current is also a non-monotonous function of a. To investigate that effect in details we calculate the steady-state current iR at different values of the half-width b of entire unit changing the half-width a of the microreactor. To compare the response of a biosensor based on an array of the microreactors (a < b) with the response of the corresponding flat (membrane) biosensor (a = b), we introduce the normalised steady-state current iN(θ) as a function of the degree θ of the electrode surface coverage,
where iR(θ) ≈ i∞(θ) is the steady-state biosensor current calculated at the degree θ of the coverage, 0 < θ ≤ 1. The dimensionless degree θ was expressed as the area of the bases of all enzyme microreactors divided by the area of the whole electrode surface. The case when θ = 1 corresponds to a flat biosensor, i.e. fully covered by enzyme mono-layer. In the case when microreactors are modeled by cylinders (Fig. 1a), θ = a2/b2, and θ = a/b in the case of strips (Fig. 1b).
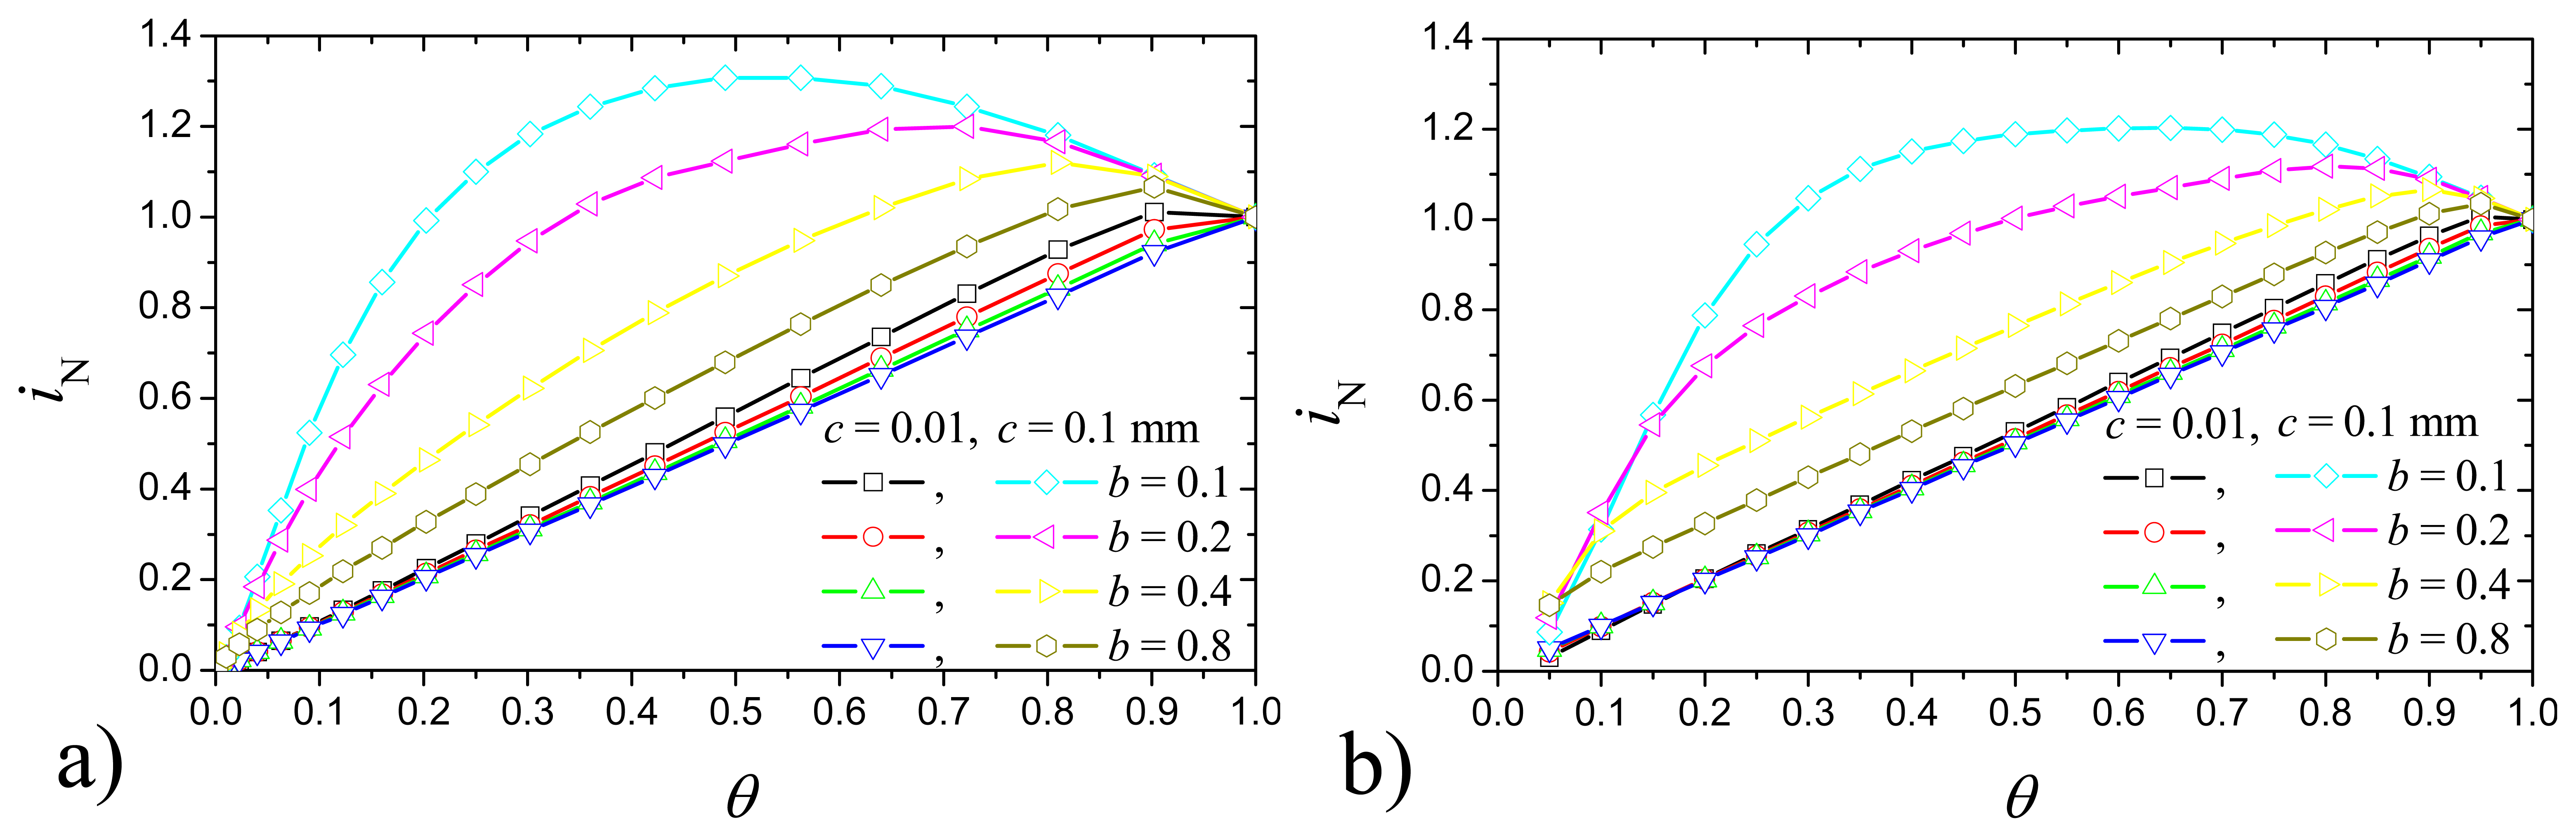
Fig. 3 shows the normalised steady-state current iN versus the degree θ of the electrode coverage at four values of b and two values of the height c of the microreactors, d = c + 0.02 mm, Vmax = 100 μM/s, S0 = 20μM.
One can see in Fig. 3, in the case of c = 0.1 mm, the steady-state current is a non-monotonous function of the degree θ of the electrode coverage. At 10 times smaller value of c the normalised current iN increases monotonously at 0 < θ ≤ 1. This property is valid for both systems of coordinates: cylindrical and Cartesian. In the case of c = b = 0.1 mm, the relative difference between steady-state current at θ = 0.5 and another one at θ = 1 exceeds 30% in the case of cylinders (Fig. 3a) and exceeds 20% in the case of strips (Fig. 3b). The shape of corresponding curves is very similar for both systems of coordinates. Let us notice, that the volume of enzyme microreactors is directly proportional to the degree θ, when the height c of the microreactors is kept constant. Although, the biosensor, based on an array of microreactors, is of less enzyme volume (θ < 1) than the corresponding membrane one (θ = 1), the array biosensor can generate an even higher steady-state current than the membrane one.
The variation of the half-width b of the entire unit keeping θ and c constant does not change the volume of the microreactors. Since iN varies with b (Fig. 3), the biosensor response depends also on the shape of the enzyme microreactors not only on their volume. The smaller value of b corresponds to the denser distribution of the enzyme microreactors on the electrode surface. The denser microreactors are distributed the higher the steady-state current is generated.
The biosensor response considerably depends on the fact that either the enzyme kinetics or the mass transport predominate in the biosensor response [2,3,26]. Assuming the continuous enzyme layer (a = b) of thickness c = 0.1 mm, the diffusion modulus σ2, calculated at Vmax = 100 μM/s and values given in (12), equals approximately to 33.3, i.e. the biosensor response is under diffusion control. While at ten times smaller value of c (0.01 mm), σ2 equals approximately to 0.33 and consequently the enzyme kinetics controls the biosensor response. According to Fig. 3 the steady-state current is a non-monotonous function of the degree θ of the electrode coverage when σ2 > 1, i.e. when the biosensor response is significantly under diffusion control. Additional calculations approved this property.
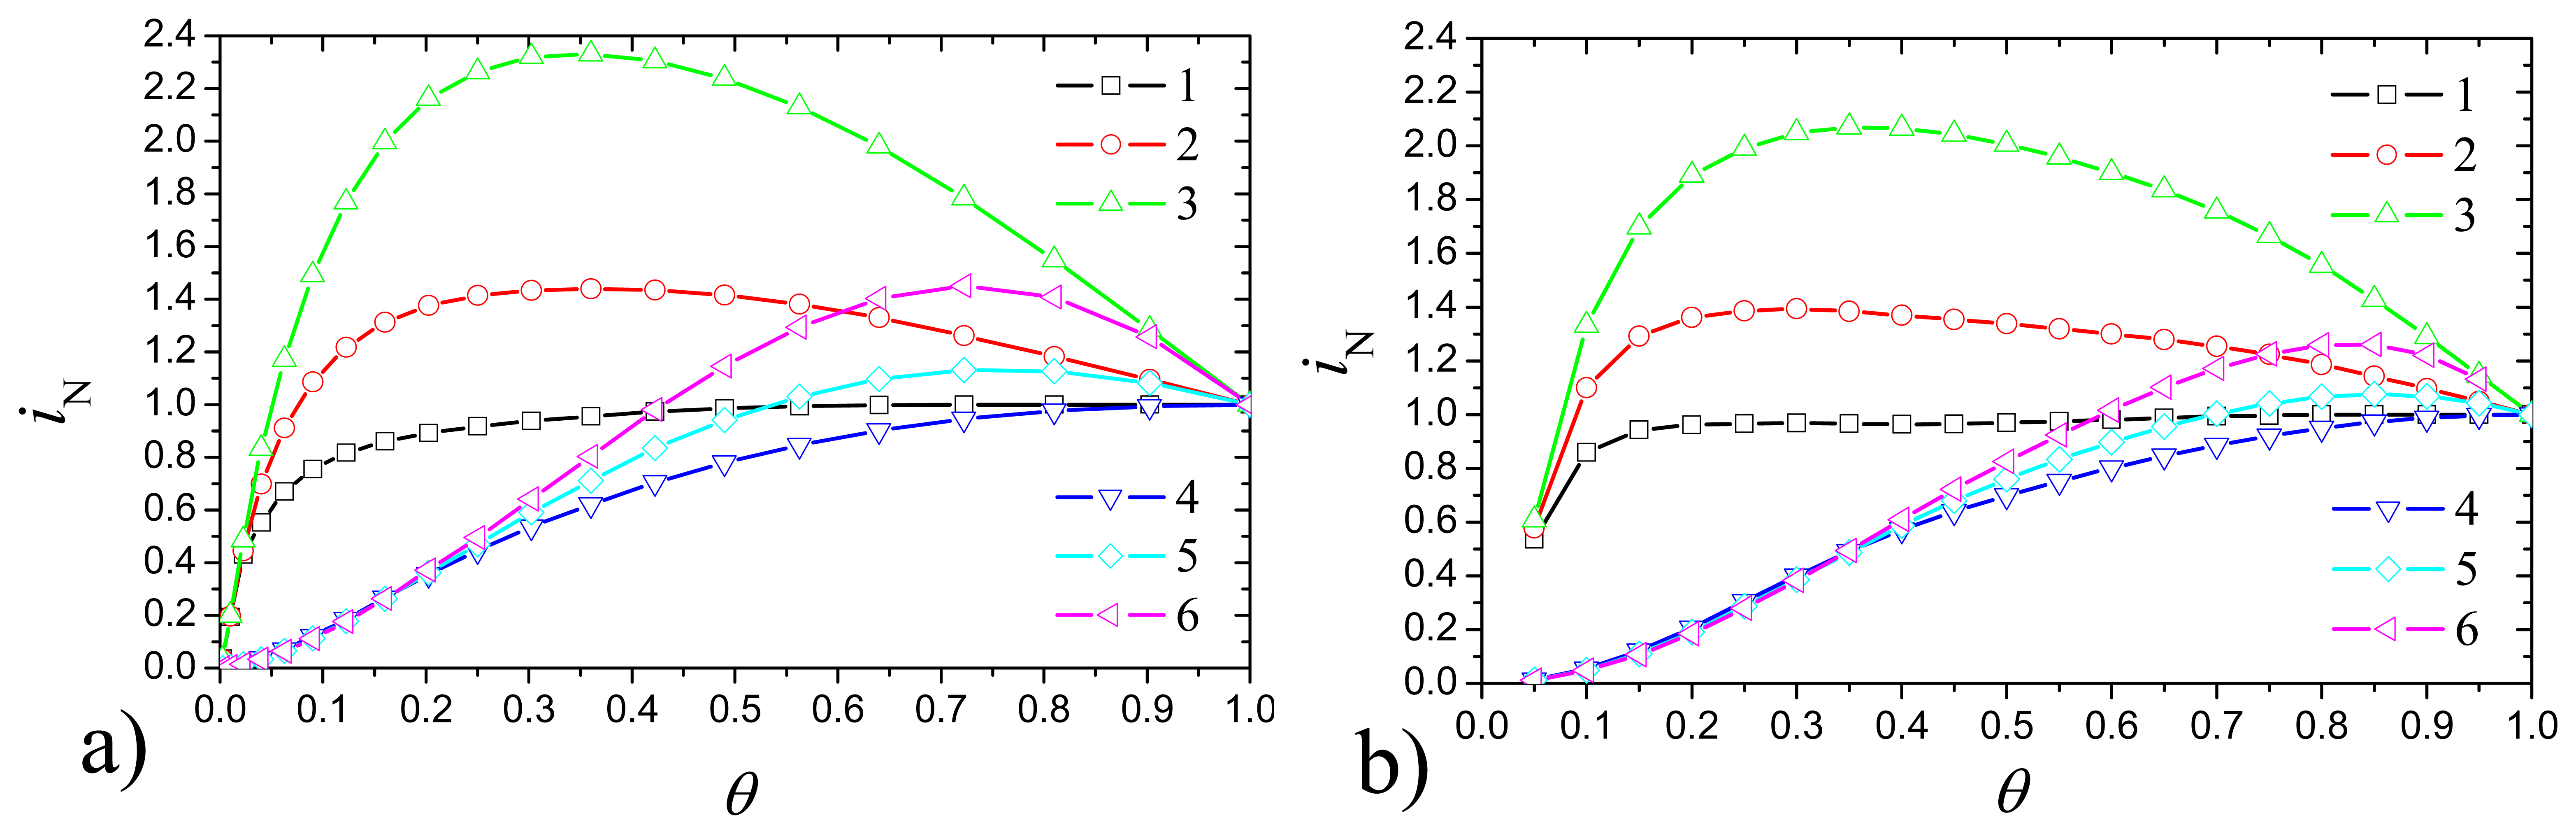
One can see from (9) and (10) that the biosensor current depends on the internal diffusion coefficient De as well as the external one Db. In calculations above, assuming the mass transport in bulk solution is faster than in enzyme, we used Db = 2De as defined in (12). This assumption is not firmly grounded [29]. Because of this, we calculated steady-state currents for two more values of the external diffusion coefficient Db: De and 4De. Fig. 4 shows the normalised steady-state current iN versus the degree θ of the electrode coverage at b = c = 0.1 mm, d = c + 0.02 mm, S0 = 20 μM, and two maximal enzymatic rates Vmax: 10, 1000 μM/s. Fig. 4 shows the valuable influence of the external diffusion coefficient Db on the biosensor response. The non-monotony of the normalised steady-state current is observed at Db > De only. The higher the coefficient of the external diffusion is the higher the amplification of the signal is observed due the suitable geometry of the microreactors. The biosensor based on an array of microreactors can generate higher steady-state current than the corresponding membrane one only if it operates in bulk solution having diffusion coefficient higher than the diffusion coefficient in the enzyme. Since the higher maximal enzymatic rate influences the higher diffusion modulus σ2, the effect of the signal amplification is more notable at Vmax of 1 mM/s rather than at Vmax = 10 μM/s.
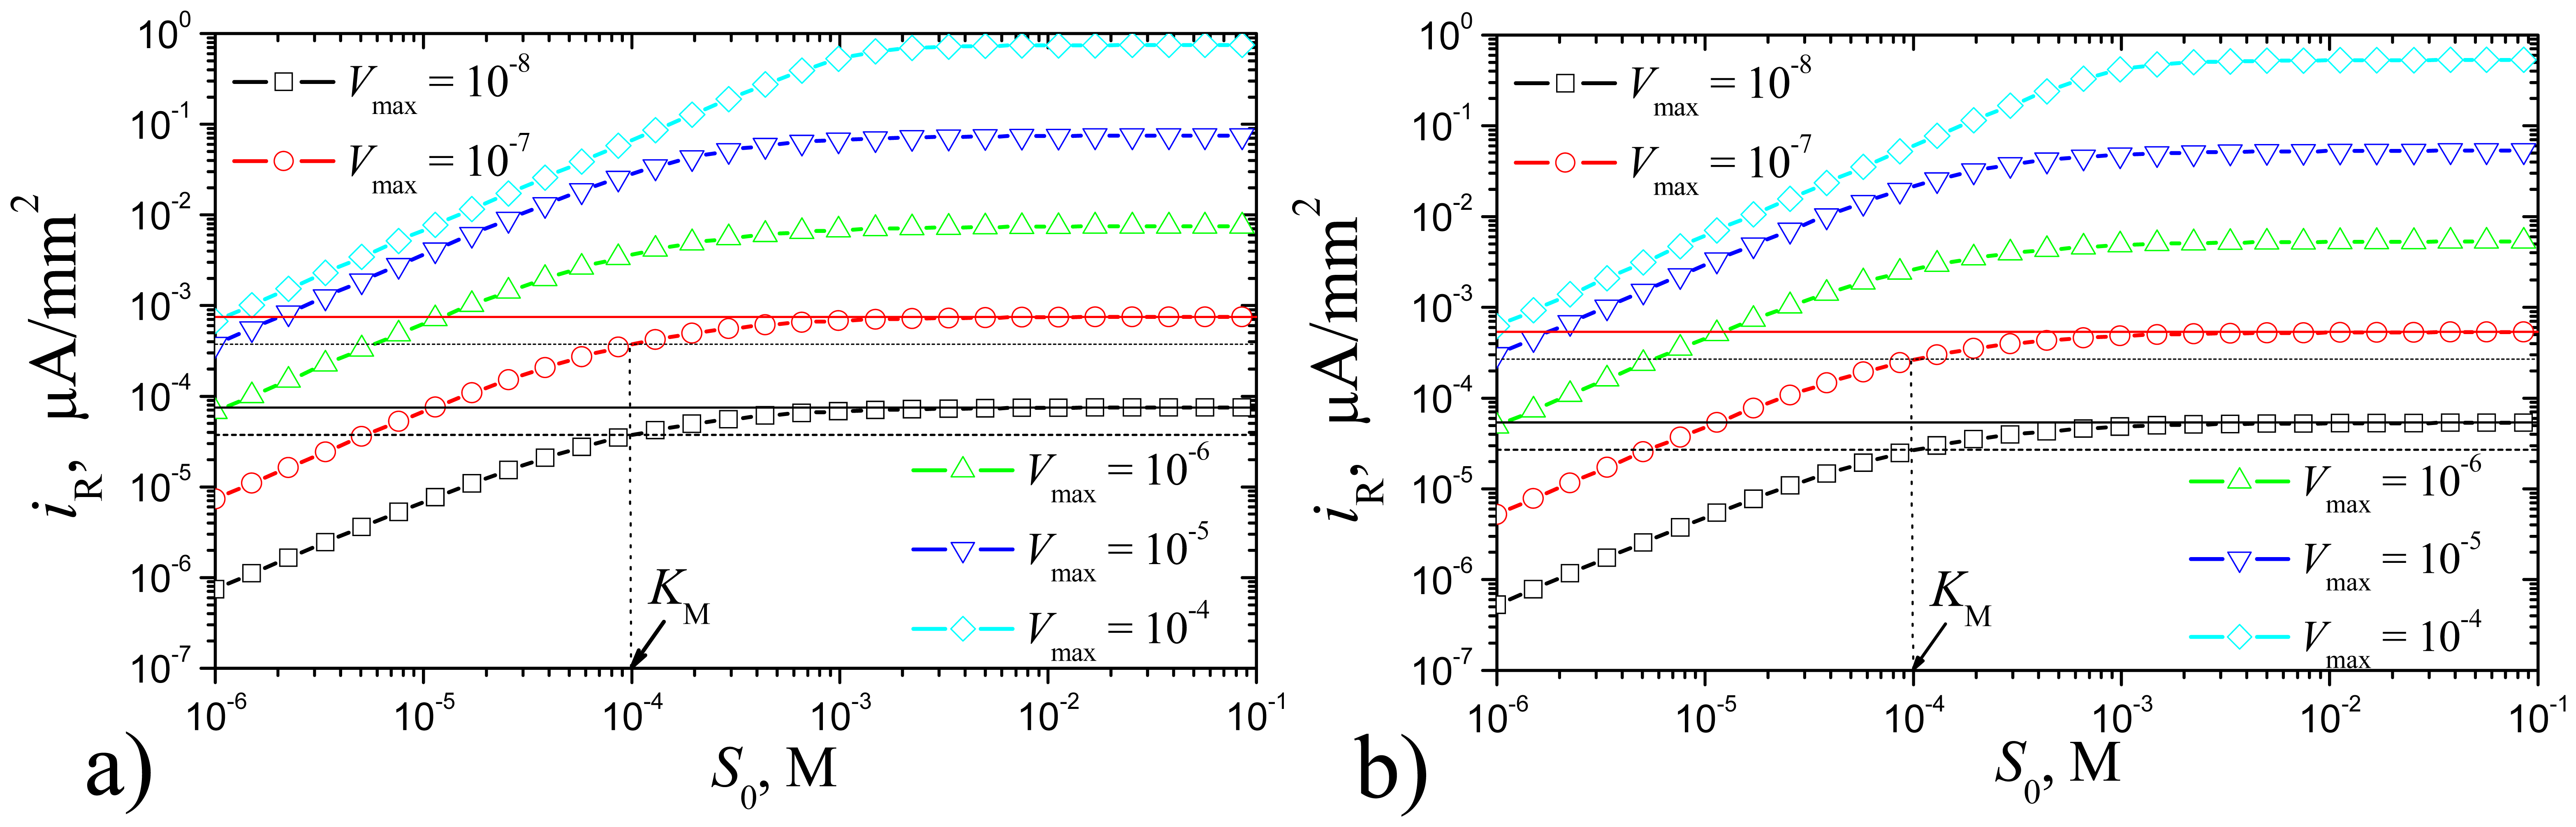
Using computer simulation we have investigated the dependence of the steady-state biosensor current as well as biosensor response time on the substrate concentration S0. The investigation was carried out at the following values of Vmax: 0.01, 0.1, 1, 10 and 100 μM/s to get results for a wide range of values of the maximal enzymatic rate. The size of microreactors (b = c = 0.1 mm, θ = 0.5) was chosen using the results presented in Fig. 3 so that the biosensor current is about to be the highest. Results of calculations are depicted in Figs. 5 and 6. As it is possible to notice in Fig. 5, the steady-state biosensor current iR is a monotonous increasing function of S0 at all values of Vmax. The shape of all curves is very similar to that observed in the case of membrane biosensors [2,3,26].
The Michaelis constant KM is known to be the substrate concentration at which the reaction rate is half its maximal value. Fig. 5 shows the effect of halving for two values of Vmax: 0.01 and 0.1 μM/s at which enzyme kinetics controls the biosensor response. The relative difference between half of the maximum of the steady-state current and another one at KM does not exceed 2% for both values of Vmax. Consequently, the effect of halving is valid for biosensors based on an array of microreactors, like for membrane biosensors.
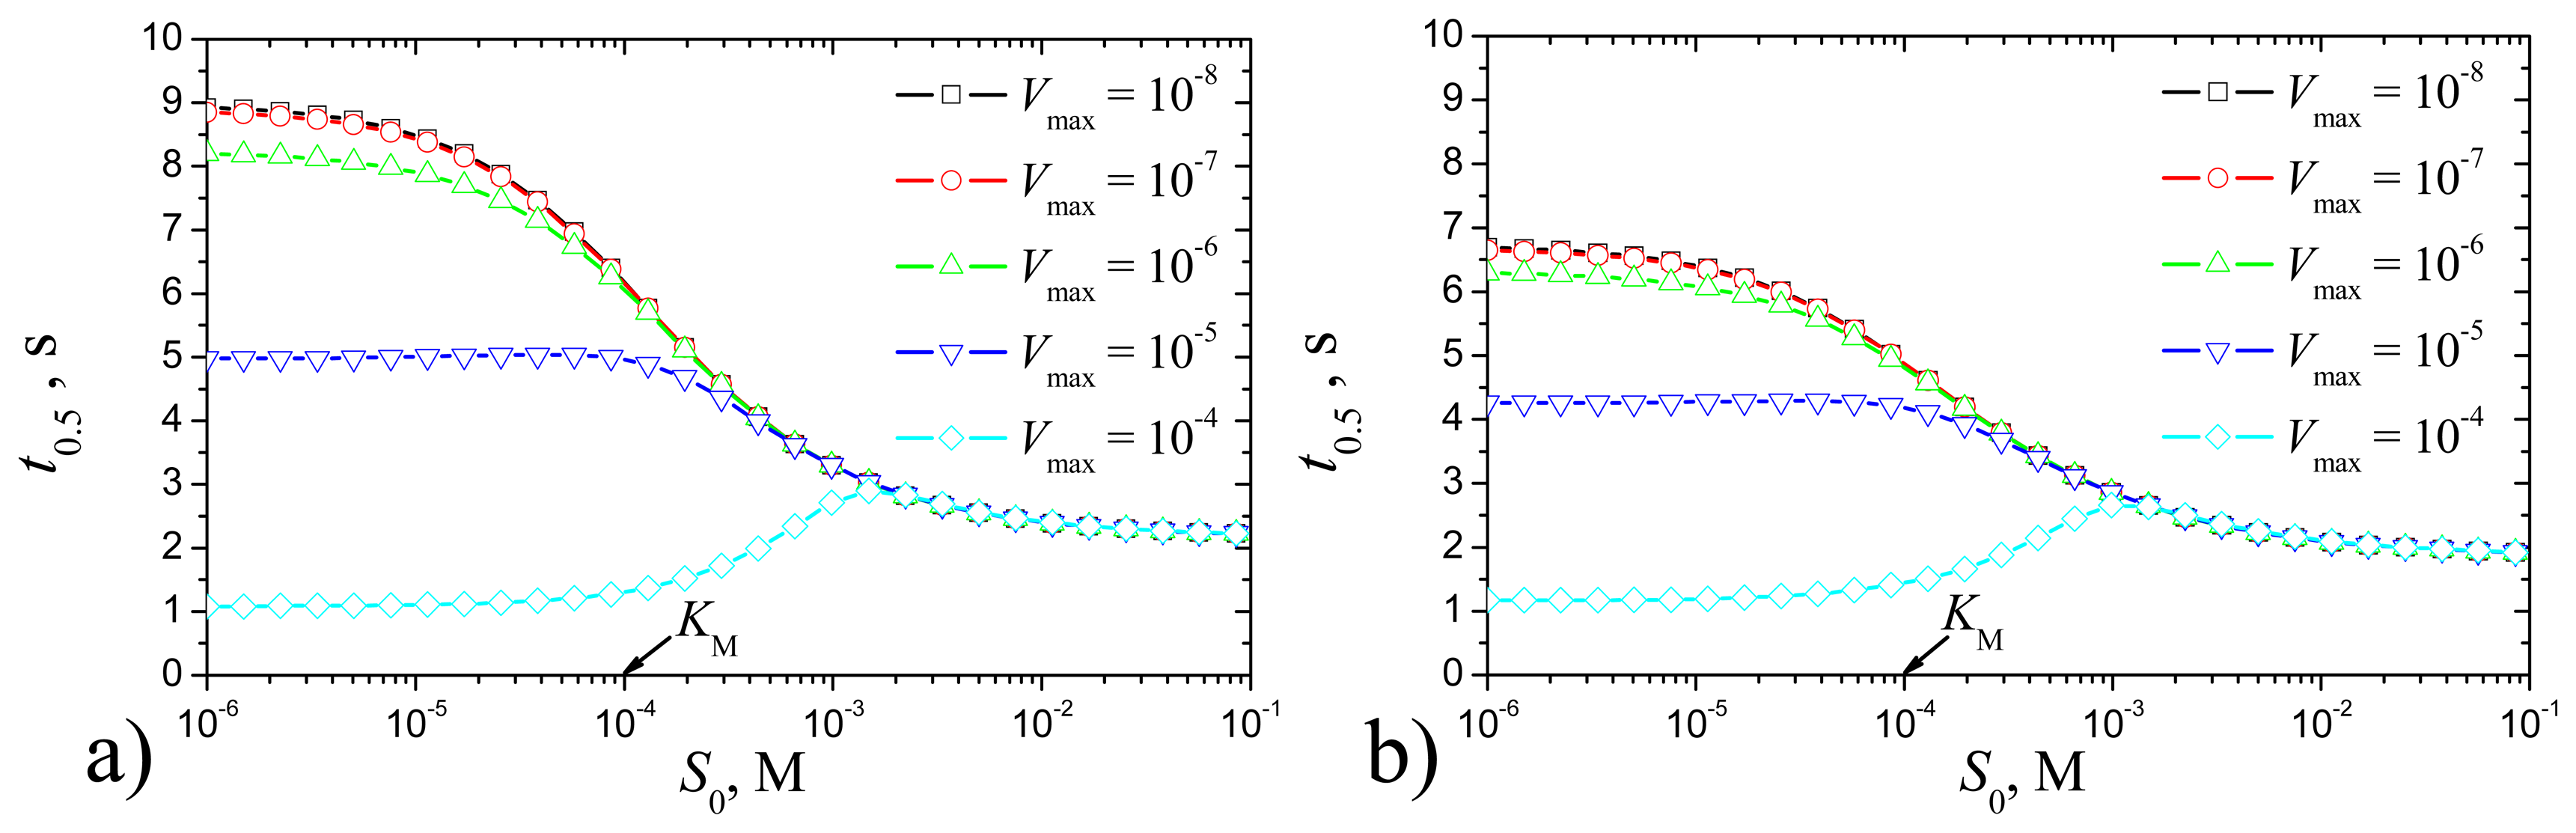
Fig. 6 shows the effect of substrate concentration S0 on the half time t0.5 of the steady state biosensor current. As it is possible to notice in Fig. 6, t0.5 represents a monotonous decreasing function of S0 at Vmax > 0.1 mM/s. At S0 being between 0.1 and 10 mM (between KM and 100 KM), a shoulder on the curve appears for Vmax = 0.1 mM/s. It seems possible that the shoulder on the curve arises because of very high Vmax. At substrate concentration S ≫ KM the reaction kinetics for S is a zero order throughout the microreactor, whereas for S ≪ KM the kinetics is a first order throughout. At intermediate values of S the kinetics changes from zero order to first order across the membrane. Similar effect was noticed during the oxidation of β-nicotinamide adenine dinucleotide (NADH) at poly(aniline)-coated electrodes [30]. Figs. 5 and 6 show that at high substrate concentration S0 > 10 mM (S0 > 100 KM), the catalytic reaction makes no notable effect on the behaviour of biosensors based on an array of microreactors.
Conclusions
The mathematical model (3)-(8) can be successfully used to investigate regularities of the response of biosensors based on an array of enzyme microreactors immobilised on a single electrode.
In the cases when the biosensor operates in bulk solution having the diffusion coefficient greater than another one in the enzyme, and the biosensor response is significantly under diffusion control, the steady-state current is a non-monotonous function of the degree θ of electrode coverage by the enzyme. Otherwise, the steady-state current is a monotonous increasing function of θ (Figs. 3, 4).
In the cases when the steady-state current is the non-monotonous function of the degree θ of electrode coverage, a biosensor based on an array of microreactors is able to generate a greater steady-state current than a corresponding membrane biosensor of the enzyme layer thickness being the same as the height of the microreactors (Figs. 3, 4). The denser microreactors are distributed on the electrode surface the higher the steady state current is generated. This feature of array biosensors can be applied in design of novel highly sensitive biosensors when the minimisation of the enzyme volume is of crucial importance. Selecting the geometry of microreactors allows minimising the volume of enzyme without loosing the sensitivity.
Work is now in progress to compare the simulations obtained for various microreactor geometries with similar experimental studies.
Acknowledgments
The work was partially supported by Lithuanian State Science and Studies Foundation, project No. C-03048.
References
- Clarc, L.C.; Loys, C. Electrode system for continuous monitoring in cardiovascular surgery. Ann. N.Y. Acad. Sci. 1962, 102, 29. [Google Scholar]
- Scheller, F.; Schubert, F. Biosensors; Vol. 7, Amsterdam; Elsevier, 1988. [Google Scholar]
- Turner, A.P.F.; Karube, I.; Wilson, G.S. Biosensors: Fundamentals and Applications; Oxford University Press: Oxford, 1987. [Google Scholar]
- Chaubey, A.; Malhotra, B.D. Mediated biosensors. Biosens. Bioelectron. 2002, 17, 441. [Google Scholar]
- Kulys, J.; Razumas, V. Bioamperometry; Mokslas: Vilnius, 1986; in Russian. [Google Scholar]
- Rogers, K.R. Biosensors for environmental applications. Biosens. Bioelectron. 1995, 10, 533. [Google Scholar]
- Wollenberger, U.; Lisdat, F.; Scheller, F.W. Frontiers in Biosensorics 2. Practical Applications; Birkhauser Verlag: Basel, 1997. [Google Scholar]
- Dirks, J. L. Diagnostic blood analysis using point-of-care technology. AACN Clin. Issues 1996, 7, 249. [Google Scholar]
- Devlin, J. P. (Ed.) High Throughput Screening; Marcel Dekker: New York, 1997.
- Barnaby, W. Biological weapons: an increasing threat. Med. Confl. Surviv. 1997, 13, 301. [Google Scholar]
- Smith, J. M.; Szathmary, E. On the likelihood of habitable worlds. Nature 1996, 384, 107. [Google Scholar]
- Kulys, J. The development of new analytical systems based on biocatalysts. Anal. Lett. 1981, 14, 377. [Google Scholar]
- Schulmeister, T. Mathematical treatment of concentration profiles and anodic current of amperometric enzyme electrodes with chemically-amplified response. Anal. Chim. Acta 1987, 201, 305. [Google Scholar]
- Bartlett, P.N.; Pratt, K.F.E. Modelling of processes in enzyme electrodes. Biosens. Bioelectron. 1993, 8, 451. [Google Scholar]
- Sorochinskii, V.V.; Kurganov, B.I. Steady–state kinetics of cyclic conversions of substrate in amperometric bienzyme sensors. Biosens. Bioelectron. 1996, 11, 225. [Google Scholar]
- Lyons, M.E.G.; Murphy, J.; Rebouillat, S. Theoretical analysis of time dependent diffusion, reaction and electromigration in membranes. J. Solid State Electrochem. 2000, 4, 458. [Google Scholar]
- Crank, J. The Mathematics of Diffusion, 2nd ed.; Clarendon Press: Oxford, 1975. [Google Scholar]
- Aris, R. The Mathematical Theory of Diffusion and Reaction in Permeable Catalysts. In The Theory of the Steady State; Clarendon Press: Oxford, 1975. [Google Scholar]
- Samarskii, A.A. The Theory of Difference Schemes; New York–Basel; Marcel Dekker, 2001. [Google Scholar]
- Gueshi, T.; Tokuda, K.; Matsuda, H. Voltammetry at partially covered electrodes. Part I. Chronopotentiometry and chronoamperometry at model electrodes. J. Electroanal. Chem. 1978, 89, 247. [Google Scholar]
- Deslous, C.; Gabrielli, C.; Keddam, M.; Khalil, A.; Rosset, R.; Trobollet, B.; Zidoune, M. Impedance techniques at partially blocked electrodes by scale deposition. Electrochim. Acta 1997, 42, 1219. [Google Scholar]
- Baronas, R.; Ivanauskas, F.; Kulys, J.; Sapagovas, M. Modelling of amperometric biosensors with rough surface of the enzyme membrane. J. Math. Chem. 2003, 34, 227. [Google Scholar]
- Wang, J. Analytical Electrochemistry, 2nd ed.; John Wiley & Sons: New-York, 2000. [Google Scholar]
- Britz, D. Digital Simulation in Electrochemistry, 2nd ed.; Springer-Verlag: Berlin, 1988. [Google Scholar]
- Baronas, R.; Ivanauskas, F.; Kulys, J. The influence of the enzyme membrane thickness on the response of amperometric biosensors. Sensors 2003, 3, 248. [Google Scholar]
- Baronas, R.; Ivanauskas, F.; Kulys, J.; Sapagovas, M. Computational modelling of a sensor based on an array of microreactors. Nonlinear Analysis: Modelling and Control 2004, 9, 203. [Google Scholar]
- Moreira, J.E.; Midkiff, S.P.; Gupta, M.; Artigas, P.V.; Snir, M.; Lawrence, R.D. Java programming for high performance numerical computing. IBM Systems Journal 2000, 39, 21. [Google Scholar]
- Carr, P.W.; Bowers, L.D. Immobilized Enzymes in Analytical and Clinical Chemistry: Fundamentals and Applications; John Wiley: New York, 1980. [Google Scholar]
- Chang, H.C.; Wu, C.C.; Ding, S.J.; Lin, I.S.; Sun, I.W. Measurement of diffusion and partition coefficients of ferrocyanide in protein-immobilized membranes. Anal. Chim. Acta 2005, 532, 209. [Google Scholar]
- Bartlett, P.N.; Birkin, P.R.; Wallace, E.N.K. Oxidation of β-nicotinamide adenine dinucleotide (NADH) at poly(aniline)-coated electrodes. J. Chem. Soc., Faraday Trans. 1997, 93, 1951. [Google Scholar]
Figure 1.
Principal structures of arrays of enzyme microreactors immobilised on a single electrode and the profile at Y-plane (c). The microreactors are modeled by identical cylinders (a) and by strips (b). The figure is not to scale.
Figure 1.
Principal structures of arrays of enzyme microreactors immobilised on a single electrode and the profile at Y-plane (c). The microreactors are modeled by identical cylinders (a) and by strips (b). The figure is not to scale.

Figure 2.
The dynamics of the biosensor current i at different values of a (mm) of the half-width of the microreactors in the cases of cylinders (a) and strips (b), b = 0.2, c = 0.1, d = 0.12 mm, Vmax = 100 μM/s, S0 = 20 μM/s.
Figure 2.
The dynamics of the biosensor current i at different values of a (mm) of the half-width of the microreactors in the cases of cylinders (a) and strips (b), b = 0.2, c = 0.1, d = 0.12 mm, Vmax = 100 μM/s, S0 = 20 μM/s.

Figure 3.
The normalised steady-state current iN versus the degree θ of electrode coverage at different values of the height c of the microreactors and the half distance b between centres of the adjacent microreactors in the cases of cylinders (a) and strips (b), d = c + 0.02 mm; other parameters are the same as in Fig. 2.

Figure 4.
The normalised steady-state current iN versus the degree θ of electrode coverage at three values of the external diffusion coefficient Db: De (1, 4), 2De (2, 5) and 4De (3, 6) two maximal enzymatic rates Vmax: 10 (4-6) and 1000 (1-3) μM/s in the cases of cylinders (a) and strips (b), b = c = 0.1 mm, d = c + 0.02 mm, S0 = 20 μM.

Figure 5.
The steady-state current iR versus the substrate concentration S0 at different values of the maximal enzymatic rates Vmax (M/s) in the cases of cylinders (a) and strips (b), b = 0.1 mm, θ = 0.5; other parameters are the same as in Fig. 2.
Figure 5.
The steady-state current iR versus the substrate concentration S0 at different values of the maximal enzymatic rates Vmax (M/s) in the cases of cylinders (a) and strips (b), b = 0.1 mm, θ = 0.5; other parameters are the same as in Fig. 2.

Figure 6.
The half time t0.5 of the steady-state biosensor response versus the substrate concentration S0 at different values of the maximal enzymatic rates Vmax (M/s) in the cases of cylinders (a) and strips (b); values of other parameters are the same as in Fig. 5.
Figure 6.
The half time t0.5 of the steady-state biosensor response versus the substrate concentration S0 at different values of the maximal enzymatic rates Vmax (M/s) in the cases of cylinders (a) and strips (b); values of other parameters are the same as in Fig. 5.

© 2006 by MDPI ( http://www.mdpi.org). Reproduction is permitted for non-commercial purposes.
Share and Cite
MDPI and ACS Style
Baronas, R.; Ivanauskas, F.; Kulys, J. Mathematical Modeling of Biosensors Based on an Array of Enzyme Microreactors. Sensors 2006, 6, 453-465. https://doi.org/10.3390/s6040453
AMA Style
Baronas R, Ivanauskas F, Kulys J. Mathematical Modeling of Biosensors Based on an Array of Enzyme Microreactors. Sensors. 2006; 6(4):453-465. https://doi.org/10.3390/s6040453
Chicago/Turabian StyleBaronas, Romas, Feliksas Ivanauskas, and Juozas Kulys. 2006. "Mathematical Modeling of Biosensors Based on an Array of Enzyme Microreactors" Sensors 6, no. 4: 453-465. https://doi.org/10.3390/s6040453