1. Introduction
Real-time information of the composition and concentration of dissolved organic matters (DOMs) in water is highly demanded in many key areas such as environmental management, public health, and industrial process control. Most existing approaches for DOM detection are based on the laboratory analyses of discrete samples. Chemical analyses of DOM at the molecular level have typically involved degradation (e.g., acid or alkaline hydrolyses, oxidation or pyrolysis) for the release of compounds at monomer level that can be determined by colorimetry, or identified and quantified after chromatographic separation [
1,
2]. High performance liquid chromatography (HPLC) [
3] and size-exclusion chromatography [
4] are among the most commonly used methods to separate the complex dissolved organic matters. Quantification of the DOMs is commonly performed by various spectrometry methods such as mass spectrometry [
5], plasma atomic emission spectrometry [
6], and membrane introduction mass spectrometry [
7]. Although chromatography-spectrometry methods are specific and generally provide the measurement sensitivity in the parts-per-billion (ppb) level, they are not suitable for in-situ and real-time monitoring because these sophisticated and expensive instruments require costly and time-consuming sample collection, transportation, preparation and complicated laboratory operations.
Low-cost chemical sensors capable of continuous and in situ monitoring of DOMs in water have attracted tremendous interests in recent years. Although they do not have sensitivity and specificity as high as most analytical instruments, their capability of providing timely information is highly desired for the purposes of pre-warning and real-time process controls. Electrical and optical sensors represent the two important categories of chemical sensors that have shown promising potential for in situ detection of DOMs [
8-
10]. Compared to electrical sensors, optical sensors generally offer the advantages of immunity to electromagnetic interference (EMI), large bandwidth, passiveness, and intrinsic safety.
Several successful demonstrations of electrical sensors for detection of DOMs in water have been reported, such as the polymer-absorption chemiresistor-based microsensor [
11], the surface acoustic wave (SAW) sensor [
12,
13], and the polyphenol-coated carbon electrode voltammetric sensor [
14]. Most of the reported electrical sensors have shown certain levels of specificity by employing specially designed polymers to selectively interact with the target analytes. However, some polymers react to water molecules and dissolved ions, which presents uncertain stability for long-term operations.
Optically induced fluorescence is a well-known tool for the analysis of DOMs, oil pollution, and phytoplankton in seawater [
15]. The induced fluorescence method has been shown to be sensitive and highly selective. By examining the spectral signatures of the excited fluorescence, various organic compounds in water were identified to the ppm level [
16,
17]. However, very sophisticated systems were used to excite the fluorescence as well as to process the data. In addition, the particulate matters in water could contaminate the induced fluorescence signal.
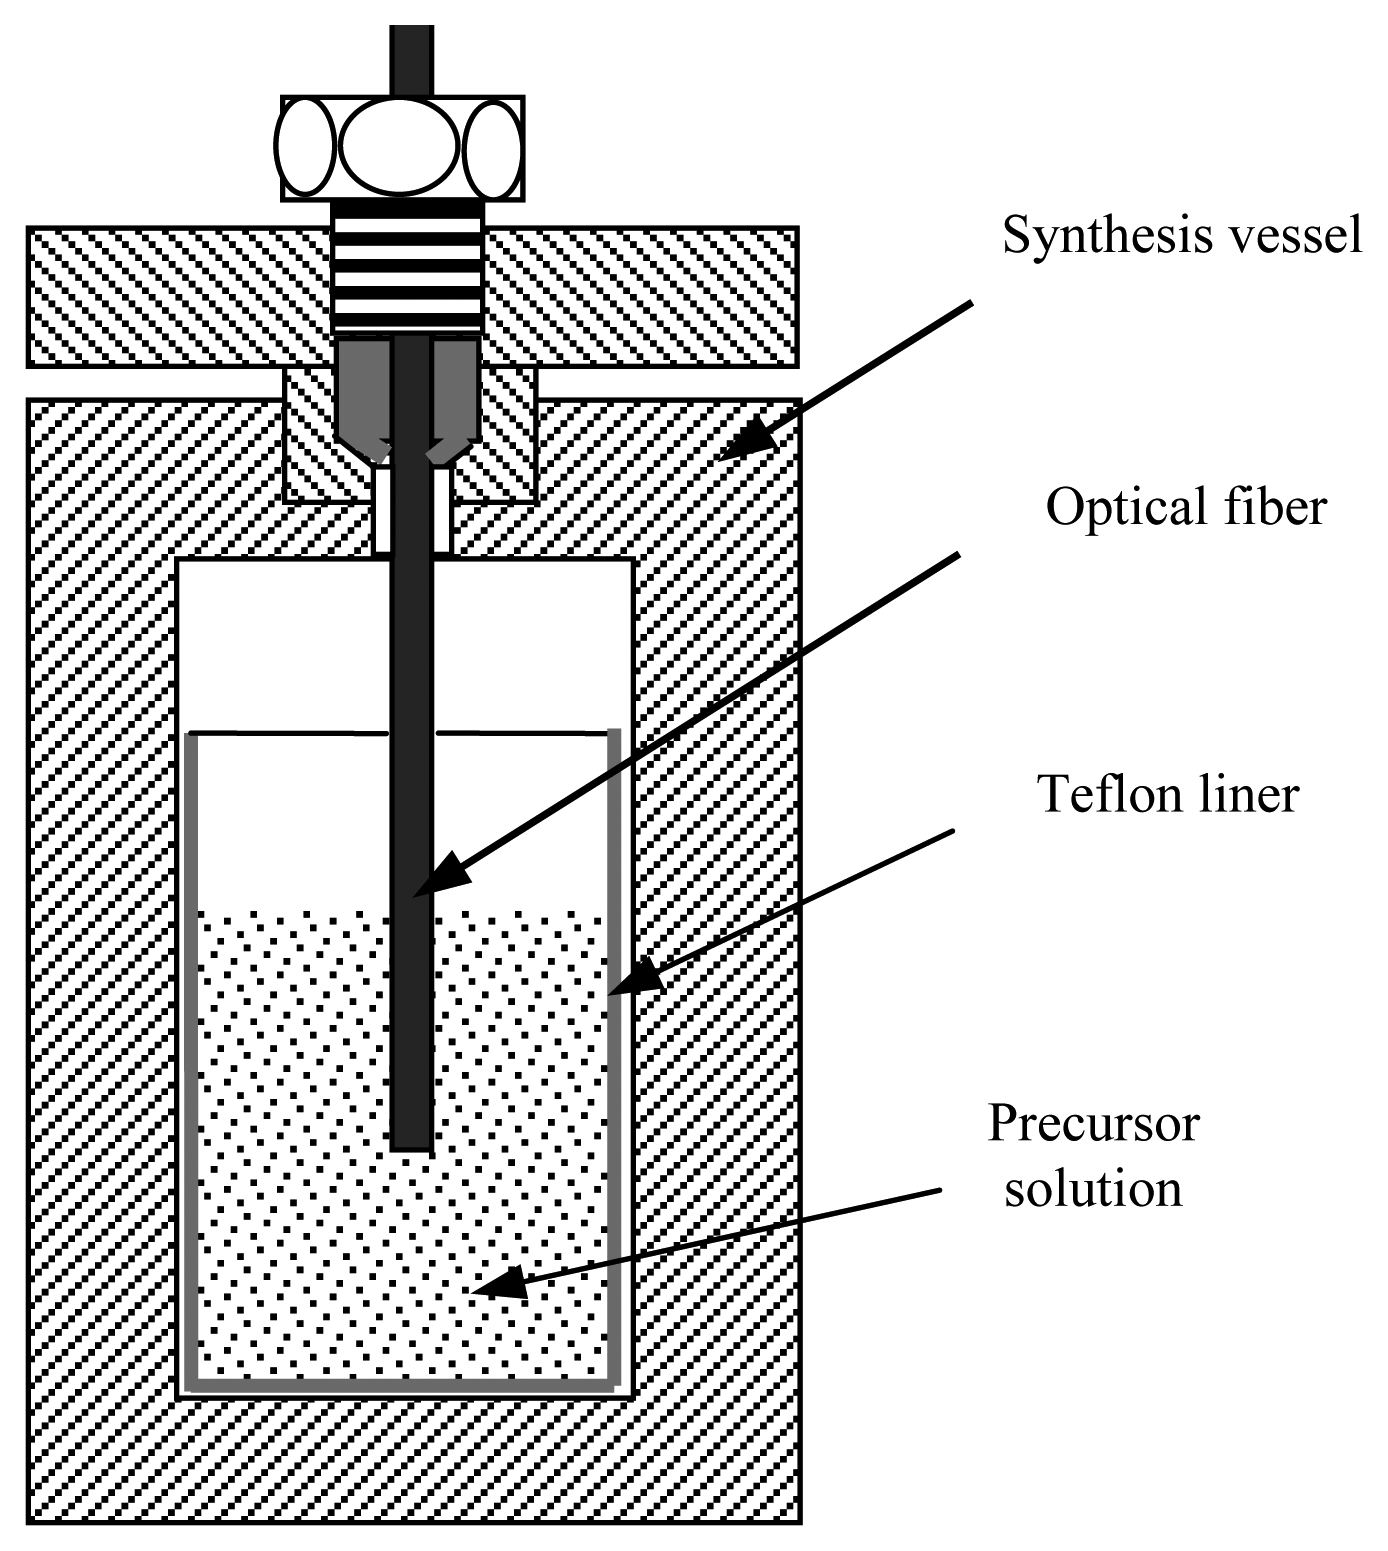
Recent advancements in nanomaterials and thin film technologies have fostered new opportunities to develop miniaturized and robust chemical sensors with enhanced sensitivity and selectivity. Nanoporous crystalline zeolites are such nanomaterials with unique combination of chemical and optical properties suitable for optical chemical sensor development. With uniform subnanometer- or nanometer-scale pores and very large surface-to-mass ratios, zeolites can selectively adsorb organic molecules dissolved in water, resulting optical property changes that can be interrogated by various optical methods.
Recently, we successfully synthesized high-quality MFI zeolite thin films on standard single mode telecommunication optical fibers using the in-situ hydrothermal crystallization method. By monitoring the reflectance change from the zeolite-coated fiber tip as a function of the ananlyte concentration, we demonstrated that the zeolite-coated fiber could be used for sensitive detection of chemicals [
18,
19]. We also experimentally studied the adsorption-caused refractive index change using 2-propanol vapor carried by N2 gas. It was found that the refractive index-concentration dependence resembled the adsorption isotherm [
20]. In this paper, we describe a fiber optic intrinsic Fabry-Perot interferemetric (IFPI) sensor made by fine-polishing a thin layer of zeolite film synthesized on the fiber endface. We focus our experimental investigations on using such sensor for detection of DOMs in water.
3. Experiments
3.1. Experimental setup
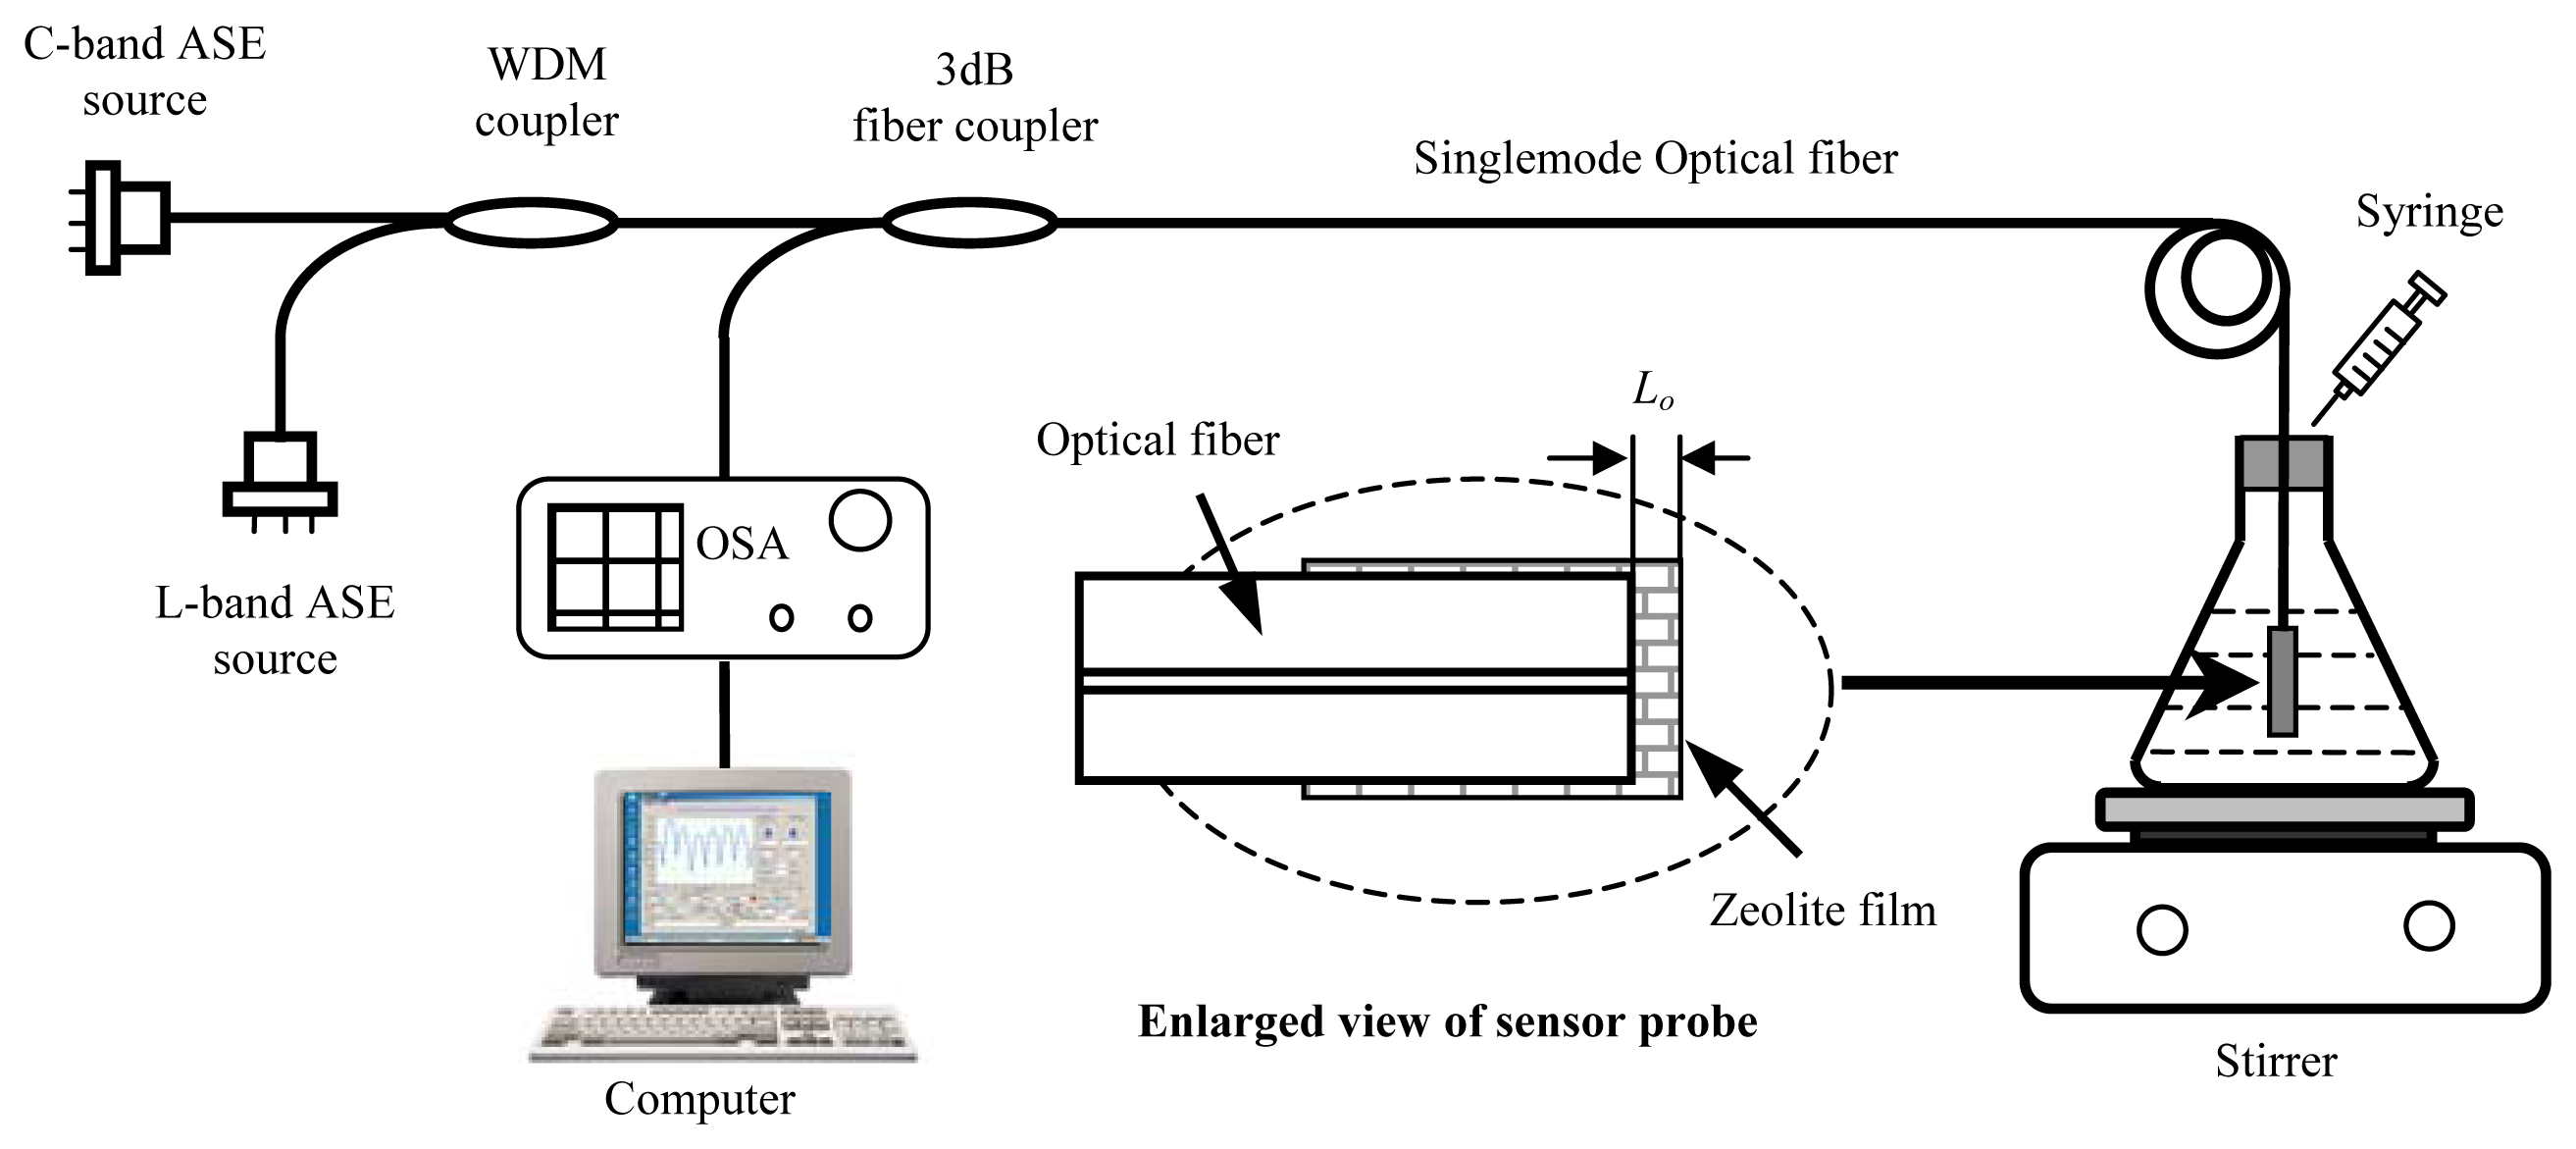
Fig. 3 schematically shows the system configuration for sensor interrogation and testing. The C-band and L-band amplified spontaneous emission (ASE) spectra of Erbium doped fibers were multiplexed to produce a broadband source, which covered the spectral range from 1526-1606nm. The optical interference signal generated by the two reflections from the fiber-zeolite (R1) and zeolite- ambient (R2) interfaces (enlarged view of the sensor probe in
Fig. 3) was detected and recorded by an optical spectrum analyzer (OSA) (Ando 6137B). The interferogram was then analyzed by a host computer to calculate the optical thickness of the zeolite coating. The OSA was configured to have 1nm spectral resolution, 501 sample points, and 10 times average for all experiments.
3.2. Interferogram processing
Because of the low reflectivity of the fiber-zeolite and zeolite-ambient interfaces, multiple reflections have negligible contributions to the optical interference. The zeolite thin film coated on cleaved fiber endface can thus be modeled as a low finesse IFPI, where the two beam optical interference model is used. The interference signal (
I) is given by [
21]:
where,
I1 and
I2 are the light intensities reflected from the fiber-zeolite and zeolite-ambient interfaces, respectively;
φ0 is the initial phase of the interferometer;
Lo is the optical thickness of the zeolite thin film which is the product of the physical thickness and the refractive index of the film;
λ is the vacuum optical wavelength;
γ is the fringe visibility of the interference signal.
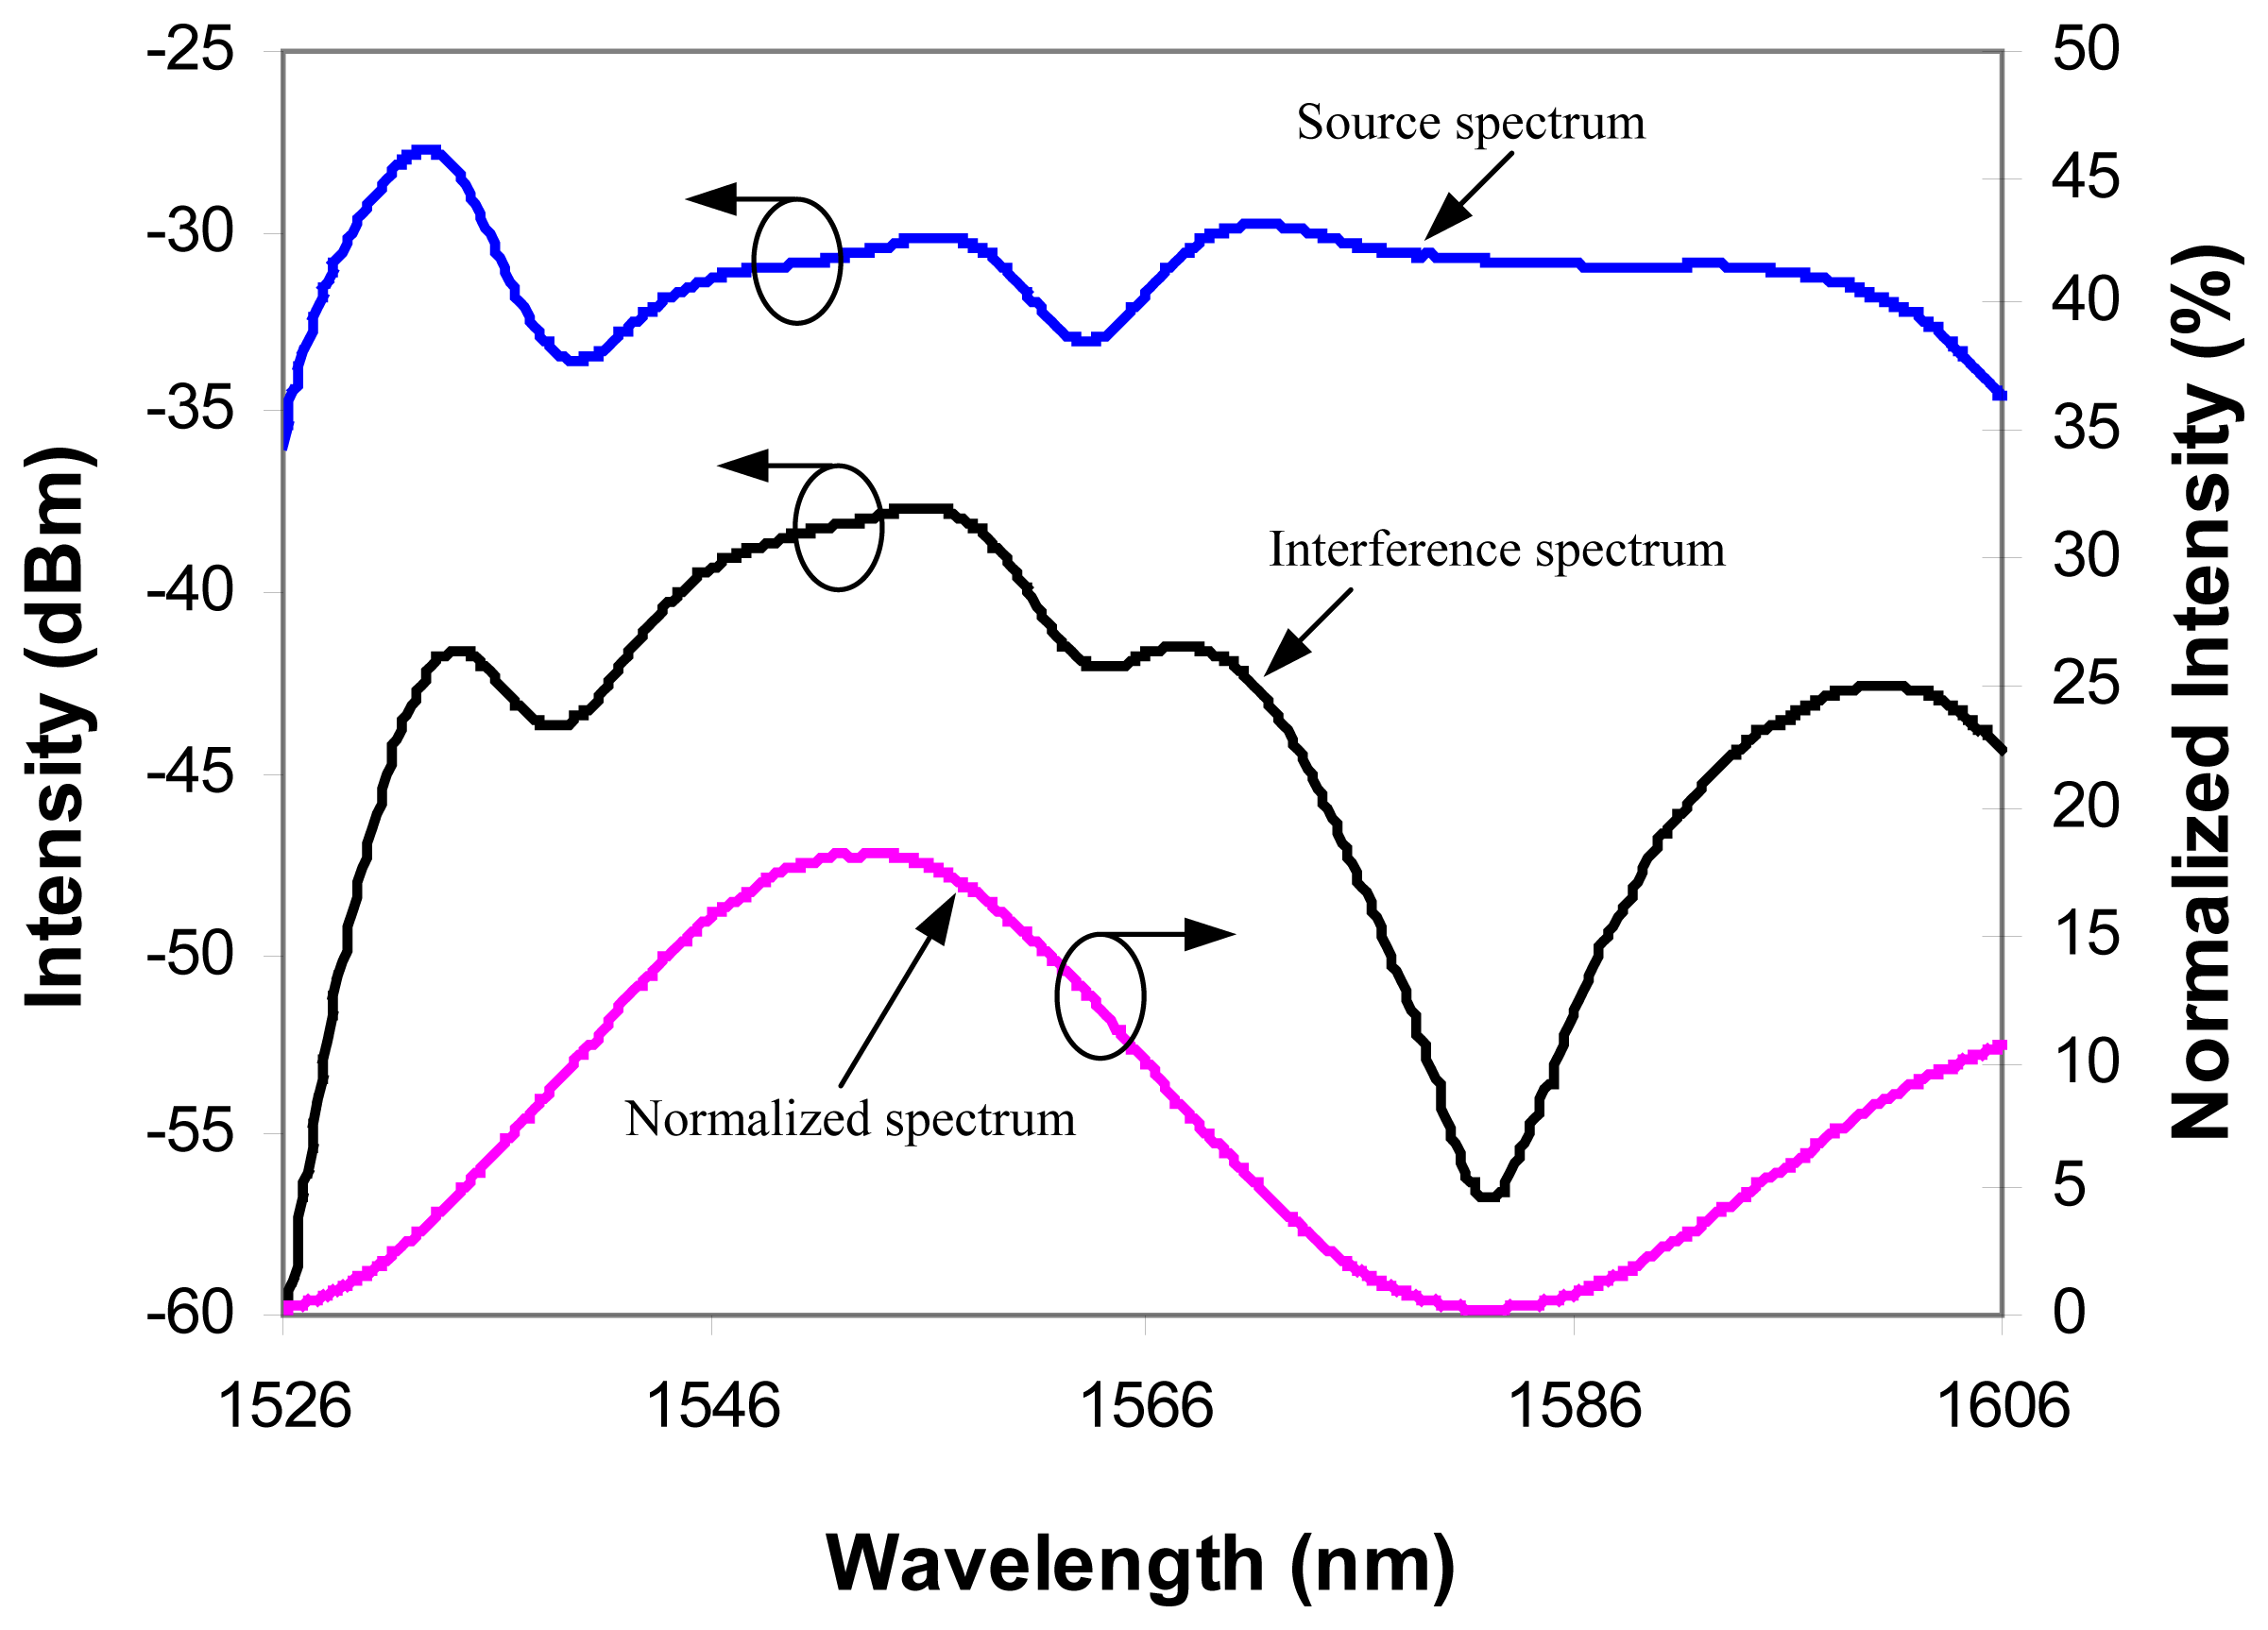
The interference spectrum given by
Equation 1 depends on the source spectrum. This source spectrum dependence can distort the interference signal and cause errors. To eliminate the source spectrum modulation, the interferogram was normalized using the reflection spectrum from a cleaved fiber endface, taken prior to splicing the sensor to the system.
Fig.4 shows the source spectrum, the typical interferogram, and the normalized interferogram. After normalization, the sinusoidal interference signal was well recovered.
The normalized interferogram was then analyzed to find the optical thickness of the zeolite coating using the method described in reference 22. The interference order was first computed based on the spectral separation of two adjacent interference minima or maxima so that the phase shift larger than 2π was resolved. Once the interference order was determined, the spectral shift of the corresponding minimum or maximum was used to calculate the phase shift within 2π. The results from these two calculations were then combined to determine the optical thickness of the zeolite thin film. The previous studies have shown that the algorithm achieved high resolution and avoided the phase ambiguity problem
To further improve the accuracy of interferogram processing, the interference signal as a function of the optical frequency was least-square fitted using the 4th order polynomial equation in the vicinity of the interference maxima and minima. The peak and valley frequencies used in the final calculation were taken as the centroids of the fitted curves.
3.3. Sensor tests
The experimental setup for sensor test is also illustrated in
Fig. 3. The zeolite-fiber sensor probe was immersed in DI water contained in a flask. Three types of organics of different molecular sizes, density, polarity, and solubility in water were used to test the sensor. These include methanol (99.9%, Fisher Scientific), 2-propanol (99.9%, Fisher Scientific), and toluene (>99.9%, Sigma).
The activated zeolite has a very large surface-to-mass ratio. It adsorbs molecules from the ambient environment. It is desired that these unknown molecules be removed prior to applying the sensor to chemical detection. The preoccupying molecules can be removed by heating the zeolite in air to a relatively high temperature (>350°C) so that the adsorbed molecules will gain enough energy to exit the zeolite pores. This process is referred to as sensor regeneration.
The sensor regeneration in our experiments was performed by heating the sensor using a tubular furnace. The sensor was placed in a stainless steel tube supplied with a N2/O2 gas flow during regeneration. The N2/O2 molar ratio was selected to be 4:1 to simulate the air composition. The sensor probe was heated to 400°C at a rate of 5°C per minute, maintaining at 400°C for 1 hour, and then cooling down to room temperature. The slow regeneration process was mainly limited by the heating and cooling rates of the large tubular furnace used in our laboratory. Because the sensor can be completely regenerated in the air, in field applications, a small resistive heater can be designed for on site sensor regeneration. The field regeneration can be much faster than that in the laboratory because the small resistive heater can be heated much faster than the tubular furnace.
After regeneration, the sensor was immediately immersed in DI water and stabilized for about 1 hour. The sensor interferogram in DI water was then scanned and the optical thickness was computed as the starting point. The concentration of organic analyte in water was varied from low to high by injecting an organic solution of known concentration under constant stirring. The flask was sealed to avoid evaporation of the solution during the experiment. All the experiments were conducted at room temperature (21°C) under local atmospheric pressure (0.87bar). After injection, the OSA scanned the interference spectrum every minute and computed the difference between two successive interferograms. The equilibrium state was considered reached after the difference was within 0.01dB. In general, the time to equilibrium depended on the size of the target molecule. As reported in our previous research [
19], the smaller the molecule size, the faster the sensor response. The equilibrium time of methanol and 2-propanol detections was about several seconds and that for toluene was about 30 minutes.
4. Results and discussions
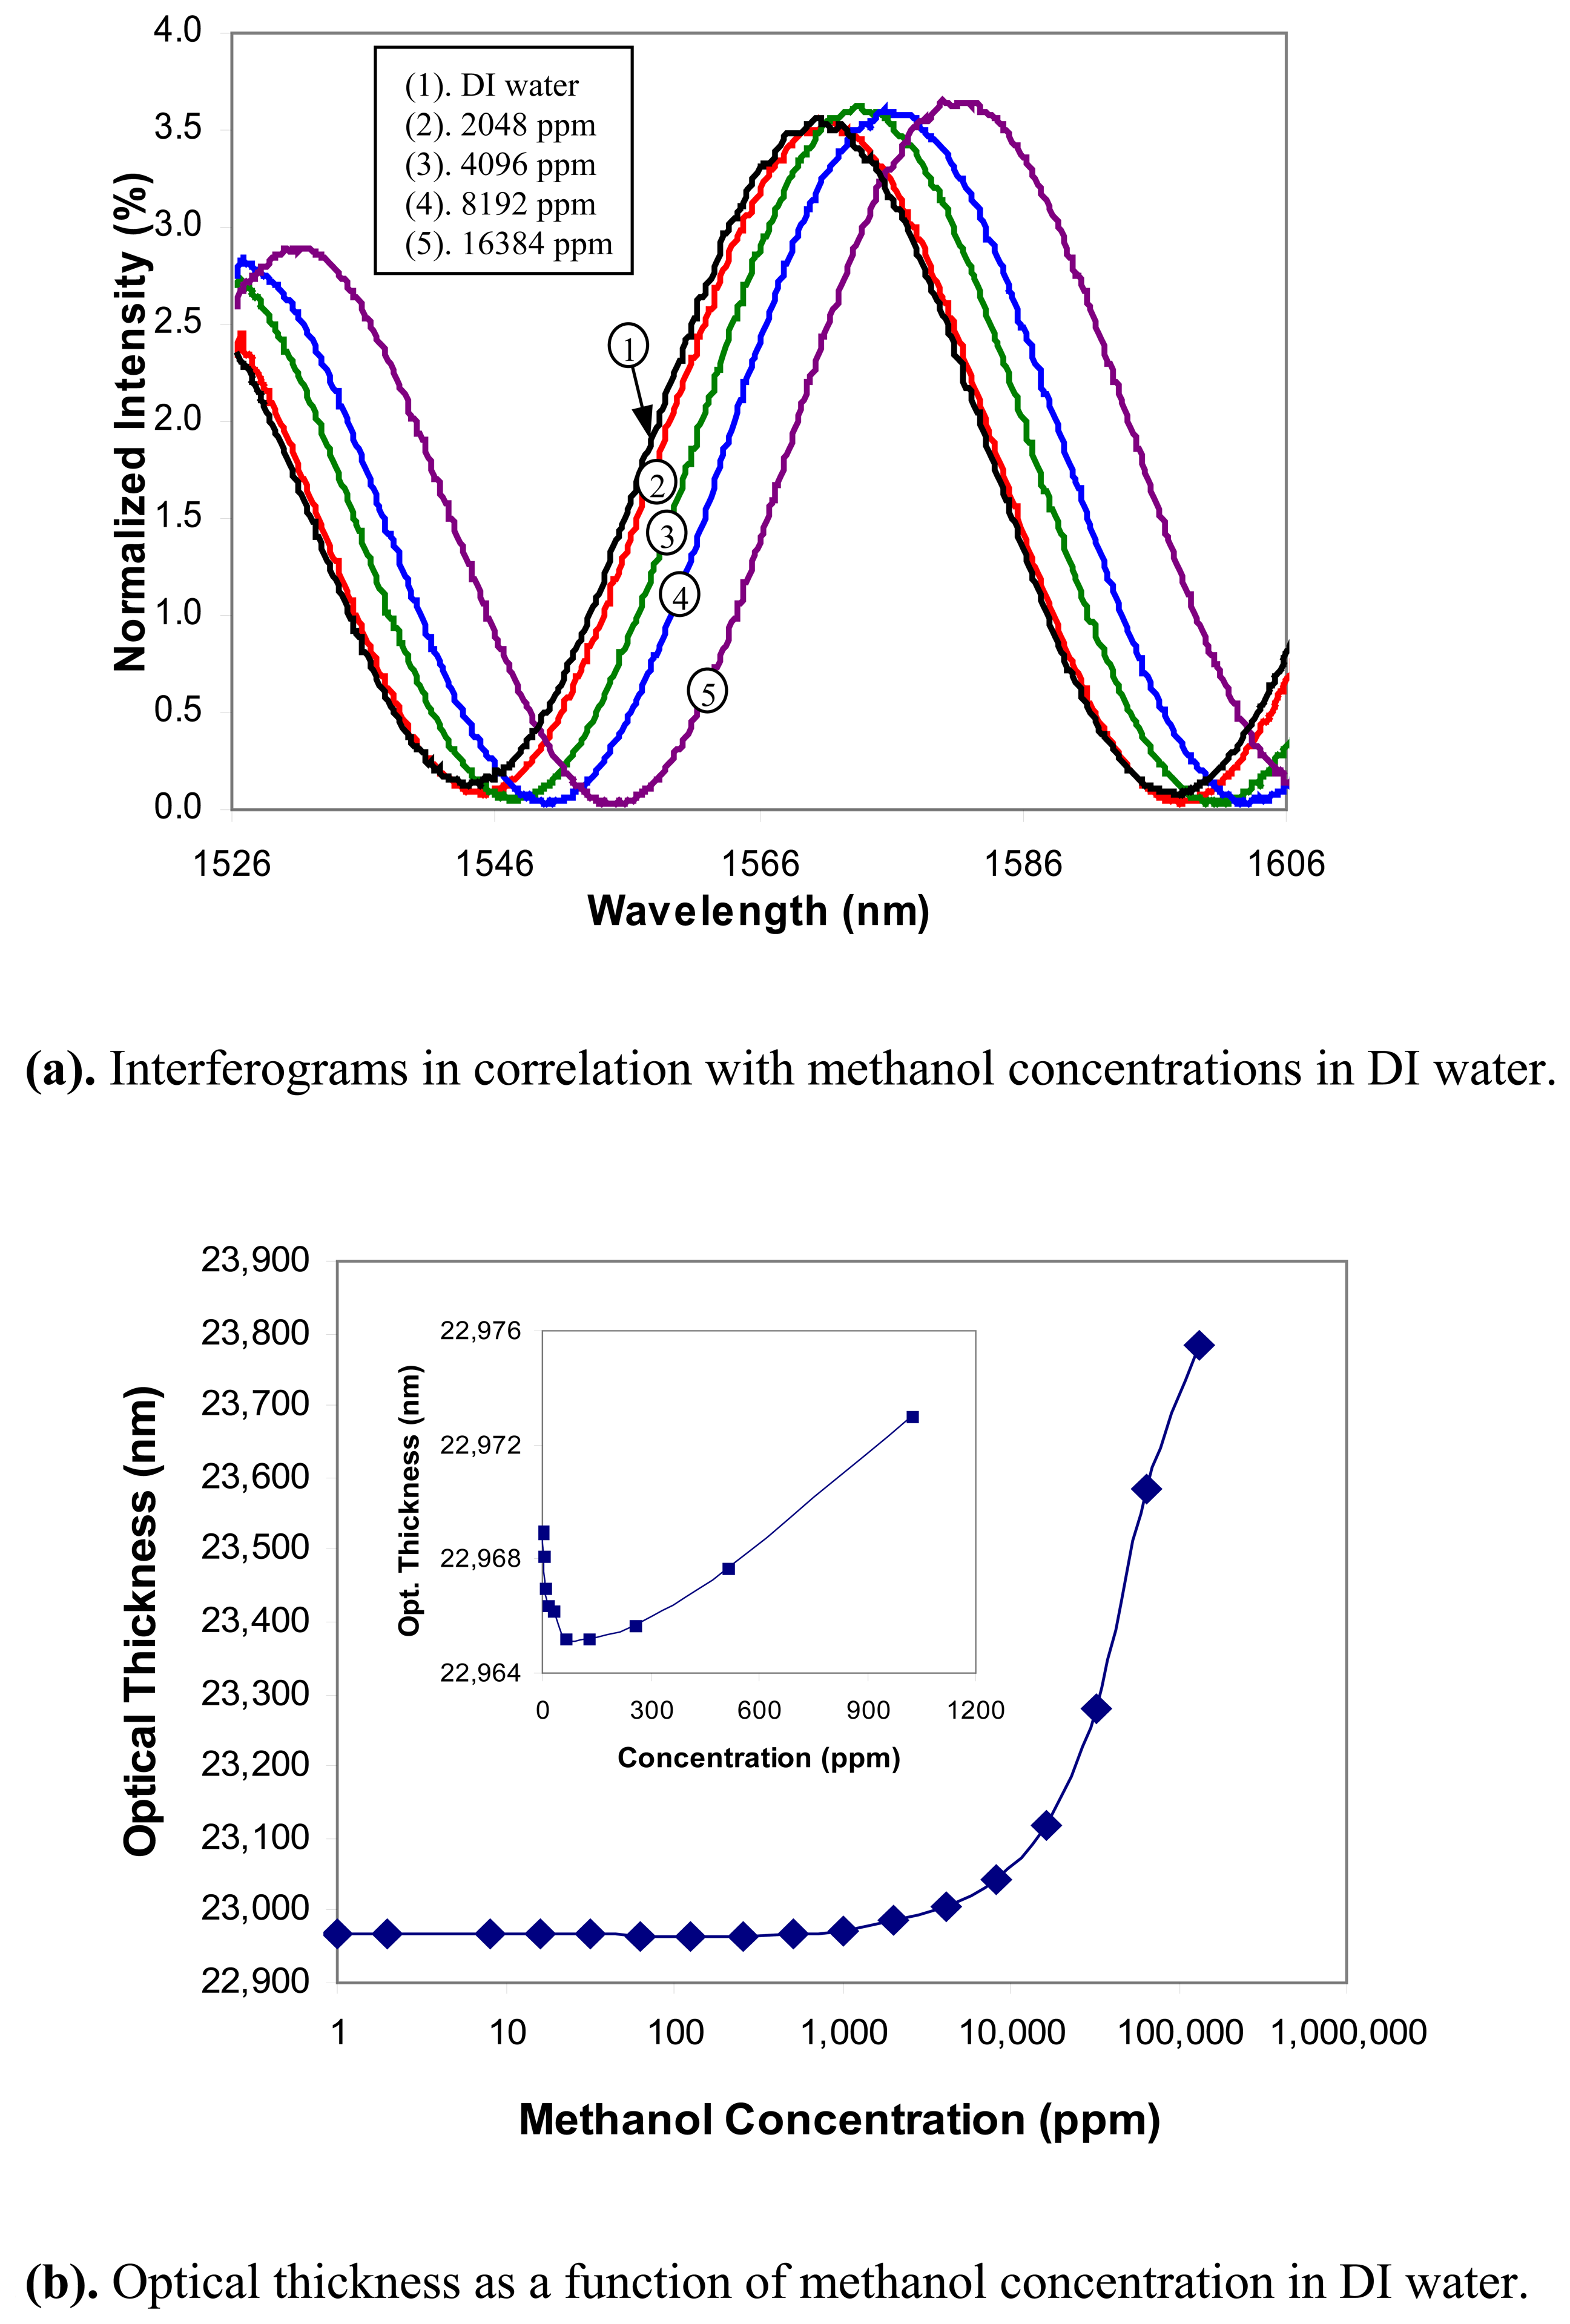
Methanol: The concentration of methanol in DI water was varied from 1ppm to 13.1% by volume. The interferograms in correlation with the methanol concentrations are shown in
Fig. 5(a), in which only a few interferograms are shown at several selected concentration levels for a better visibility. The computed optical thickness of the zeolite thin film is shown in
Fig. 5(b) as a function of the methanol concentration, where the concentration is given on a logarithmic scale. The sensor response to the low concentration levels is shown in the insert of
Fig. 5(b) in a linear scale. The optical thickness of the zeolite film first dropped slightly as the methanol concentration increased. After the concentration reached about 1000ppm, the optical thickness increased with increasing methanol concentration. The curious phenomenon of shrinking in optical thickness at the low concentration level is not quite understood and is being currently investigated by studying the adsorption behavior. Based on the experimental results, we concluded that the sensor has a detection limit of about 1000ppm for methanol in water.
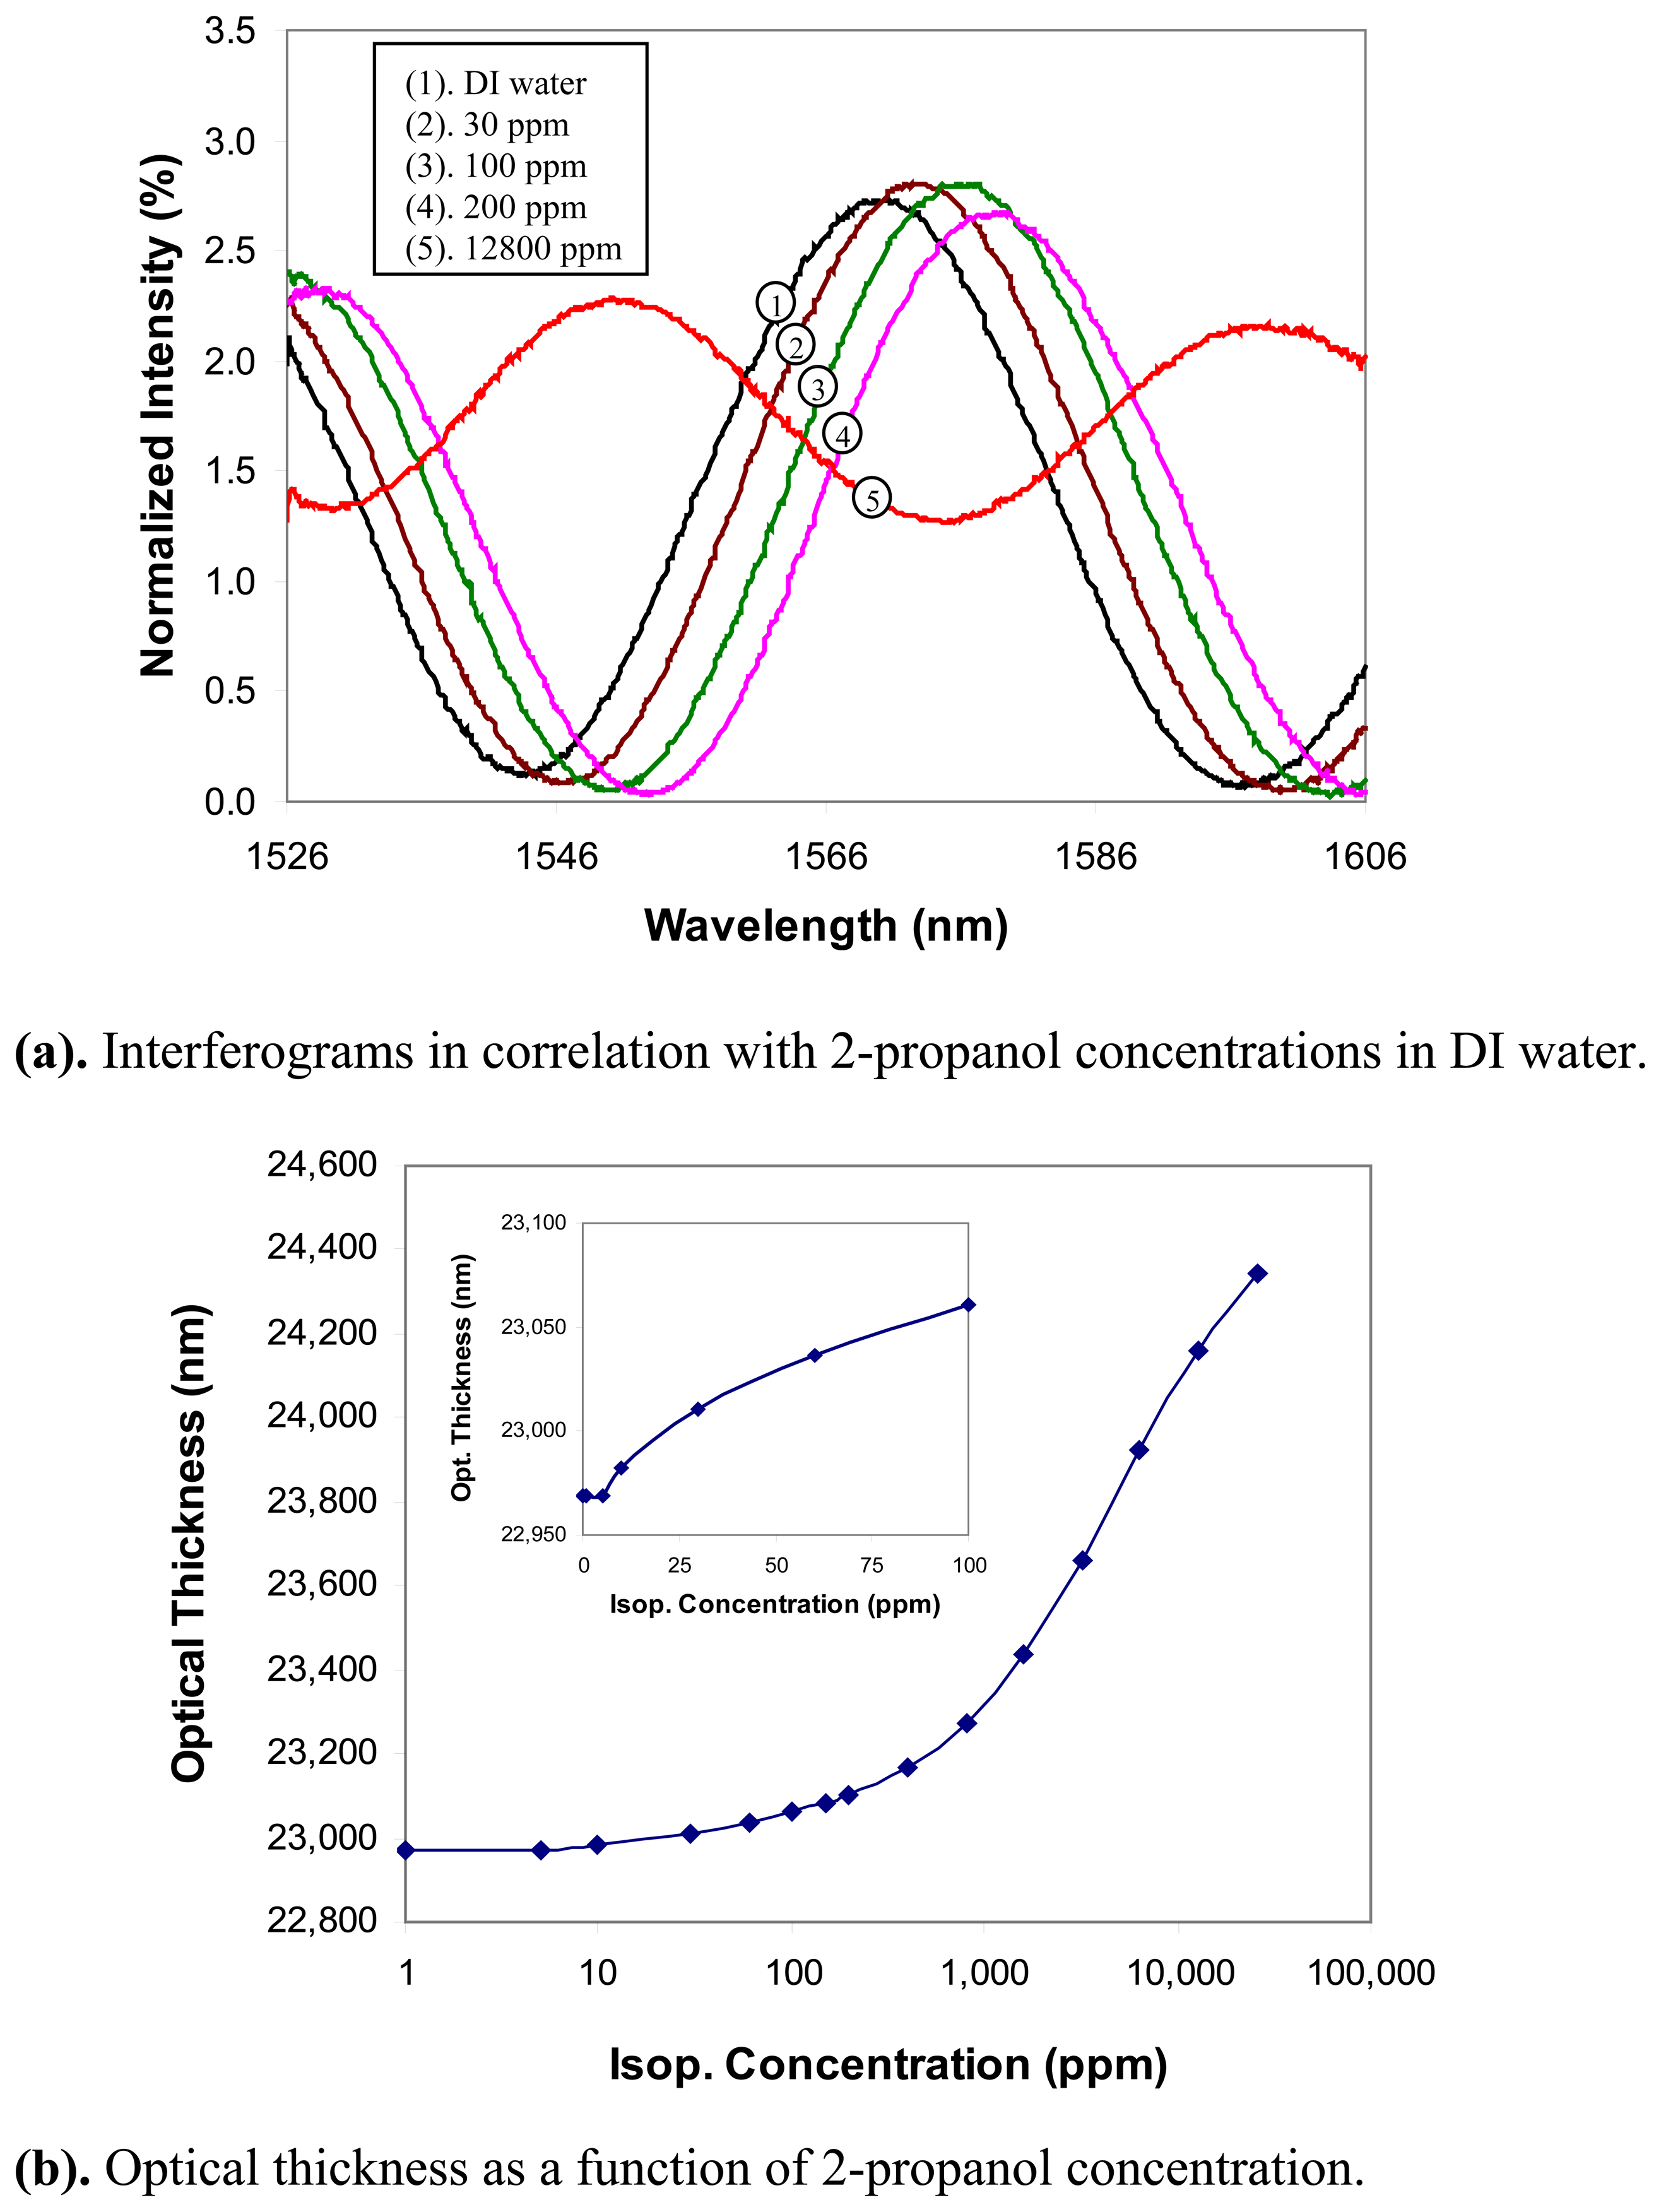
2-propanol: The concentration of 2-propanol in DI water was staircase increased from 1ppm to 25,600ppm. Several representative interferograms in correlation with the 2-propanol concentrations are shown in
Fig. 6(a). The interferograms shifted towards the longer wavelength as the 2-propanol concentration increased, which indicated that the optical thickness increased as more 2-propanol molecules adsorbed in the zeolite. This behavior was confirmed by the optical thickness-concentration relationship shown in
Fig. 6(b), where the concentration is plotted in a logarithmic scale to cover the large range. As shown in the insert of
Fig. 6(b), the sensor responded to 2-propanol at much lower concentrations compared to methanol. Above ∼5ppm, the optical thickness increased monotonically as a function of the concentration. The sensor also exhibited a threshold behavior though the threshold (∼5ppm) was much smaller than that of methanol. This indicated a detection limit for 2-propanol in water was about 5ppm.
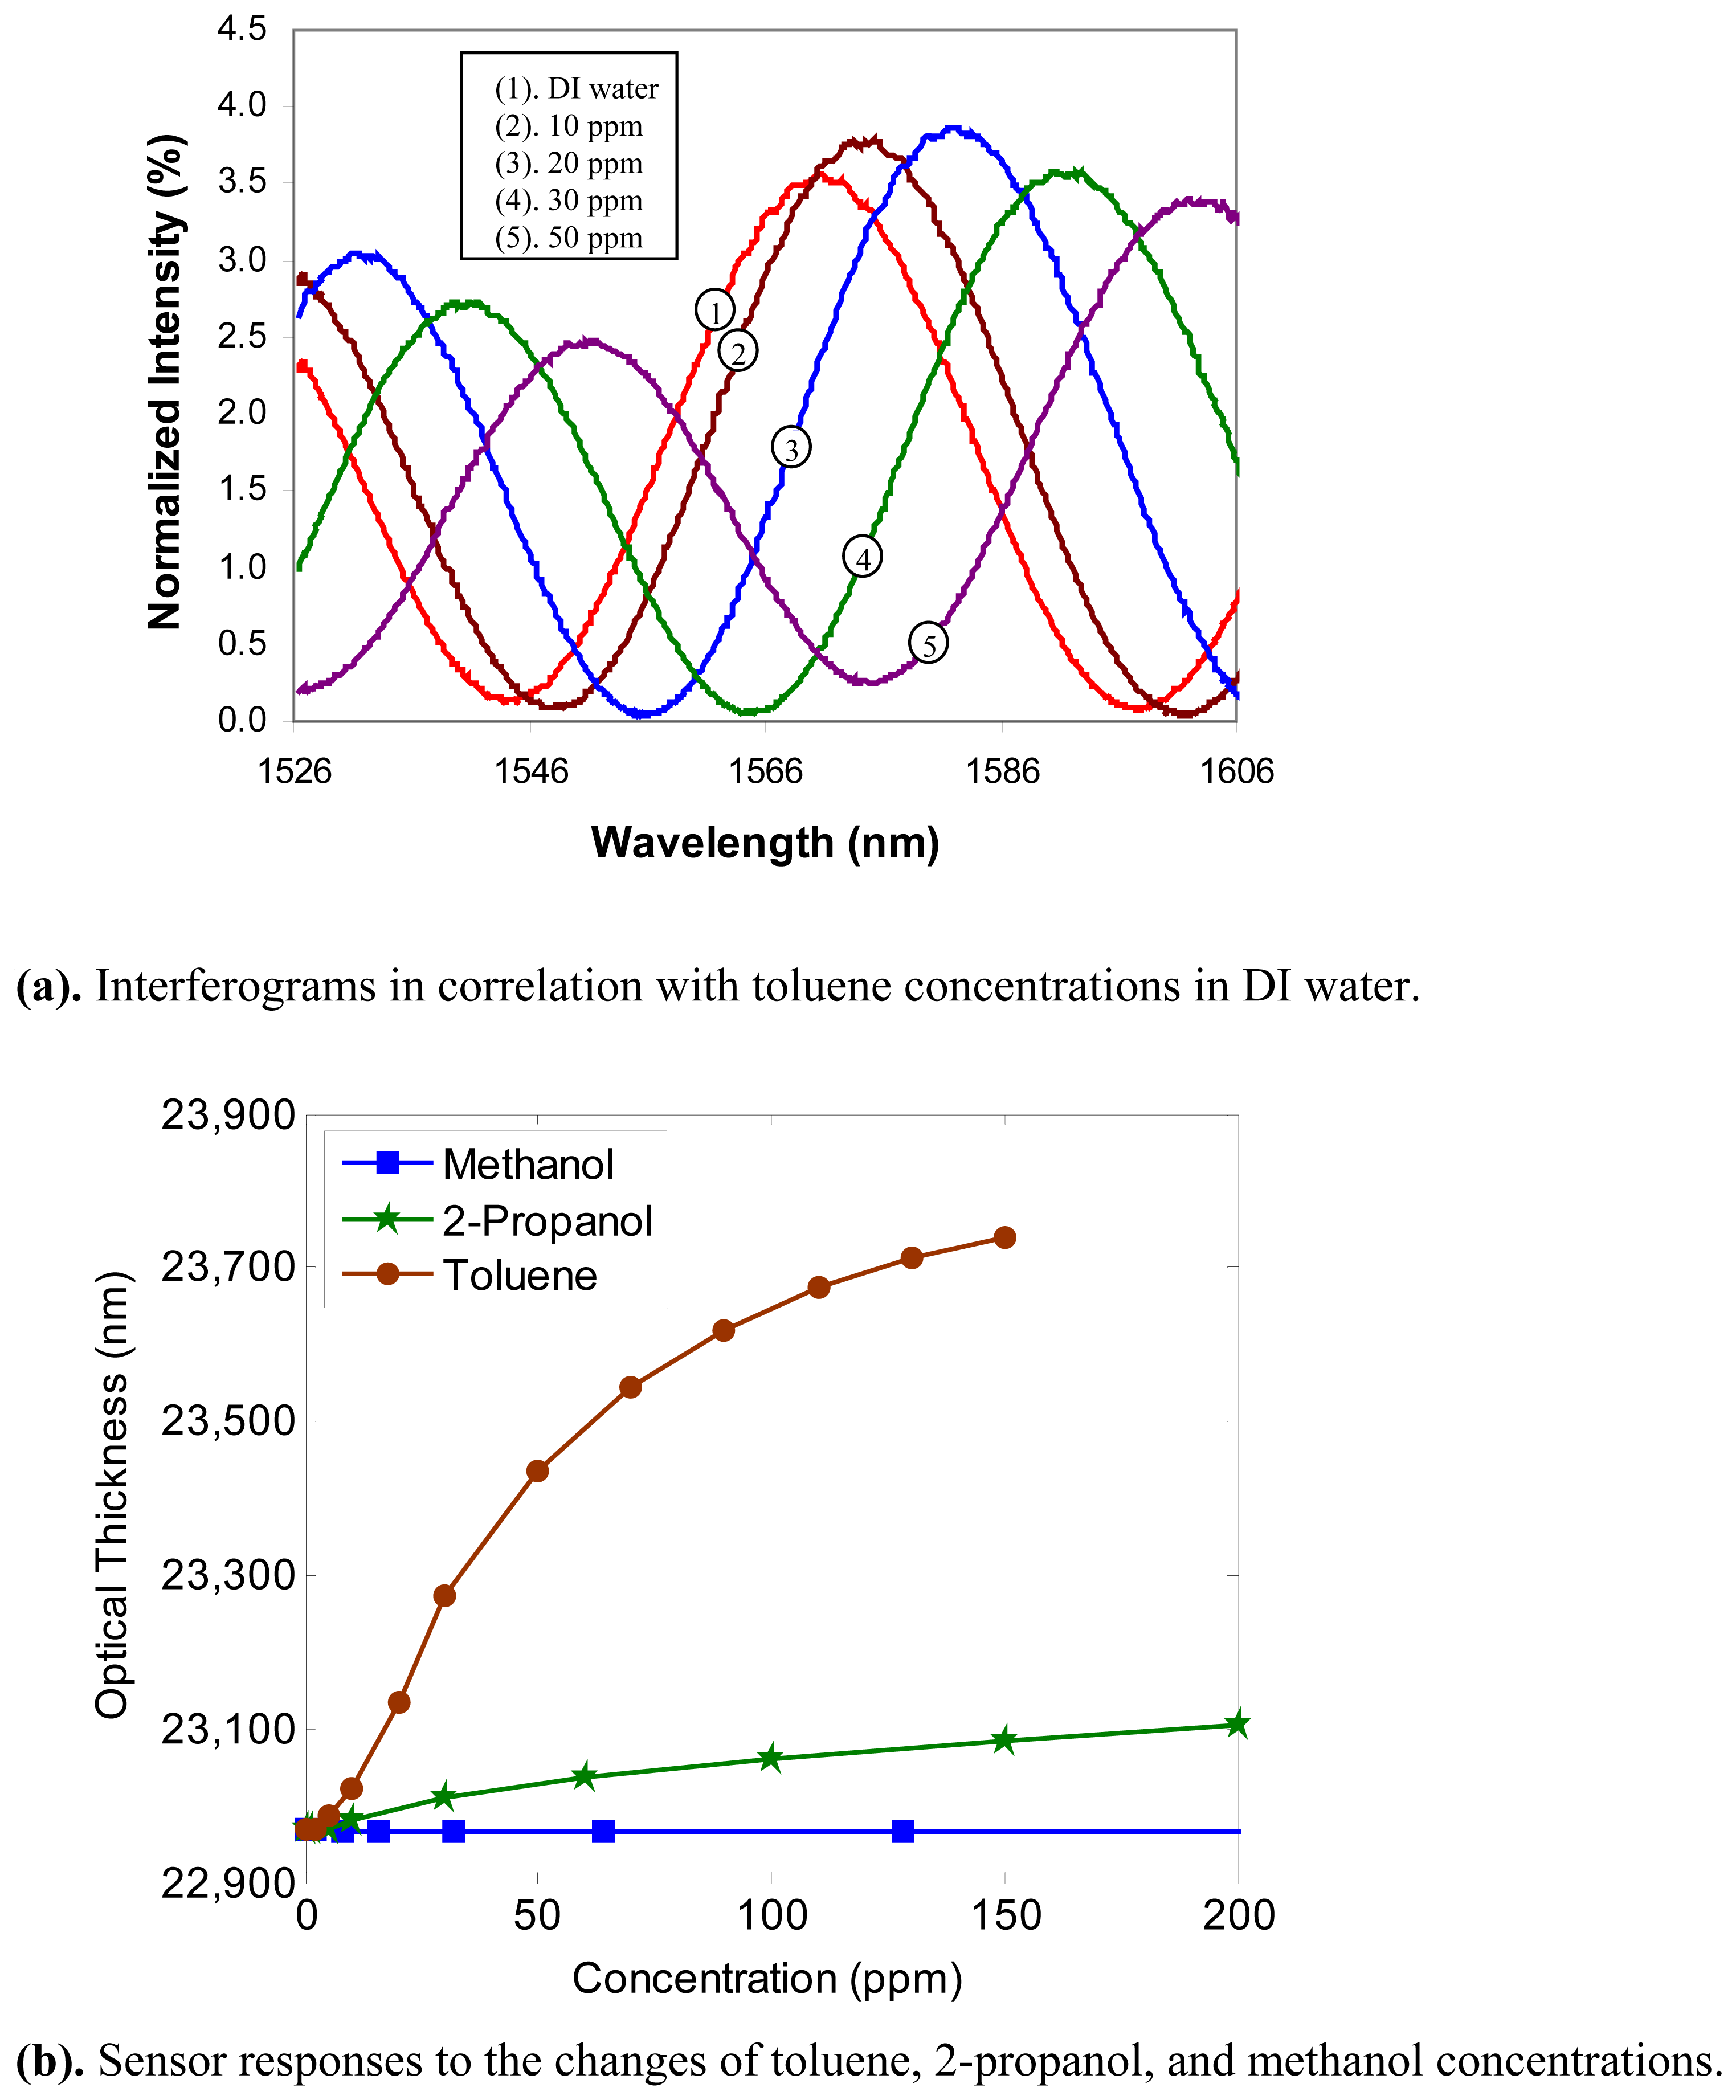
Toluene: The concentration of toluene in DI water was changed from 1ppm to 150ppm monotonically.
Fig. 7(a) shows several representative interferograms at different concentrations.
Fig. 7(b) plots the optical thickness as a function of the toluene concentration. The optical thickness increased with toluene concentration in the solution. A similar threshold behavior was observed in the sensor response, indicating a detection limit of about 2ppm for toluene in water. For a better comparison, the sensor responses to all three chemicals are presented in
Fig. 7(b). The sensor had a very strong response to toluene, a moderate response to 2-propanol, and almost no response to methanol at the low concentration levels.
The test was repeated for 2-propsal detection using the same sensor after regeneration. Comparing to the first test, the optical thickness of the zeolite coating at the same 2-propanol concentration was within ±0.2nm. In addition, no noticeable difference was observed in the sensor response time. It is also worth noting that the regeneration processes after testing each chemical brought the sensor back to the same starting point (within 0.1nm). This means that the sensor can be completely regenerated for repeated usage. All these indicate that the zeolite-fiber sensor has a very good reproducibility.


