Solid State pH Sensor Based on Light Emitting Diodes (LED) As Detector Platform


Abstract
: A low-power, high sensitivity, very low-cost light emitting diode (LED)-based device developed for low-cost sensor networks was modified with bromocresol green membrane to work as a solid-state pH sensor. In this approach, a reverse-biased LED functioning as a photodiode is coupled with a second LED configured in conventional emission mode. A simple timer circuit measures how long (in microsecond) it takes for the photocurrent generated on the detector LED to discharge its capacitance from logic 1 (+5 V) to logic 0 (+1.7 V). The entire instrument provides an inherently digital output of light intensity measurements for a few cents. A light dependent resistor (LDR) modified with similar sensor membrane was also used as a comparison method. Both the LED sensor and the LDR sensor responded to various pH buffer solutions in a similar way to obtain sigmoidal curves expected of the dye. The pKa value obtained for the sensors was found to agree with the literature value.1. Introduction
Computer networks have had an enormous impact on global society over the past decade, particularly through the merging of digital communications, digital signal processing (audio, video, data), and entertainment, as demonstrated by the importance of the internet and the world-wide-web. The ‘ubiquitous computing’ is no longer just an imagination but an area of research now where miniaturised computers would be embedded throughout our environment, communicating with each other via wireless networks. [1,2,3,4,5] This has led to the emergence of ‘ubiquitous sensing’ that allows computers to be ‘environmentally aware’. In other words, there must be a layer of ‘sensors’ feeding information into the pervasive wireless networks [6]. Interest in wireless networked sensors is therefore rising rapidly, but tends to be dominated by physical transducers, with relatively little work reported on integrating chemical sensors and biosensors, as they are still relatively large devices, expensive, and generally not reliable over long term use [7,8,9,10,11,12]. A key requirement therefore is the availability of compact, inexpensive and very broadly applicable platforms for building wireless network test beds for chemical sensors and biosensors [13,14].
We have reported a new optical transducer platform based on LEDs from which chemical sensors have been prepared and demonstrated [15,16,17]. Under normal mode of operation, an LED junction is forward biased to emit light energy at various wavelengths that depend on the materials used, to cover from near ultraviolet, visible and near infrared region. However, the reverse of this effect is that a standard LED emitting-junction can operate as a light-detecting junction, generating a small photocurrent proportional to the incoming light energy, which can be measured directly or indirectly. The total photocurrent is on the order of a nanoampere, so instead of measuring this extremely small current directly, we take advantage of the capacitive decay nature of the circuit and measure the time it takes the analytical photocurrent to discharge the parasitic junction capacitance at the detector LED from a precharged level of +5 volts (TTL logic “1”) to below the digital logic level threshold of an attached microprocessor. This is achieved using the digital I/O pins of an inexpensive PIC 16F876, connected to both LED junctions. In practice this very inexpensive and low-power platform is able to achieve greater than 10-bit resolution.
Optical measurements that involve transmission through the sample, using a separate LED light source and detector has been demonstrated and applied in colorimetric detection of pH and metal ions [14,18]. These devices have also been used to fabricate integrated microfluidic flowcells for flow analysis [17] and have been used in sensor array for multiple component analysis of dye mixtures [16]. When a chemochromic material is deposited as a film on the surface of the package and exposed to a specific analyte, the incident radiation from the emitter LED is partially coupled into the coloured film. Hence colour changes arising in the reactive film affect the light intensity that reaches the light sensitive area of the detector LED, changing the photocurrent induced by the radiation. This approach has successfully detected ammonia in gas phase. [19]
The objective of this work is to show that solid-state sensor fabricated from modifying LEDs with chemochromic coating can function in direct contact with solution to perform colorimetric analysis, therefore achieving a compact reagentless sensing system for use in water monitoring.
2. Results and Discussion
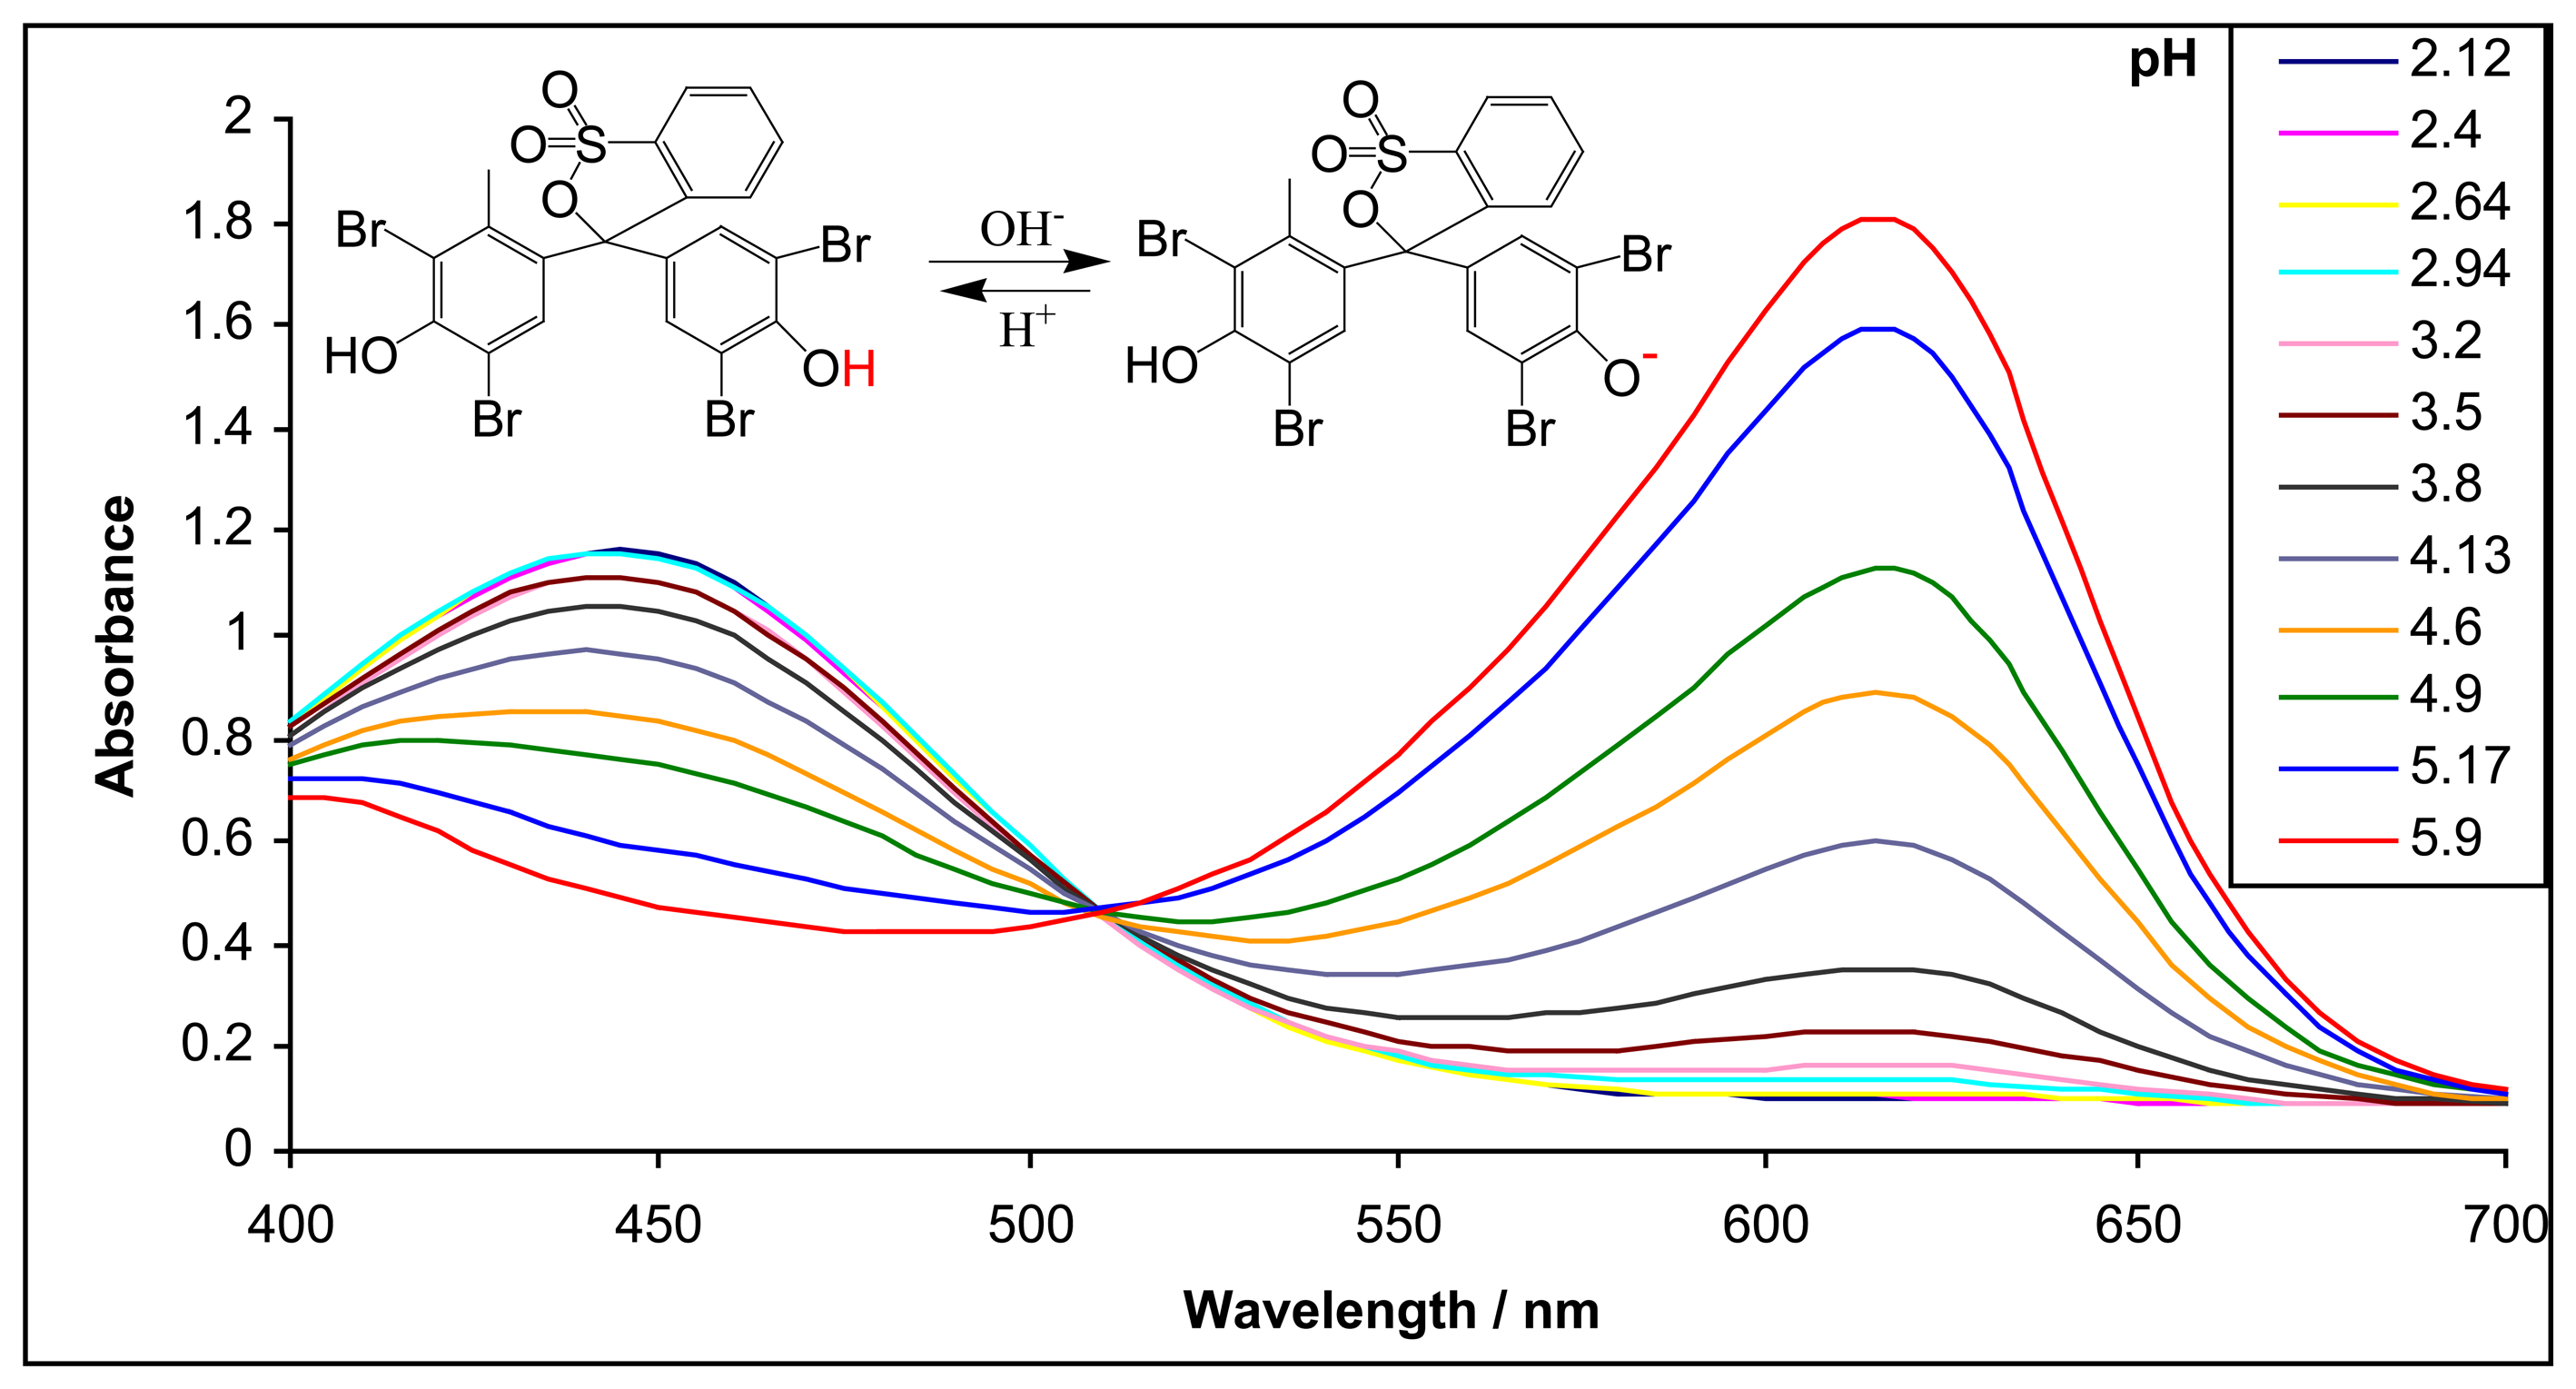
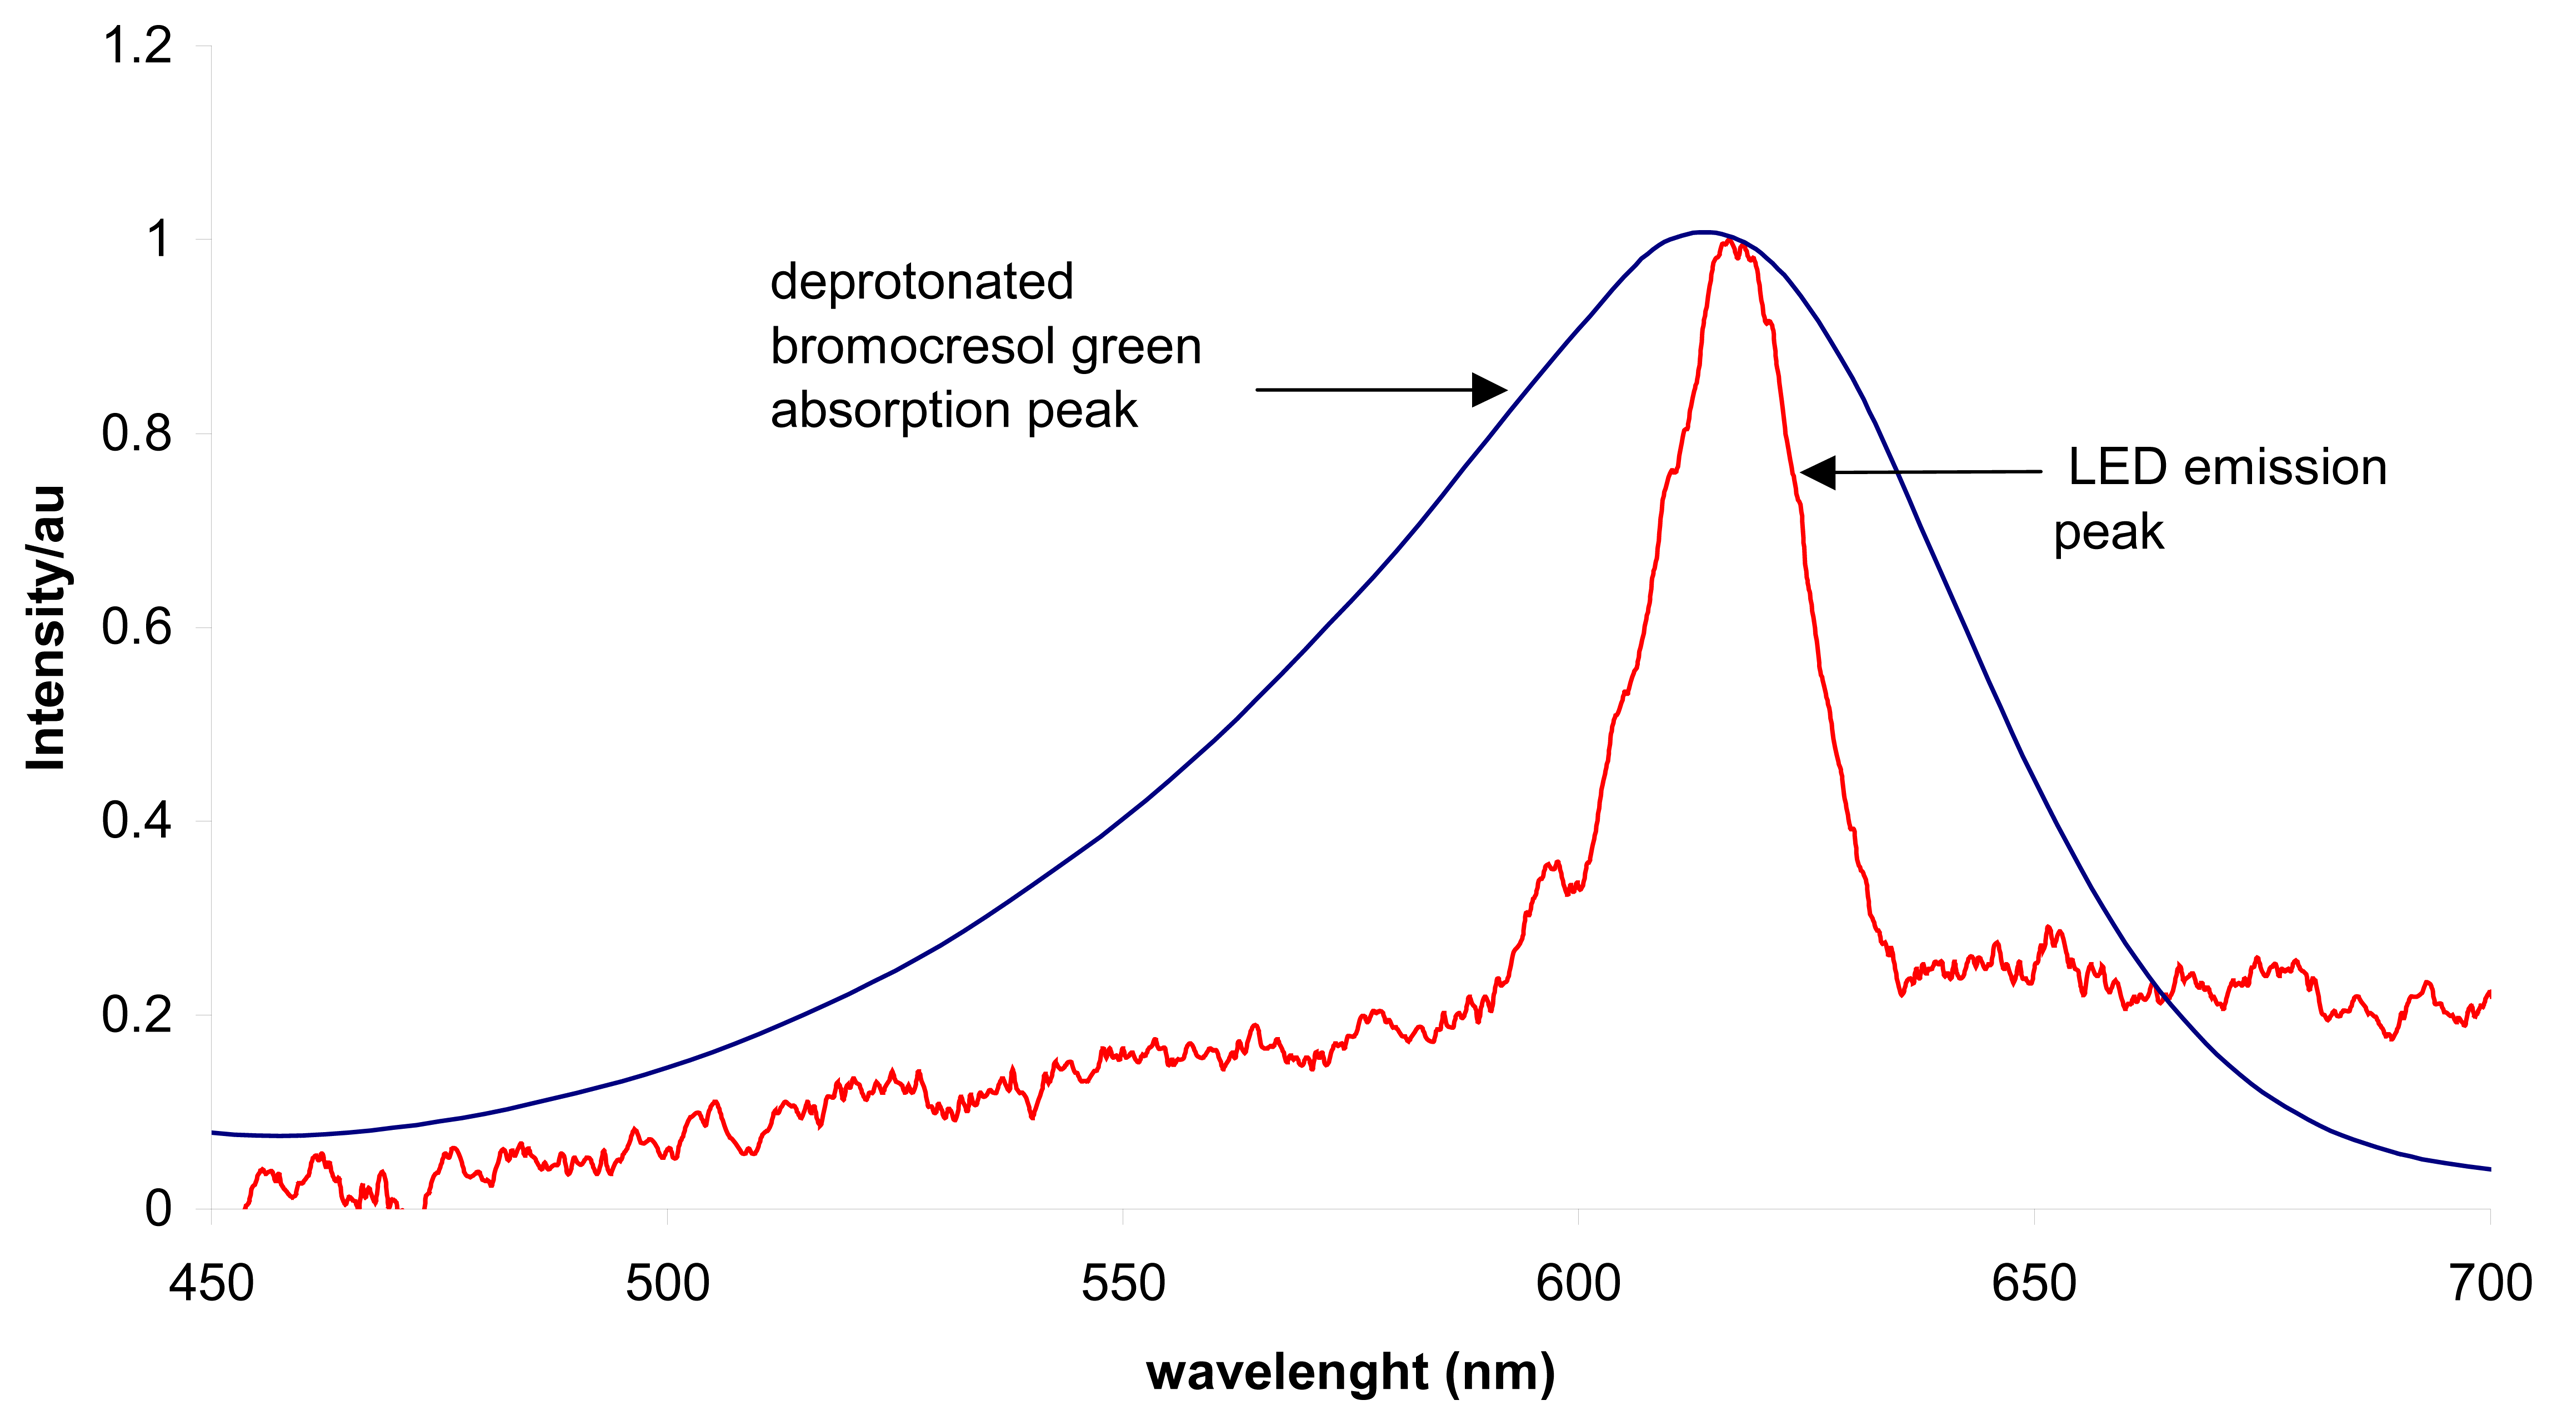
Figure 1 shows the perfect overlapping of the absorption band of the deprotonated pH dye bromocresol green (λmax at 610nm) and the emission band of the LED light source (λmax at 620nm). The acid form of this dye has much lower absorbance than its basic form as shown in Figure 2. This implies that the basic form of the dye absorbs the emission of the LED light source more efficiently and will give optimal sensitivity for this colorimetric measurement. The inset of Figure 2 shows the acid and basic forms of the BCG dye whereas the main feature of the graph is a pH-absorbance plot of the dye obtained by using a conventional bench top UV-VIS instrument. The pKa value of the dye determined with these data was 4.80, which was in agreement with the literature value [20].
The LDR sensor has a planer surface; it is very difficult to use dip-coating method for sensor fabrication because the amount of dye formulation left on the surface is hard to control. Instead drop coating with a micro pipette was used to modify the LDR surface. It was found that 8μL of the formulation covered the LDR surface easily without too much effort to manually spread the solution with the pipette tip. An estimation of ∼ 8μm thick membrane was achieved after drying.
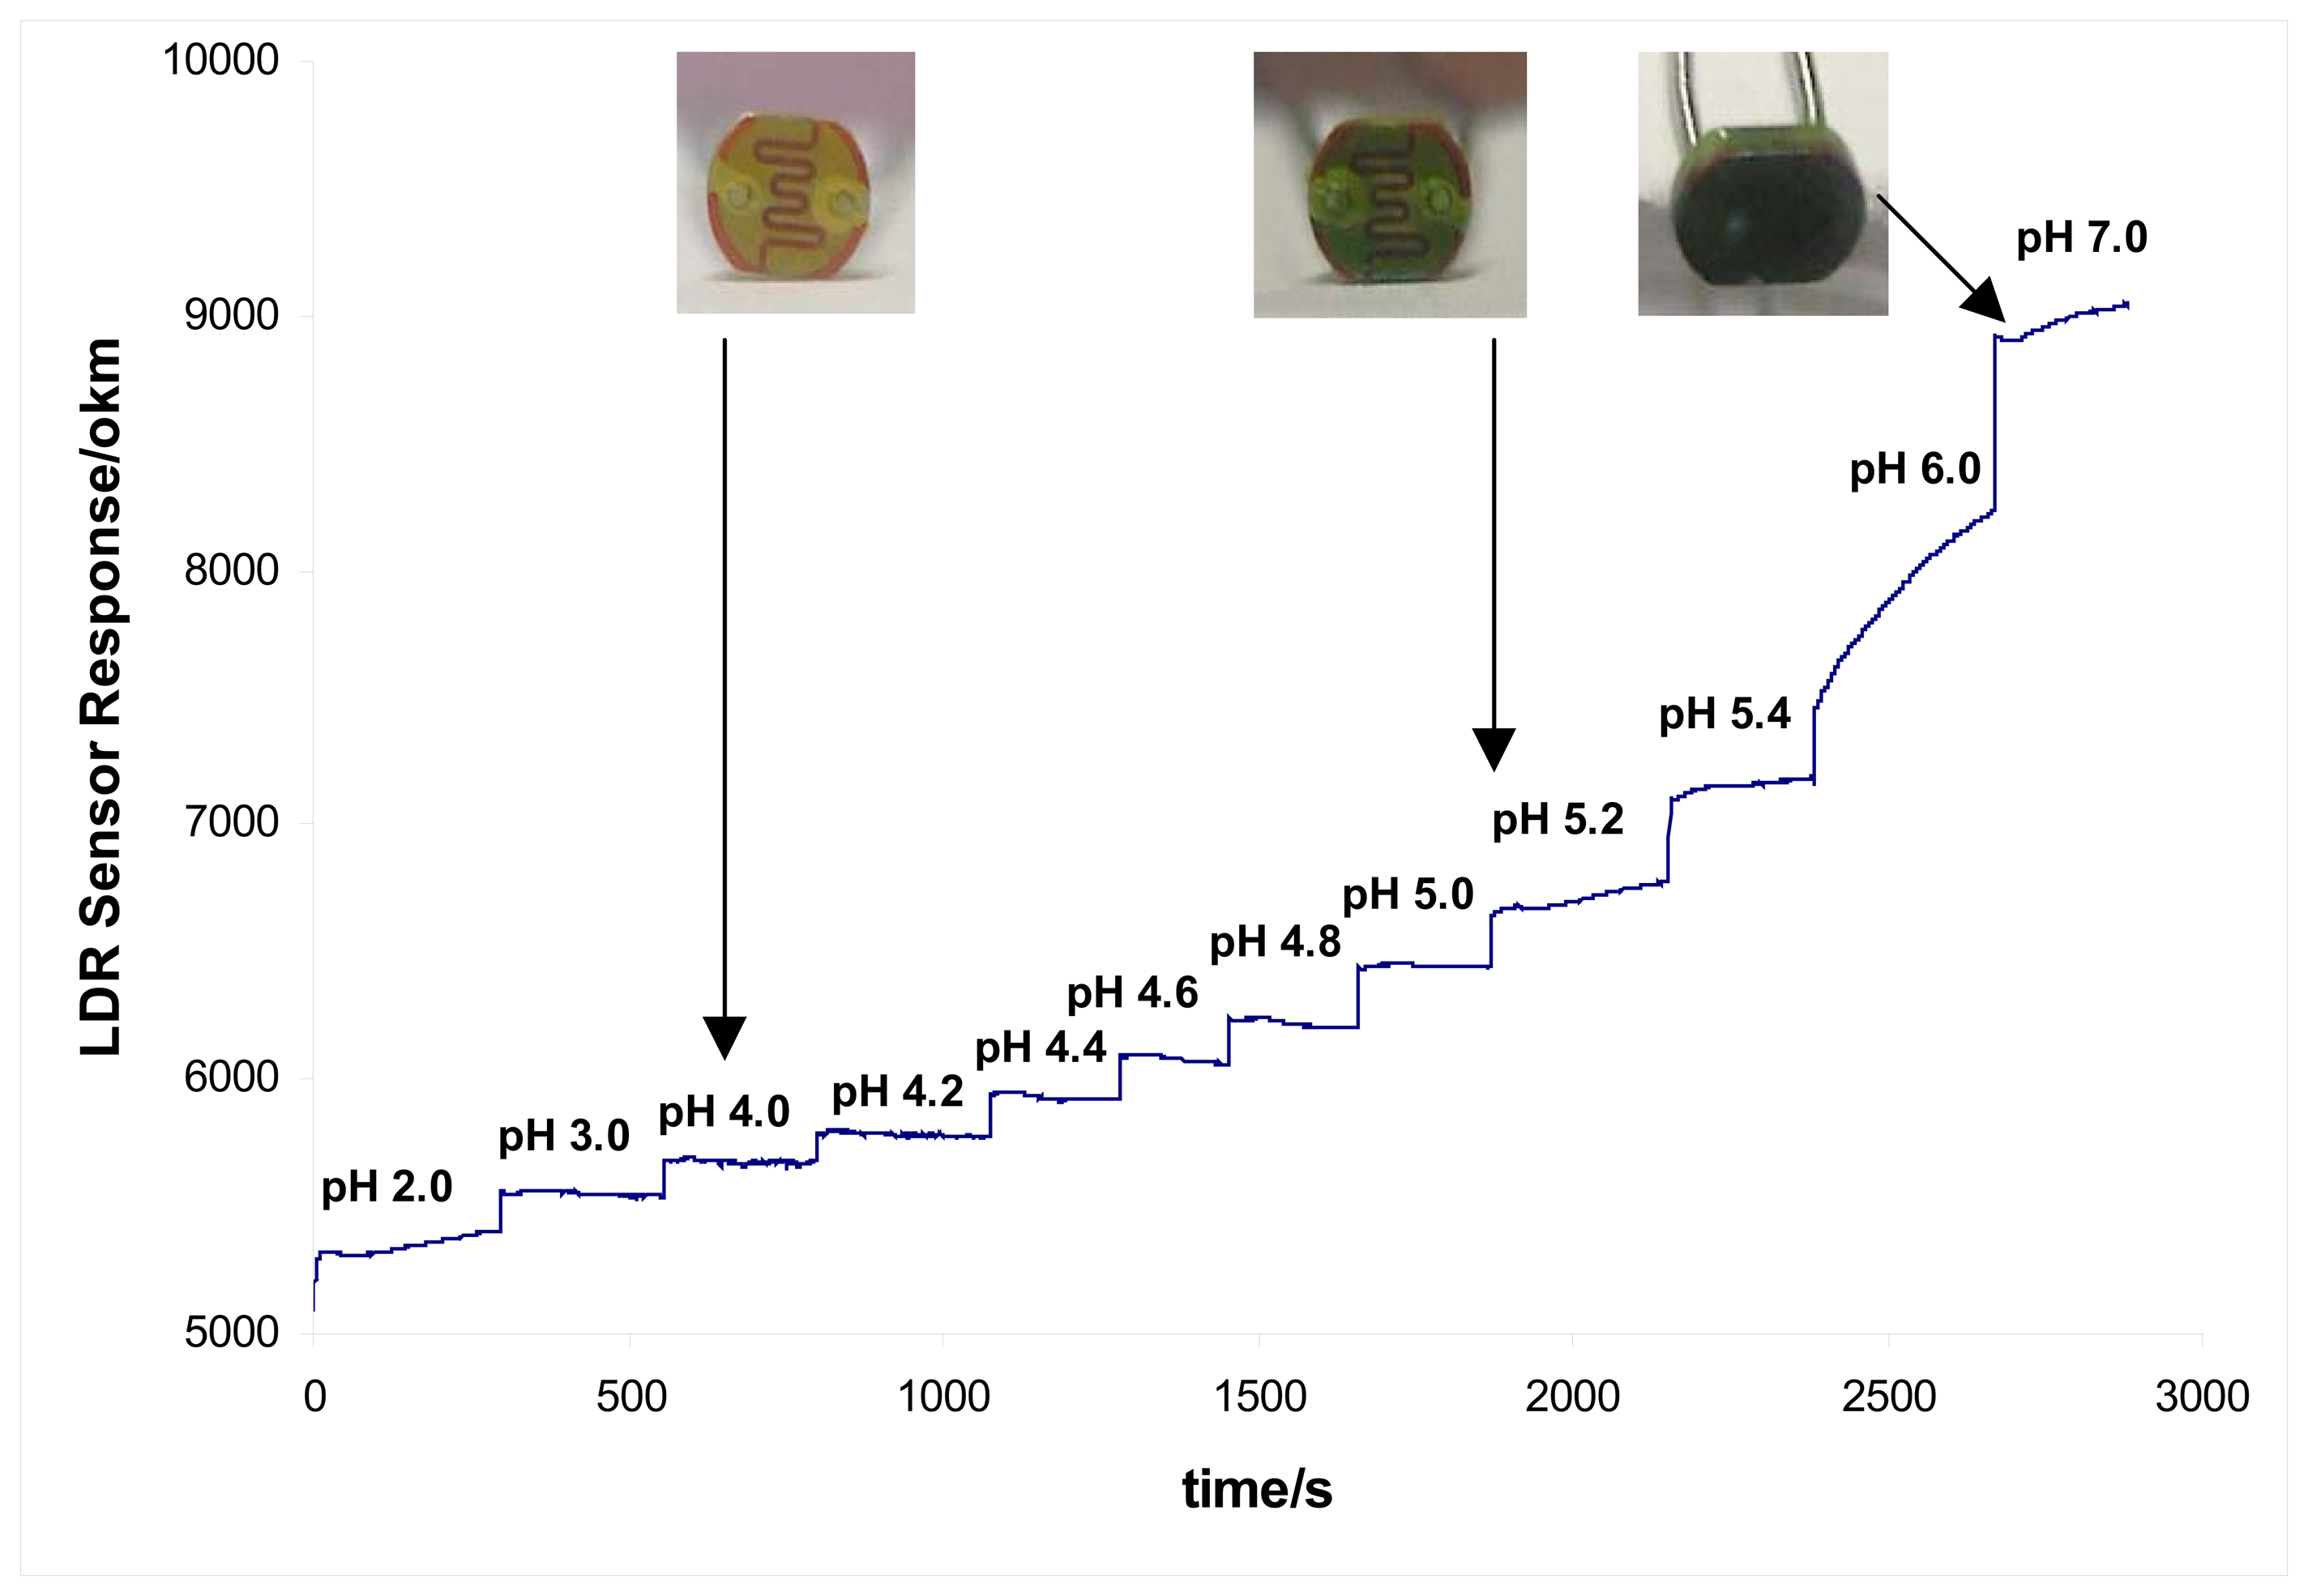
Calibration of LDR sensor with pH buffer solutions resulted in a graph shown in Figure 3. These data were obtained by measuring the solutions in the optical cell with the HP multimeter connecting to a PC. The data logging function was paused during solution change and restarted 5 minutes after the new buffer solution was introduced to allow the sensor to reach equilibrium. Slow diffusion profile observed after pH5.4 was due to the fact that no equilibrium time was allowed for that particular sample due to human error. However, this particular trace showed that the response time (90% of the equilibrium) of the sensor was roughly 5 minutes. The inset in Figure 4 was the actual colour change of the LDR sensor at different pHs, changing from a clear yellow at pH 4 to green at pH 5.2 and dark blue at pH 7.
The LDR sensor has a planer surface; it is very difficult to use dip-coating method for sensor fabrication because the amount of dye formulation left on the surface is hard to control. Instead drop coating with a micro pipette was used to modify the LDR surface. It was found that 8μL of the formulation covered the LDR surface easily without too much effort to manually spread the solution with the pipette tip. An estimation of ∼ 8μm thick membrane was achieved after drying.
Calibration of LDR sensor with pH buffer solutions resulted in a graph shown in Figure 3. These data were obtained by measuring the solutions in the optical cell with the HP multimeter connecting to a PC. The data logging function was paused during solution change and restarted 5 minutes after the new buffer solution was introduced to allow the sensor to reach equilibrium. Slow diffusion profile observed after pH5.4 was due to the fact that no equilibrium time was allowed for that particular sample due to human error. However, this particular trace showed that the response time (90% of the equilibrium) of the sensor was roughly 5 minutes. The inset in Figure 4 was the actual colour change of the LDR sensor at different pHs, changing from a clear yellow at pH 4 to green at pH 5.2 and dark blue at pH 7.
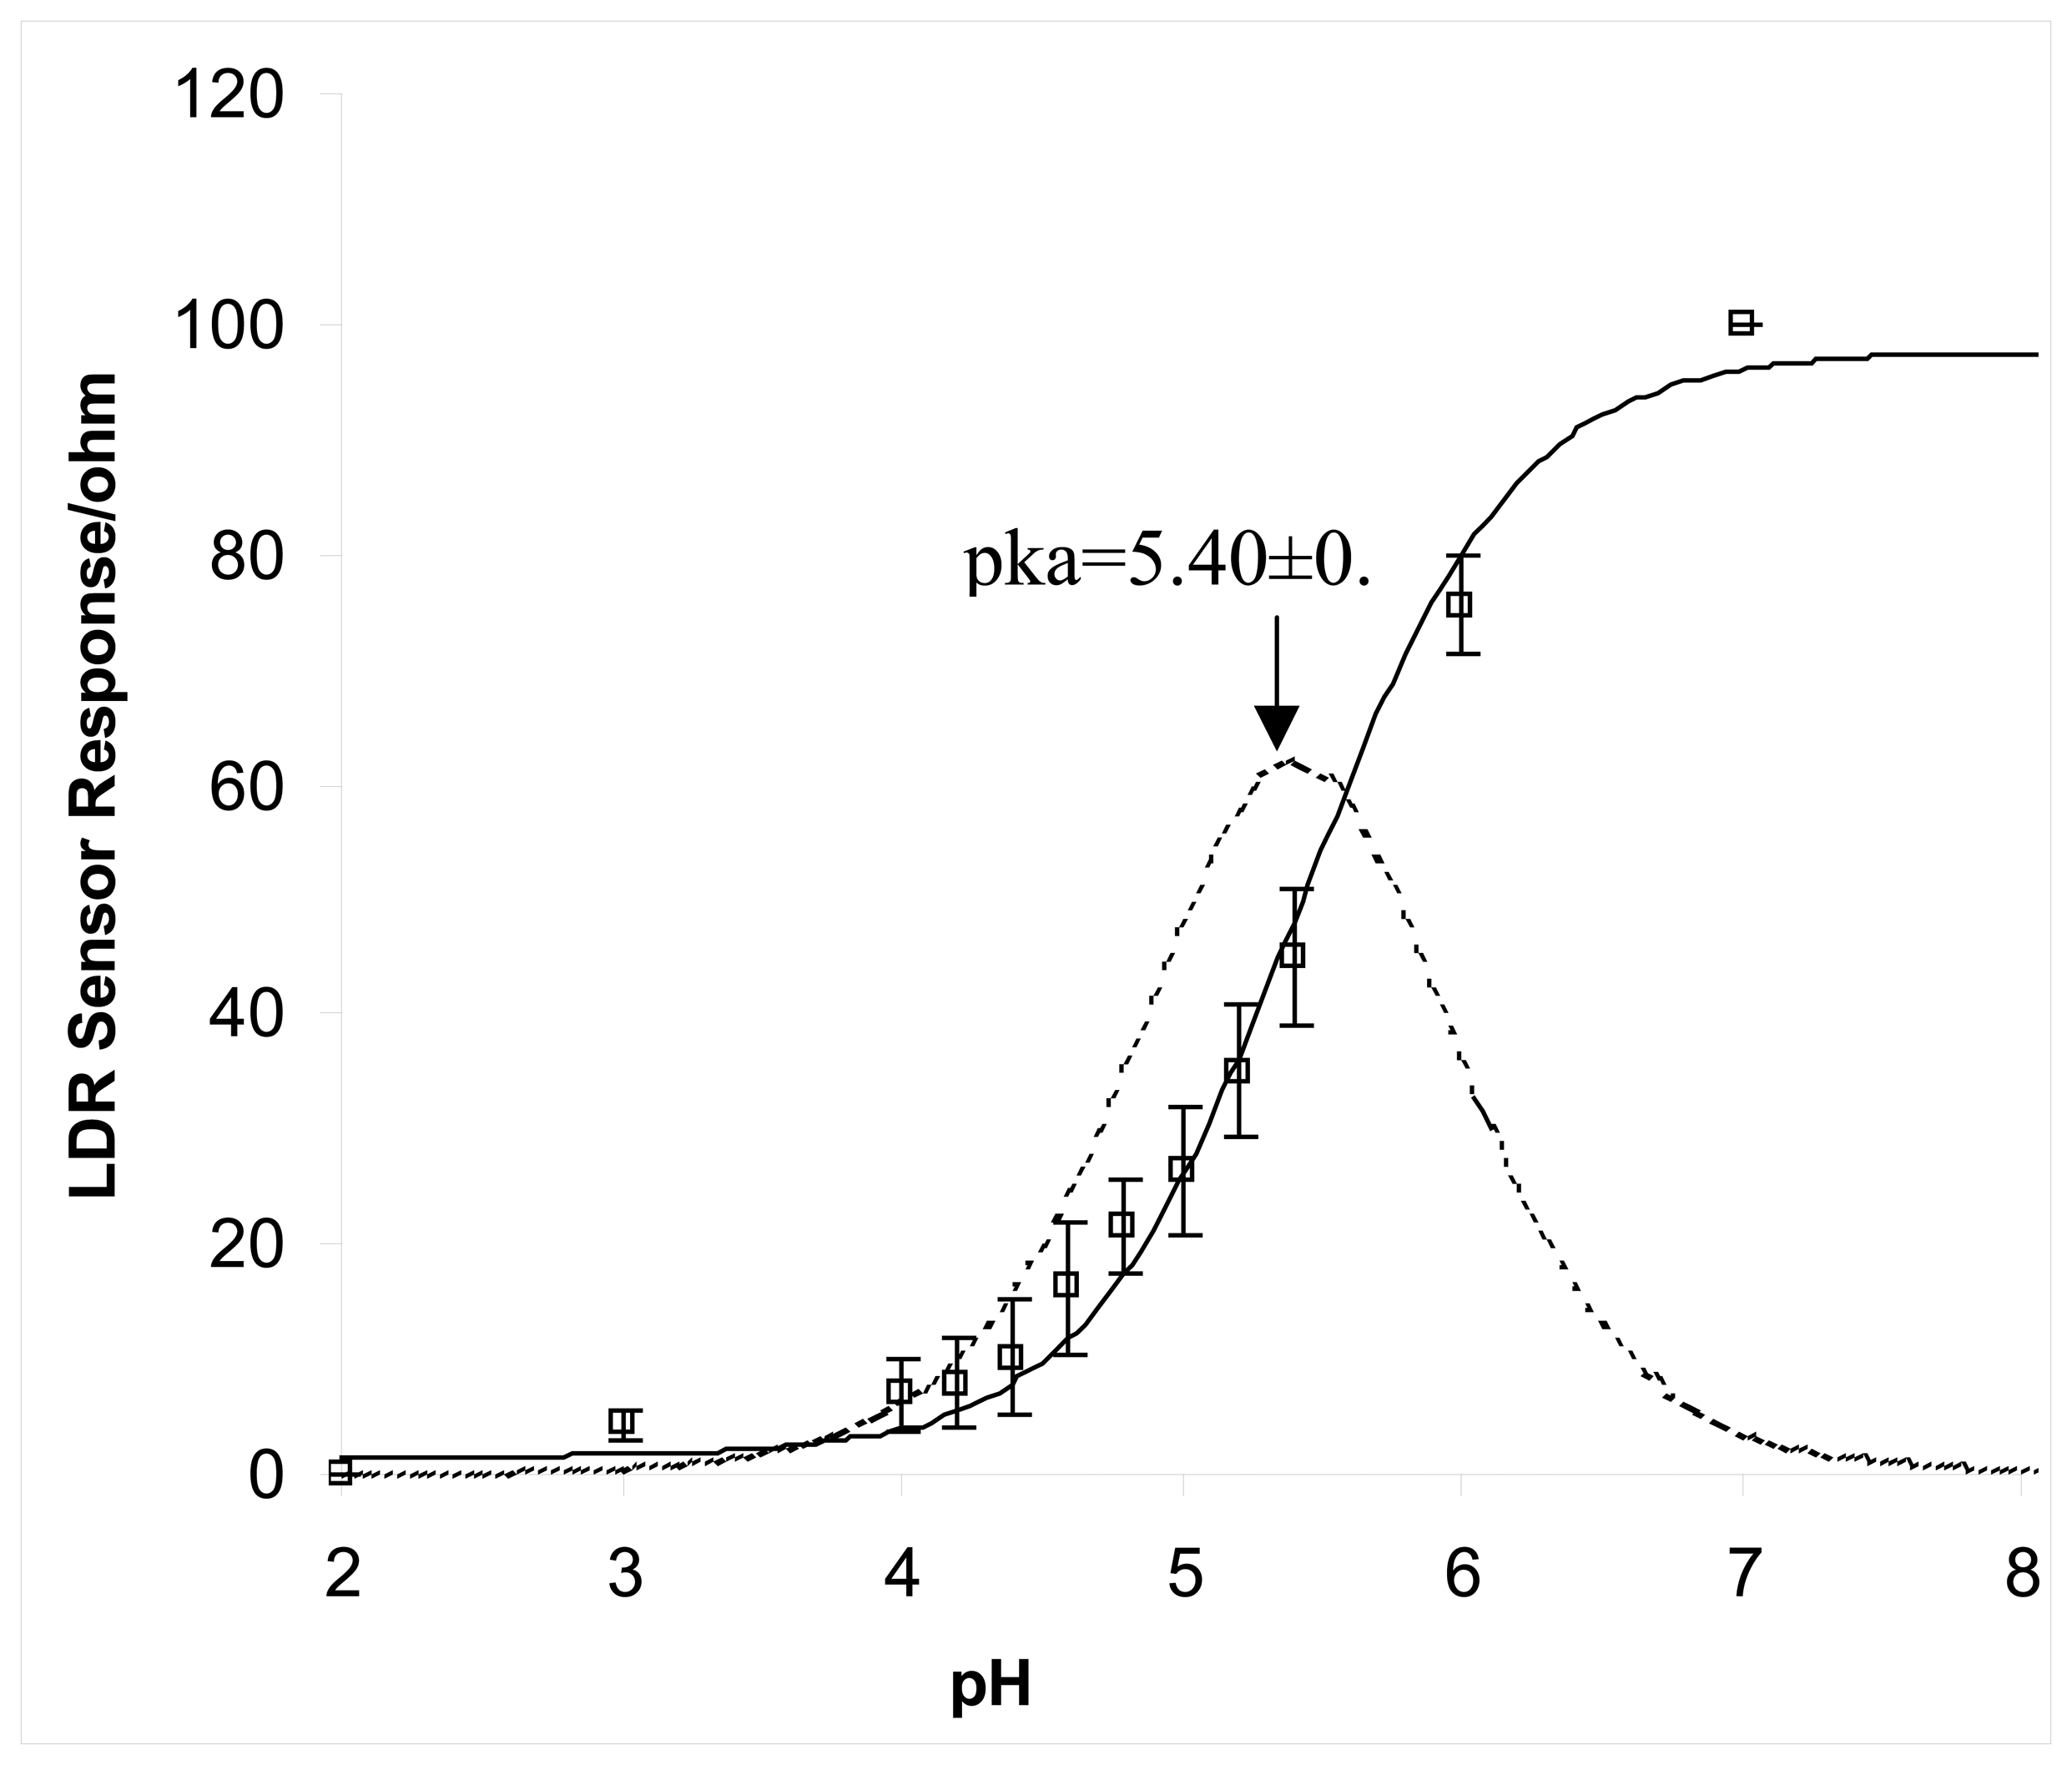
Three repeated calibrations obtained from 3 separate days were normalised and presented in Figure 4. As a result, a sigmoidal pH-absorbance plot was obtained as expected for these pH indicator dyes. A best-fit curve was added to the experimental data and from it a first derivative was performed to obtain a pKa value of 5.4±0.05 for the solid-state pH sensor. When pH indicator dyes are immobilised in a membrane, the micro environment of the membrane matrix will normally shift the pKa of the dye up slightly, to sometimes over 0.5 pH unit. The thickness of the membrane also contributes significantly towards the observed pKa value due to a change in dielectric properties of the membrane and the increased diffusion constrain of the ions (protons) concerned. In this example, a higher pKa value was obtained for this LDR sensor, mainly due to the thick sensor membrane that restricted the diffusion of water and ion mobility so that the effective pH in the sensor-solution boundary and the pH within the membrane matrix were slightly different. From the pictures of the LDR sensor shown in Figure 3, it could be seen that strong colour change was observed from the sensor; and from the response profile, it indicated that the membrane thickness could ideally be reduced to achieve better ion diffusion. The relatively high error bars (rsd ≥ 20% for n=3 (days)) shown in Figure 4 were results of dye degradation and conditioning of the sensor, which was kept in buffer solution after each use.
The LED sensors were fabricated by dip-coating method. This technique achieved much thinner sensor membrane by visual inspection. It is difficult to estimate the thickness of the sensor membrane because the LED was only partially coated. It was speculated that the membrane was in the region of 1-3μm according to the dry weight of the material being put on and the roughly estimated surface area of the LED covered.
Calibrating the sensor resulted in a plot shown in Figure 5. The insets were two pictures of the LED sensor at pH 2 and pH 7 respectively. The sensor responded to pH change in a similar way to the LDR sensor, resulting in a typical sigmoidal response. An estimated pKa value of 4.90 was obtained with this sensor calibration. A normalised sensor data obtained with three repeats obtained from three separate days is shown in Figure 6 for easier comparison with the data obtained with the LDR sensor. Processing the data as mentioned previously resulted in pKa value of 4.95±0.01, which was very close to the value (4.70) obtained for the free dye in solution phase. These results suggested that the sensor was able to give very accurate individual set of calibrations. However, significant day to day sensor drift were observed as evidenced by the high rsd values of ∼20% for n=3 (days). This drift was not due to dye leaching as no detectable dye was present in the storage solution. Reductive degradation of the dye, which is a known phenomenon, combined with polymer membrane conditioning are therefore believed to be the main reasons for the error. This implies that the sensor has to be calibrated before use for optimal accuracy.
The improved accuracy obtained by the LED sensor compared to that obtained by the LDR sensor is thought to be due to the thinner coating, which allowed the protons to diffuse relatively freely into and out of the membrane matrix. The protonation and deprotonation reactions of a pH dye require the presence of water to act as the reaction medium. Even for a hydrophobic membrane there is a certain depth into that the water molecule can penetrate, hence a thin membrane will have relatively higher water content than a thick one. This will lead to more efficient ion diffusion and therefore reducing the pH differences within and with out the membrane, resulting in faster sensor response (i.e. to reach equilibrium more rapidly). The nature of the membrane matrix is also very important for determining the sensor performance. The differences in the dielectric properties of the sensing membrane as a result of varying membrane thicknesses may result in different pKa values. The water and plasticizer content of the membrane, which is related to the dielectric properties of the membrane, may shift the chemical equilibrium position of the indicator dye, will therefore affect the dissociation constant for the indicator. Hydrophilic (polar) matrixes normally works better than those that are hydrophobic (non-polar) for targeting polar or ionic species such as H+ ions, due to their ability to allow polar interactions to facilitate ion diffusion into and out of the membrane. Additives such as the long-chain alkyl ammonium bromide salt in the membrane matrix also help to enhance the sensor performance by stablising the deprotonated anionic dye in the membrane; followed by excreting the bromide ions to achieve charge balance.
Clearly, this very inexpensive platform could be used for numerous chemical and biochemical measurements that have a colour change as the transduction mechanism. We estimate the component costs for the components used to make this optical detector device at less than €1. With further integration of these components into an application-specific integrated circuit, along with mass production, the cost will drop significantly. Wireless communications can also be achieved using the LEDs themselves over relatively small distances (few metres). Our current works have shown that for longer distances communication, an integrated RF-circuit may be used to achieve around a 100m range. These will open the way for a paradigm shift in sensing from isolated measurements, to internet-scale sensing, via wireless networked sensor communities.
3. Experimental
3.1 Chemicals and materials
Cellulose acetate, cyclohexane, dibutyl sebacate, bromocresol green (BCG) and tetraoctyl ammonium bromide were all analytical grade and purchased from Sigma Aldrich (Dublin, Ireland). The light dependent resistors (LDRs) used were Mitsubishi model 234-1044. All LEDs were obtained from Digi-key (Dublin, Ireland). Stock pH buffered solutions were made up with pH tablets obtained from Sigma Aldrich.
3.2 Sensor Fabrication
Cellulose acetate (0.5g), dibutyl sebacate (0.25g), BCG (15mg), and tetraoctyl ammonium bromide (30mg) were added to 8 mls of cyclohexanone. The cellulose acetate was added slowly and in small portions, with vigorous mixing between each addition to aid its dissolution. Before coating, each LDR was washed with ethanol, twice with deionised water, then once again with ethanol before left to dry in air for 30min. In coating LDRs, 8μL of the formulation was pipetted onto the LDR surface. The solution was carefully spread across the entire surface and then the coated sensors were left to dry in an upright position in air for approx. 6 hours.
The same formulation was used for the fabrication of LED sensors. The LEDs were first washed with soapy water, then with excess deionised water followed by washing with ethanol. The clean, dry LEDs were then inverted and immersed approximately 2mm into the BCG formulation. Care had to be taken not to touch the newly coated sensor off the container walls. The LEDs were left upright, allowing any excess BCG formulation to collect around the LED's flange. This was then removed using absorbent tissue paper. All newly coated LEDs were left to dry slowly in a dessicator overnight in a cyclohexanone atmosphere.
3.3 Cell construction
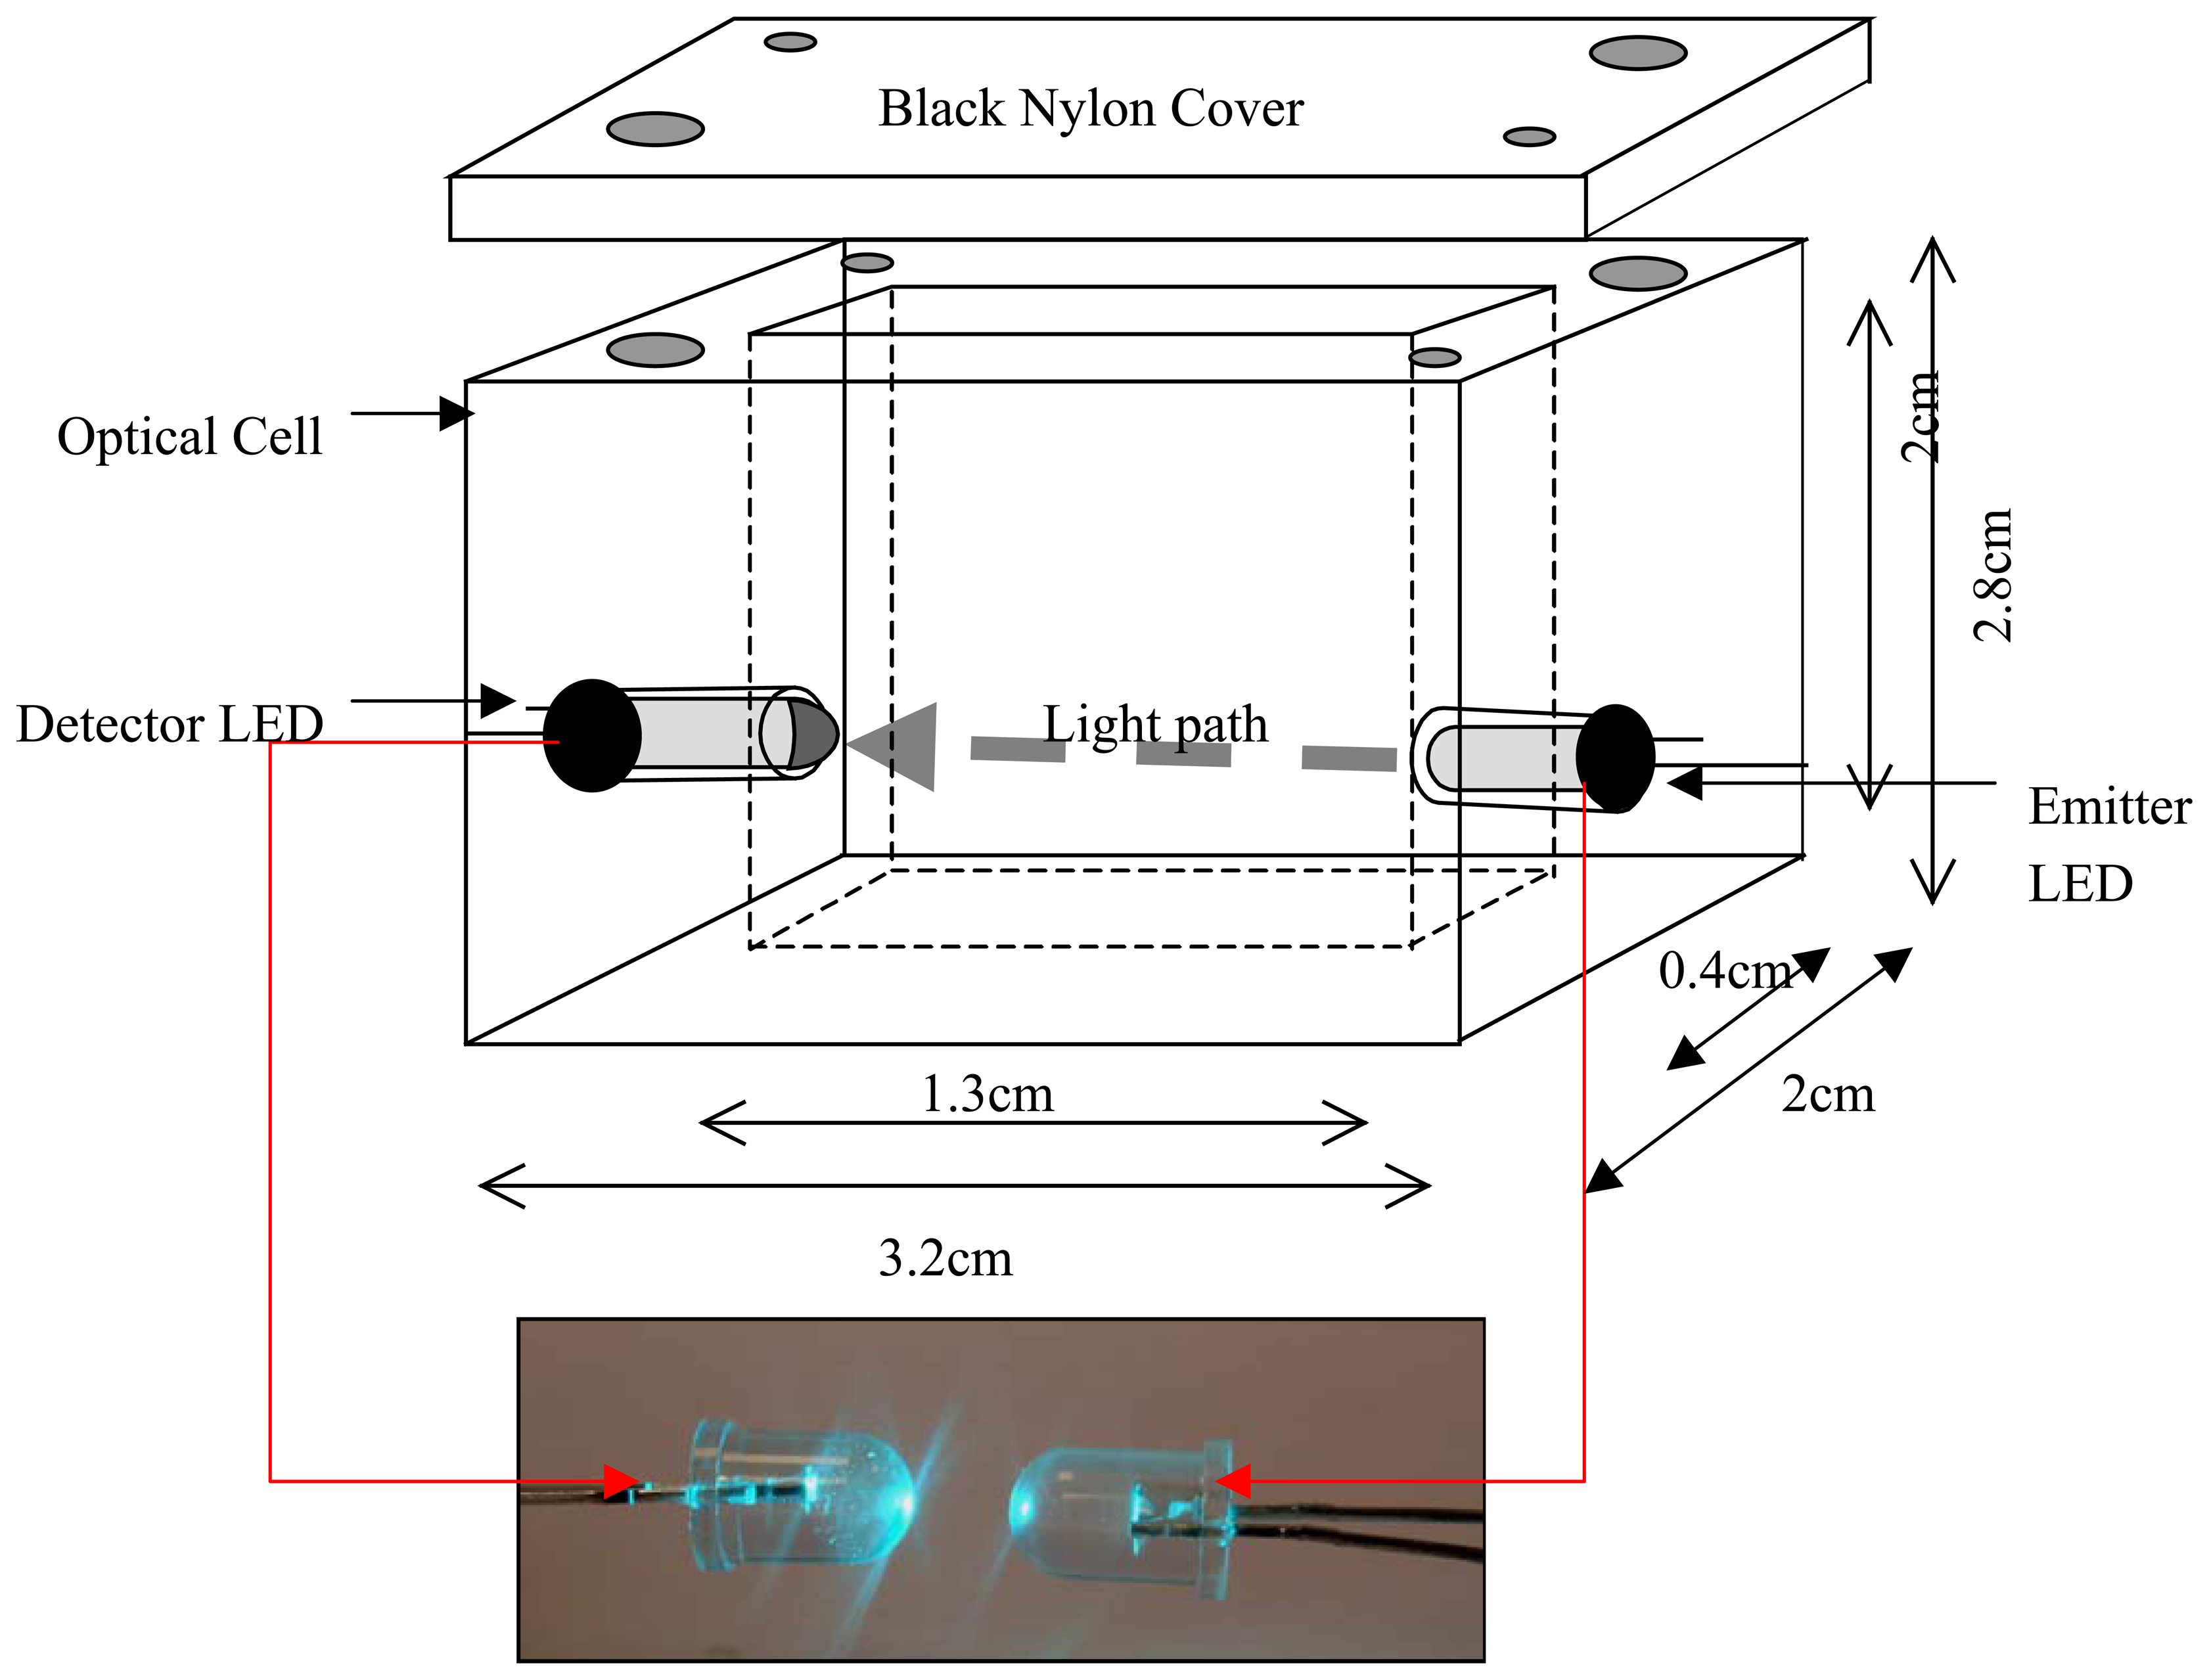
An LED (λmax = 621nm, DigiKey, USA) is employed as the light source and an identical one (or an LDR) was used as the detector. The device is made from two separate identical pieces of black nylon (width 2cm, height 2.8cm, length 3.2cm). Firstly a cavity was milled into two pieces of black nylon. The two sections were then joined together using black silicon glue (RS components, Ireland) to achieve a cavity size of 1.3cm length x 0.4cm width x height 2cm. A small hole (d = 5mm) was made on either side for the LEDs or LDR. An emitter LED was fixed with the help of epoxy glue on one side of the cell and a LDR was fixed on the opposite side as the detector. The LDR was replaced by an LED which was used as the detector for the second part of the experiment. A lid was then made out of black nylon (width 2cm x length 3.2cm) to exclude ambient light (Figure 7).
3.4 Data Acquisition
The battery-powered simple zero-crossing timer circuit reported previously was used to measure the discharge time of the detector LED [14]. The main components of the circuit were a voltage regulator to regulate the input voltage from a 9V battery, a microprocessor and timer circuit, 2 pairs of I/O digital pins connected to the emitter and detector LEDs, and an RS232 port. The light measurement sequence was as follows: The emitter LED was set to give 1ms pulses of light as light source for the absorption based measurements. To detect the intensity of light passing through the sample the detector LED was first reverse biased to 5V for 100μs, and then switched to discharge mode. The detector voltage drain was continuously monitored until it crossed logic zero (1.7V). The resulting discharge time t (in micro seconds) is related to the absorbance of the LED light energy by the sample. The microprocessor is configured to send an averaged value (n=8) to a PC via the RS232 port.
3.5 Measuring procedure
Various pH buffer solutions were made up from the stock solutions by addition of concentrated NAOH or HCl while using a glass electrode for reference. 1mL of pH buffer sample was placed into the optical cuvette and the absorbance was recorded with either the modified LDR or LED sensor. The LDR resistance was measured with a HP 34401A constant current multimeter (Hewlett Packard, Ireland. The data was collected by a PC using the software supplied by the manufacturer (HP multimeter software Version 1.1). The LED sensor discharge time was monitored over a period of 20s with the zero-crossing timer circuit. The sampling rate under this protocol is ca. 1 point per second. The data is collected and saved as a text file for further analysis using Microsoft Excel™. Each sample was measured in triplicate. In between measurements the optical cell was cleaned 3 times with deionised water.
Acknowledgments
We wish to acknowledge the cooperation of researchers from Mitsubishi Electric Research Laboratories, Cambridge, Boston, MA, in the development of the LED instrumentation. Funding from Science Foundation Ireland (SFI 03/IN3/1361) is gratefully acknowledged.
References
- Tracey, Ross; Gary, Burnett. International Journal of Human-Computer Studies; Volume 55, 2001; pp. 661–674. [Google Scholar]
- Yoo, Youngjin; Lyytinen, Kalle. A Special Issue for Information and Organization Information and Organization; Volume 15, 2005; pp. 91–94. [Google Scholar]
- O'Grady, M.J.; O'Hare, G.M.P. Information Sciences; Volume 171, 2005; pp. 335–353. [Google Scholar]
- Bång, Magnus; Larsson, Anders; Berglund, Erik; Eriksson, Henrik. International Journal of Medical Informatics; Volume 74, 2005; pp. 545–551. [Google Scholar]
- Swan, Karen; Cook, Dale; Kratcoski, Annette; Lin, Yi Mei; Schenker, Jason; van 't Hooft, Mark. Advances in Educational Administration; Volume 8, 2006; pp. 231–252. [Google Scholar]
- Ivanisevic, Albena; Yeh, Jeng-Ya; Mawst, Luke; Keuch, Thomas E.; Ellis, Arthur B. Light Emitting Diodes as Chemical Sensors. Nature 2001, 409, 476. [Google Scholar]
- Cho, E. J.; Bright, F.V. Analytical Chemistry; Volume 73, 2001; p. 3289. [Google Scholar]
- Hauser, P.C.; and Litten, J.C. Analytica Chimica Acta; Volume 294, 1994; p. 49. [Google Scholar]
- Lippitsch, M.E.; Draxler, S.; Kieslinger, D. Sensors and Actuators B; Volume 38 – 39, 1997; p. 96. [Google Scholar]
- Tanaka, T.; Guilleux, A.; Ohyama, T.; Maruo, Y.Y.; Hayashi, T. Sensors and Actuators B; Volume 56, 1999; p. 247. [Google Scholar]
- Ohyama, T.; Maruo, Y.Y.; Tanaka, T.; Hayashi, T. Sensors and Actuators B; Volume 64, 2000; p. 142. [Google Scholar]
- Trettnak, W.; Gruber, W.; Reininger, F.; Klimant, I. Sensors and Actuators B; Volume 29, 1995; p. 219. [Google Scholar]
- Yerazunis, W.S.; Diamond, D.; Dietz, P.H. Multi-Way LED-based Chemochromic Sensor US Patent 7,008,795.
- Lau, King Tong; Baldwin, Susan; Shepherd, Roderick L.; Dietz, Paul H.; Yerazunis, William. S.; Diamond, Dermot. Talanta; Vol 63/1, 2004; pp. 167–173. [Google Scholar]
- Lau, King-Tong; Baldwin, Susan; O'Toole, Martina; Shepherd, Roderick; Yerazunis, William J; Izuo, Shinichi; Ueyama, Satoshi; Diamond, Dermot. Analytica Chimica Acta; Volume 557, 2006; pp. 111–116. [Google Scholar]
- Lau, King-Tong; Yerazunis, William S.; Shepherd, Roderick L; Diamond, Dermot. Sensors and Actuators B: Chemical; In Press, Corrected Proof, available online; 20; December; 2005. [Google Scholar]
- O'Toole, Martina; Lau, King-Tong; Diamond, Dermot. Talanta; 2005. [Google Scholar]
- Baldwin, Susan; Lau, King-Tong; Yerazunis, William; Shepherd, Roderick; Diamond, Dermot. IEICE TRANSACTIONS ON ELECTRONICS E87C; 2004; 12, pp. 2099–2102. [Google Scholar]
- Shepherd, Roderick L.; Yerazunis, William S.; Lau, King-Tong; Diamond, Dermot. Proceedings of the third IEEE international conference on sensors; 2004; pp. 951–954.
- Chemistry Gateway: Properties of Aqueous Acid-Base Indicators. http://www.psigate.ac.uk/newsite/reference/chemdata/12.html.


© 2006 by MDPI ( http://www.mdpi.org). Reproduction is permitted for noncommercial purposes.
Share and Cite
Lau, K.T.; Shepherd, R.; Diamond, D.; Diamond, D. Solid State pH Sensor Based on Light Emitting Diodes (LED) As Detector Platform. Sensors 2006, 6, 848-859. https://doi.org/10.3390/s6080648
Lau KT, Shepherd R, Diamond D, Diamond D. Solid State pH Sensor Based on Light Emitting Diodes (LED) As Detector Platform. Sensors. 2006; 6(8):848-859. https://doi.org/10.3390/s6080648
Chicago/Turabian StyleLau, King Tong, R. Shepherd, Danny Diamond, and Dermot Diamond. 2006. "Solid State pH Sensor Based on Light Emitting Diodes (LED) As Detector Platform" Sensors 6, no. 8: 848-859. https://doi.org/10.3390/s6080648