Nucleoside Sensing

1
Marburg University, Department of Chemistry, Hans-Meerwein-Strasse, 35032 Marburg, Germany
2
Duisburg-Essen University, Institute of Organic Chemistry, Universitätsstr. 5, 45117 Essen, Germany
*
Authors to whom correspondence should be addressed.
Sensors 2006, 6(8), 860-873; https://doi.org/10.3390/s6080860
Submission received: 5 April 2006
/
Accepted: 7 June 2006
/
Published: 24 August 2006
(This article belongs to the Special Issue Supramolecular Sensors)
Abstract
:A rigid molecular clip comprising bisphosphonate binding sites and aromatic sidewalls forming an electron-rich cavity is able to distinguish between nucleosides and nucleotides in aqueous solution. Neutral nucleosides as well as antibiotics derived thereof are drawn into the unpolar interior of the cleft and lead to substantial upfield-shifts in the 1H NMR spectrum. Nucleoside drugs can therefore be detected with high selectivity in the presence of their phosphorylated pendants or nucleic acids.
1. Introduction
Nucleoside drugs are of paramount importance in aids or cancer therapy due to their antiviral or antitumor activity. Since it is virtually impossible for highly polar phosphorylated species to pass cell membranes, the respective drugs are administrered as neutral nucleosides, and subsequently activated by intracellular conversion into the 5′-triphosphates. A much more elegant approach is the design of Trojan horses, which are masked nucleotides, i. e., neutral lipophilic prodrugs with decreased polarity [1]. However, even for the nucleosides, it is difficult to pass the blood brain barrier [2], so that carrier molecules are needed which may act as potent transporters. The programmed switch between a neutral and a phosphorylated state poses the challenge to develop selective detection methods. Few examples are available for nucleotide-selective hosts in water, inter alia, based on cyclophane scaffolds [3]. High binding constants (micromolar Kd values) were especially achieved with receptor molecules containing a central phenanthridinium system [4]. To the best of our knowledge, however, no selective artificial receptor molecule has been presented to date which is able to recognize a neutral nucleotide in the presence of an anionic nucleotide. Over the past decades, Klärner et al. have created a large number of rigid molecular clips and tweezers, comprising an electron-rich cavity which is able to accomodate unpolar or cationic small guest molecules [5]. In a cooperation, we have recently rendered the parent molecular clip water-soluble by adorning the central benzene ring with methyl phosphonate functionalities and found efficient binding of cationic aromatic substrates such as NAD+ (Figure 1) [6]. Now we discovered that neutral electron-deficient guests are also included inside the electron-rich cavity. The question arose, if these molecules could indeed be utilized for nucleoside sensing.
2. Results and Discussion
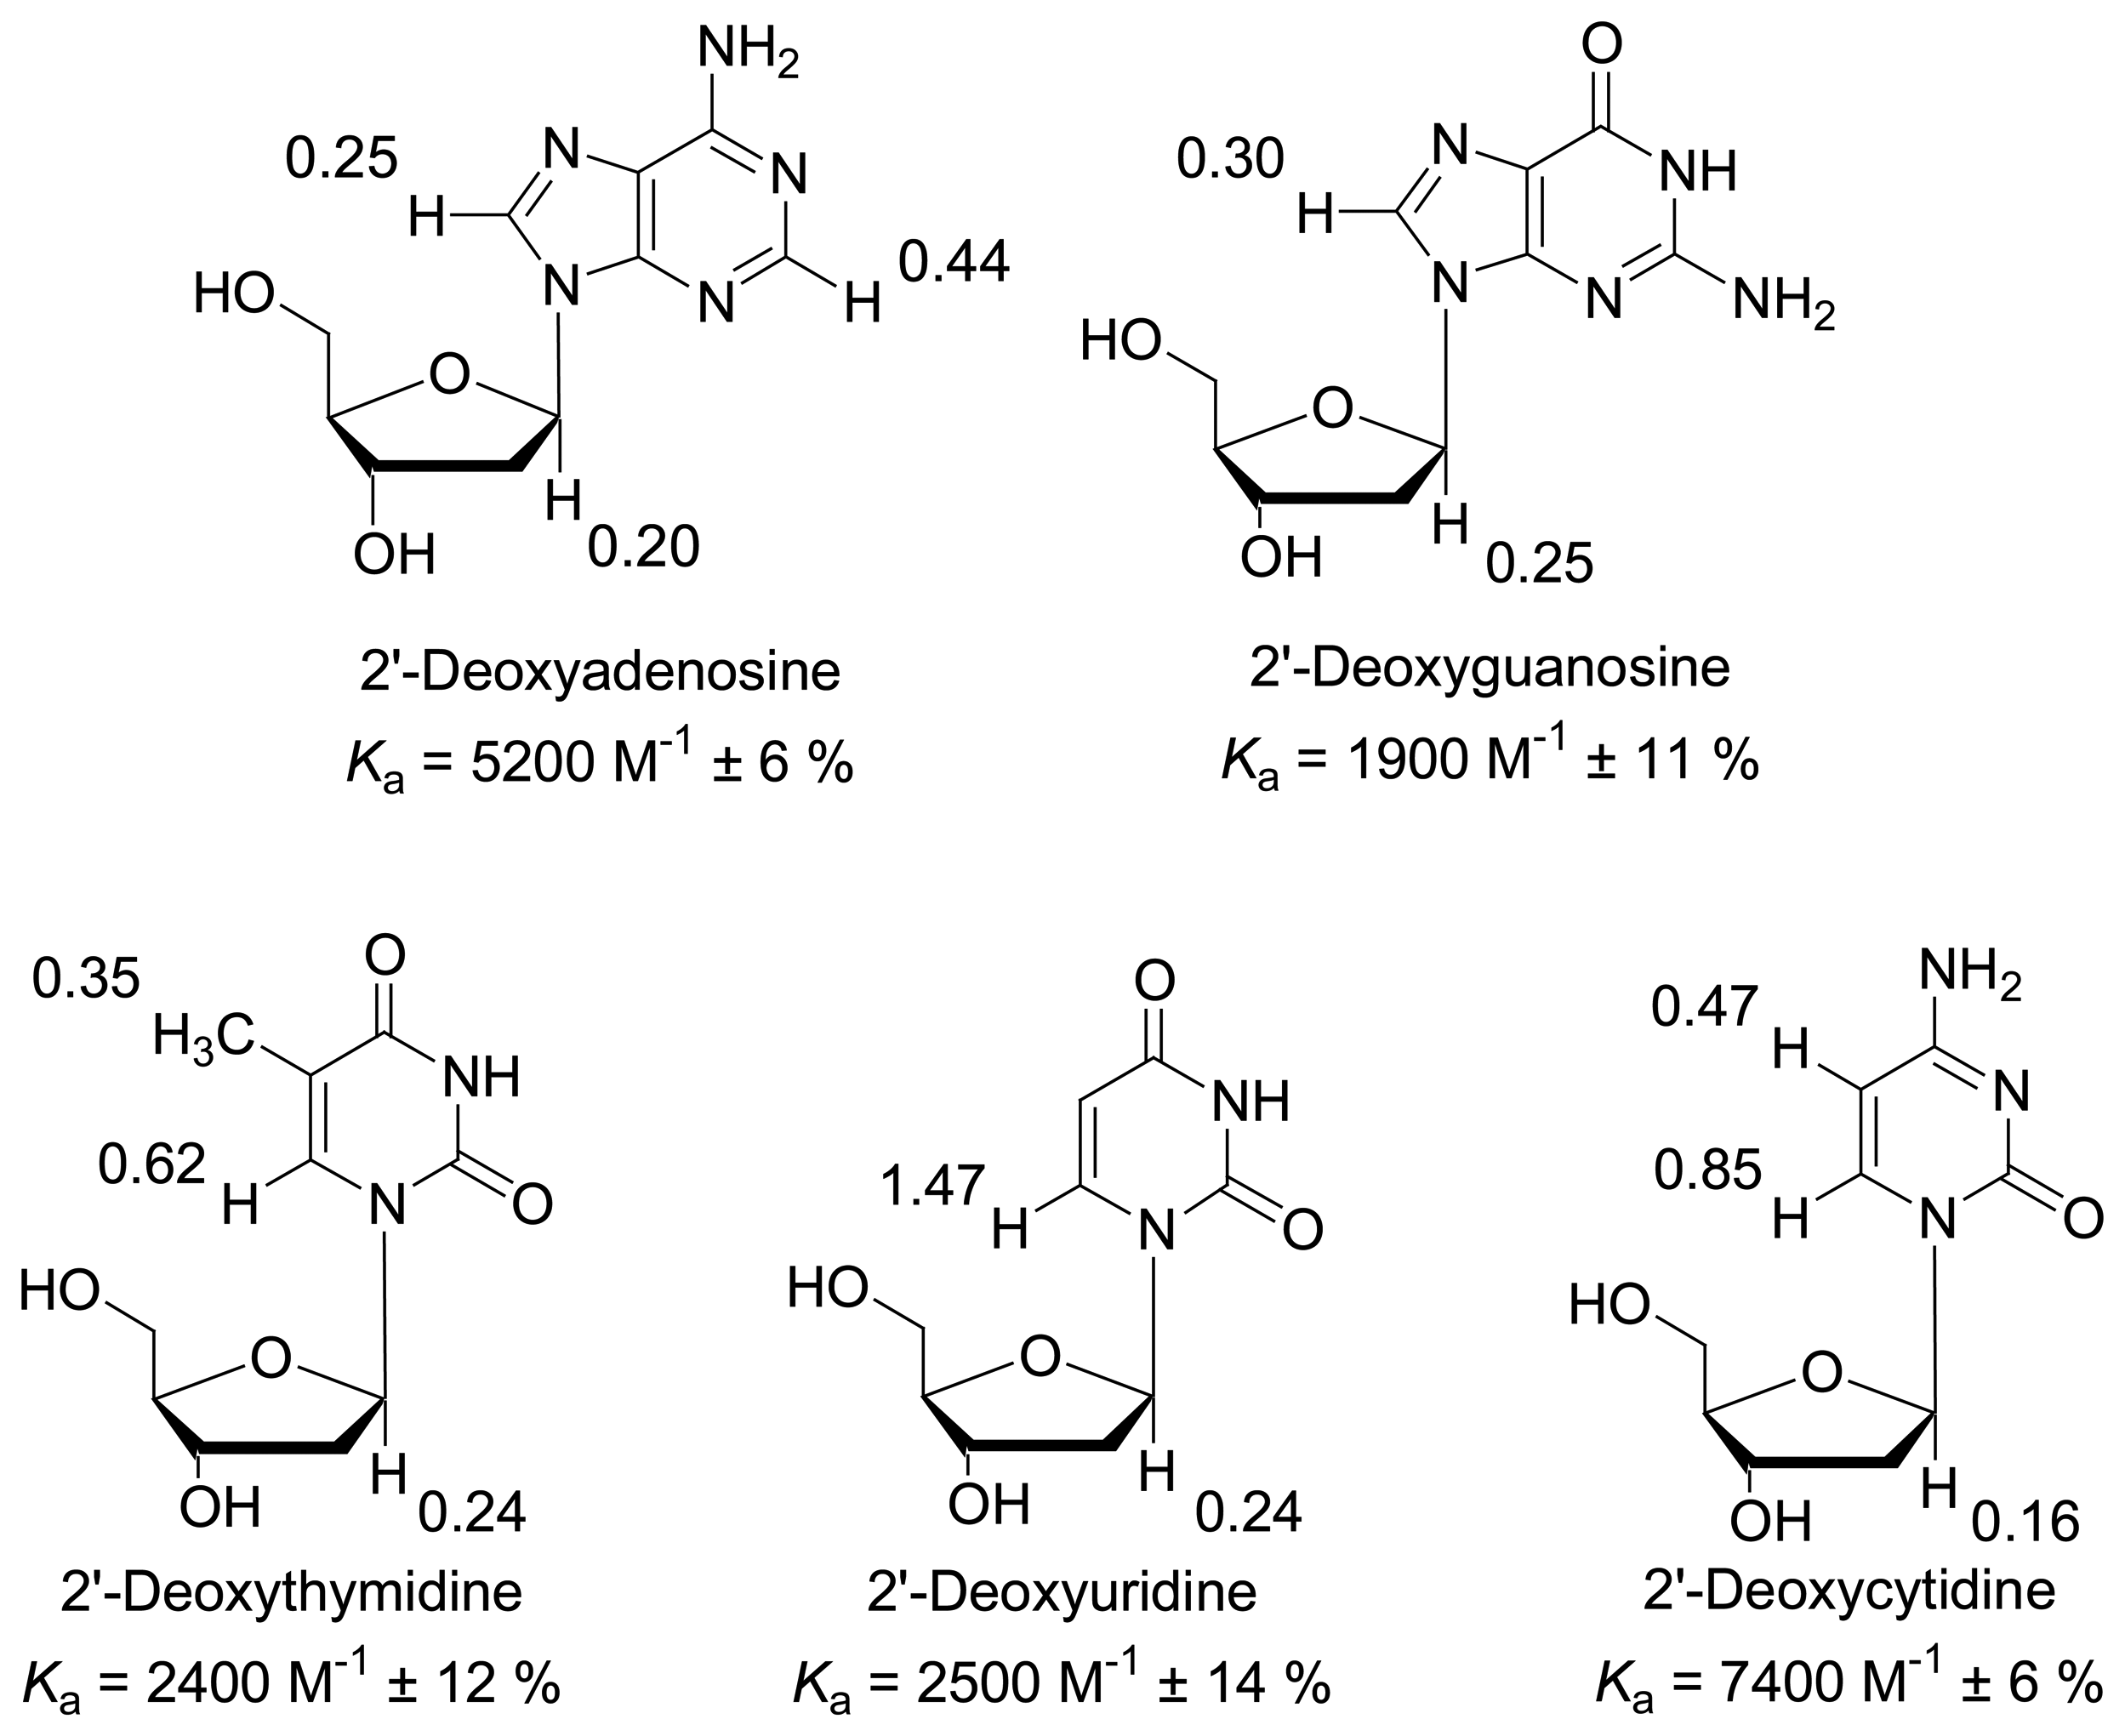
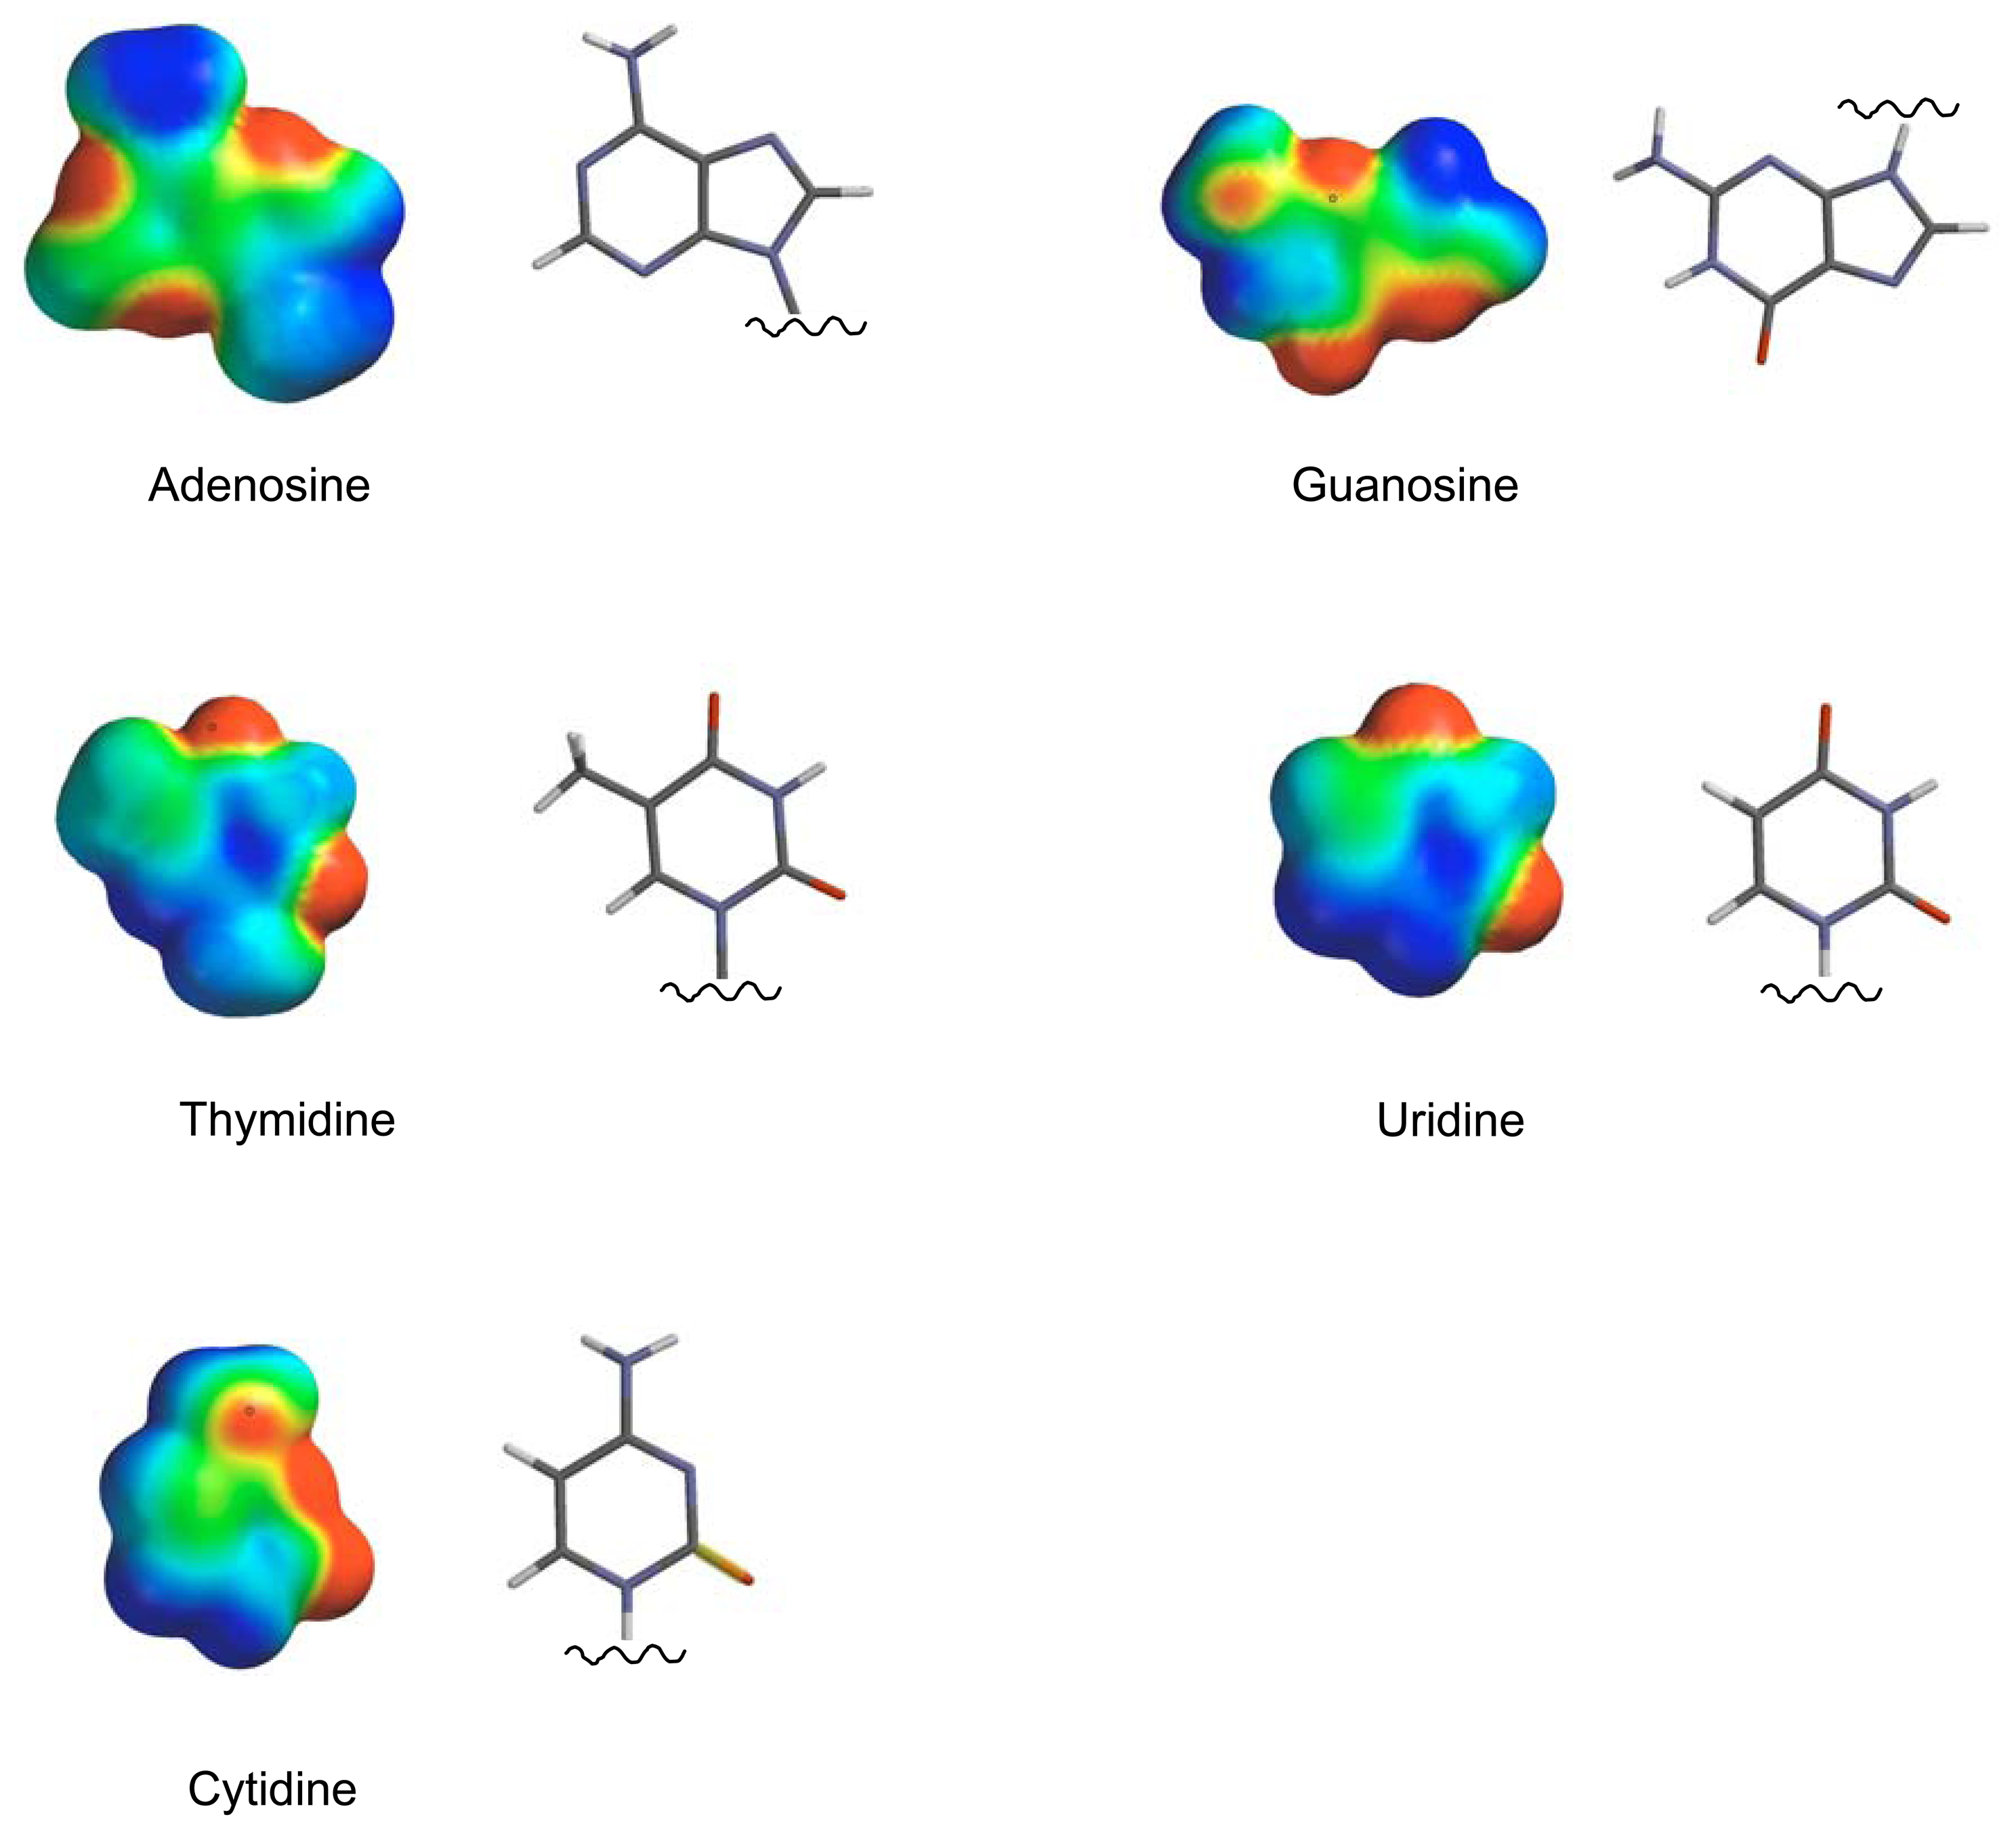
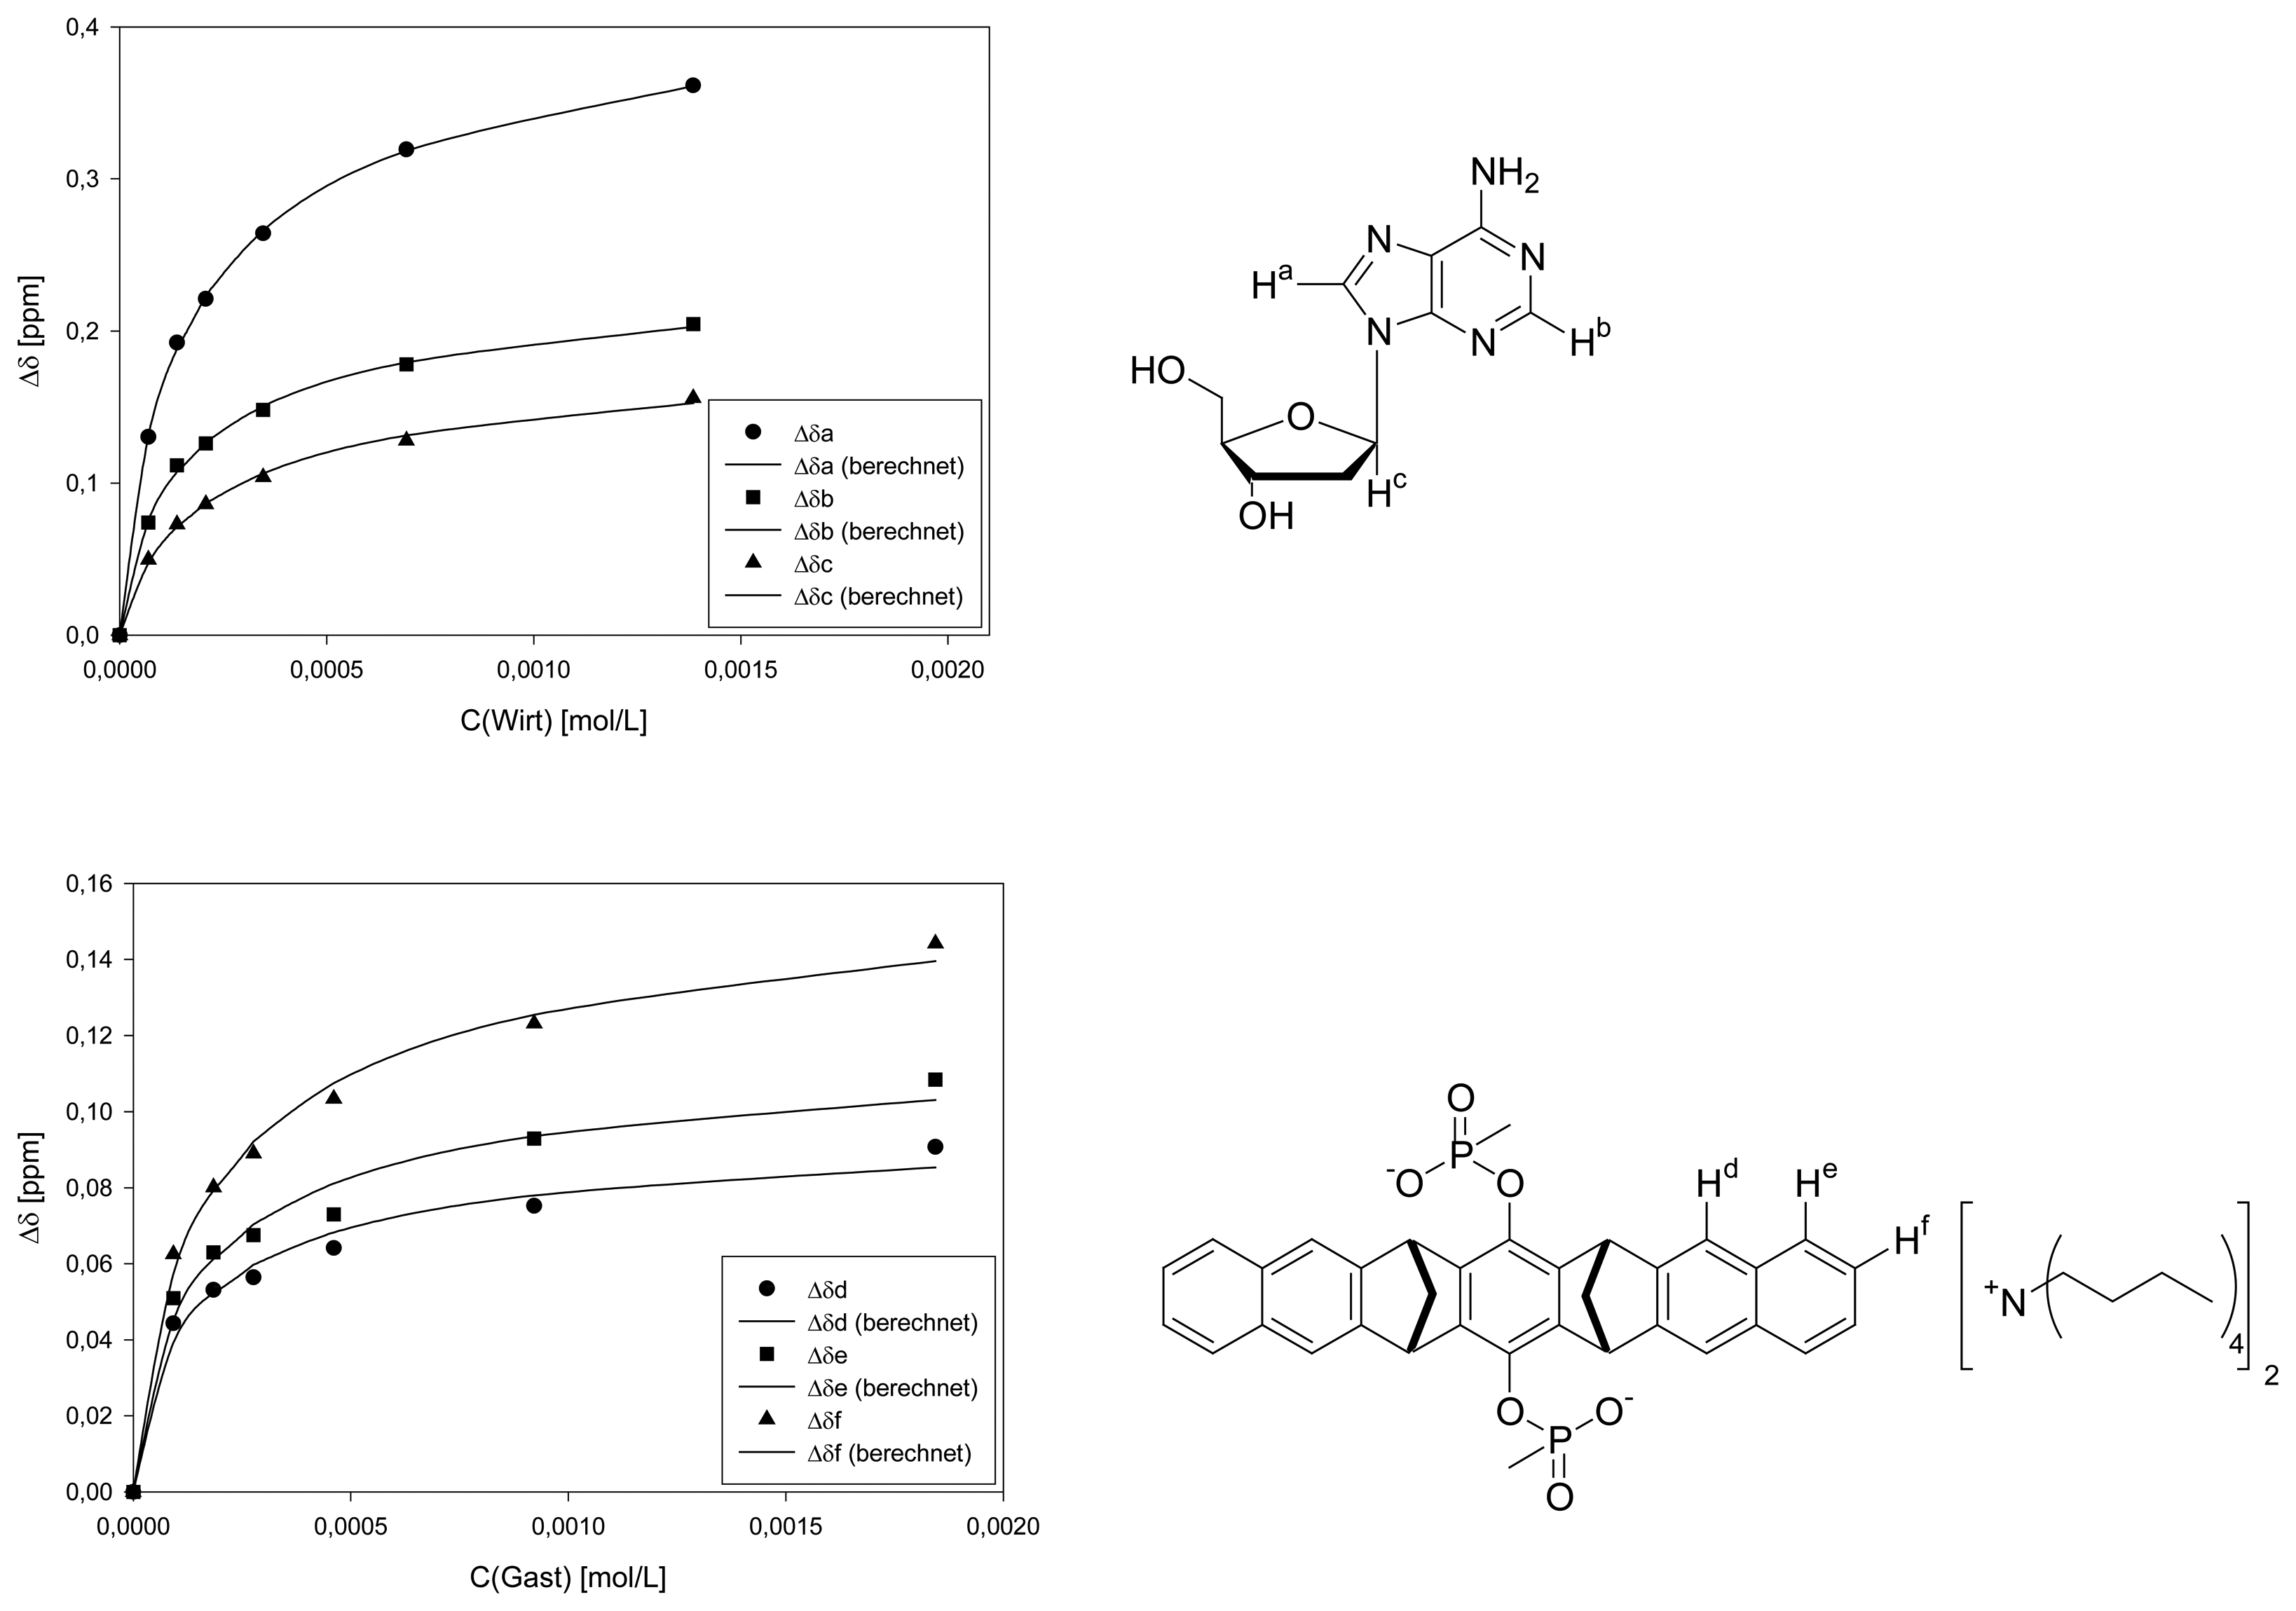
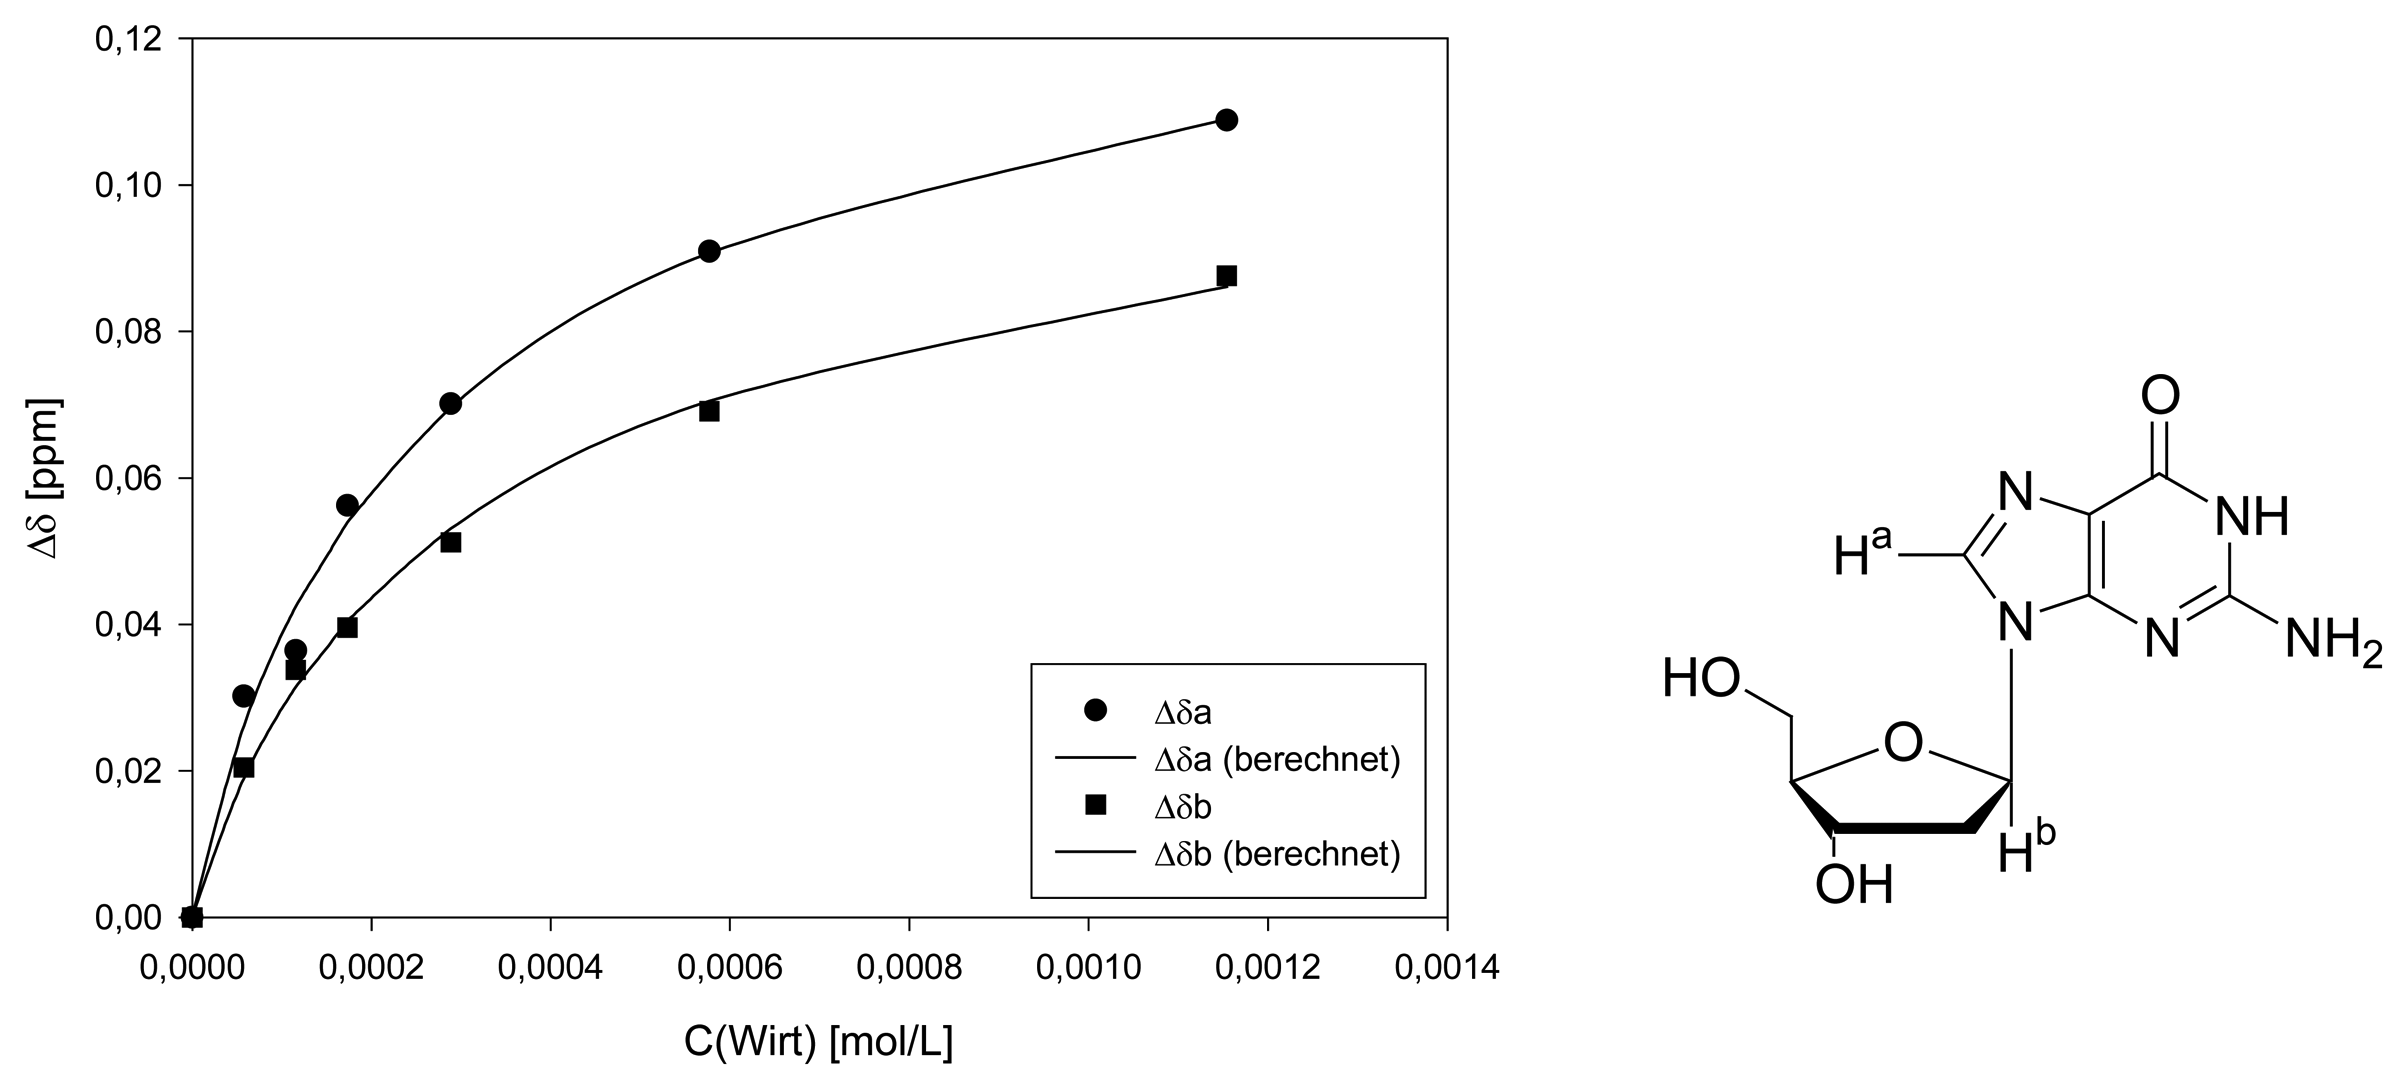
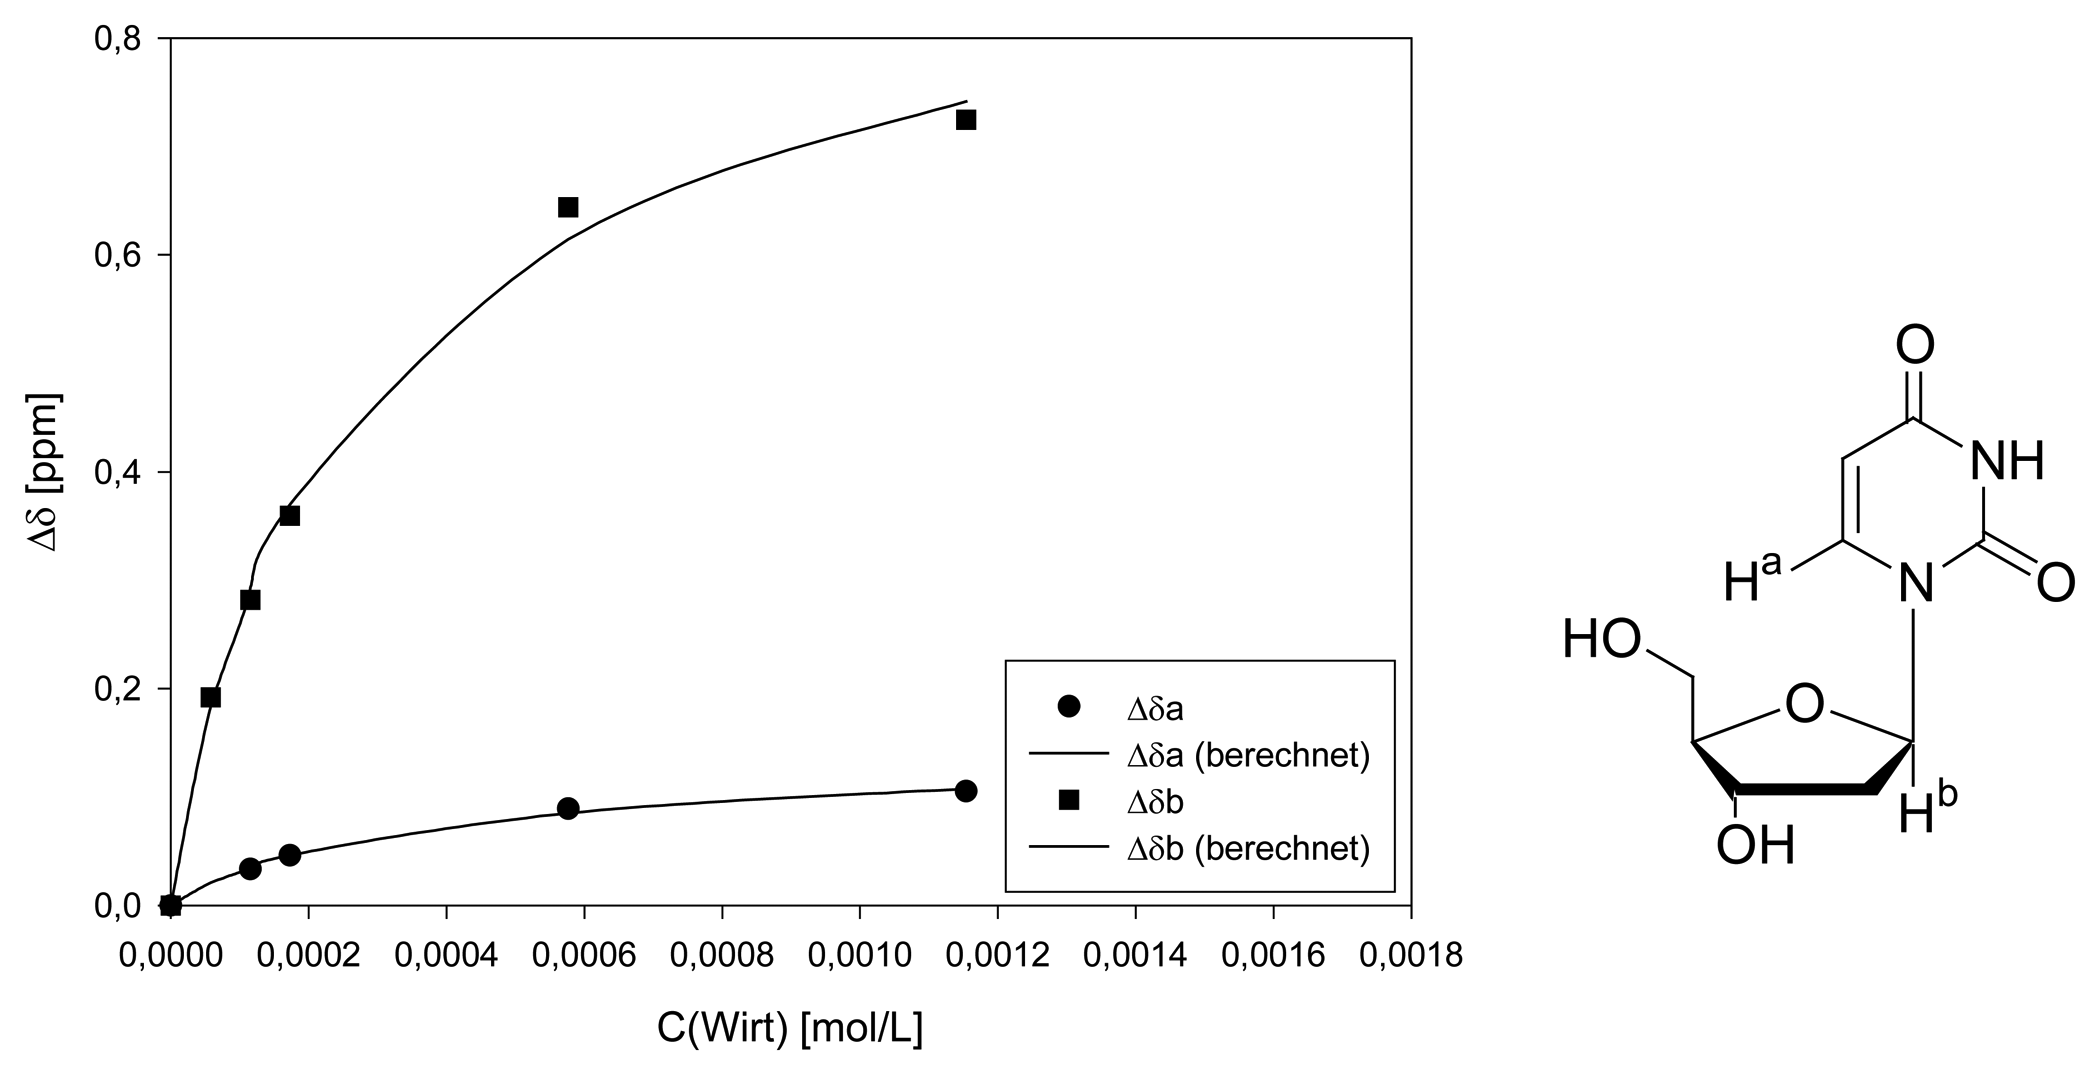
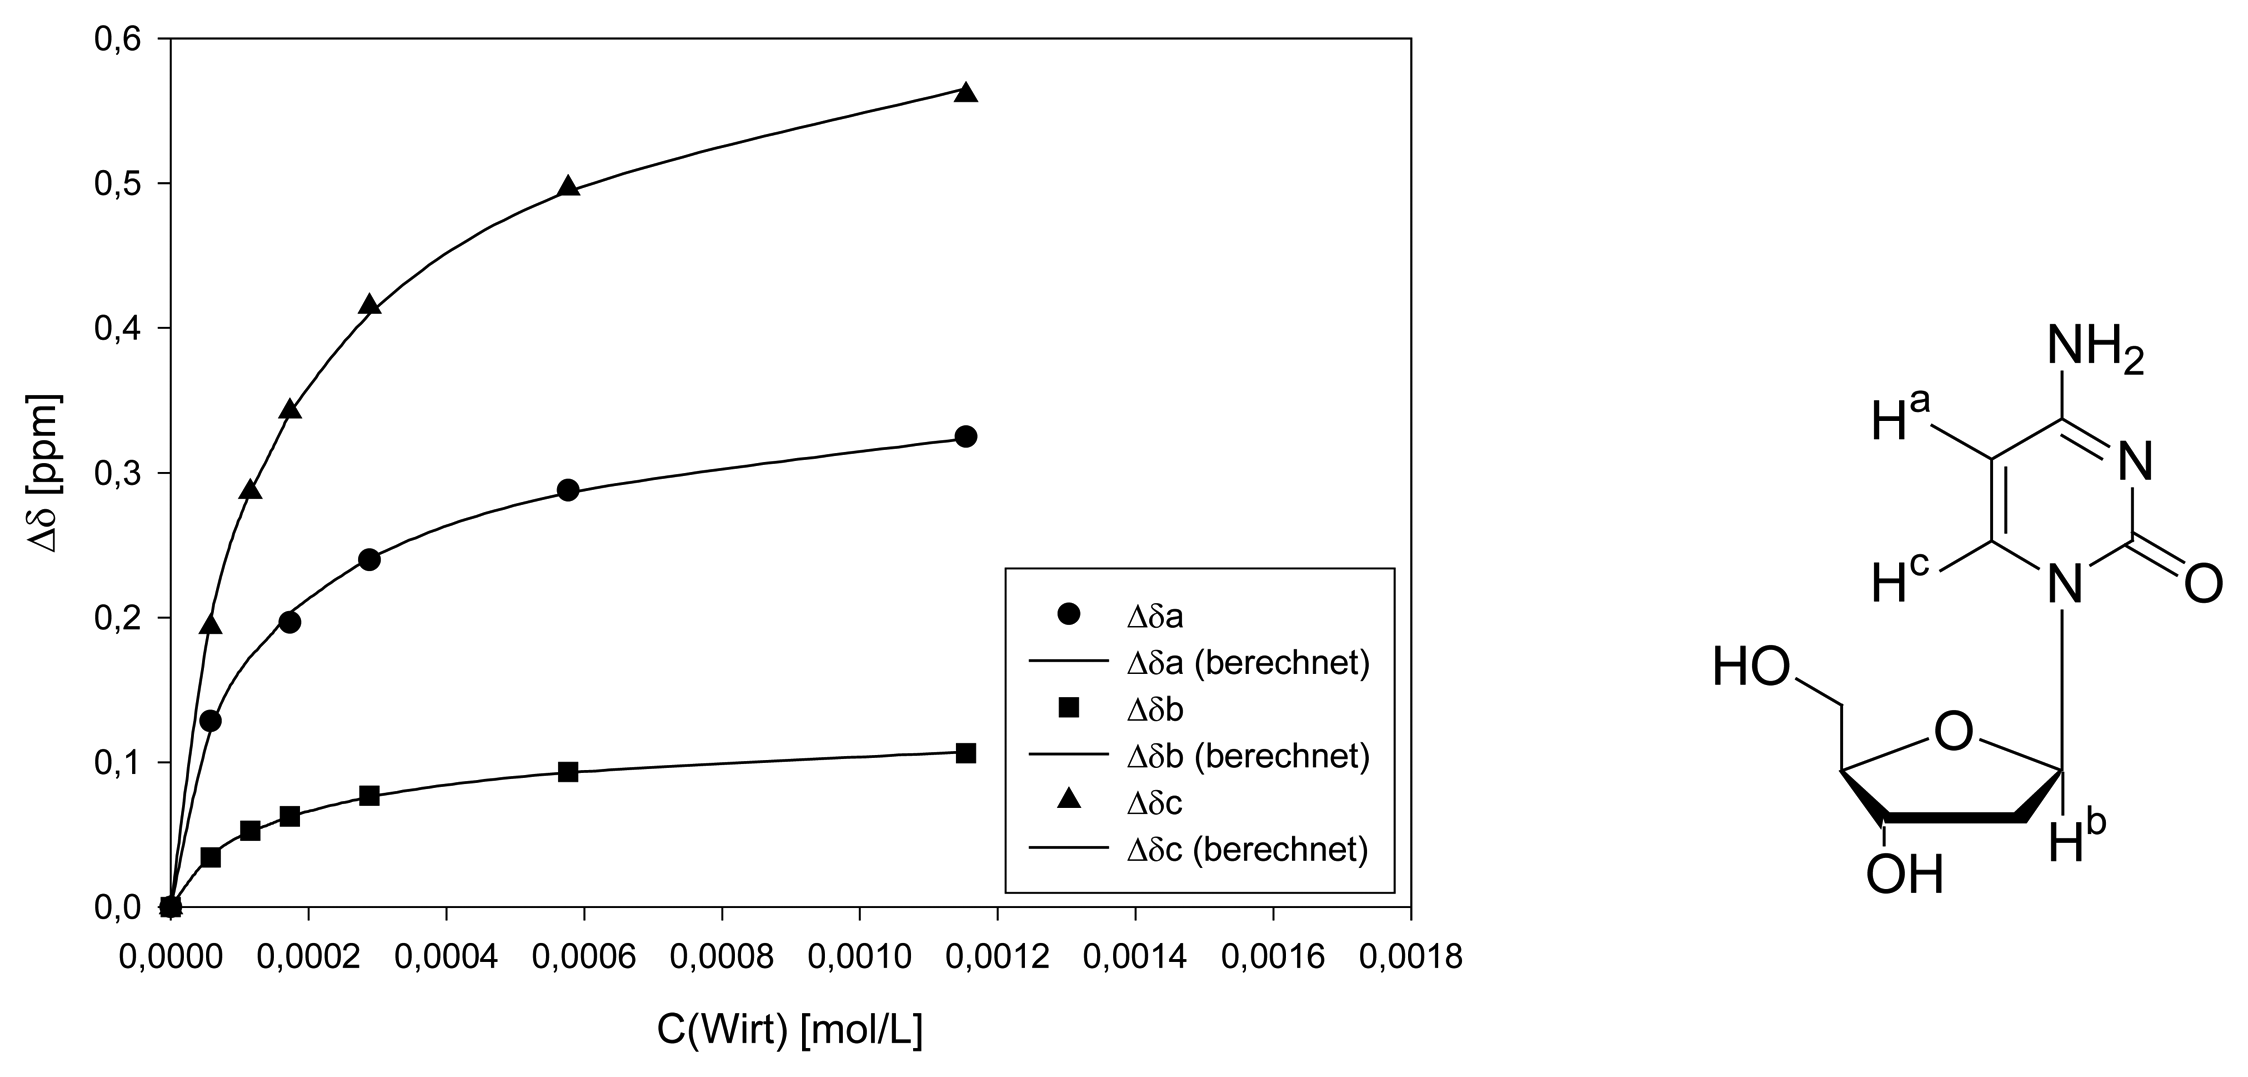
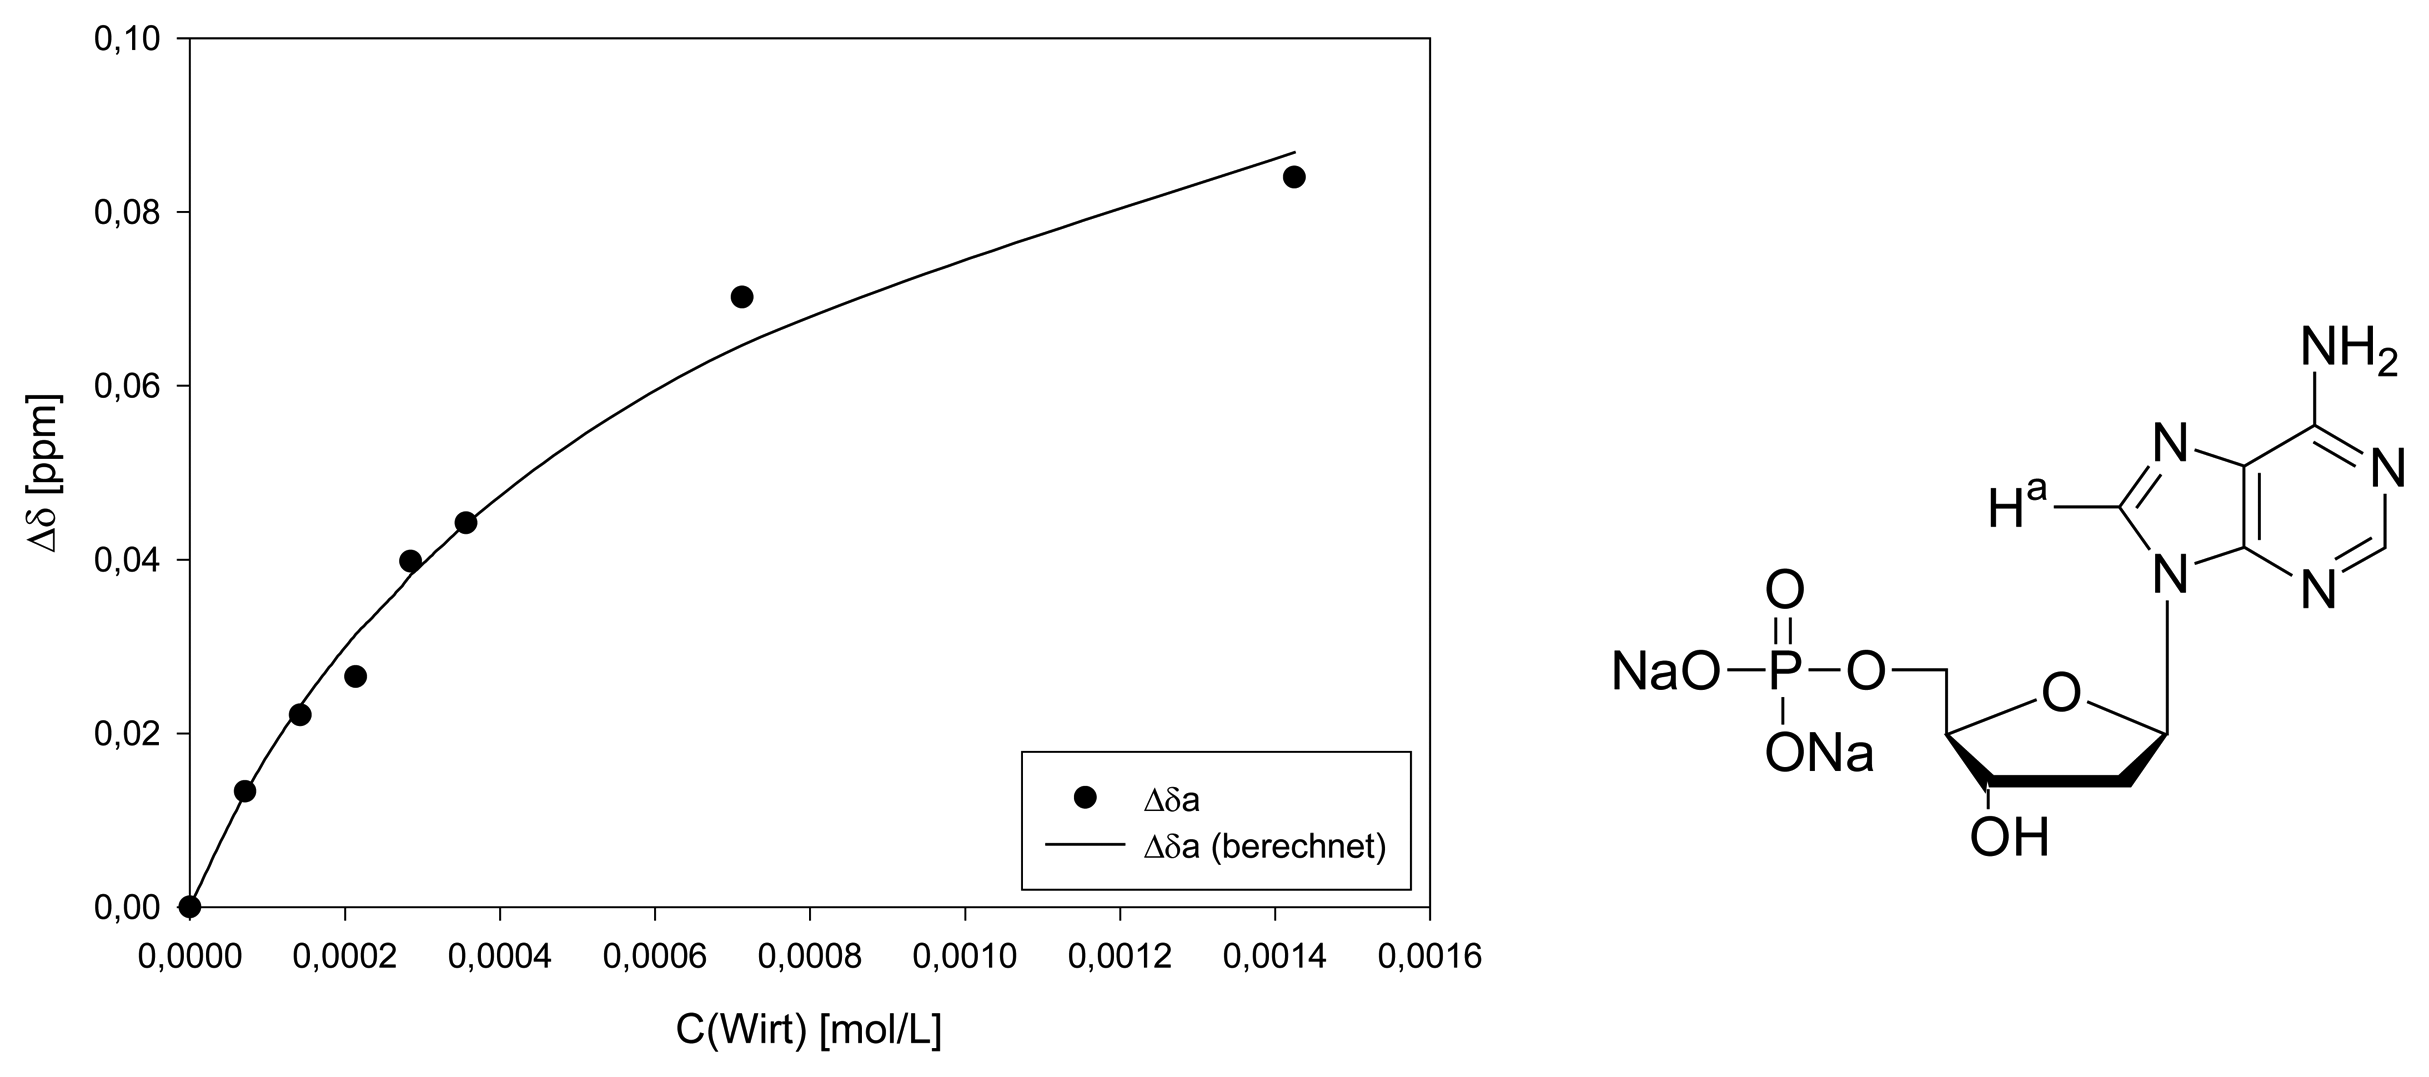
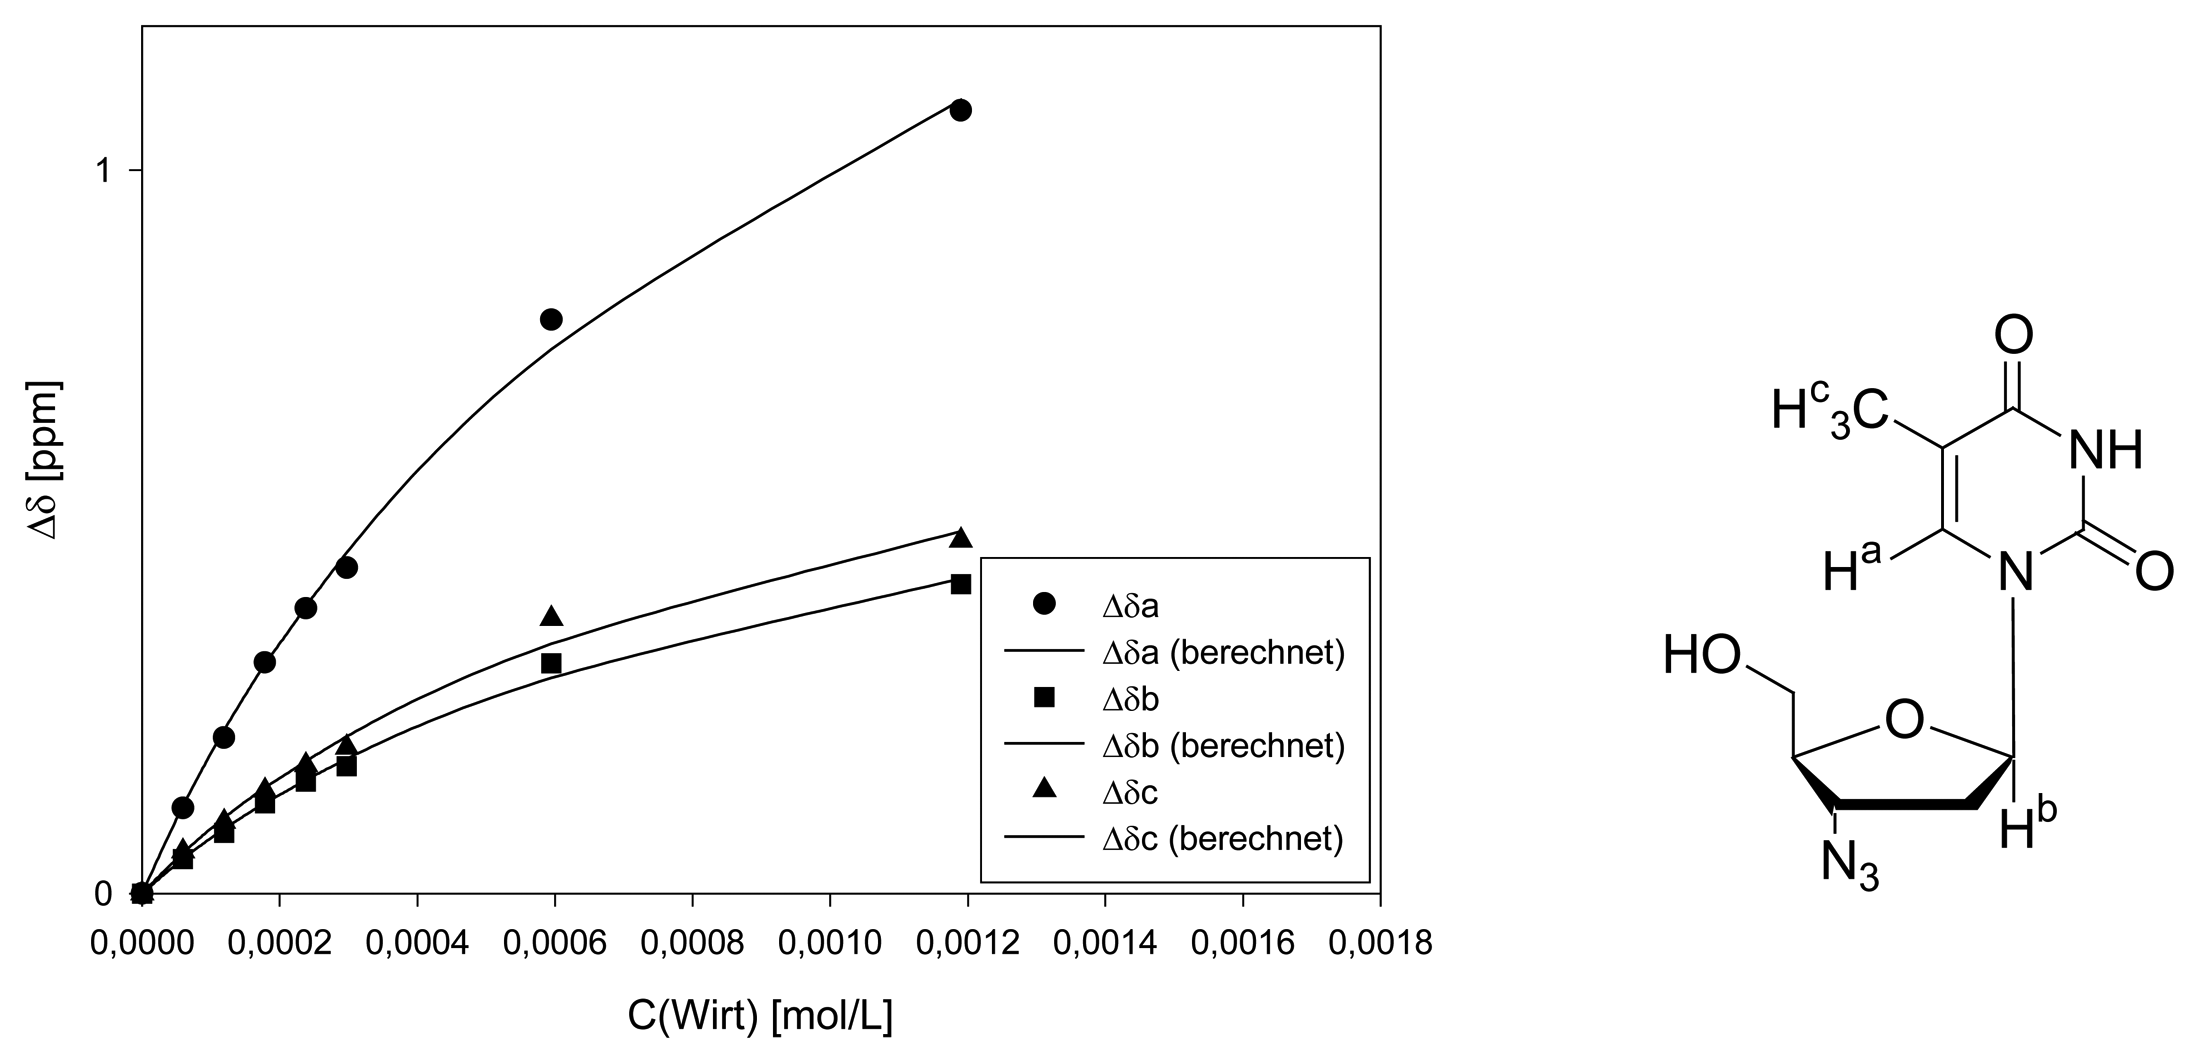
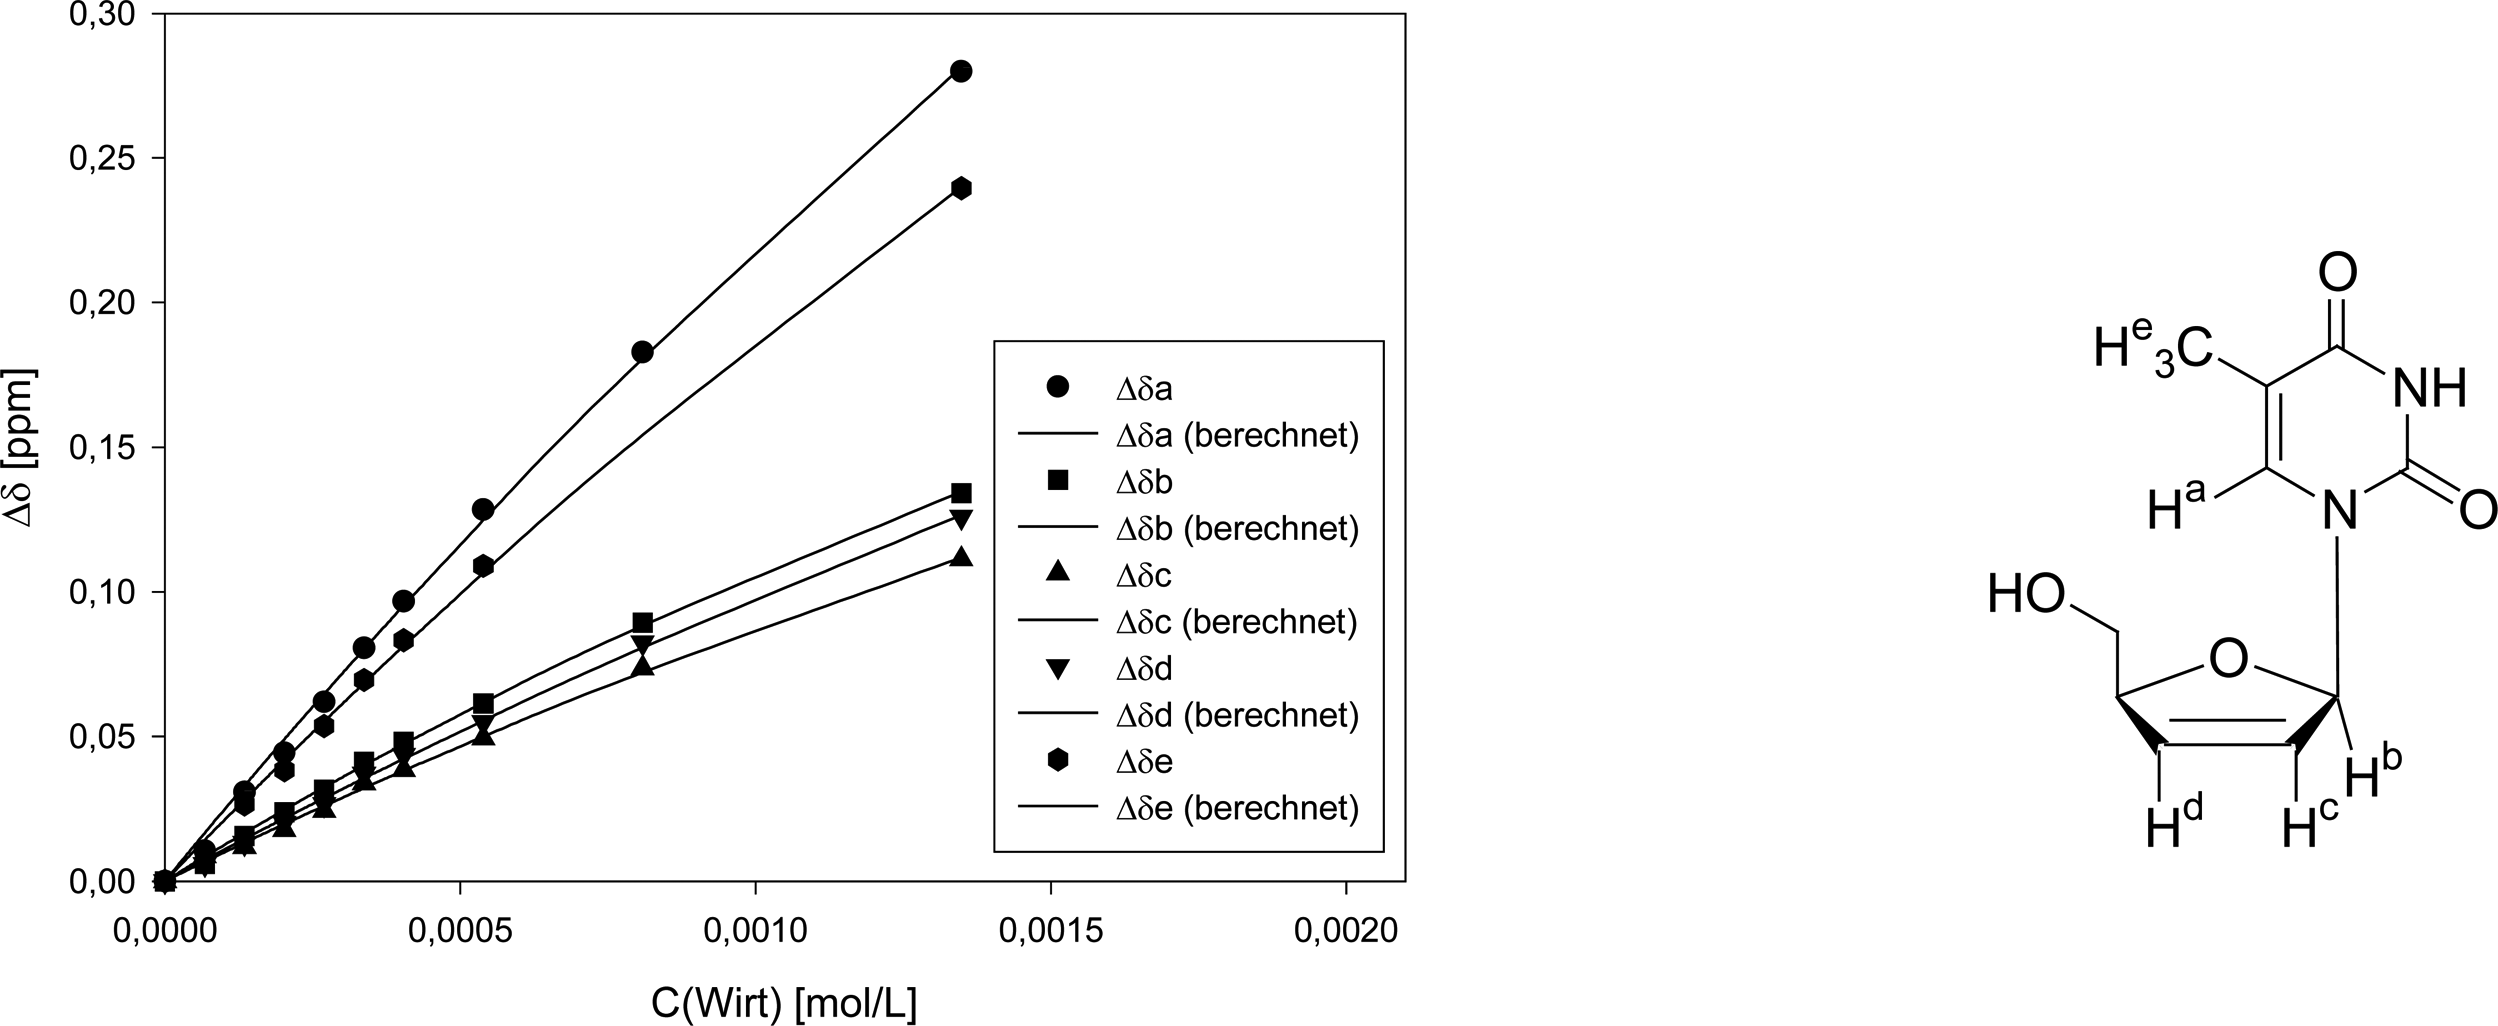
NMR titrations indicate inclusion in the clip cavity by substantial upfield shifts of all guest protons involved. They also allow determination of binding constants and estimation of the binding mode [7]. All nucleosides and mononucleotides were tested systematically - the respective Ka values are listed in Figure 2. At first glance it becomes evident, that only the neutral nucleoside candidates are bound by the clip, whereas the negatively charged nucleotides are rejected, except for AMP. The reason is obviously electrostatic repulsion between the host and guest phosph(on)ate moieties. Nucleosides are bound with Ka values between 2000 and 7000 M-1, most likely depending on the size of their π-face as well as their electrostatic potential surface (Figure 3). Carbonyl groups are counterproductive due to their large dipole moment - and lead to repulsion from the electron-rich inner cavity wall. Since large π-faces are hard to desolvate in aqueous solution, the nonpolar microenvironment of the clip cavity greatly facilitates this process and leads to a positive free energy balance of the inclusion process.
Upfield shifts in the nucleic bases amount to 1-2 ppm (Δδmax), whereas those in the ribose part are small (0-0.2 ppm), indicating that the aromatic electron-poor heterocycle is preferentially bound by the clip and the much more polar ribose part remains oriented towards the solvent. The exact orientation inside the cavity has in related cases already been calculated very successfully with quantum chemical methods, and could definitely be applied to these interesting complexes as well [8]. By contrast, except for AMP with its relatively large π-face no chemical shift changes were observed after equilibration with nucleotide guests, irrespective of the number of phophate groups present (Δδ < 0.03 ppm). Thus, mono-, di- and triphosphates such as ATP are all rejected by the clip. This renders 1 highly selective for nucleosides.
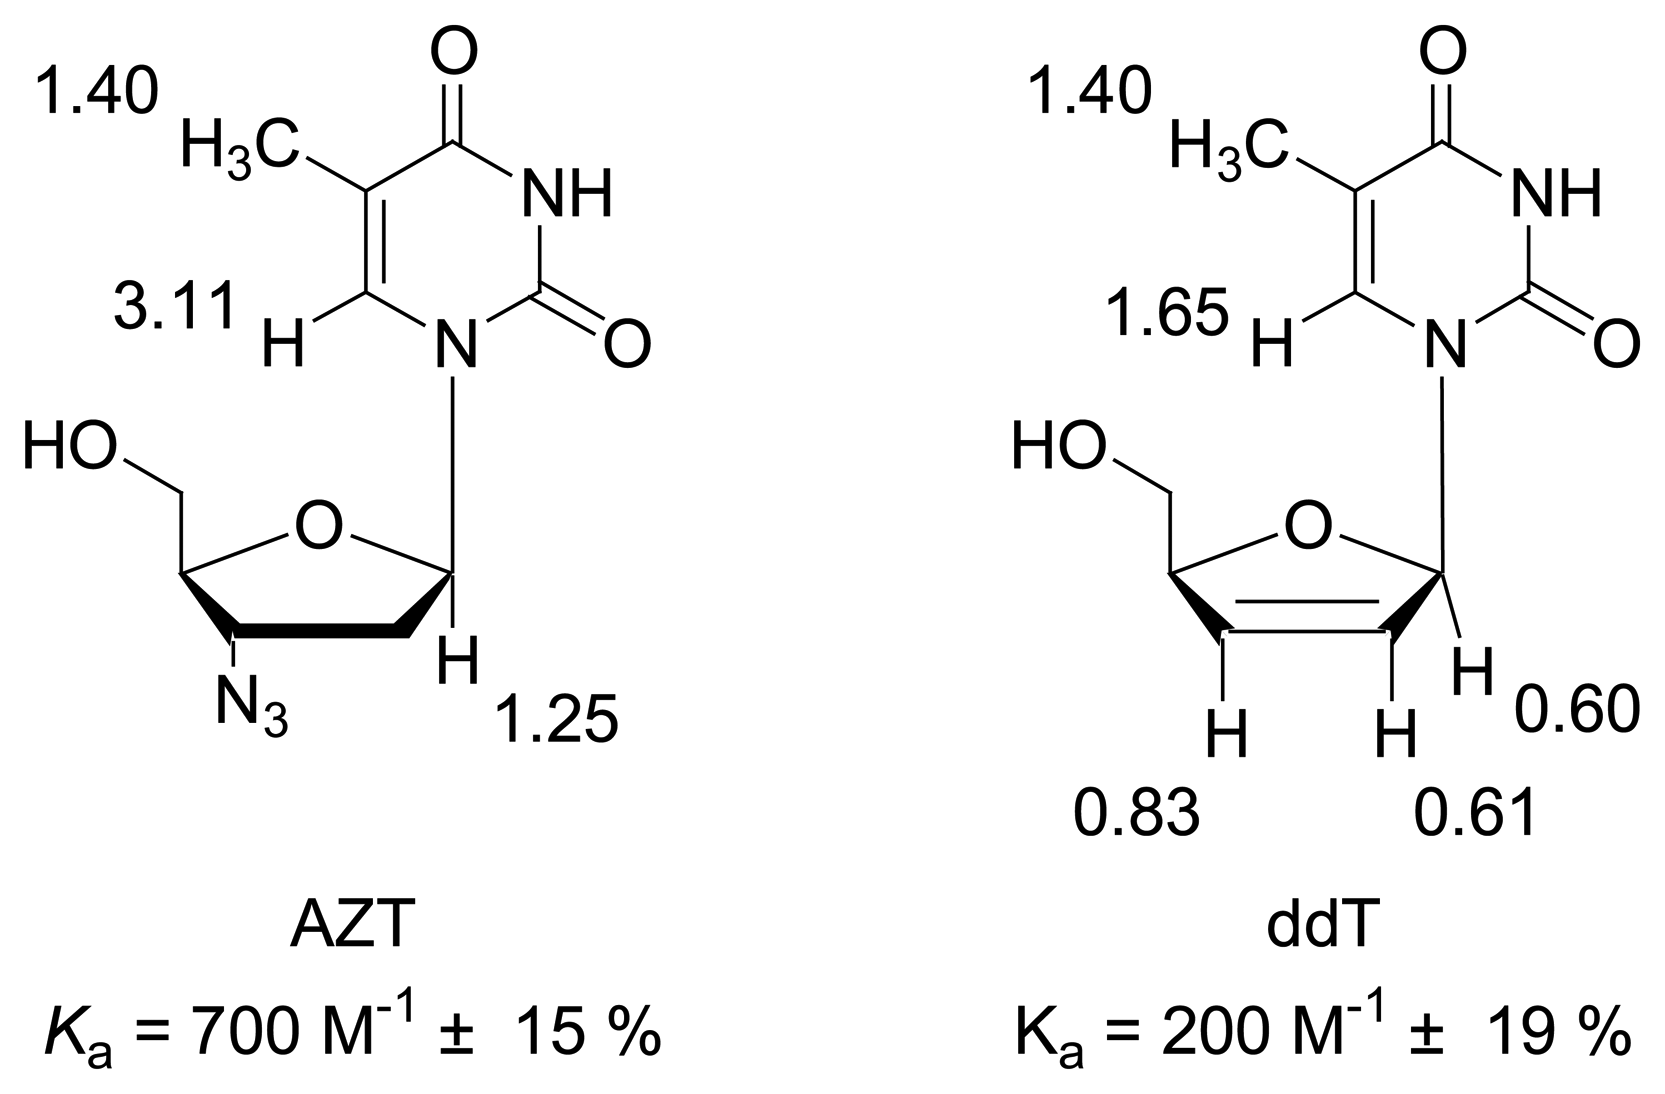
Nucleoside antibiotics such as 3′-azido-2′,3′-dideoxythymidine (AZT) and 2′,3′-didehydro-2′,3′-dideoxythymidine (ddT) are highly potent inhibitors of the human immunodeficiency virus HIV [9]. These also bind to the clip, albeit with lowered affinity. Obviously, the altered ribose skeleton poses steric constraints on the inclusion of the heterocyclic fragment. Probable complex geometries, which are in agreement with NMR data, are depicted in Figure 4.
In the future, we intend to test, if the complex of a nucleoside inside the clip penetrates membranes more easily than the drug itself. If successful, the clip could be further modified to carry additional lipophilic groups and be used as a carrier for nucleoside drugs across the BBB. Precomplexation of a solvatochromic dye within the clip cavity which is subsequently released on nucleoside binding and thereby changes its color, would lead to a real sensor system with a quantifyable visible readout. Experiments in this direction are underway in our laboratories.
3. Experimental Section
General procedure for NMR titrations with clip 1 and nucleos(t)ide guests:
- a)
- dilution titration: host and guest were dissolved as a 1:1 mixture in D2O and an NMR spectrum was measured. Subsequently, the solution was diluted several times with D2O. Pure host as well as pure guest solutions of varying concentrations were also measured and compared with respect to their proton shifts. Only those proton signals which are insensitive towards dilution, can be used as probes. All NMR spectra were routinely calibrated onto the rest proton signal of the deuterated solvent (D2O: 4.700 ppm). The corresponding binding constants and Δδsat values were obtained by standard nonlinear regression.
- b)
- conventional titration: ten NMR tubes were filled each with the same amount of a solution of the guest in D2O. The host solution (D2O) was added in increasing volume increments to tubes 2-10. All tubes were subsequently filled with pure solvent to the very same total volume to exclude potential dilution effects. Tube 1 served as the reference. The guest concentration was estimated at the reciprocal value of the expected association constant (Kd). NMR spectra were calibrated onto the rest proton signal of the deuterated solvent (D2O: 4.700 ppm). The corresponding binding constants and Δδsat values were obtained by standard nonlinear regression.
Job plots
The samples from the conventional NMR titrations with constant concentrations and varying host and guest ratios were used for the indirect determination of the complex stoichiometries from their respective molar fractions. These were multiplied with Δδ and plotted against the molar fraction itself. Maxima indicate the molar fraction of host or guest which produce the largest complex concentration and therefore simultaneously indicate the complex stoichiometry.
Molecular Modeling
The program MacroModel 7.1 was used for model building procedures and as graphical interface. Force-field parameters were taken from the built-in force fields, OPLS-AA or Amber* were chosen for all minimizations and Monte Carlo simulations. Minimizations and Monte Carlo simulations were carried out in aqueous solution. Energy minimizations were conducted over 1000 iterations on a Silicon Graphics O2 workstation. The best structures were subjected to conformational searches with 5000 or 10000-step Monte Carlo simulations.
Acknowledgments
We gratefully acknowledge supply with AZT and ddT by Prof. Chris Meier, Hamburg.
Supplementary Information
Dilution titration between clip 1 and 2′-deoxythymidine
Parent solution: 0.745 mg (0.690 μmol) host 1 and 0.370 mg (1.526 μmol) 2′-deoxythymidine in 500 μL D2O.

| entry | Vparent solution (μL) | Vtotal (μL) | cguest (mol/L) | chost (mol/L) | δa (ppm) | δb (ppm) | δc (ppm) | δd (ppm) | δe (ppm) |
|---|---|---|---|---|---|---|---|---|---|
| 0 | reference | 500 | 3.05·10-3 | 1.38·10-3 | 7.6106 | 6.2600 | 1.8545 | 7.6747 | 7.3326 |
| 1 | 25 | 500 | 1.53·10-4 | 6.90·10-5 | 7.5398 | 6.2401 | 1.8213 | 7.6592 | 7.3011 |
| 2 | 50 | 500 | 3.05·10-4 | 1.38·10-4 | 7.4923 | 6.2246 | 1.7929 | 7.6503 | 7.3000 |
| 3 | 75 | 500 | 4.58·10-4 | 2.07·10-4 | 7.4735 | 6.2180 | 1.7860 | 7.6481 | 7.2867 |
| 4 | 125 | 500 | 7.63·10-4 | 3.45·10-4 | 7.4448 | 6.2069 | 1.7672 | 7.6426 | 7.2801 |
| 5 | 250 | 500 | 1.53·10-3 | 6.90·10-4 | 7.4072 | 6.1914 | 1.7451 | 7.6339 | 7.2679 |
| 6 | 500 | 500 | 3.05·10-3 | 1.38·10-3 | 7.3751 | 6.1760 | 1.7263 | 7.6194 | 7.2525 |
| Δδsat (ppm) | 0.6184 ± 2% | 0.2379 ± 2% | 0.3495 ± 3% | 0.0617 ± 5% | 0.0869 ± 5% | ||||
| Ka (mol/L) | 2701 ± 6% | 1707 ± 7% | 2184 ± 10% | 2162 ± 16% | 3064 ± 21% | ||||

Dilution titration of clip 1 with 2′-deoxyguanosine
Parent solution: 0.745 mg (0.690 μmol) host 1 and 0.416 mg (1.459 μmol) 2′-deoxyguanosine in 600 μL D2O.
| entry | Vparent solution (μL) | Vtotal (μL) | cguest (mol/L) | chost (mol/L) | δa (ppm) | δb (ppm) |
|---|---|---|---|---|---|---|
| 0 | reference | 600 | 2.43·10-3 | - | 8.0212 | 6.3408 |
| 1 | 30 | 600 | 1.22·10-4 | 5.77·10-5 | 7.9910 | 6.3203 |
| 2 | 60 | 600 | 2.43·10-4 | 1.15·10-4 | 7.9848 | 6.3070 |
| 3 | 90 | 600 | 3.65·10-4 | 1.73·10-4 | 7.9650 | 6.3012 |
| 4 | 150 | 600 | 6.08·10-4 | 2.89·10-4 | 7.9511 | 6.2896 |
| 5 | 300 | 600 | 1.22·10-3 | 5.77·10-4 | 7.9303 | 6.2717 |
| 6 | 600 | 600 | 2.43·10-3 | 1.12·10-3 | 7.9124 | 6.2532 |
| Δδsat (ppm) | 0.3033 ± 5% | 0.2480 ± 4% | ||||
| Ka (mol/L) | 2000 ± 13% | 1718 ± 9% | ||||
Dilution titration of clip 1 with 2′-deoxyadenosine
Parent solution: 0.745 mg (0.690 μmol) host 1 and 0.239 mg (0.922 μmol) 2′-deoxyadenosine in 500 μL D2O.
| entry | Vparent solution (μL) | Vtotal (μL) | cguest (mol/L) | chost (mol/L) | δa (ppm) | δb (ppm) | δc (ppm) | δd (ppm) | δe (ppm) | δf (ppm) |
|---|---|---|---|---|---|---|---|---|---|---|
| 0 | reference | 500 | 1.84·10-3 | 1.38·10-3 | 8.2903 | 8.2096 | 6.4556 | 7.6957 | 7.6747 | 7.3326 |
| 1 | 25 | 500 | 9.22·10-5 | 6.90·10-5 | 8.1599 | 8.1355 | 6.4059 | 7.6514 | 7.6238 | 7.2701 |
| 2 | 50 | 500 | 1.84·10-4 | 1.38·10-4 | 8.0980 | 8.0980 | 6.3826 | 7.6426 | 7.6117 | 7.2525 |
| 3 | 75 | 500 | 2.77·10-4 | 2.07·10-4 | 8.0836 | 8.0692 | 6.3694 | 7.6393 | 7.6072 | 7.2436 |
| 4 | 125 | 500 | 4.61·10-4 | 3.45·10-4 | 8.0615 | 8.0261 | 6.3517 | 7.6316 | 7.6017 | 7.2292 |
| 5 | 250 | 500 | 9.22·10-4 | 6.90·10-4 | 8.0316 | 7.9709 | 6.3275 | 7.6205 | 7.5818 | 7.2094 |
| 6 | 500 | 500 | 1.84·10-3 | 1.38·10-3 | 8.0051 | 7.9289 | 6.2997 | 7.6050 | 7.5663 | 7.2884 |
| Δδsat (ppm) | 0.5955 ± 1% | 0.3318 ± 2% | 0.2660 ± 3% | 0.1308 ± 6% | 0.1602 ± 6% | 0.1662 ± 4% | ||||
| Ka (mol/L) | 5771 ± 3% | 6068 ± 6% | 4115 ± 8% | 10300 ± 25% | 9076 ± 25% | 7710 ± 14% | ||||
| (averaged Ka value only from guest signals) | ||||||||||

Dilution titration of clip 1 with 2′-deoxyuridine
Parent solution: 0.745 mg (0.690 μmol) host 1 and 0.220 mg (0.965 μmol) 2′-deoxyuridine in 700 μL D2O.
| entry | Vparent solution (μL) | Vtotal (μL) | cguest (mol/L) | chost (mol/L) | δa (ppm) | δb (ppm) |
|---|---|---|---|---|---|---|
| 0 | reference | 600 | 1.61·10-3 | - | 6.2339 | 5.8324 |
| 1 | 30 | 600 | 8.05·10-5 | 5.77·10-5 | - | 5.6402 |
| 2 | 60 | 600 | 1.61·10-4 | 1.15·10-4 | 6.2005 | 5.5505 |
| 3 | 90 | 600 | 2.41·10-4 | 1.73·10-4 | 6.1877 | 5.4730 |
| 4 | 300 | 600 | 8.04·10-4 | 5.77·10-4 | 6.1446 | 5.1885 |
| 5 | 600 | 600 | 1.61·10-3 | 1.12·10-3 | 6.1286 | 5.1079 |
| Δδsat (ppm) | 1.465 ± 5% | 0.2384 ± 6% | ||||
| Ka (mol/L) | 3012 ± 12% | 1922 ± 16% | ||||
Dilution titration of clip 1 with 2′-deoxycytidine
Parent solution: 0.745 mg (0.690 μmol) host 1 and 0.194 mg (0.793 μmol) 2′-deoxycitidine in 600 μL D2O.
| entry | Vparent solution (μL) | Vtotal (μL) | cguest (mol/L) | chost (mol/L) | δa (ppm) | δb (ppm) | δc (ppm) |
|---|---|---|---|---|---|---|---|
| 0 | reference | 600 | 1.32·10-3 | - | 7.8492 | 6.3008 | 6.0741 |
| 1 | 30 | 600 | 6.61·10-5 | 5.77·10-5 | 7.7209 | 6.2665 | 5.8807 |
| 2 | 60 | 600 | 1.32·10-4 | 1.15·10-4 | - | 6.2481 | 5.7873 |
| 3 | 90 | 600 | 1.98·10-4 | 1.73·10-4 | 7.6527 | 6.2381 | 5.7319 |
| 4 | 250 | 600 | 3.30·10-4 | 2.89·10-4 | 7.6096 | 6.2239 | 5.6595 |
| 5 | 300 | 600 | 6.61·10-4 | 5.77·10-4 | 7.5615 | 6.2074 | 5.5775 |
| 6 | 600 | 600 | 1.32·10-3 | 1.15·10-3 | 7.5244 | 6.1945 | 5.5133 |
| Δδsat (ppm) | 0.4738 ± 2% | 0.1646 ± 1% | 0.8499 ± 1% | ||||
| Ka (mol/L) | 8545 ± 8% | 6332 ± 4% | 7197 ± 3% | ||||
Dilution titration of clip 1 with AMP
Parent solution: 0.768 mg (0.713 μmol) host 1 and 0.281 mg (0.718 μmol) AMP in 500 μL D2O.
| entry | Vparent solution (μL) | Vtotal (μL) | cguest (mol/L) | chost (mol/L) | δa (ppm) |
|---|---|---|---|---|---|
| 0 | reference | 500 | 1.44·10-3 | - | 8.2317 |
| 1 | 25 | 500 | 7.18·10-5 | 7.13·10-5 | 8.2184 |
| 2 | 50 | 500 | 1.44·10-4 | 1.43·10-4 | 8.2096 |
| 3 | 75 | 500 | 2.15·10-4 | 2.14·10-4 | 8.2052 |
| 4 | 100 | 500 | 2.87·10-4 | 2.85·10-4 | 8.1919 |
| 5 | 125 | 500 | 3.59·10-4 | 3.56·10-4 | 8.1875 |
| 6 | 250 | 500 | 7.18·10-4 | 7.13·10-4 | 8.1615 |
| 7 | 500 | 500 | 1.44·10-3 | 1.43·10-4 | 8.1477 |
| Δδsat (ppm) | 0.1881 ± 10% | ||||
| Ka (mol/L) | 1126 ± 19% | ||||
Dilution titration of clip 1 with AZT
Parent solution: 0.433 mg (0.714 μmol) host 1 and 0.190 mg (0.717 μmol) AZT in 600 μL D2O.
| entry | Vparent solution (μL) | Vtotal (μL) | cguest (mol/L) | chost (mol/L) | δa (ppm) | δb (ppm) | δc (ppm) |
|---|---|---|---|---|---|---|---|
| 0 | reference | 600 | 1.20·10-3 | - | 7.6200 | 6.1936 | 1.6839 |
| 1 | 30 | 600 | 5.98·10-5 | 5.95·10-5 | 7.5022 | 6.1461 | 1.8059 |
| 2 | 60 | 600 | 1.20·10-4 | 1.19·10-4 | 7.4050 | 6.1096 | 1.7650 |
| 3 | 90 | 600 | 1.79·10-4 | 1.79·10-5 | 7.3011 | 6.0688 | 1.7219 |
| 4 | 120 | 600 | 2.39·10-4 | 2.38·10-4 | 7.2259 | 6.0389 | 1.6865 |
| 5 | 150 | 600 | 2.98·10-4 | 2.98·10-4 | 7.1696 | 6.0179 | 1.6622 |
| 6 | 300 | 600 | 5.98·10-4 | 5.95·10-4 | 6.8269 | 5.8752 | 1.4842 |
| 7 | 600 | 600 | 1.20·10-3 | 1.19·10-3 | 6.2464 | 5.7659 | 1.3759 |
| Δδsat (ppm) | 3.116 ± 6% | 1.245 ± 8% | 1.400 ± 11% | ||||
| Ka (mol/L) | 707 ± 11% | 696 ± 14% | 730 ± 19% | ||||
Titration of clip 1 with 2′,3′-deoxythymidine
Host solution: 1.593 mg (2.629·10-6 mol) host 1 in 650 μL D2O.
Guest solution: 0.435 mg (1.944·10-6 mol) 2′,3′-deoxythymidine in 750 μL D2O.
| entry | Vguest (μL) | Vhost (μL) | Vtotal (μL) | cguest (mol/L) | chost (mol/L) | δa (ppm) | δb (ppm) | δc (ppm) | δd (ppm) | δf (ppm) |
|---|---|---|---|---|---|---|---|---|---|---|
| 0 | 75 | 0 | 600 | 3.24·10-4 | 0 | 7.6417 | 6.9692 | 6.4877 | 5.9824 | 1.8810 |
| 1 | 75 | 10 | 600 | 3.24·10-4 | 6.74·10-5 | 7.6312 | 6.9632 | 6.4790 | 5.9765 | 1.8719 |
| 2 | 75 | 20 | 600 | 3.24·10-4 | 1.35·10-4 | 7.6110 | 6.9536 | 6.4758 | 5.9693 | 1.8545 |
| 3 | 75 | 30 | 600 | 3.24·10-4 | 2.02·10-4 | 7.5973 | 6.9454 | 6.4699 | 5.9623 | 1.8426 |
| 4 | 75 | 40 | 600 | 3.24·10-4 | 2.70·10-4 | 7.5798 | 9.9376 | 6.4634 | 5.9559 | 1.8274 |
| 5 | 75 | 50 | 600 | 3.24·10-4 | 3.37·10-4 | 7.5611 | 9.9280 | 6.4538 | 5,9453 | 1.8114 |
| 6 | 75 | 60 | 600 | 3.24·10-4 | 4.04·10-4 | 7.5450 | 6.9211 | 6.4492 | 5,9389 | 1.7977 |
| 7 | 75 | 80 | 600 | 3.24·10-4 | 5.39·10-4 | 7.5133 | 6.9078 | 6.4383 | 5,9275 | 1.7720 |
| 8 | 75 | 120 | 600 | 3.24·10-4 | 8.09·10-4 | 7.4589 | 6.8799 | 6.4140 | 5,9000 | - |
| 9 | 75 | 200 | 600 | 3.24·10-4 | 1.35·10-3 | 7.3618 | 6.8350 | 6.3764 | 5,8565 | 1.6415 |
| Δδsat (ppm) | 1.645 ± 17% | 0.6014 ± 9% | 0.6108 ± 18% | 0.8318 ± 19% | 1.399 ± 20% | |||||
| Ka (mol/L) | 160 ± 20% | 226 ± 12% | 174 ± 21% | 138 ± 23% | 160 ± 20% | |||||
References and Notes
- Meier, C. Mini Reviews in Medicinal Chemistry 2002, 2, 219–234.
- Wu, D.; Clement, J.G.; Pardridge, W. M. Brain Res. 1998, 791, 313–316.
- Rotger, M.C.; González, J. F.; Ballester, P.; Deyà, P. M.; Costa, A. J. Org. Chem. 1994, 59, 4501–4505.
- Cudic, P.; Žinic, M.; Tomišic, V.; Simeon, V.; Vigneron, J.-P.; Lehn, J.-M. J. Chem. Soc., Chem. Commun. 1995, 1073–1075.
- Klärner, F.-G.; Kahlert, B. Acc. Chem. Res. 2003, 36, 919–932.
- Jasper, C.; Schrader, T.; Panitzky, J.; Klärner, F.-G. Angew. Chem. 2002, 114, 1411–1415.
- Connors, K. A. Binding Constants, The Measurement of Molecular Complex Stability; Wiley: New York, 1987. [Google Scholar]Fielding, L. Tetrahedron 2000, 56, 6151–6170.
- Fokkens, M.; Jasper, C.; Schrader, T.; Koziol, F.; Ochsenfeld, C.; Polkowska, J.; Lobert, M.; Kahlert, B.; Klärner, F.-G. Chem. Eur. J. 2005, 11, 477–494.
- Balzarini, J.; Herdewijn, P.; De Clercq, E. J. Biol. Chem. 1989, 264, 6127–6133.
Figure 1.
Calculated as well as Lewis structure and electrostatic potential surface of the water-soluble molecular clip 1.
Figure 1.
Calculated as well as Lewis structure and electrostatic potential surface of the water-soluble molecular clip 1.
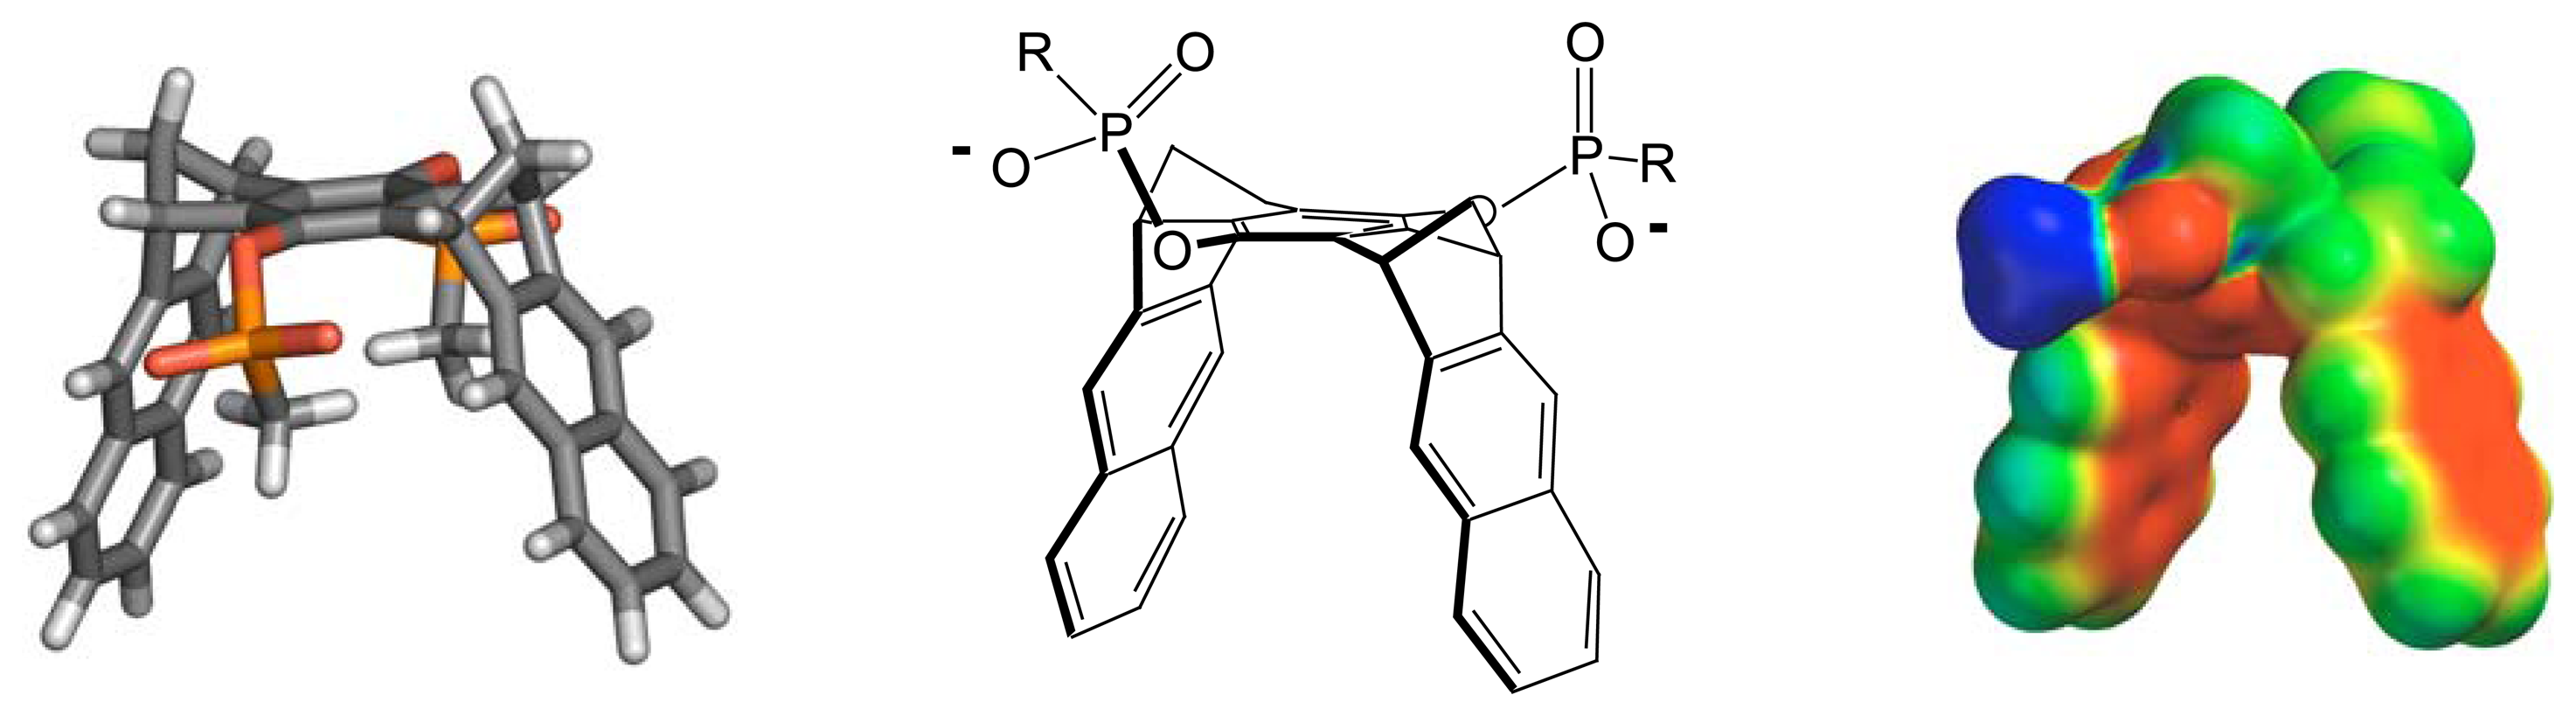
Figure 2.
Nucleosides bound by clip 1, with corresponding binding constants [M-1] and maximum chemical shift changes Δδmax [ppm].
Figure 2.
Nucleosides bound by clip 1, with corresponding binding constants [M-1] and maximum chemical shift changes Δδmax [ppm].

Figure 3.
Electrostatic Potential Surface (EPS) of the nucleic bases calculated with PM3 showing the varying distribution of electron density on their respective π-faces (EPS color code: - 25 kcal/mol: red; + 25 kcal/mol: blue).
Figure 3.
Electrostatic Potential Surface (EPS) of the nucleic bases calculated with PM3 showing the varying distribution of electron density on their respective π-faces (EPS color code: - 25 kcal/mol: red; + 25 kcal/mol: blue).

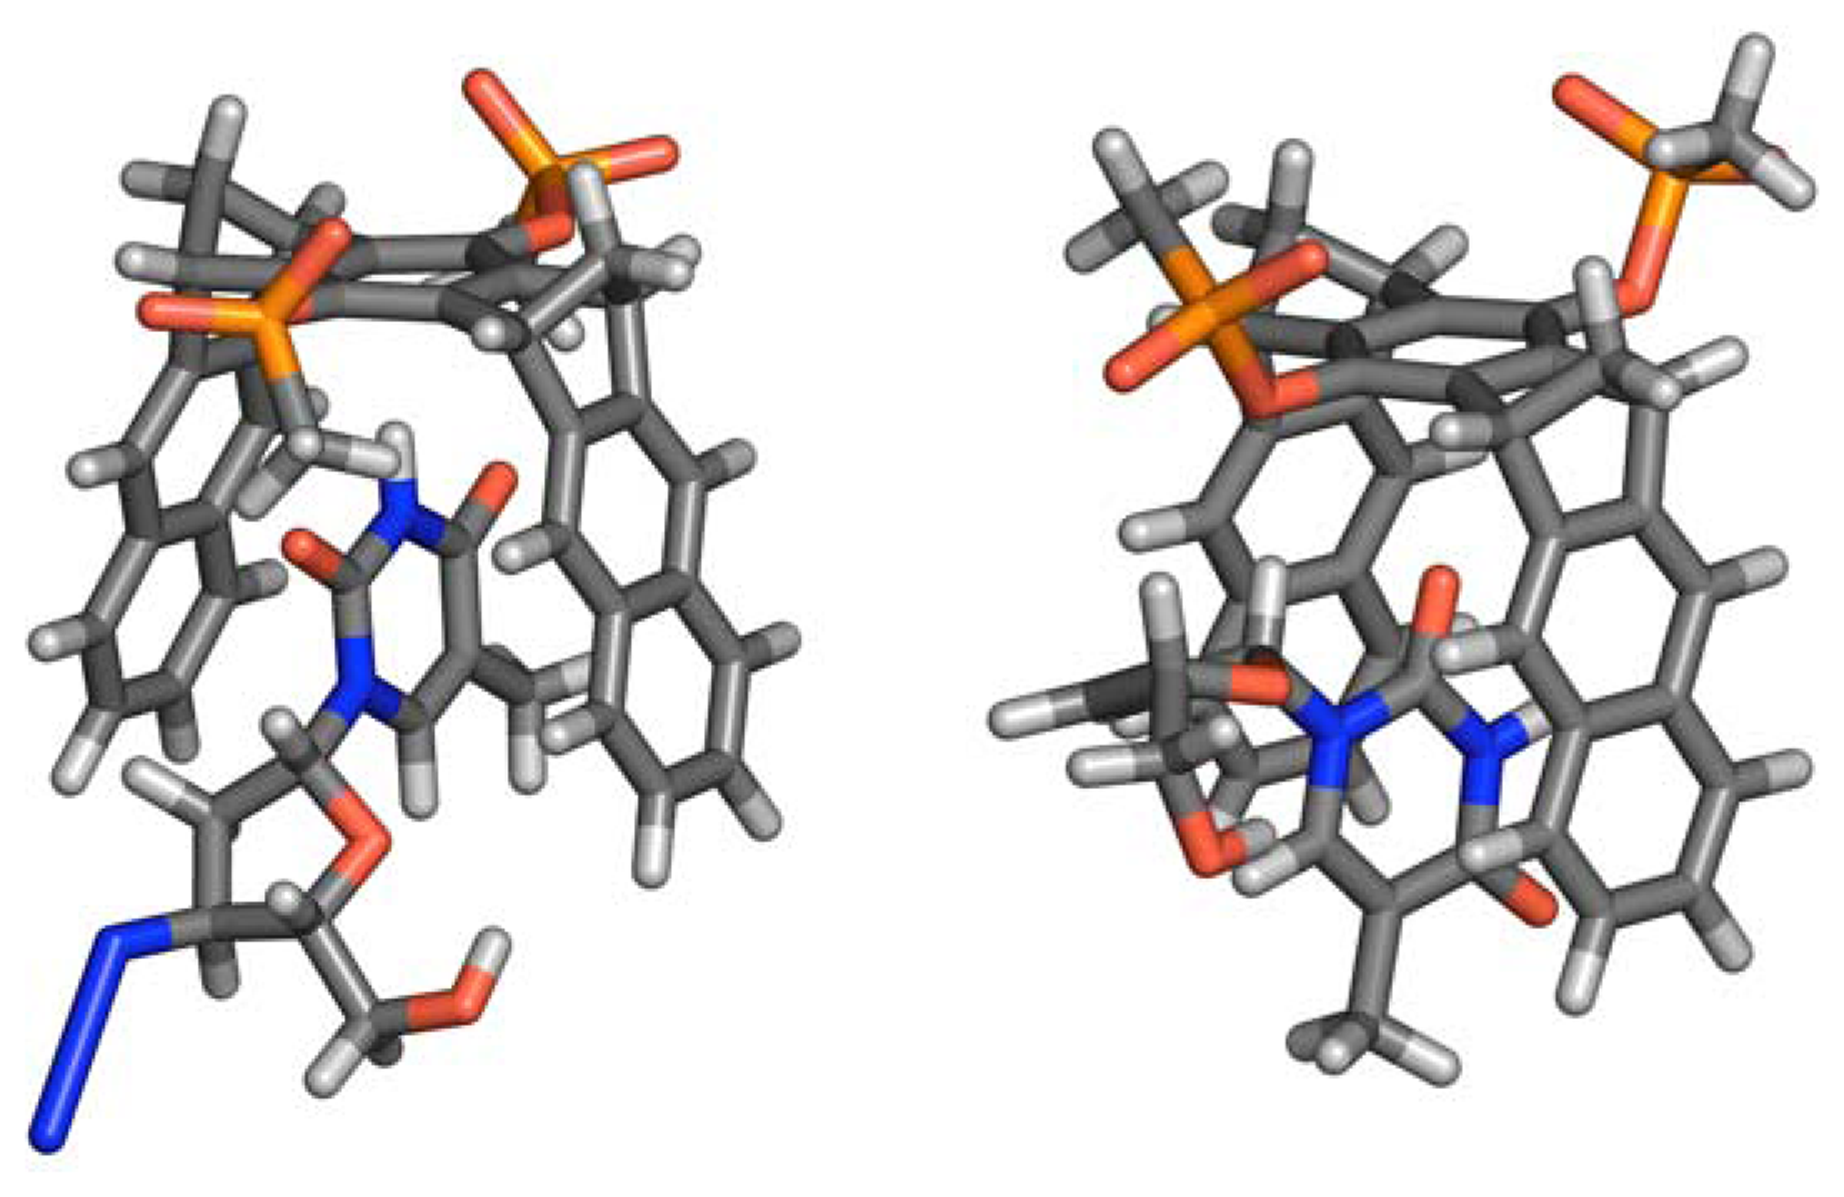
Figure 4.
a) Nucleoside antibiotics AZT and ddT bound by clip 1, with corresponding binding constants [M-1] and maximum chemical shift changes Δδmax [ppm].b) Calculated complex structures for clip 1 + AZT (left) and clip 1 + 2′,3′-didehydro-2′,3′-dideoxythymidine (ddT, right): MacroModel 7.1, OPLS-AA, H2O, Monte-Carlo simulation with 2000 steps.

2006 by MDPI ( http://www.mdpi.org). Reproduction is permitted for noncommercial purposes.
Share and Cite
MDPI and ACS Style
Fokkens, M.; Klärner, F.-G.; Schrader, T. Nucleoside Sensing. Sensors 2006, 6, 860-873. https://doi.org/10.3390/s6080860
AMA Style
Fokkens M, Klärner F-G, Schrader T. Nucleoside Sensing. Sensors. 2006; 6(8):860-873. https://doi.org/10.3390/s6080860
Chicago/Turabian StyleFokkens, Michael, Frank-Gerrit Klärner, and Thomas Schrader. 2006. "Nucleoside Sensing" Sensors 6, no. 8: 860-873. https://doi.org/10.3390/s6080860