Self-Powered Wireless Sensor Networks for Remote Patient Monitoring in Hospitals

Erik Jonsson School of Engineering and Computer Science, University of Texas at Dallas, P.O. Box, Richardson, Texas, USA
*
Authors to whom correspondence should be addressed.
Sensors 2006, 6(9), 1102-1117; https://doi.org/10.3390/s6091102
Submission received: 26 June 2006
/
Accepted: 22 September 2006
/
Published: 22 September 2006
Abstract
:Patient vital sign monitoring within hospitals requires the use of non-invasive sensors that are hardwired to bedside monitors. This set-up is cumbersome, forcing the patient to be confined to his hospital bed thereby not allowing him to move around freely within the hospital premises. This paper addresses the use of wireless sensor networks for monitoring patient vital sign data in a hospital setting. Crossbow MICAz motes have been used to design a robust mesh network that routes patient data to a remote base station within the hospital premises. A hospital care giver can have access to this data at any point in time and doesn’t have to be physically present in the patient’s room to review the readings. The network infrastructure nodes are self-powered and draw energy from overhead 34W fluorescent lights via solar panels. The sensor nodes can be interfaced to a variety of vital sign sensors such as electrocardiograms (ECGs), pulse-oximeters and blood pressure (BP) sensors. In order to verify a completely functioning system, a commercial BP/heart-rate monitor (BPM) was interfaced to a wireless sensor node. The sensor node controls the BPM to initiate a reading, then collects the data and forwards it to the base station. An attractive graphical user interface (GUI) was designed to store and display patient data on the base station PC. The set-up was found to be extremely robust with low power consumption.
1. Introduction
Advances in wireless networking have opened up new opportunities in a variety of applications [1] including healthcare systems [2,3,4,5,6,7,8,9]. In fact, the healthcare market is among the fastest growing markets for WiFi and other Wireless LAN Technologies [7]. The future will see the integration of the abundance of existing specialized medical technology with pervasive, wireless networks. One such example wherein future medical systems can benefit the most from wireless networks is continuous monitoring of patient vital signs within hospital premises. Many medical ailments can be monitored quite conveniently with the use of these networks within hospital premises. For example, the behavior of people suffering from sleep apnea can be monitored using on-body sensors to assess the severity and pattern of obstructive sleep apnea by monitoring their blood oxygenation, breathing, and heart-rate every night. Similarly, cardiac health can be monitored by keeping a track of a patient’s heart-rate [10]. Abnormal heart rhythms can cause the heart to be less efficient, and can cause symptoms such as dizziness, fainting, or fatigue. Since they are sometimes very brief, it can be difficult to properly characterize them. Cardiac stress tests in the presence of a physician attempt to induce the event while the patient is wearing wired sensors in a laboratory. However, wearable electrocardiogram (ECG) sensors can monitor for the condition continuously, over days or weeks, until the event occurs. The recorded data can be promptly sent to the physician for analysis in real-time. If the event is serious enough, an emergency communication channel may be used to call for help, or it may be dispatched automatically. Examples of such systems have been described in [11,12,13,14].
Although present systems in hospitals allow continuous monitoring of patient vital signs, these systems require the sensors to be hardwired to nearby bedside monitors or PCs, and essentially confine the patient to his hospital bed. The advent of WiFi and Bluetooth have facilitated breaking the cord between the non-invasive patient sensor and the bedside equipment [5]. These systems do not require the patient to be confined to his bed and allow him to move around freely in his room but requires him to be within a specific distance from the bedside monitor. For example, the range of transmission for typical Bluetooth systems is about ten meters. Beyond this distance, it is not possible to acquire data. Patient mobility beyond his hospital room can be incorporated by using a network of such nodes placed at appropriate distances in order to transfer data to the monitoring station. However, network nodes that use protocols such as Bluetooth require a larger volume and higher power consumption. This indirectly indicates a higher cost per node and a fairly high burden on its power source further increasing its size and cost. Depending on the size of the hospital, several such nodes might be required resulting in a much higher system infrastructure cost. Moreover, such protocols are meant for moderate to high bandwidth applications where relatively large packets of data need to be transmitted and received. In the case of patient vital sign monitoring, the data packet size is much smaller which seems to suggest that networks using such protocols might seem impractical.
Obviously, low power, low cost network nodes are required for such applications. Wireless sensor networks (WSNs) consist of nodes that consume very low power and are extremely small in size. This facilitates easy integration with non-invasive biomedical sensors. These network nodes are specifically designed for low power consumption and with minimal circuit components. They are intended for small packet, short distance range applications and typically consist of a low power processor with minimal resources and interface capabilities. They also have a conservative transceiver that is capable of transmitting only a few bytes of data at a time and has a moderate transmitting range of about ten meters. Therefore, WSNs seem to be a perfect fit for remote patient monitoring. This paper investigates the practicality of using WSNs for monitoring patient vital sign data. Crossbow MICAz motes [15] have been used as the WSN network nodes and the feasibility of continuously monitoring patient blood pressure (BP) and heart-rate data is studied. The design challenges, system details, and experimental results are presented in the next few sections.
2. Proposed system
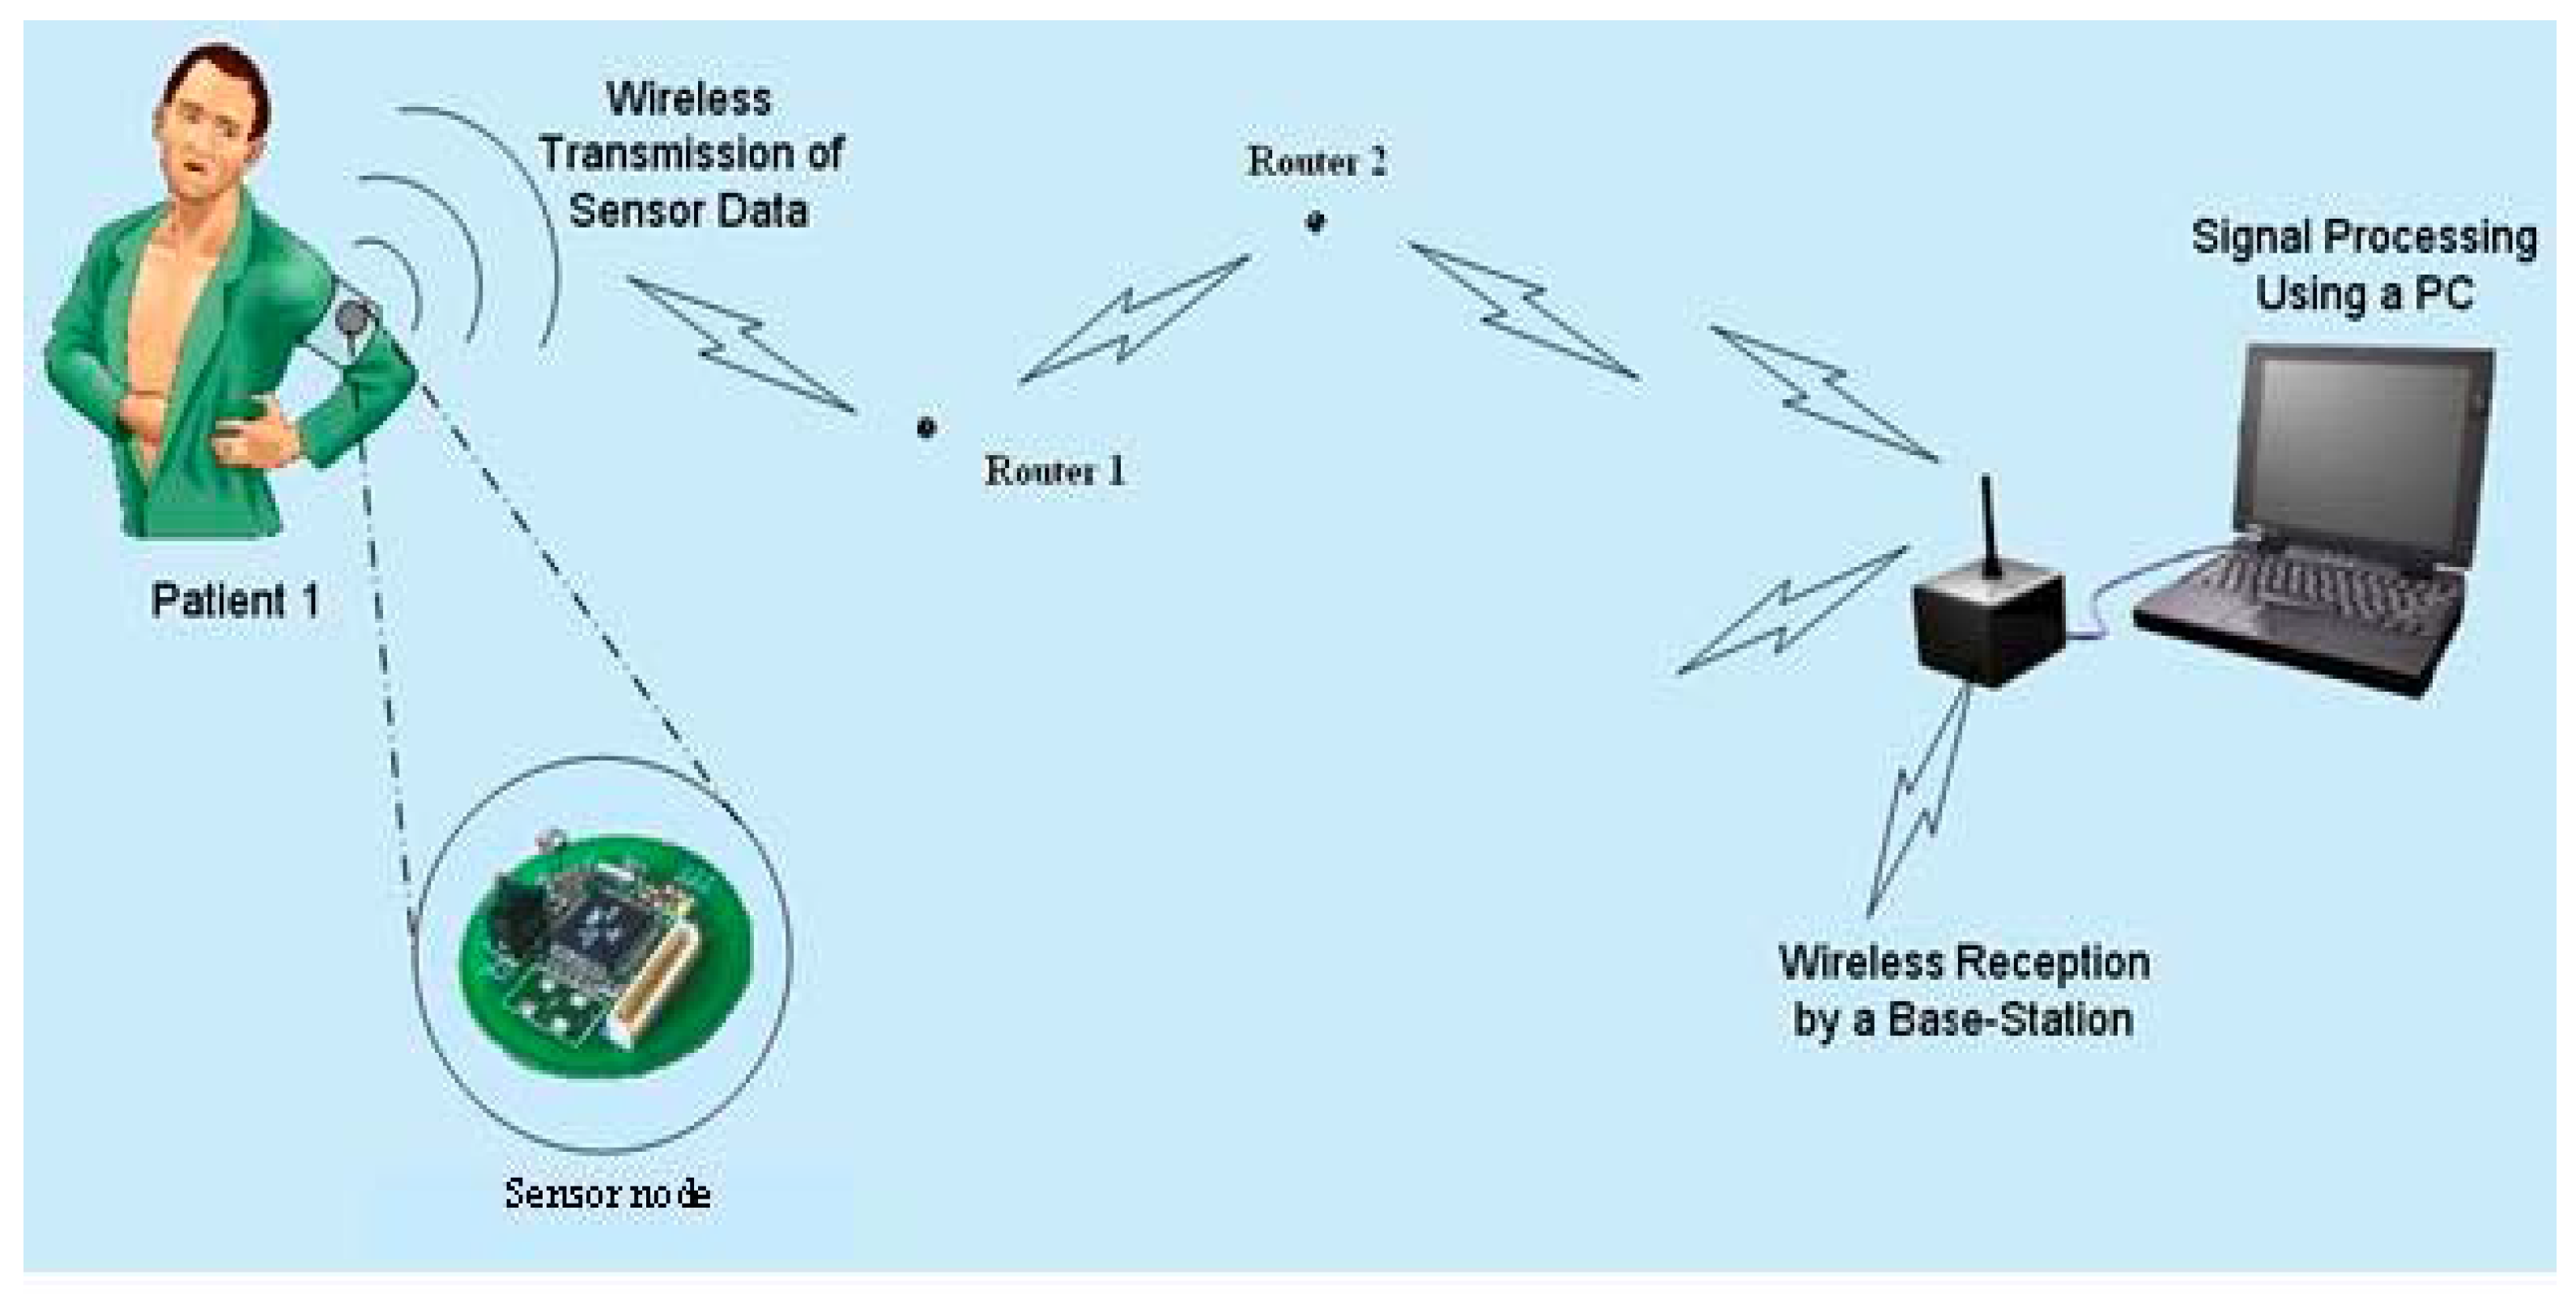
Figure 1 shows the concept of an in-hospital WSN that can be used to monitor patient vital sign data from instruments such as ECGs [16], pulse-oximeters [17], and blood pressure monitors (BPMs) [18]. These units can be interfaced to WSN nodes that are programmed as sensor nodes. These sensor nodes are required to perform the function of sensing vital sign data from the patient and are typically required to be ambulatory in nature. Therefore, it is convenient to allow them to run on stable sources of energy such as batteries. The maximum range of data transmission for such nodes is approximately ten meters [15]. Therefore, as pointed out earlier, additional nodes (router nodes) are required to pass the data to the monitoring station (also called the base station). There might be several such router nodes distributed in these WSNs, and their density and number would depend on the hospital size and coverage requirements. Typically, each router node in the network has a fixed location and its only function is enabling prompt data transfer to the next router node or base station. These router nodes obviously need to be continuously on so that data can be promptly transferred. Since hospitals have fluorescent lights in the hallways that are always on, it is advantageous to operate these router nodes by scavenging light energy. This would result in a huge cost savings over time (this arrangement eliminates the need to monitor and replace batteries). Referring to Figure 1, the base station in such networks consists of a mote that receives data and is connected to a server. The data received by the base station is displayed to allow constant patient monitoring and can be routed to the patient’s physician for easy access in real-time.
Figure 1.
Remote vital sign monitoring system. (Original figure source: http://www.enel.ucalgary.ca/People/Haslett/WCLM/CCHE/WebPage/VijayDevabhaktuni_Wireless_Proceedings.doc).
Figure 1.
Remote vital sign monitoring system. (Original figure source: http://www.enel.ucalgary.ca/People/Haslett/WCLM/CCHE/WebPage/VijayDevabhaktuni_Wireless_Proceedings.doc).

In order to test the feasibility of the system, the network protocol was first developed and tested. After obtaining satisfactory results, it was decided to use a readily available off-the-shelf vital sign monitor to route BP and heart-rate data to the base station. The network architecture along with the vital sign monitor and its interface to a sensor node are explained in the next few sections.
3. Network protocol and router nodes
The targeted application required multi-hop routing because in a hospital setting depending on a patient’s location, data might be required to travel a long distance before reaching the base station. This would obviously require several intermediate router nodes that facilitate multi-hop routing. In our WSN network, Crossbow MICAz motes are used as the router nodes. These motes use the Zigbee protocol for data transmission and can typically transmit data over a maximum distance of about ten meters. Therefore, data emanating from a patient sensor node might require several hops (via router nodes located every ten meters) before reaching the base station. The number of hops will depend on the sensor node location in the network, i.e., if the sensor node is located closer to the base station, lesser number of hops will be needed. On the other hand, if it is located further away, more hopes will be required.
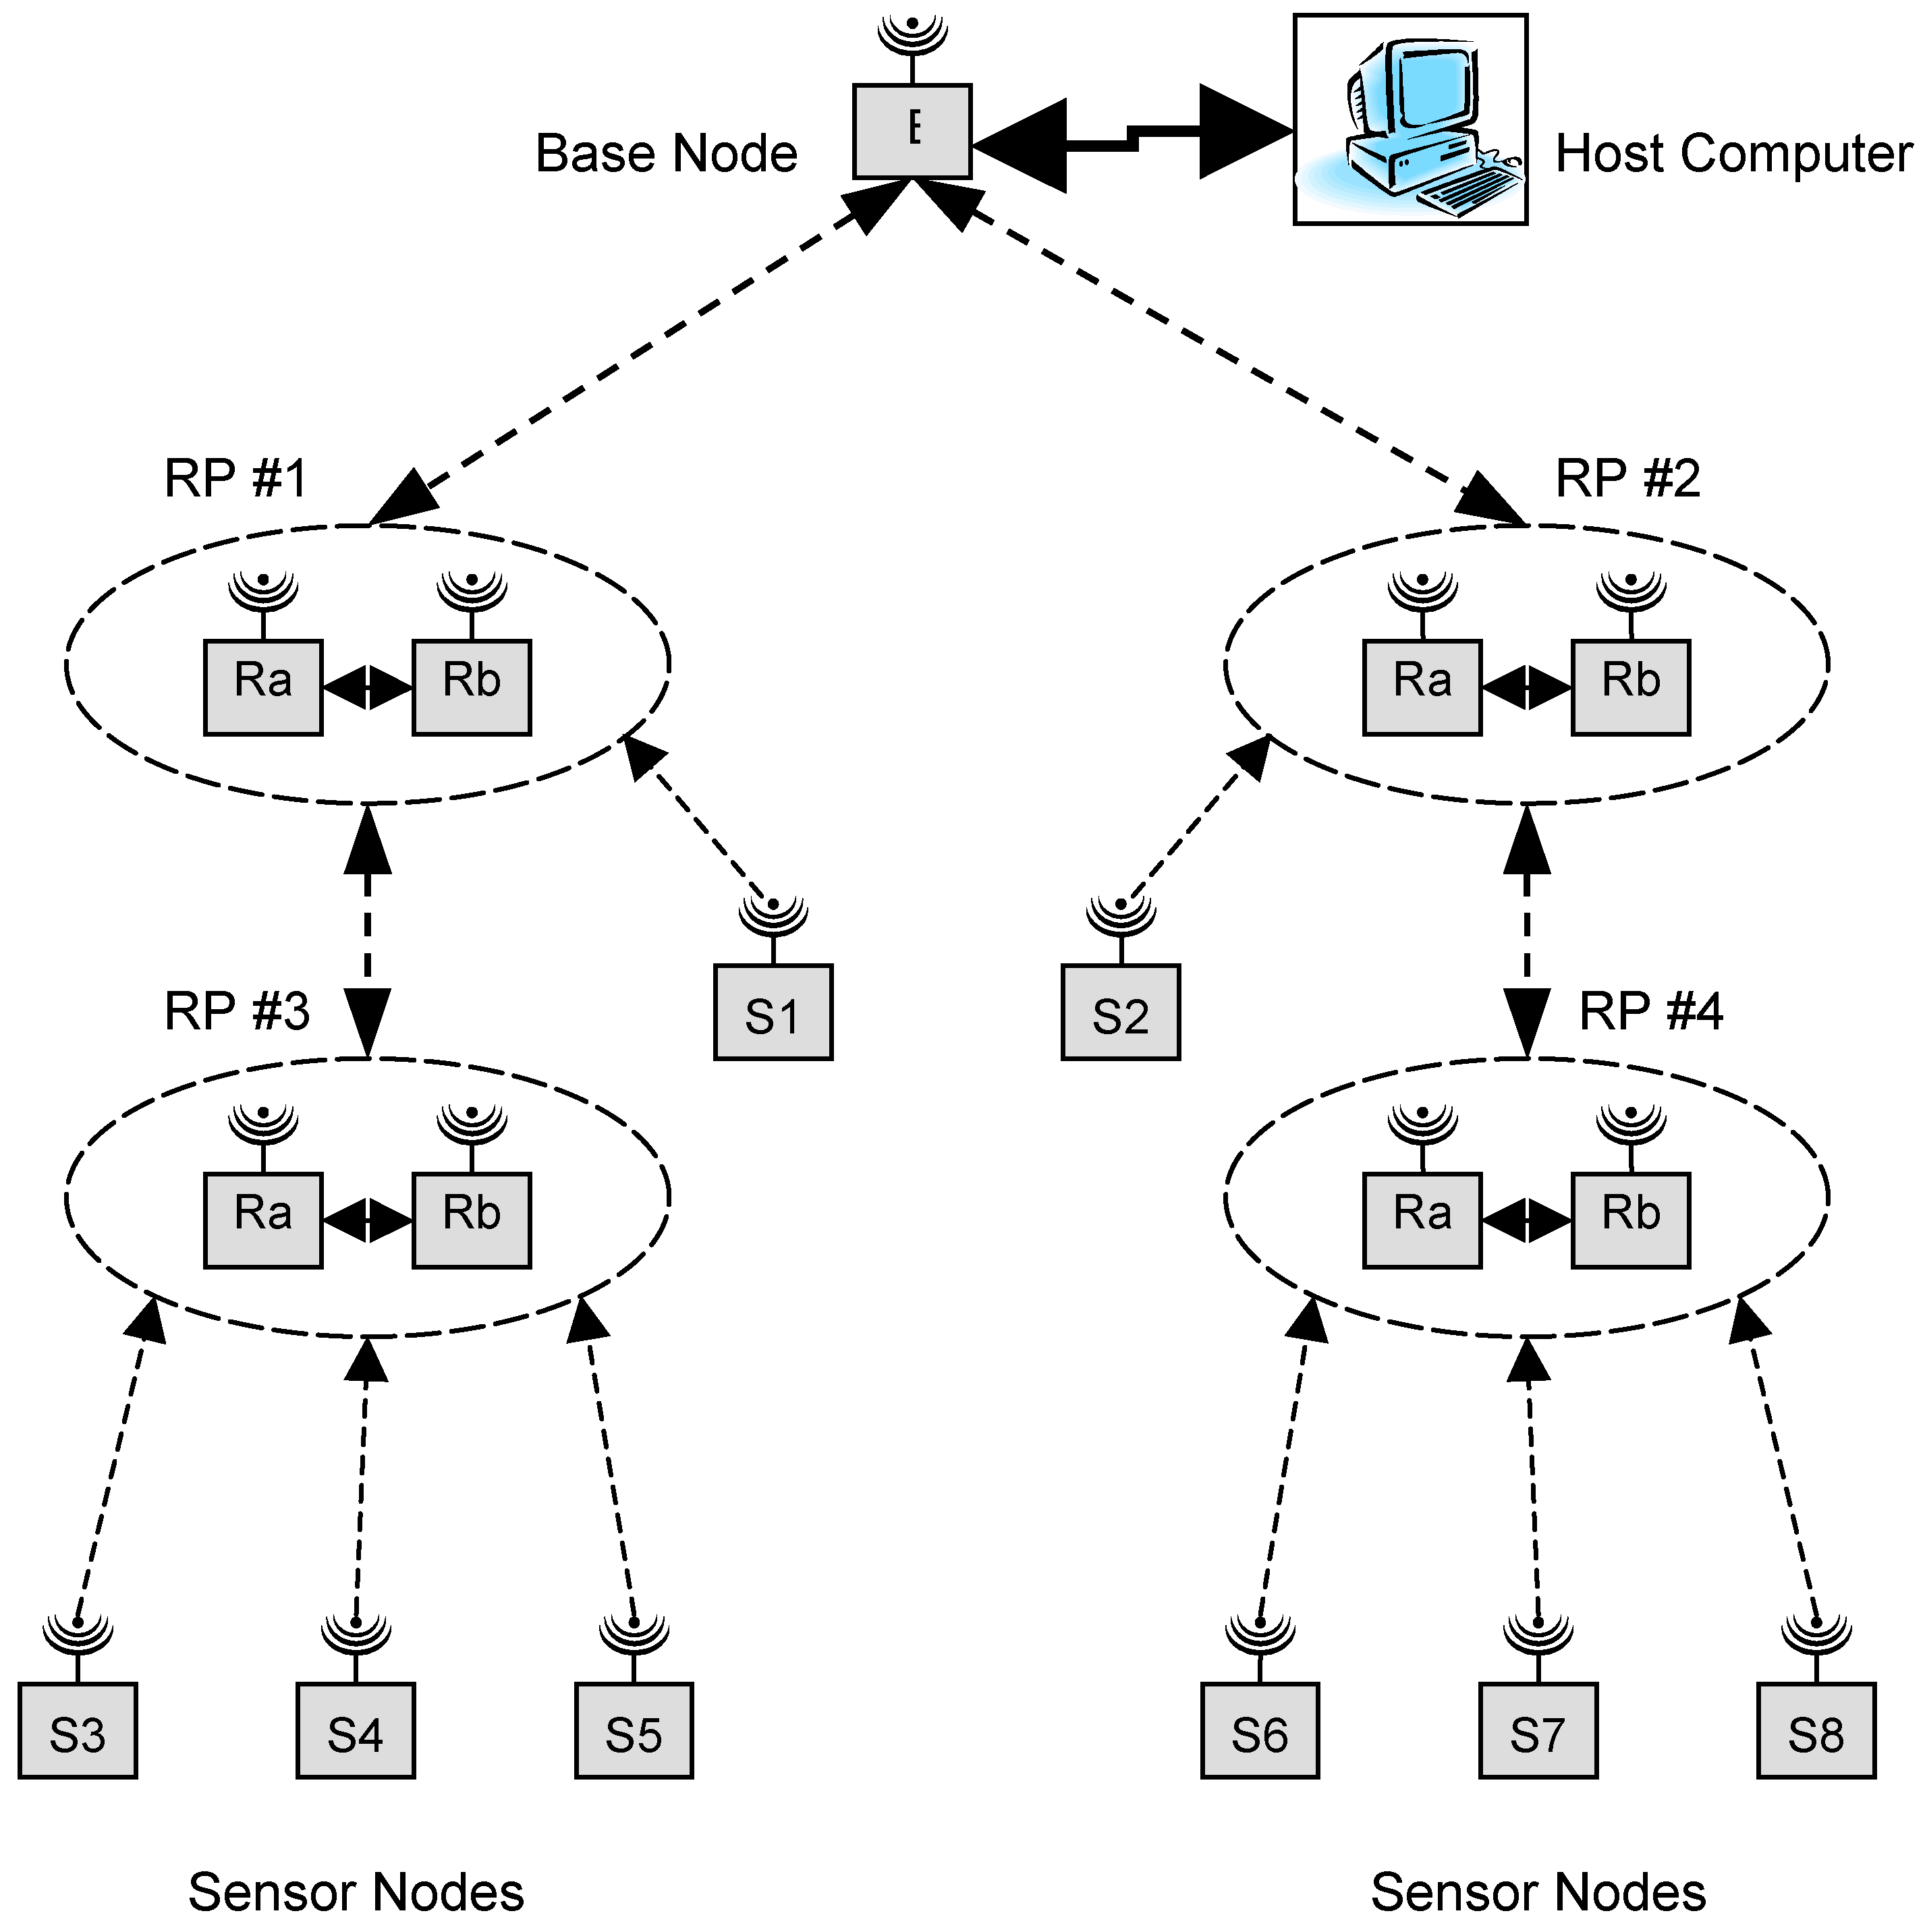
The network architecture consists of several router pairs (RPs) that provide paths for sensor nodes to send data to or receive data from the base station. The strategy of using two router nodes as an RP helped minimize the size of solar panels required by each router node [19]. Figure 2 shows the conceptual diagram of the network. The figure shows four RPs each comprised of their own router nodes Ra and Rb. A special dual router (DR) algorithm was developed to control the operation of Ra and Rb. Here, at any point in time either Ra or Rb would be on but not both. This indicates a 50% duty cycle for both Ra and Rb at every RP and therefore, a reduced solar panel size per router node. In Figure 2 there are four RPs, two in each spine of the network. The sensor nodes will always communicate with the RP closest to the base station in order to take the minimum number of hops to the base station. Sensor node S1 communicates with RP #1 as it is closer to the base station than RP #3. Similarly, sensor node S2 communicates with RP #2. Sensor nodes S3, S4 and S5 communicate with RP #3. RP #3 will forward messages to RP #1 which will in turn forward them to the base station. An identical path is used by sensor nodes S6, S7 and S8 to forward messages to the base station through RP #4 and RP #2.
At start-up, several key parameters of the router node are initialized to appropriate values before commencing the DR algorithm. This includes initialization of the router node microcontroller and transceiver. After the initialization process is completed, the router node attempts to locate an established network. It continues transmitting connection requests until it receives a response from at least one other node. It will then choose a node that is closest to the base station (i.e., shortest path or minimum hop count). The base station could be either one hop away from the new router node or multiple hops away. The new node will then request a network ID. This request is forwarded to the base station, which responds to the router node’s request and assigns it a network ID. The newly ID’ed router node next checks for its nearest route partner. For example, referring to Figure 2, in each router pair, after Ra and Rb receive their respective IDs from the base station, they try locating and finding each other, leading to eventual synchronization and the formation of an RP. The RP is then fully functioning and begins operating with each node of the pair operating at 50% duty cycle. Figure 2 indicates four such RPs each with their own respective Ra and Rb router nodes. If for some reason a router node is unable to communicate with its partner, it will first attempt to reconnect to that partner node. If it is unsuccessful, it will attempt to find a new partner.
Figure 2.
Network structure.

After locating a partner, each router node and its partner use the DR algorithm to operate at a 50% duty cycle. Initially, Ra forces Rb to enter a sleep mode. Here, Rb’s microcontroller and transceiver are forced into a low power mode in order to minimize power consumption (on the order of tens of μW). An asynchronous timer in Rb is used to set the sleep time. After the prescribed sleep interval is completed, the timer generates an interrupt that causes Rb to wake up. The wake up routine transmits a “go to sleep” message to Ra ordering it into the sleep state. After acknowledging the message, Ra enters sleep mode and Rb remains awake to handle any message traffic that occurs. After Ra’s sleep interval is completed, its asynchronous timer generates an interrupt causing it to wake up and send a “go to sleep” message to Rb forcing it to sleep again. This on-off cycle continues for Ra and Rb in each RP so that at any point in time either Ra or Rb is always available to route a message emanating from a sensor node towards the base station or vice-versa. The DR algorithm for Ra and Rb, therefore, sits in an infinite loop, where each router node collaborates with its route partner and allows the RP to effectively operate at a 100% duty cycle. Therefore, in every RP, either Ra or Rb is always awake and is ready to forward a message from an RP at a higher hop count (or its own affiliated sensor node) towards the base station via other RPs that have a lower hop count or vice-versa. The on-off time period for Ra and Rb depends on the router node’s energy storage and scavenging mechanism. In the present set-up, a one second on-off time was found to work adequately. This one second on-off time resulted in a load voltage ripple of about 0.5%. A higher on-off time caused a higher voltage ripple and was therefore deemed unsuitable.
4. Energy Harvesting and Power Management
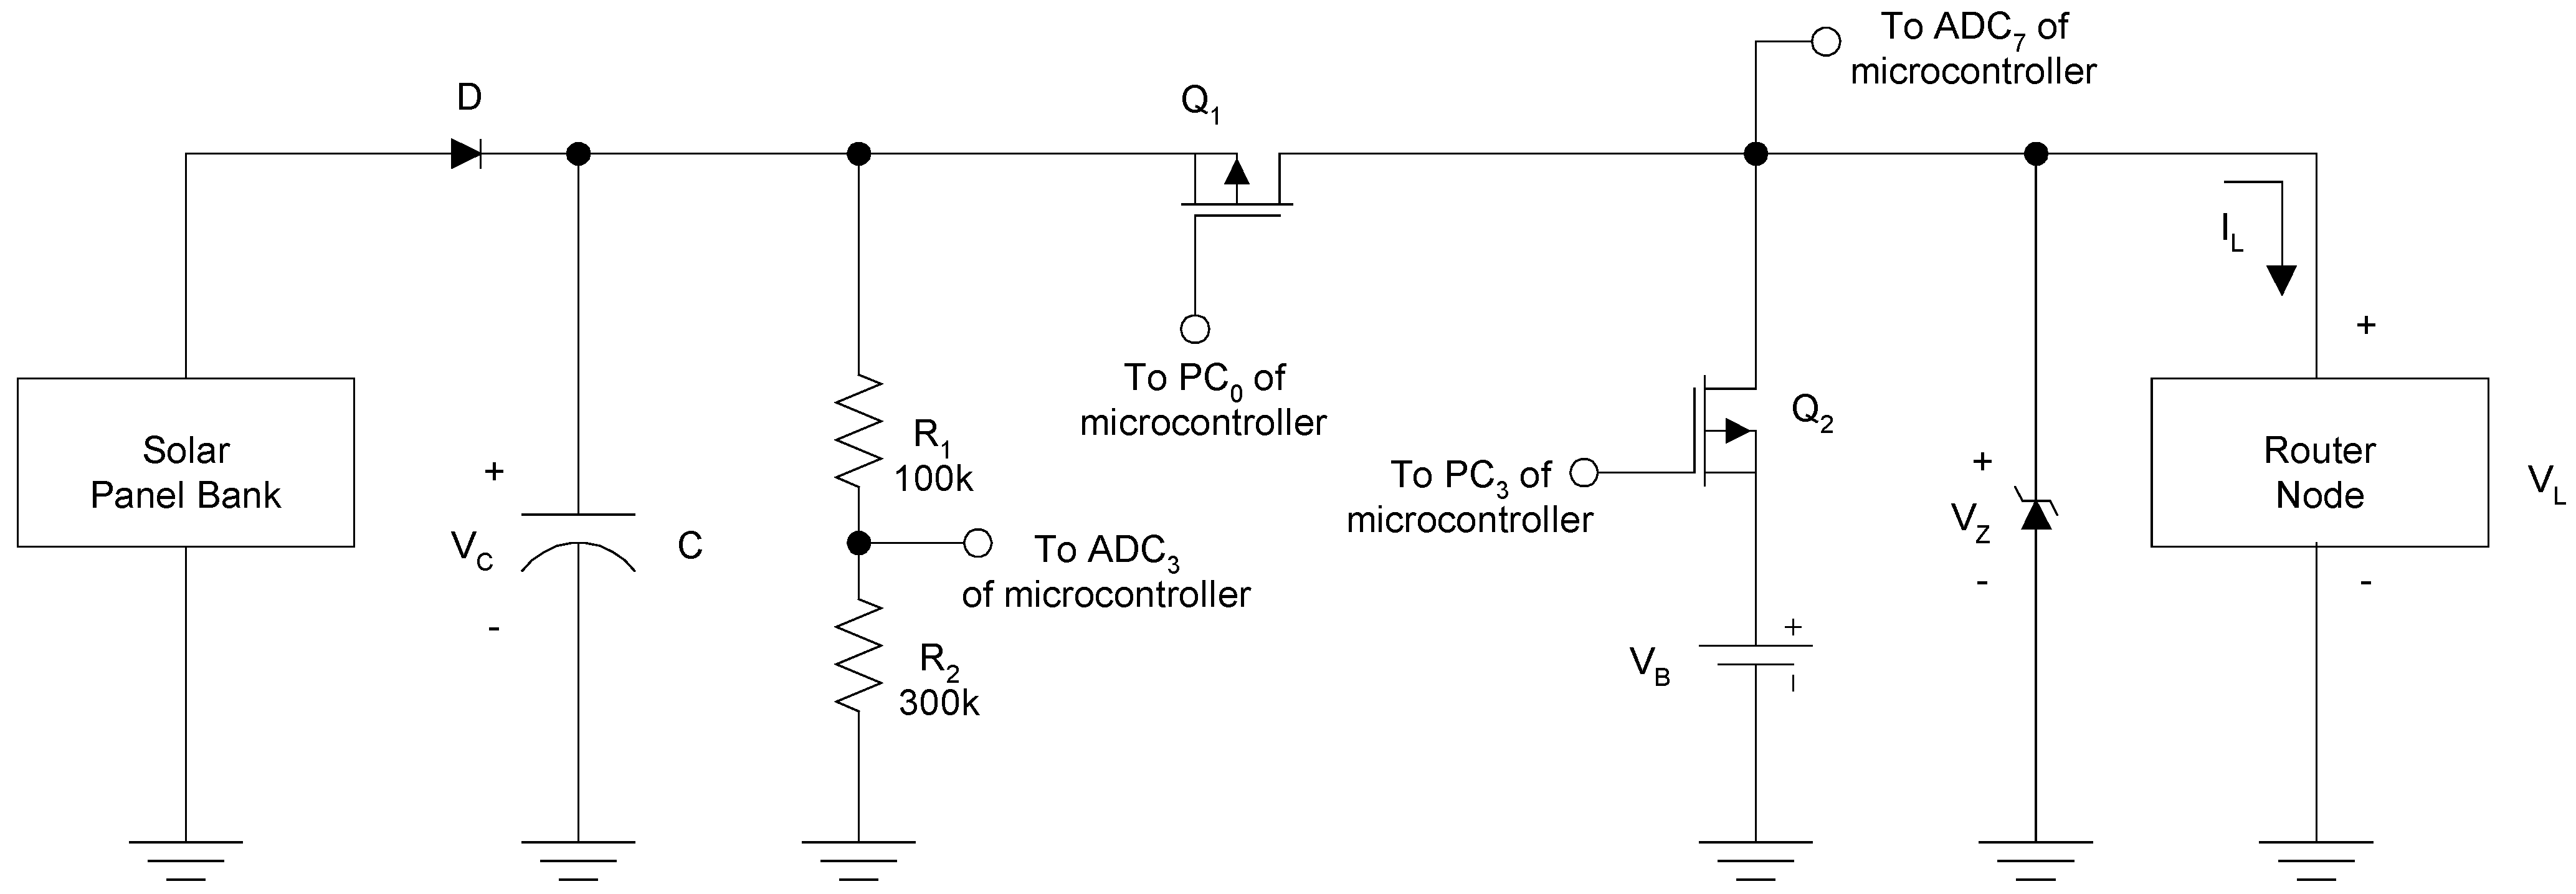
An energy harvesting scheme was designed for the router nodes to scavenge energy from overhead 34W fluorescent lights that are always on in hospital hallways. It consisted of an adequate number of solar panels to charge the energy storage devices which in turn supply regulated power to the router node. The core of the energy harvesting module consisted of a power management circuit, which draws power from the solar panels and manages energy storage and power routing to the router node. The power management circuit provided regulated power to the router node and also simultaneously stores energy in ultracapacitors. Figure 3 shows the simplified schematic of the entire energy harvesting circuit with alkaline batteries used as an emergency back-up power source. An adequate number of Solar World 4-4.0-100 solar panels (S) rated at an open circuit voltage of 4 VDC and short circuit current of 100 mA under 1000 W/m2 light conditions were used in series-parallel to support charging of an ultracapacitor bank (C) that served as the energy storage devices. Initial tests were conducted wherein a power supply was used to simulate the solar panel bank to determine the number of panels required. The ultracapacitor bank is comprised of two Maxwell PC5-5 ultracapacitors. The solar panels had an optimal operating point close to 3 VDC at which they were rated to provide maximum power output [19]. The ultracapacitors ensured operation at about this power point by clamping the output terminals of the solar panel to approximately 3 VDC. During normal router node operation, energy from both the ultracapacitor and solar panel bank was used. When the router node is on, energy is drawn from both power sources almost equally and when the node enters its sleep state, it draws minimum power from both sources. During the sleep state, the solar panel bank charges the ultracapacitors back to about 3 VDC. The voltage ripple due to capacitor charge and discharge during the on-off cycles was found to be minimal and therefore, was not a cause of concern. A 3.6 VDC zener clamping diode was used to protect the router node from excessively high voltages.
Figure 3.
Router node solar energy harvesting circuit with battery back-up.

Two p-channel MOSFETS (Q1 and Q2) were used as switches to allow the use of alkaline batteries for emergency back-up power. PC0 and PC3 (Port C of the router node microcontroller) were used to control the operation of Q1 and Q2 respectively. During normal operation, PC0 = ‘0’ and PC3 = ‘1’ so that Q1 is on and Q2 is off. This facilitates router node operation by drawing power from the solar panels and ultracapacitor bank. If solar energy is lost (for example, a fluorescent light turns off or fails), then the ultracapacitor charge will begin to drop resulting in a gradual reduction in supply voltage until ADC3 < 2.7 VDC. At this point, PC0 = ‘1’ and PC3 = ‘0’. Therefore, Q1 is off and Q2 is on, and energy is routed from the back-up 3 VDC alkaline battery (VB) to the router node. In such a situation, the measured ADC3 value (‘D1’) is transmitted to the base station to indicate a potential problem in the solar panel-ultracapacitor bank. If the router node is drawing power from VB and the solar energy source is restored, the router node waits for its ultracapacitor to be charged to 3.4 VDC, and then switches back to solar power, i.e., PC0 = ‘0’ and PC3 = ‘1’. During this condition, VC is greater than VB, and therefore a simple resistor divider circuit was used for voltage scaling purposes in order to scale VC down below 3 VDC and facilitate correct VC measurements.
ADC3 (Port F of the microcontroller) was used to continuously monitor the ultracapacitor voltage and obtain a voltage reference for the router node microcontroller. Due to possible variation in supply voltage (VL), a fixed 1.223 VDC voltage reference was used to determine the router node VL and microcontroller 10-bit A/D reference voltage (VREF). This voltage reference consisted of a 1.223 VDC zener diode that was part of the microcontroller IC. ADC7 (Port F of the microcontroller) was used to measure this fixed 1.223 VDC voltage reference. For example, if ‘D1’ corresponds to the digitized 1.223 VDC input ADC7 value,
VL = VREF = (1.223 x 1024) / D1
The calculated VREF was in turn used to determine the ultracapacitor voltage (VC) in the router node software. If D2 corresponds to the digitized ADC3 value,
VC = (D2 x VREF) / 1024
5. Sensor node and base station interfaces
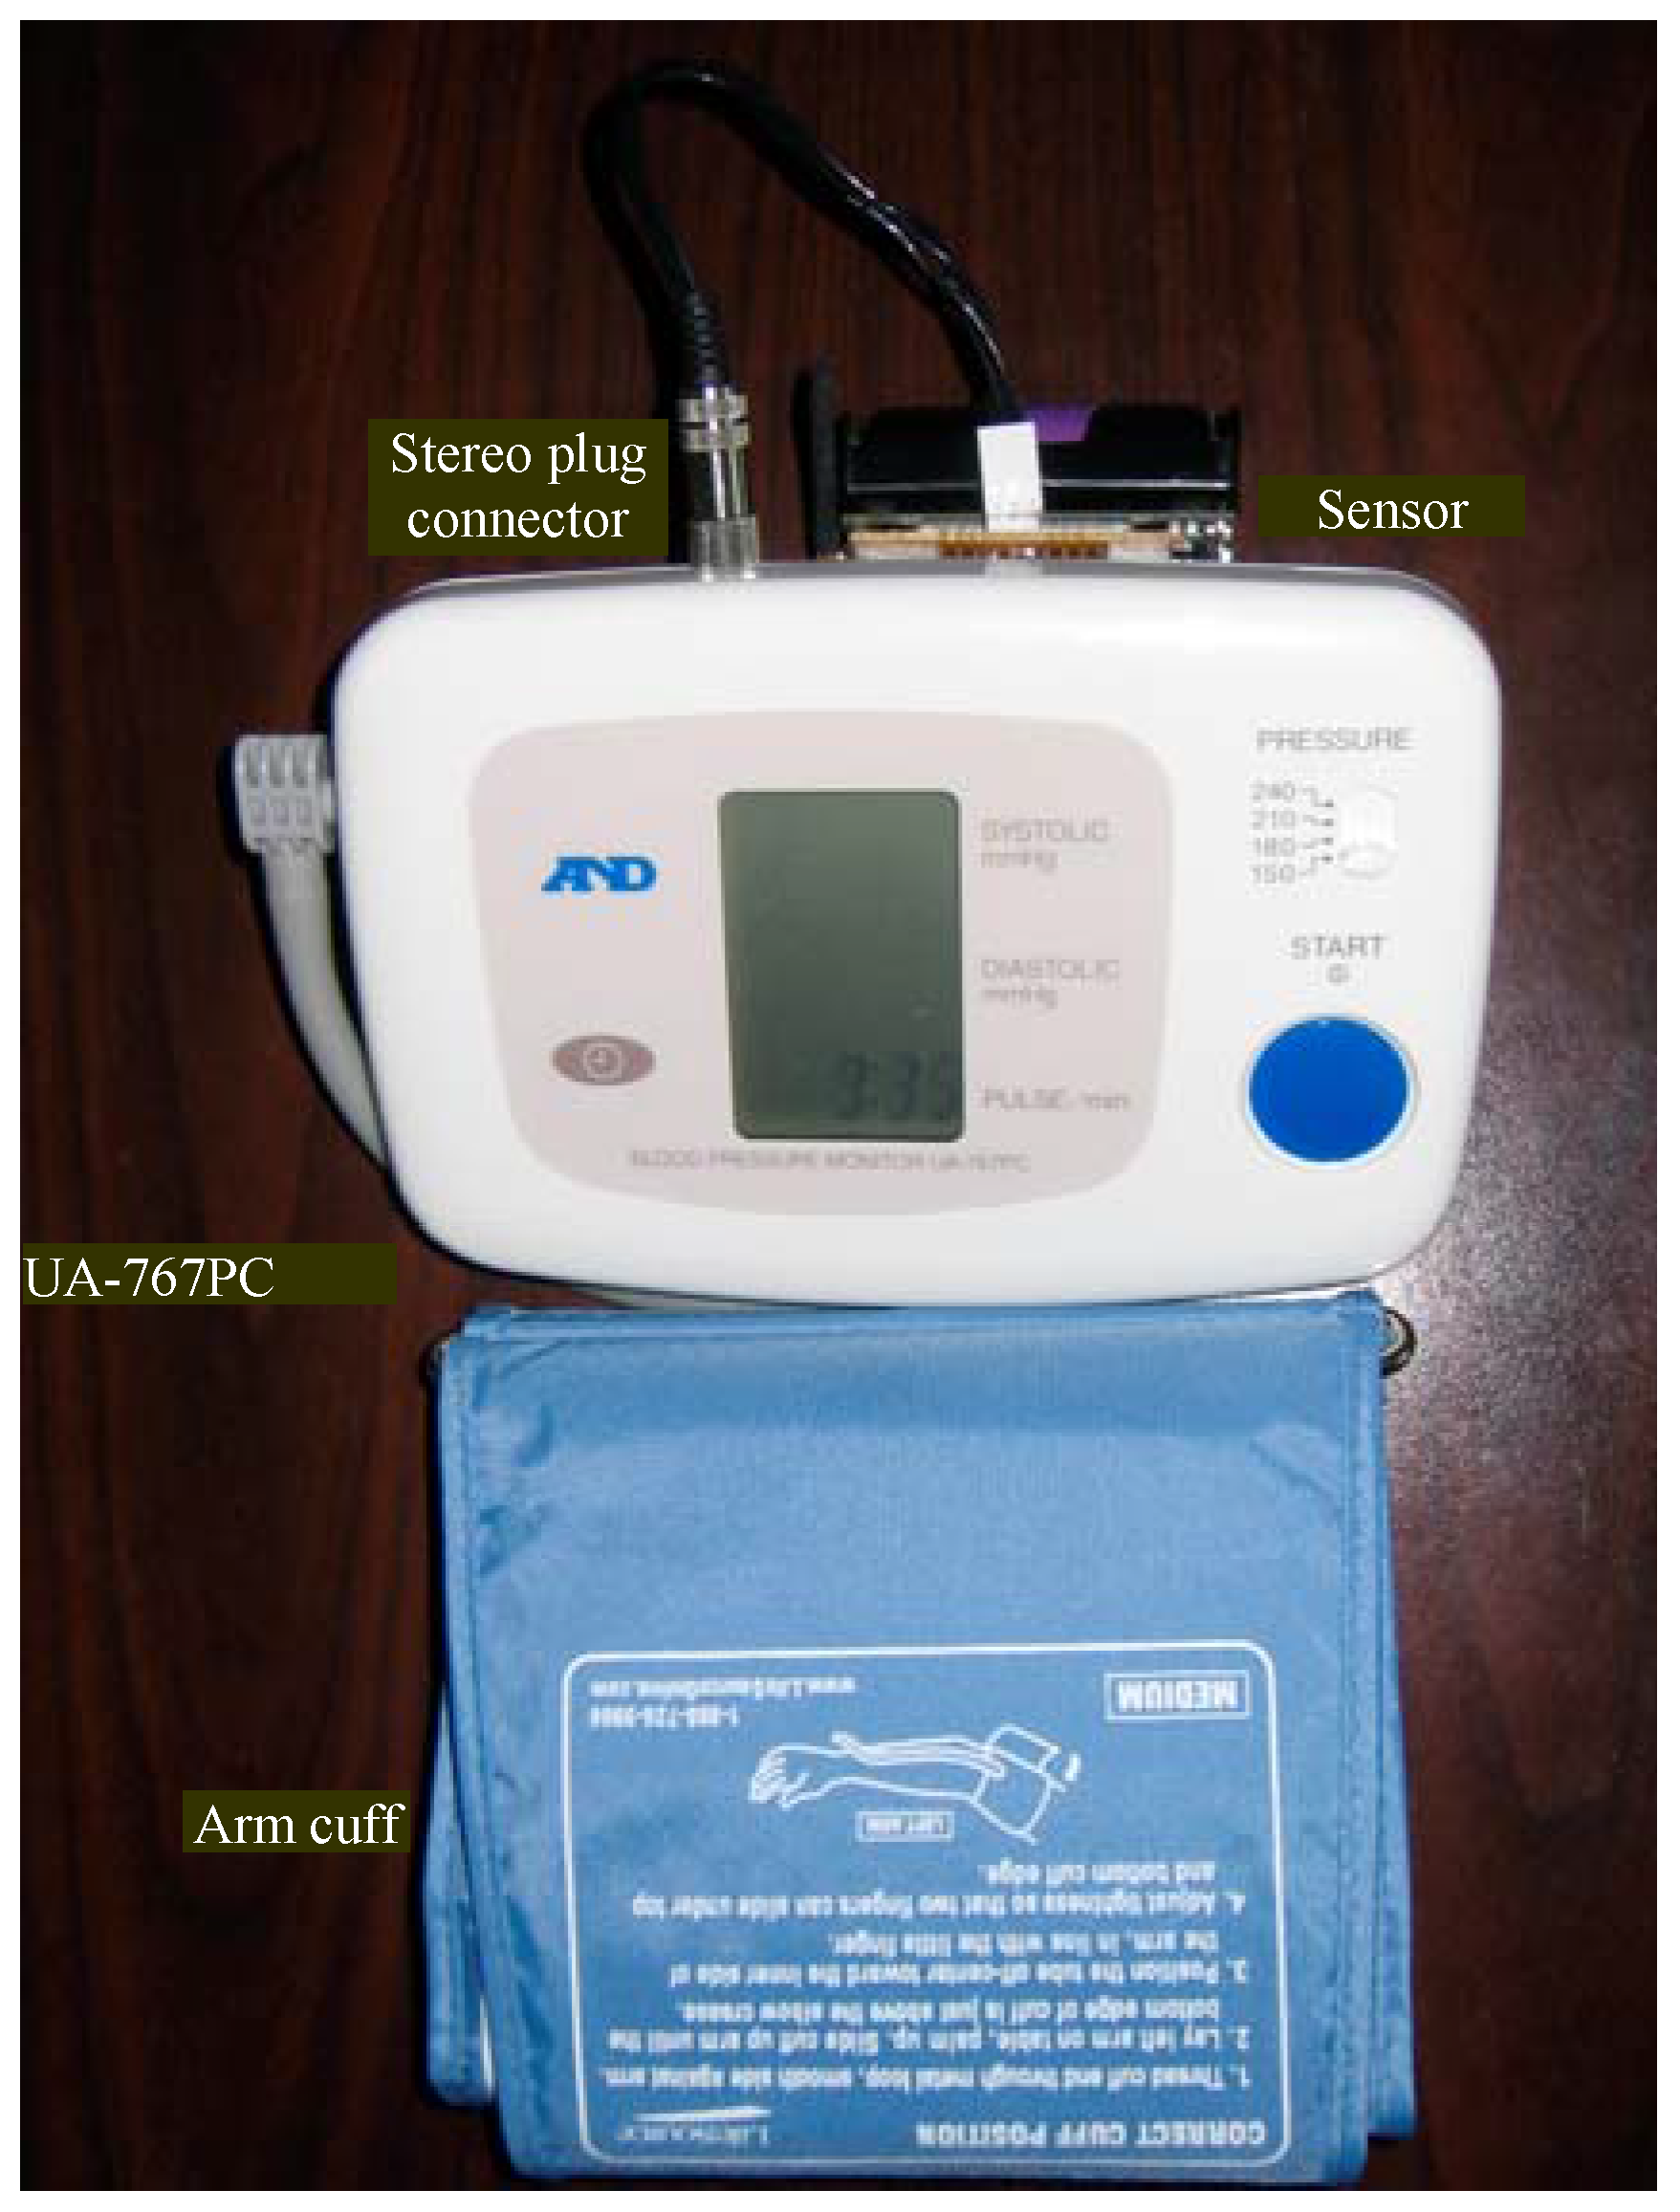
A commercially available A&D UA-767PC BPM [20] was used as the patient vital sign sensor. A readily available BPM was used in order to comprehensively test the feasibility of the system before attempting to interface practical sensors such as ECG and pulse-oximeters to sensor nodes. The UA-767PC BPM had a serial interface that was easily interfaceable with a Crossbow sensor node. This section describes the procedures used to interface the BPM to a sensor node and other important interface issues that involve the base station.
5.1. Sensor Node-BPM Interface
The UA-767PC BPM provided patient BP and heart-rate readings for the system. It includes a serial port that facilitates bi-directional communication at 9600 bps. A Crossbow mote was programmed as the sensor node to communicate with the BPM on this serial link to start the reading process and receive the patient’s BP and heart-rate readings. Once the readings were received, the sensor node communicates with the network and transmits them to the base station.
To start the communication process with the BPM, the sensor node sends a start signal to the BPM to switch it into communication mode and opens the BPM communication port. The BPM is now ready to receive commands from the sensor node. Next, the sensor node issues a command to take a measurement. This causes the BPM to inflate the arm cuff, and acquire the BP and heart-rate measurements. When the reading process has completed, the readings are sent to the sensor node. Limited processing is performed by the sensor node on the data before transmitting it through the network to the base station.
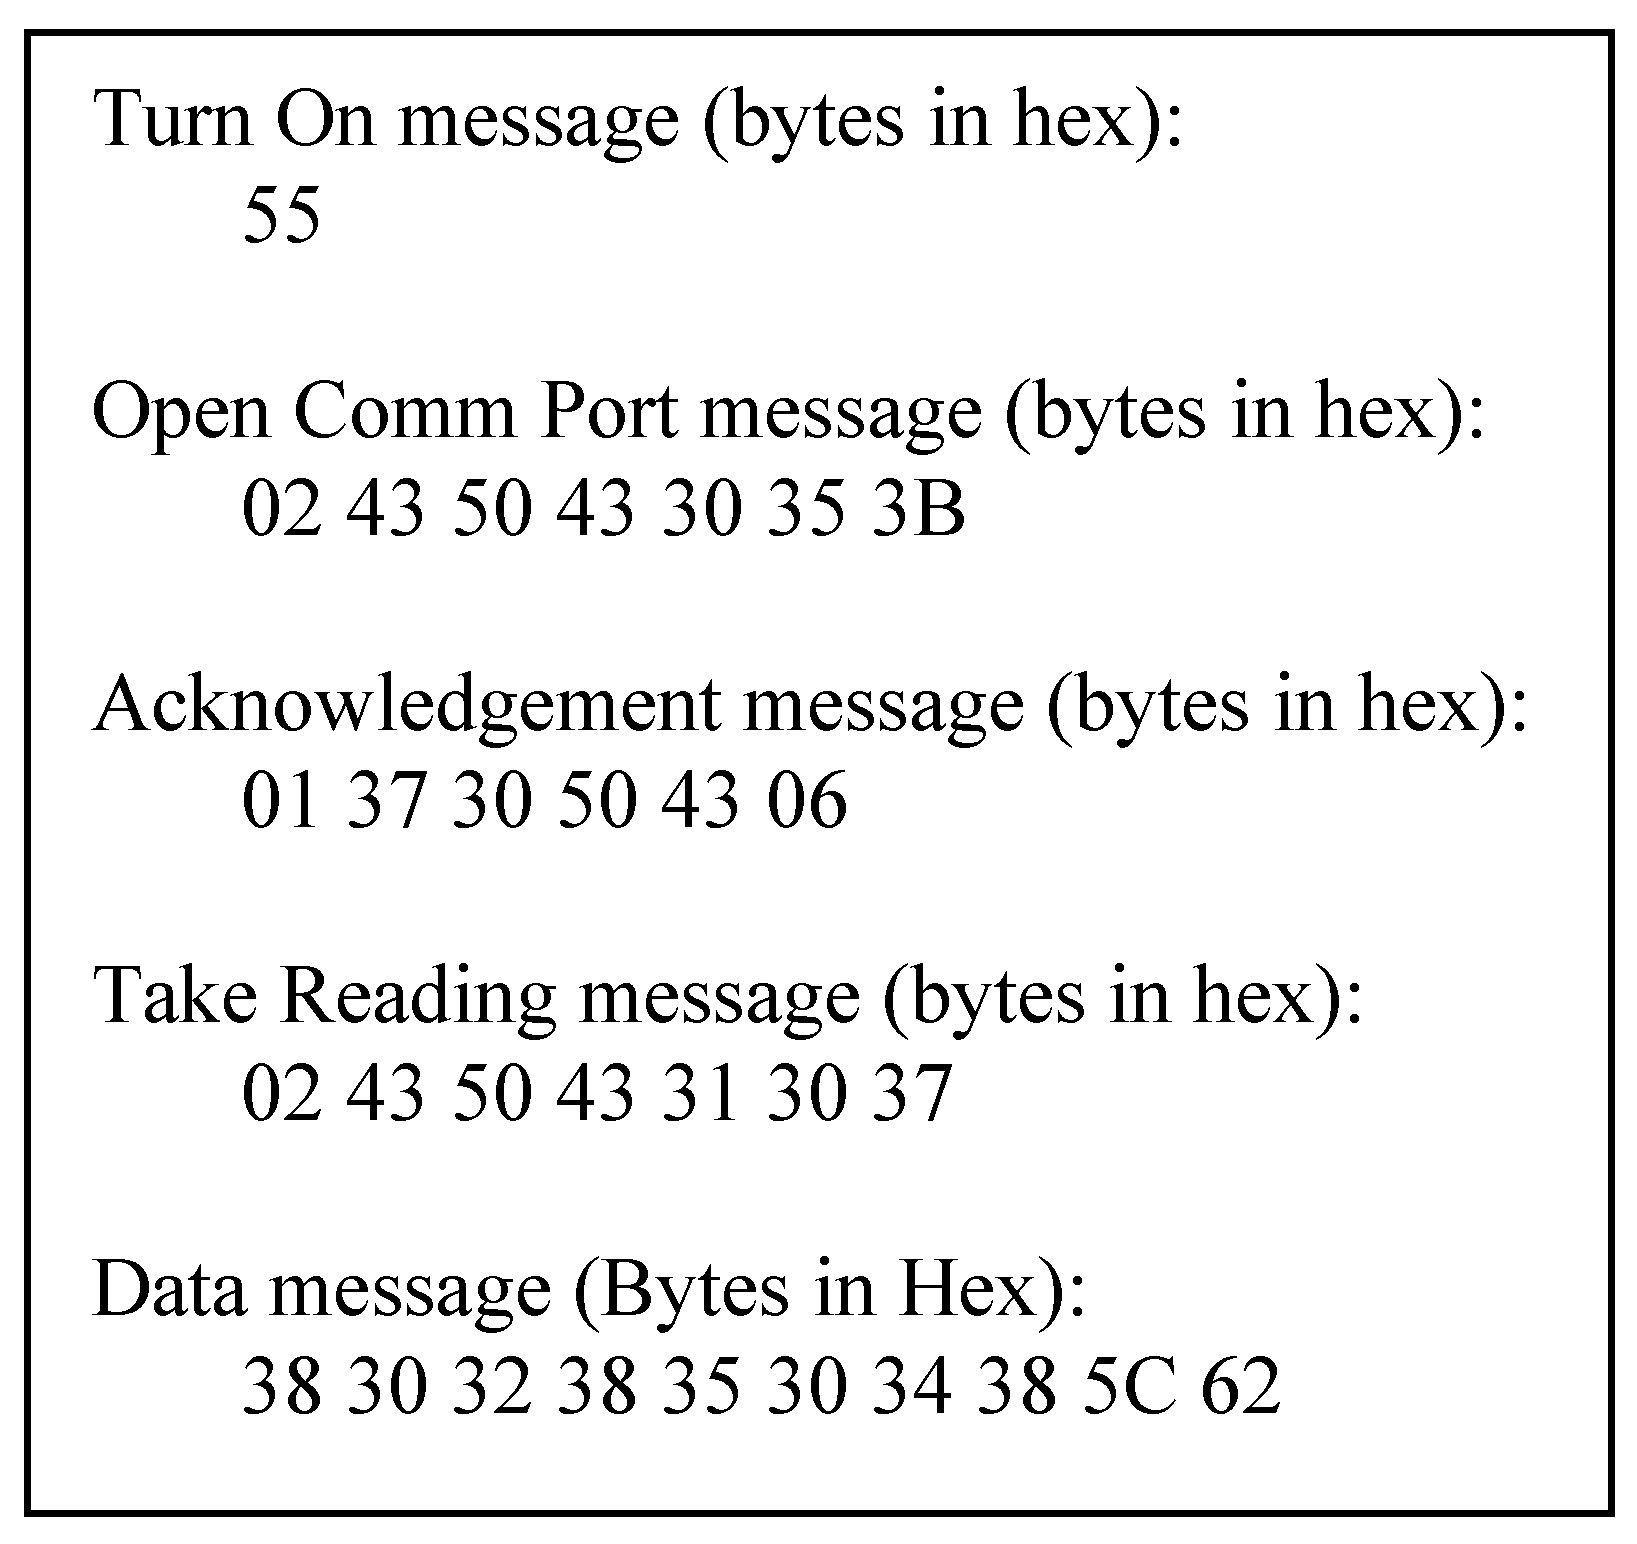
Figure 4 shows the communication sequence between the sensor node and BPM to acquire a reading. The communication format is in ASCII format and is described in [21]. Initially a “Turn On” message (0x55) is sent from the sensor node to the BPM. This byte orders the BPM to wake up and be prepared to receive commands from the sensor node. Next, the “Open Comm Port” message is sent to open the serial port of the BPM. Here, the first byte (0x02) indicates that the message is a command from the sensor node. Bytes 3 and 4 (0x50 and 0x43) inform the BPM details of the device sending the message. In this case, it is the sensor node and is defined as “PC” in ASCII. The following two bytes (0x30 and 0x35) are the command to open the BPM communications port.
Figure 4.
A&D UA-767PC BPM commands and messages.

The BPM responds to the sensor node’s “Open Comm Port” command by transmitting an “Acknowledgement” message that begins with 0x01 which indicates that the message is a control message. Once again, the next two bytes describe the device sending the message. Since this message is being sent by the BPM, it is represented as “70” in ASCII. The following two bytes detail who receives the message which is the sensor node represented as “PC” in ASCII. The final byte (0x06) indicates that the control message is an acknowledgement.
After receiving an acknowledgement from the BPM for its “Open Comm Port” command, the sensor node instructs the BPM to take a measurement. The “Take Reading” message follows the same format as the “Open Comm Port” message. ASCII “10” is sent as the command bytes. The BPM responds to this message by outputting a “Data” message. The first two bytes of the “Data” message are fixed and represent “80” in ASCII. The next two bytes represent the hex value of the systolic BP reading minus the diastolic BP reading in ASCII. From Figure 4, it can be seen that this value equals “28”. The following two bytes are the ASCII representation of the hex value for the diastolic BP reading. This value also equals “50” in ASCII. Therefore, in this case, the systolic BP reading of the patient is 120 and the diastolic BP reading is 80. The following two bytes are the ASCII representation of the hex value for the heart-rate. From Figure 4, it can be seen that the patient heart-rate is 72 beats per minute. In the present system, the measurement process is started when the sensor node is turned on. In future implementations, multiple medical monitors, such as the BPM, a pulse-oximeter and an ECG will be integrated with a single sensor node and readings will be performed on a scheduled basis.
5.2. Base Station-Host PC Interface
Java was used to implement the interface between the base station and a host PC. All communication between the base station and the PC is done through the UART. A separate thread from the main graphical user interface thread is used to maintain constant monitoring of the serial port. When a message is received, the message type is determined. If the message is a data message sent from a sensor node (i.e., a measurement from one of the medical monitors), the data is extracted and stored according to the ID of the sensor node that took the reading. If the message is a control message, then the information is passed directly to the program thread running the GUI. Control messages contain network information used to generate a network view for the user. A control message from a sensor node includes the ID of the sensor node and the ID of the router node used as the initial entry point into the network. A control message generated by a router node contains the ID of the originating router node itself and the ID of the router’s partner node. The information contained in the control message is used to generate a map of the network. In the current implementation, the map is a simple tree depicting the network structure.
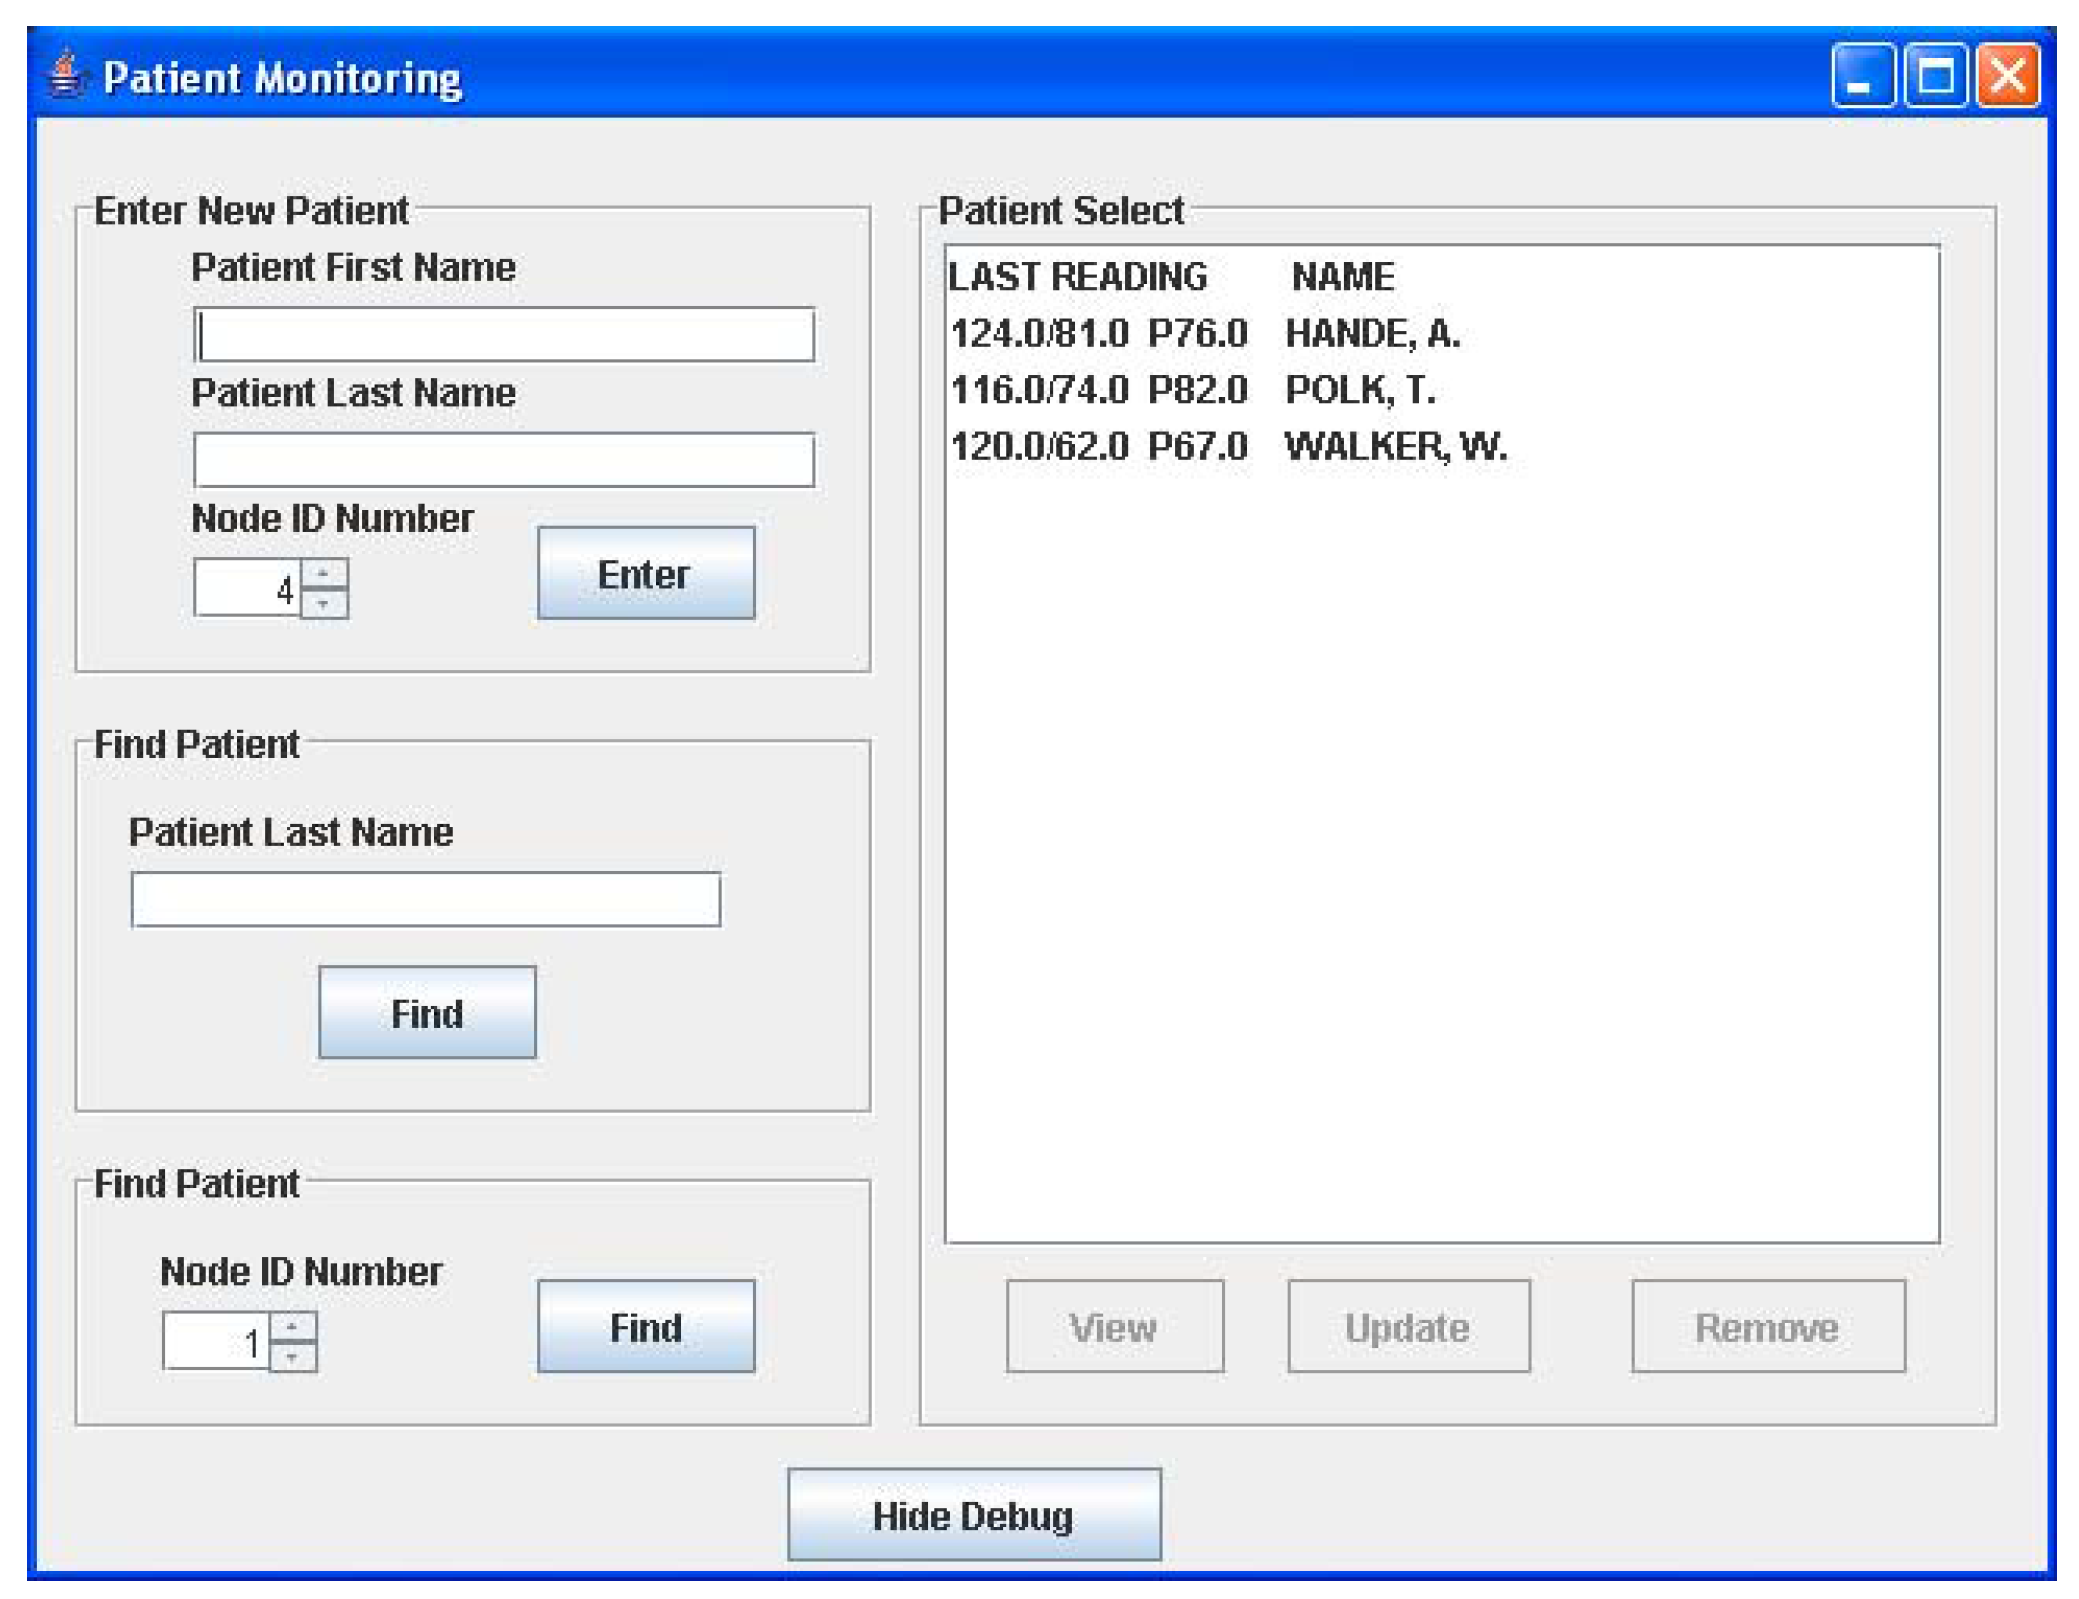
5.3. Graphical User Interface (GUI)
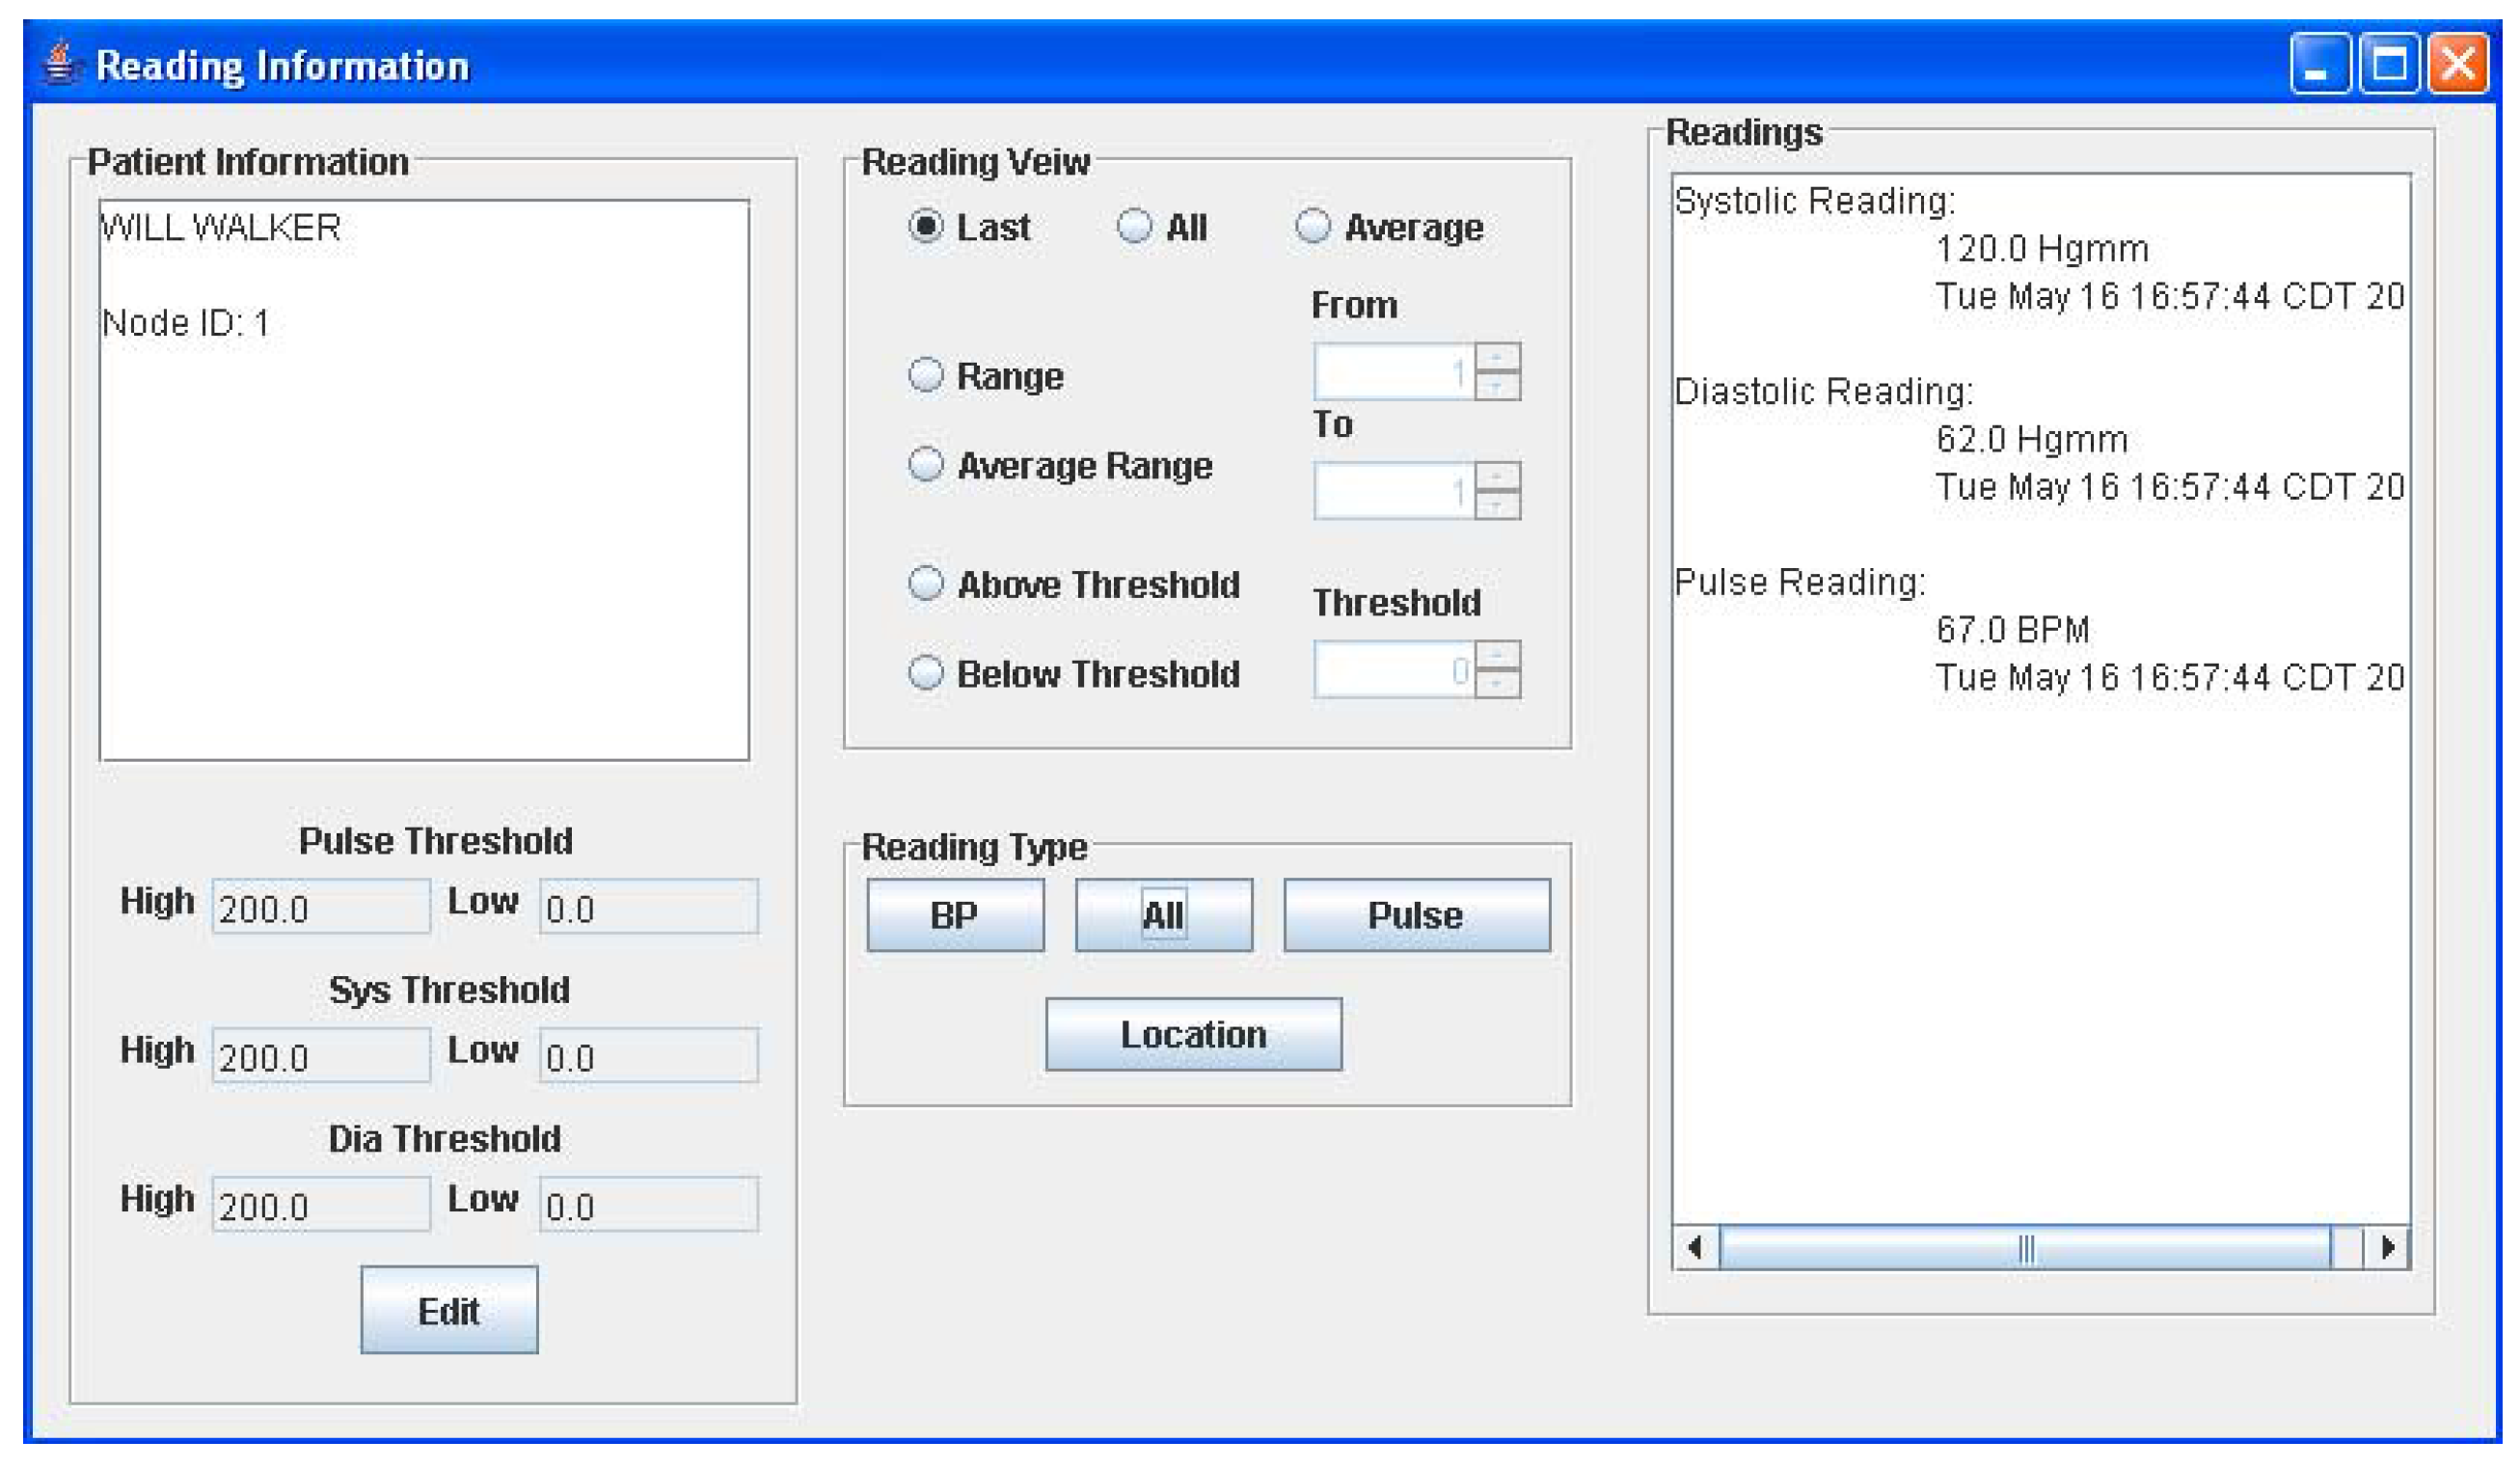
The graphical user interface is a Java-based program running on the host computer. The main window of the GUI is shown in Figure 5a. Here, the user can add a new patient to the monitoring network at any time by keying in the patient name and the ID of his assigned sensor node. If the patient name resembles other names in the database, a list will appear allowing the user to select the right patient from the database. Once entered in the system, all readings received by the PC from the patient’s sensor node, will be stored in an object corresponding to the patient. All stored readings can be viewed by selecting the desired patient name in the list shown in Figure 5a and selecting the “View” option. This action will open the window in Figure 5b, which allows the user to view various readings and edit patient information. The current implementation displays a text readout of the measurements as well as a graphical readout. When a reading is received, its value is checked against the threshold limits seen in Figure 5b and if it is beyond these limits, a warning message window appears to notify the user of the newest reading. Readings are not accepted from nodes that are not registered to a patient and will also generate a warning message. The sub-window provides the physician with three different options for viewing an individual patient’s data viz. only the last set of data, the entire data history, or the average of all recorded BP/heart-rate data.


6. Experimental results
In order to determine the correct number of solar panels for powering each router node a simple load simulation test was first conducted where a power supply was used to simulate the solar panels and a load resistance was used to simulate the router node load. A simple test set-up was constructed to simulate a router node turning on and off every second at 50% duty cycle. During the on interval, about 12 mA was found to be supplied from the power supply and the current obtained from the ultracapacitor bank equaled about 9 mA. The total current from the power supply-ultracapacitor bank equaled about 21 mA. During the off intervals the power supply charged the ultracapacitors at about 9 mA. In this phase, the lost capacitor charge during the previous load condition is replenished. The rated operating voltage range for the MICAz nodes was in the 2.7-3.6 VDC range. The present set-up provided a steady state load voltage of about 3.24 VDC.
As mentioned above, the maximum current drawn from the power supply when the router node turned on equaled approximately 12 mA. In earlier tests, each solar panel was found to supply about 2 mA under indoor light conditions. This indicated that around six solar panels would be required to generate a similar amount of current. However, in a later test, when the power management circuit was inserted, it was found that the current requirement increased to approximately 14 mA. This indicated a solar panel requirement of at least seven panels. As a factor of safety, it was decided to use eight solar panels in series-parallel to satisfy the power requirements for the energy scavenging circuit. Obviously, the number of solar panels can be increased to provide more power to the router node and the ultracapacitor. Undoubtedly, this will reduce the energy burden of the ultracapacitor and its size. But this will mean a larger solar panel size and cost. The present strategy of evenly distributing the power draw from both ultracapacitor and solar panels seemed to work better.
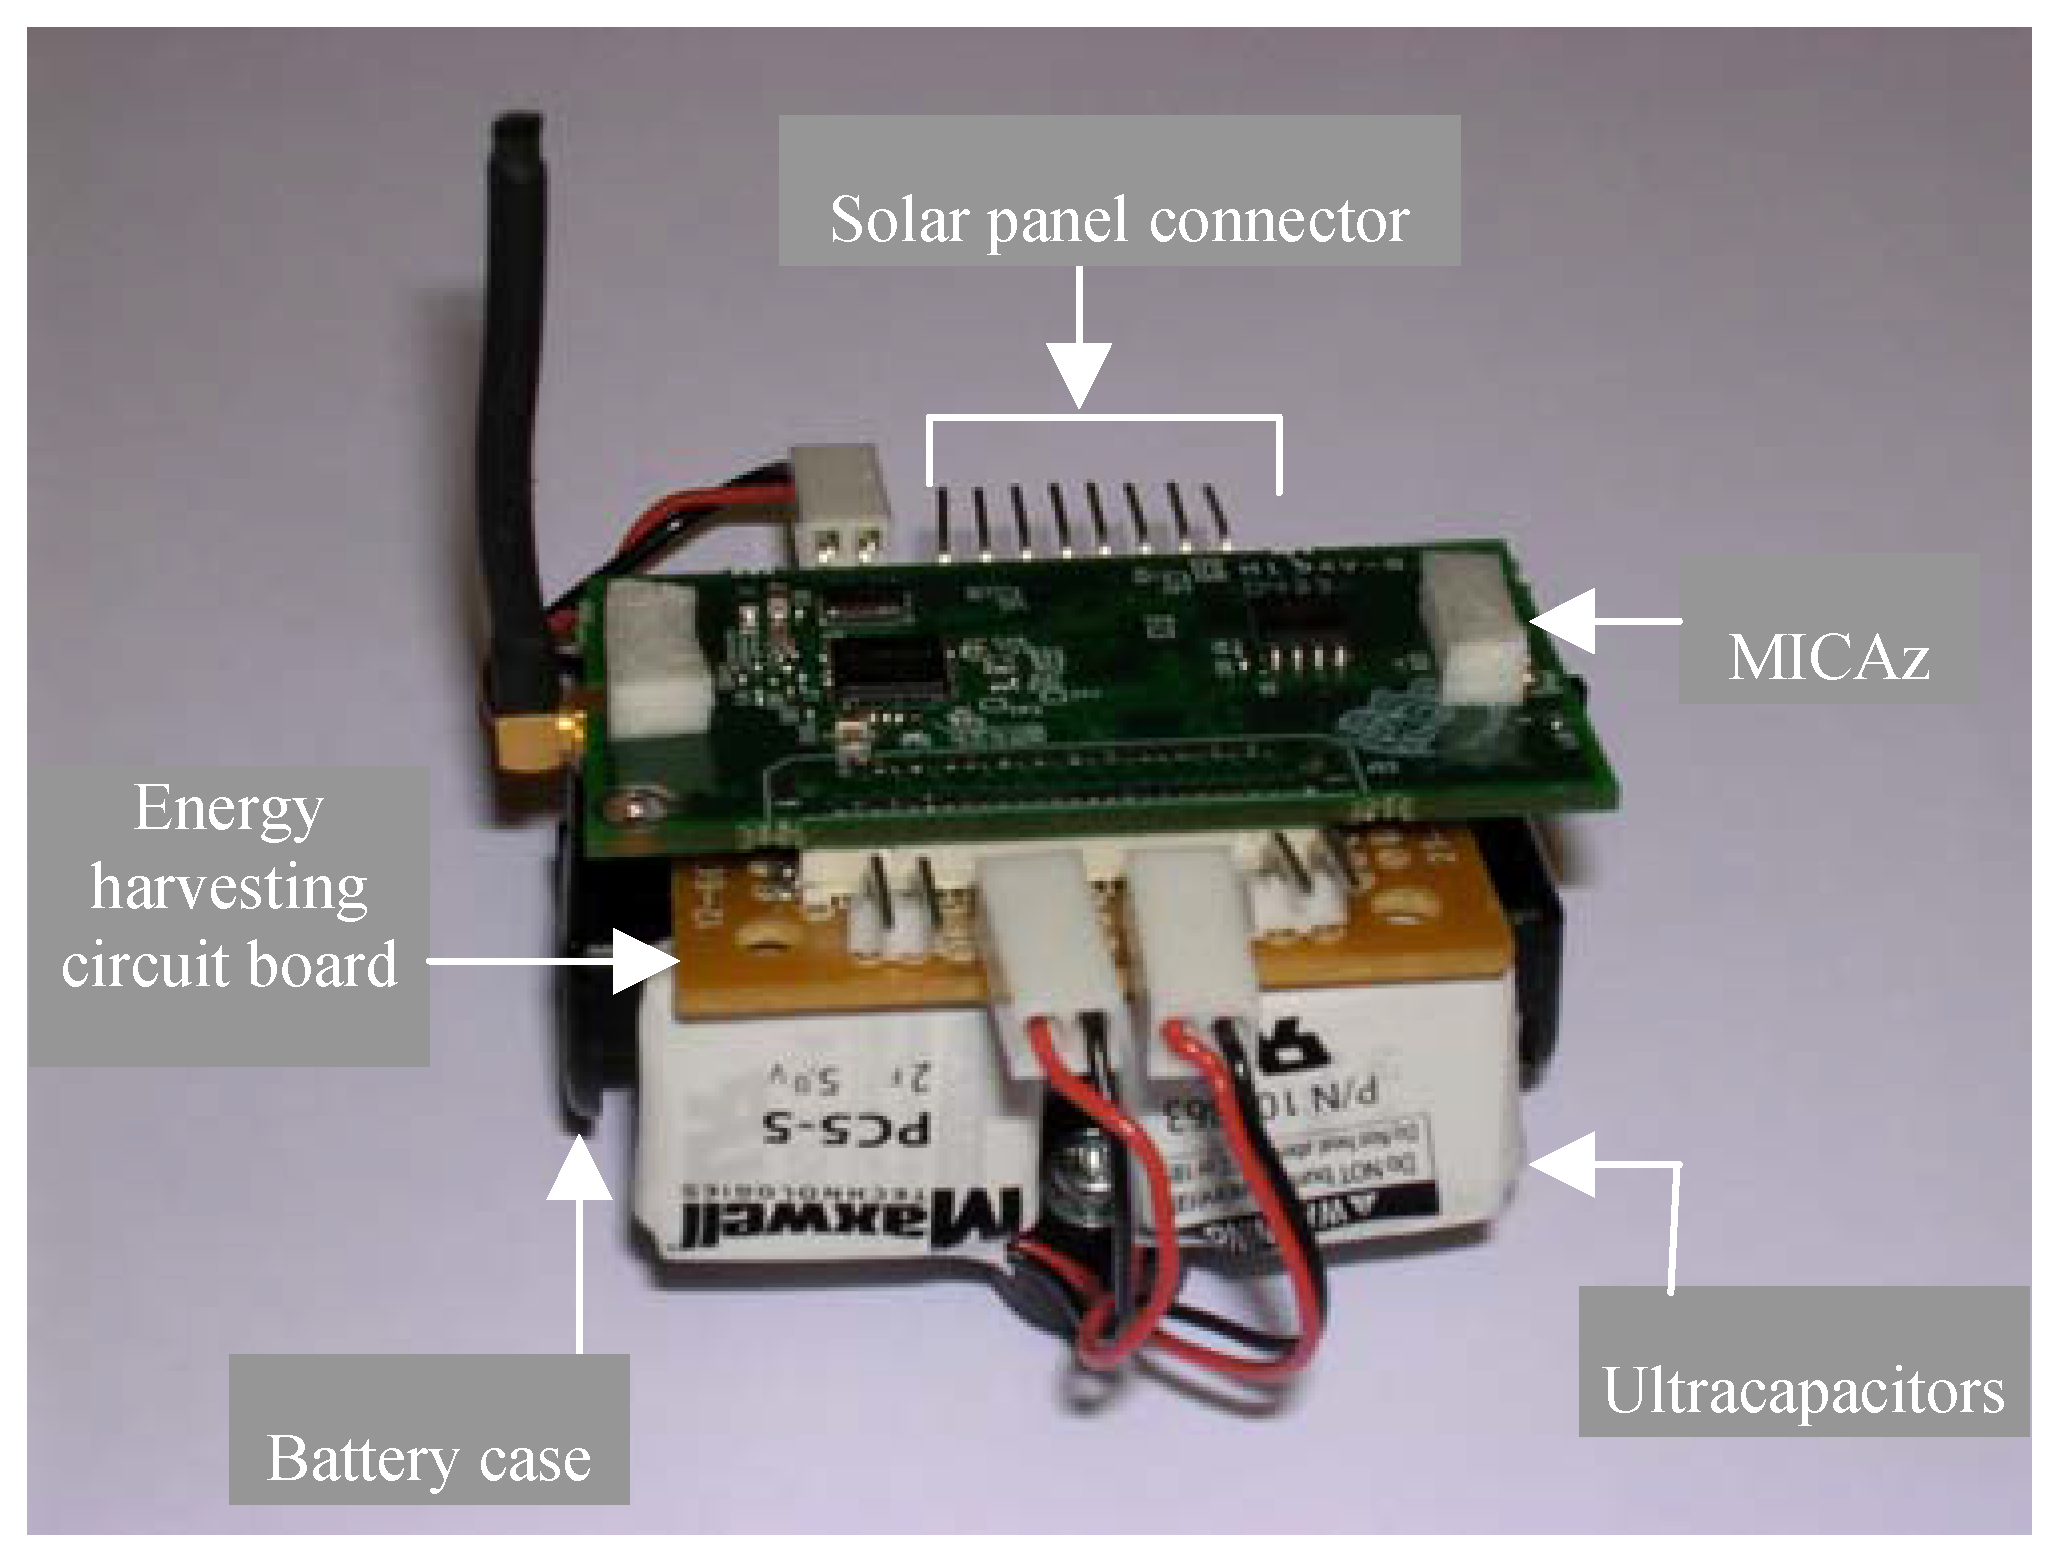
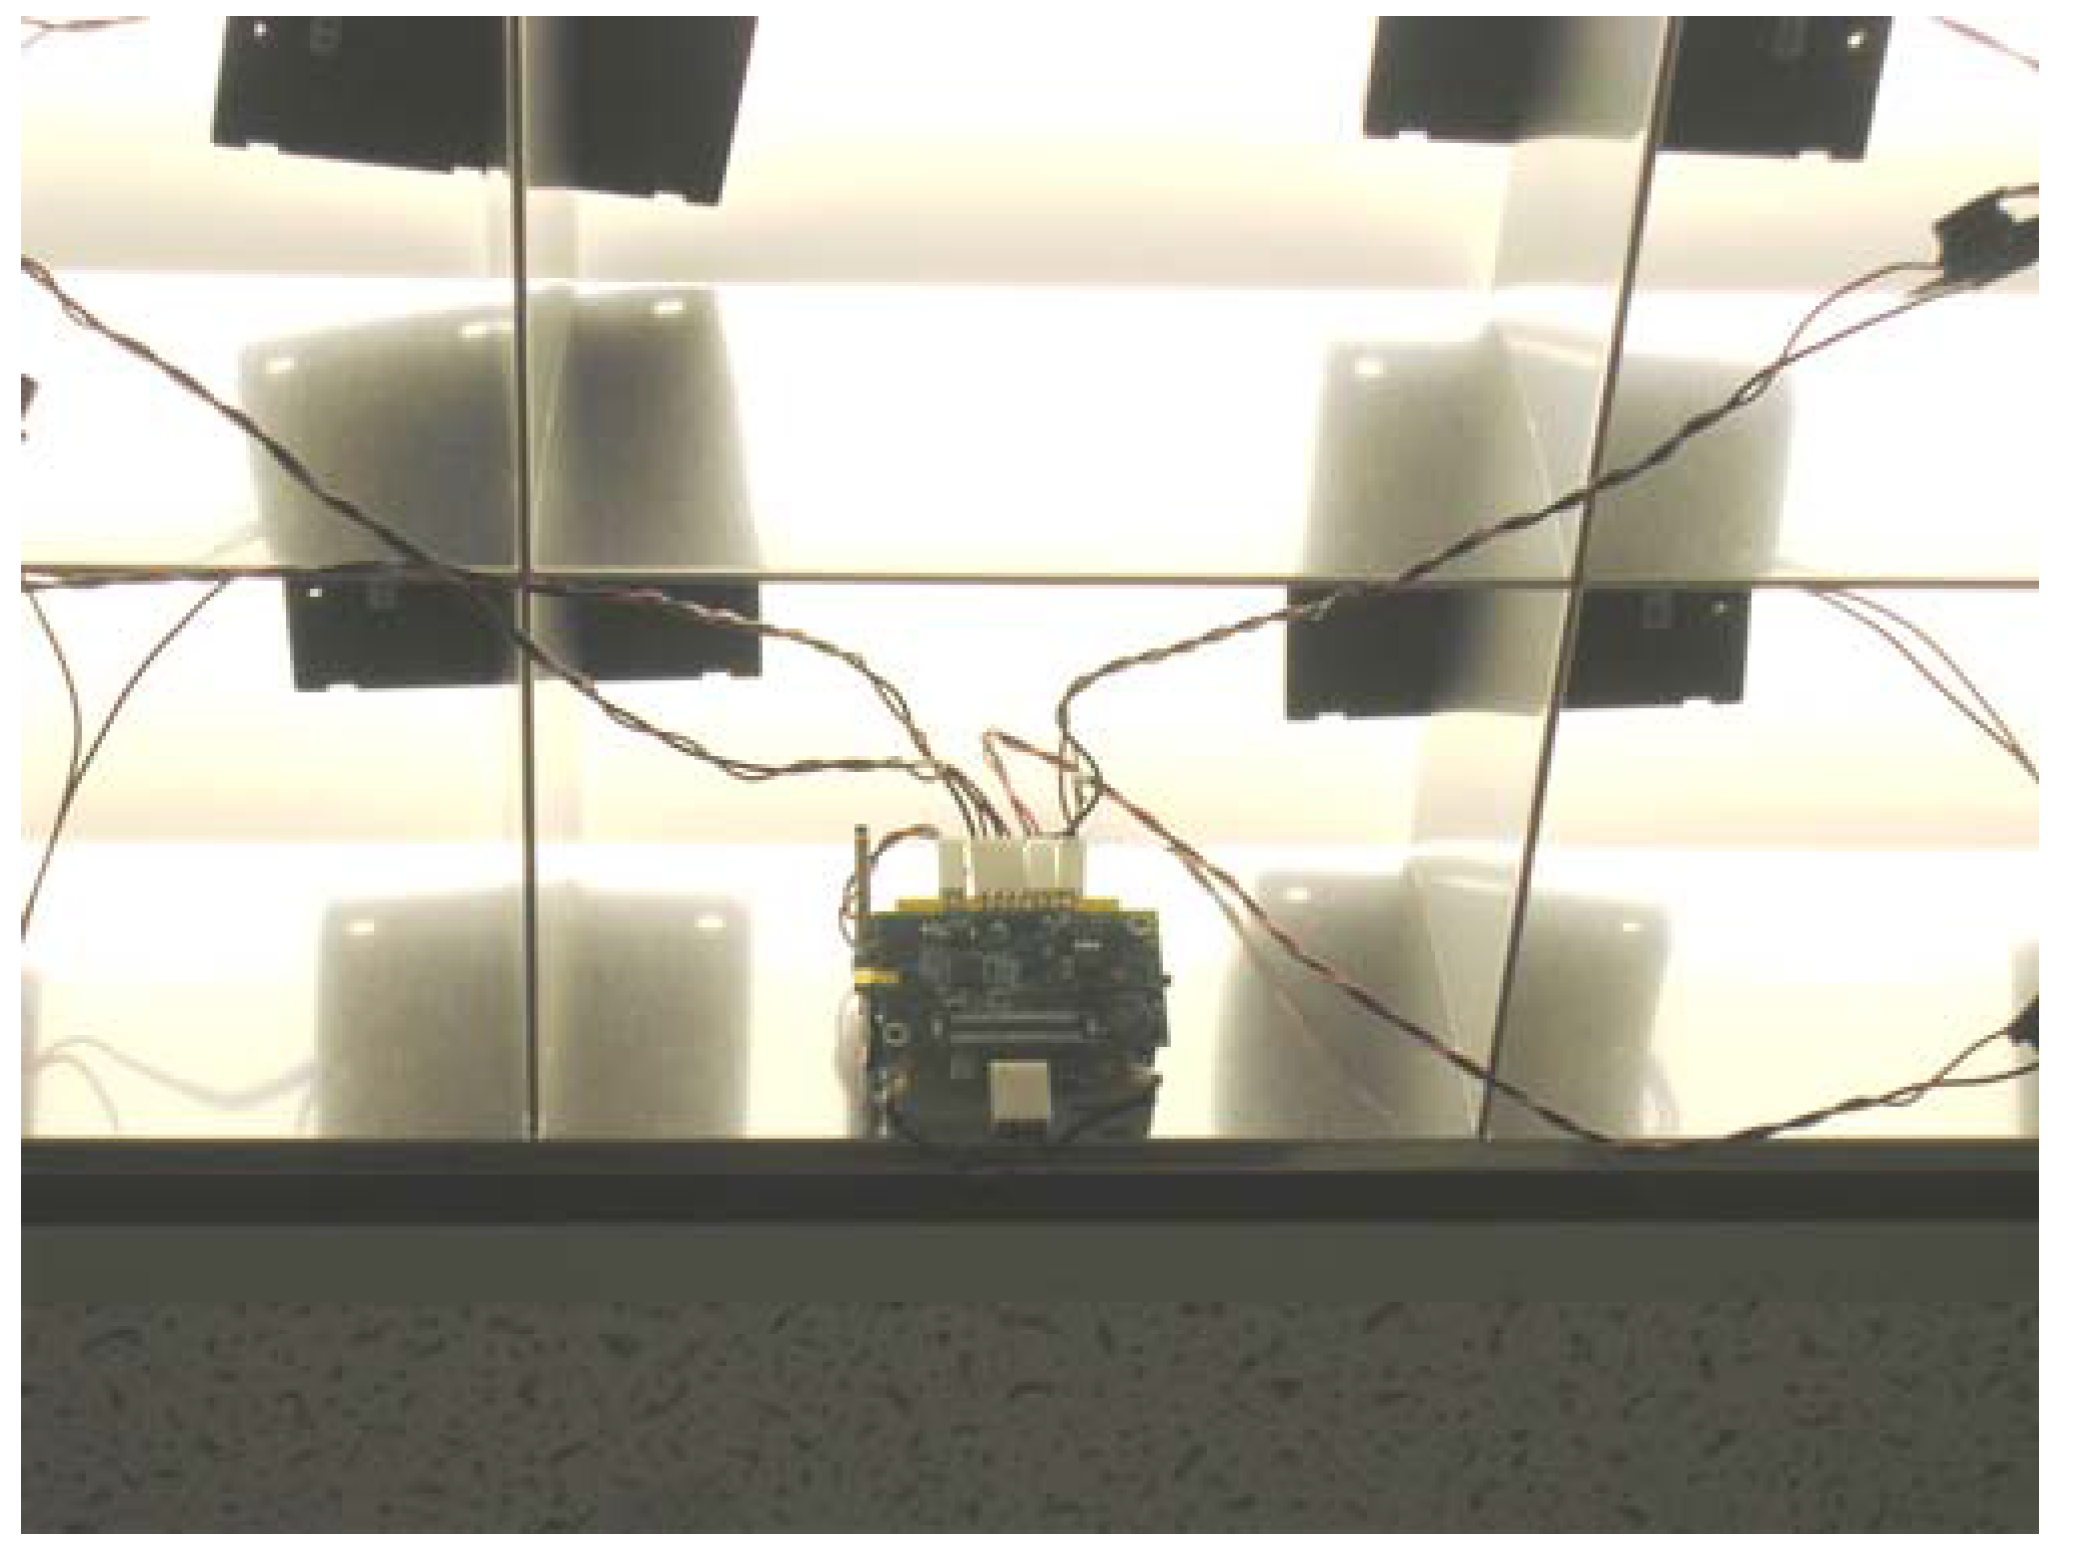
The preliminary network framework was first tested with one sensor node and two router nodes that acted as an RP. All three nodes were programmed to route their supply voltage (VL) to the base station every ten seconds. The sensor node VL data was used to simulate a sensor reading. The intention was to first comprehensively test the network framework and solar energy scavenging system before attempting to interface the UA-767PC BPM to a sensor node. The router nodes also transmitted their VL every thirty seconds to enable the base station to monitor and detect a possible failure in their solar panel-ultracapacitor banks. Data received by the base station mote was first stored in its on-chip memory and then transferred to the PC for analysis. Results obtained indicated no packet loss and the VLs obtained at the base station from the sensor nodes and RP router nodes were about the same as what was measured by a digital voltmeter at each node’s power supply pin [19]. Figure 6 shows a router node with its energy harvesting circuit board and its set-up with solar panels located close to overhead 34W fluorescent lights.
Figure 6a.
Router node prototype.

Figure 6b.
Typical router node installation.

Next, the system framework was tested with two RPs to route the sensor node supply voltage to the base station. This test was conducted to verify the feasibility of multi-hop routing. The test results obtained were identical to that obtained when only one RP was used. Here, the sensor node voltage data was sent to the base station in three hops viz. S5 to RP #3, RP #3 to RP #1, and RP #1 to the base station.
After verifying correct network operation, preliminary tests were conducted wherein the entire system was tested for routing a single patient’s BP and heart-rate data to the base station [22]. Figure 7 shows the patient’s sensor node interfaced to the A&D UA-767PC BPM. A special connector board was used for interfacing the sensor node to the BPM. The sensor node successfully initiated a reading, gathered the data and forwarded it through the network to the base station via two RPs. The measurements were then forwarded through the serial port to the host computer, and the GUI displayed the data correctly. The displayed data is shown in Figure 5b for patient Will Walker. It can be seen from Figure 5b, that the pulse rate and BP reading that was taken on May 16, 2006 at 4:57 pm was 67 and 120/62 respectively. These values were found to be exactly equal to those displayed on the BPM LCD display.
Figure 7.
Sensor node interfaced to an A&D UA-767PC BPM.

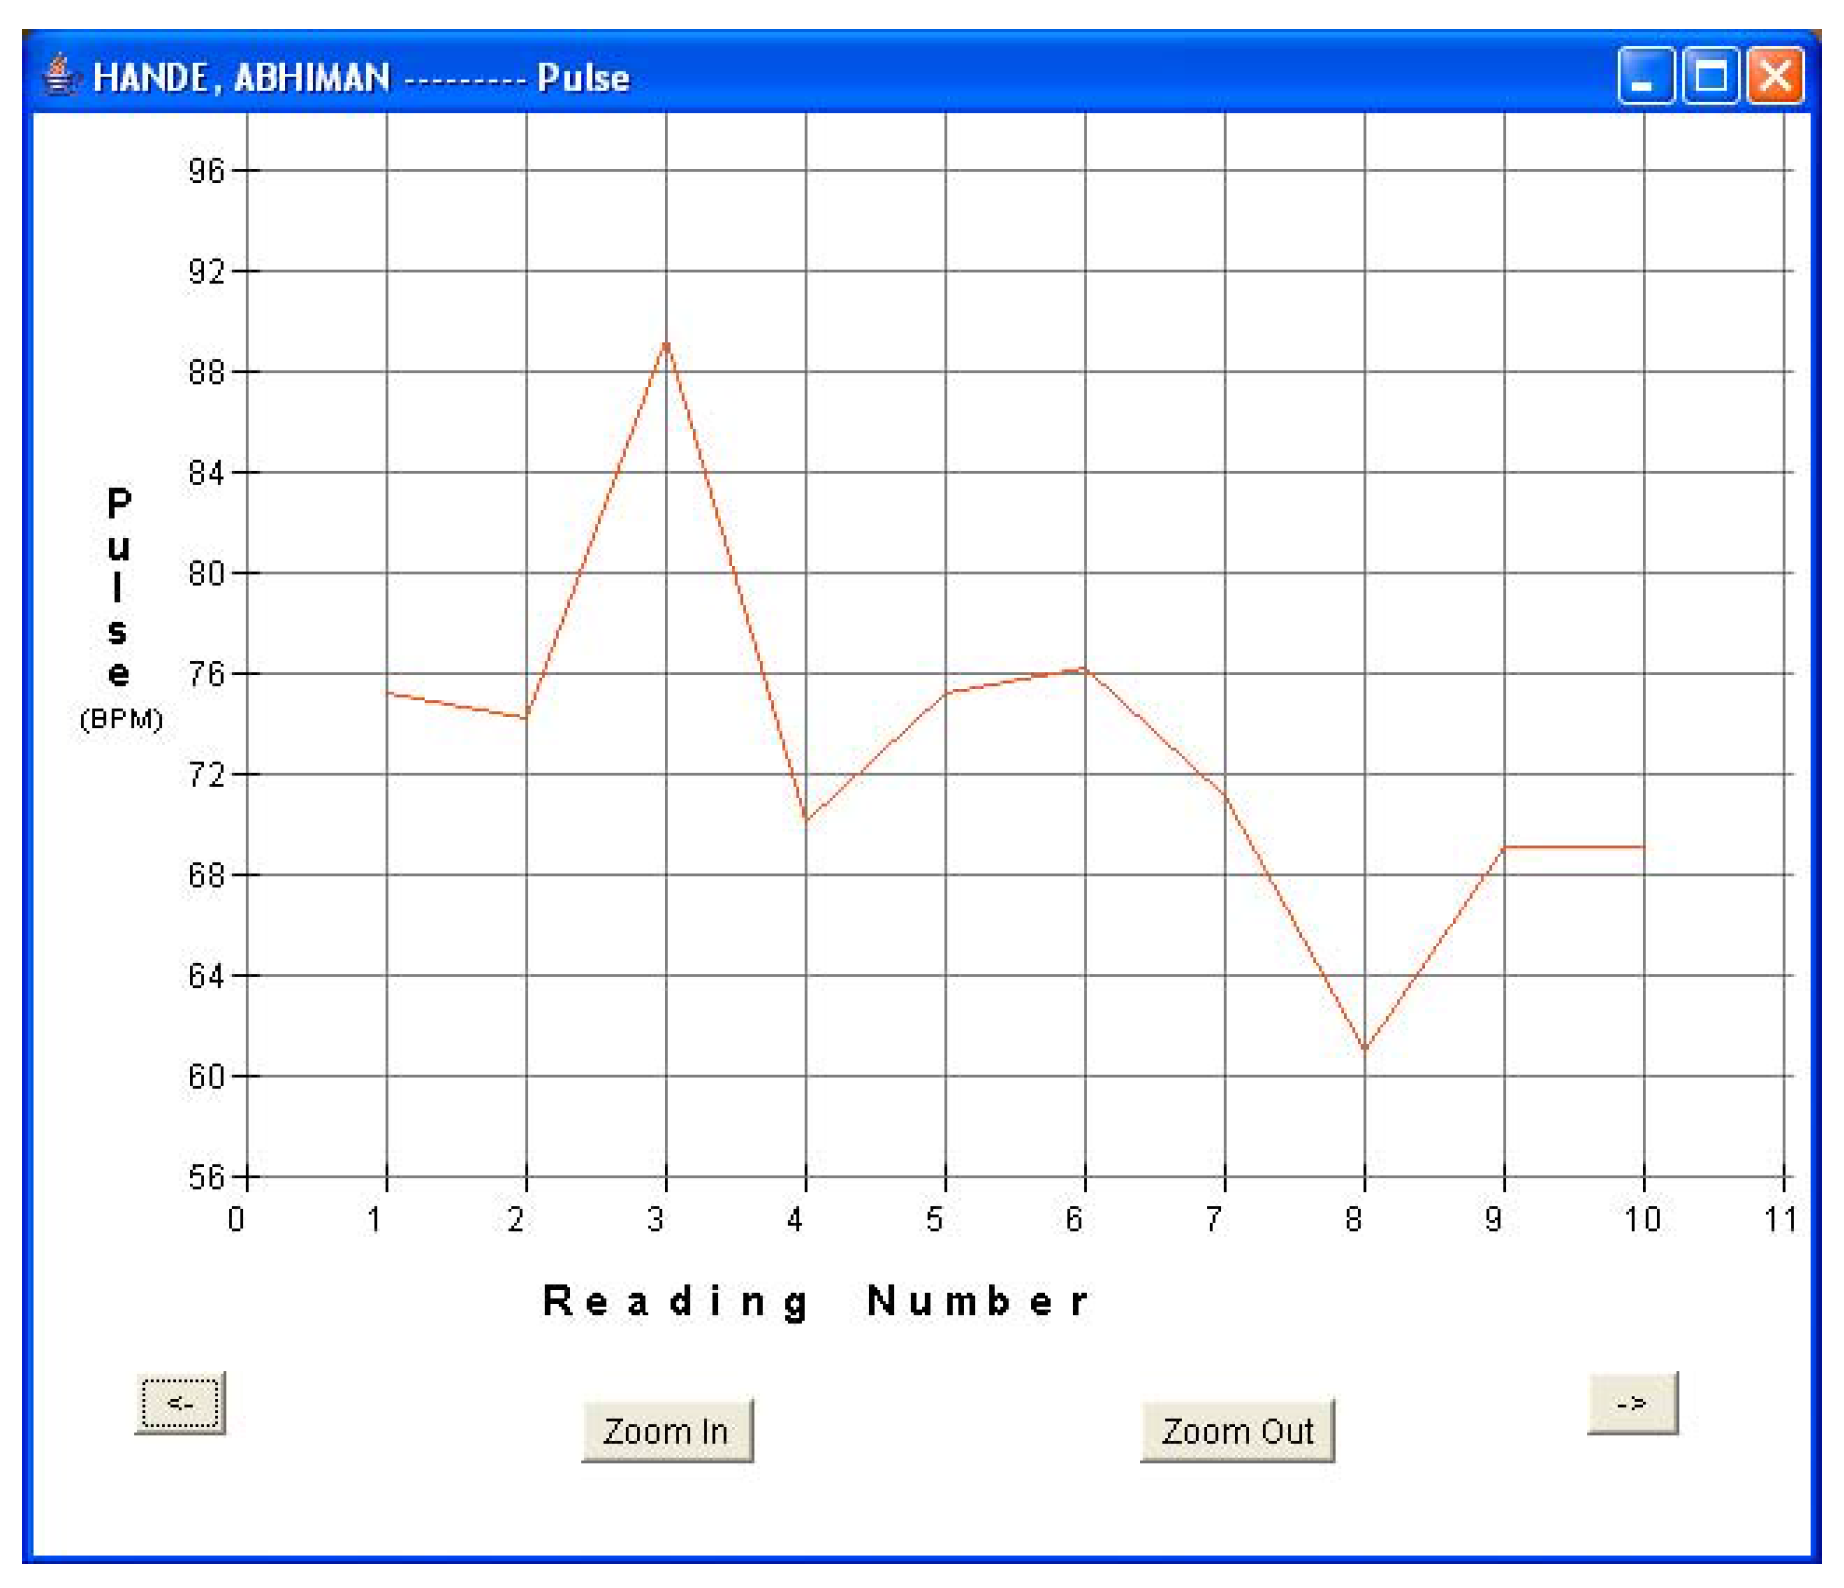
Finally, three sensor nodes were programmed with unique IDs for three patients in order to continuously monitor their BP and heart-rate approximately every fifteen minutes for about three hours. This test was intended to simulate a system that required continuous monitoring of a patient’s vital signs. Patient 1 (Will Walker) was provided with a sensor node that was assigned with a node ID = 1, patient 2 (Todd Polk) with node ID = 2, and patient 3 (Abhiman Hande) with node ID = 3. This enables the base station and its monitoring program to recognize each patient based on his sensor node’s unique ID. The present set-up allows for setting up sensor nodes for 255 different patients at any given time. However, minor software modifications will enable many more patients to be monitored. In a hospital setting, this can enable patients to move around freely with their distinct sensor node and the network will route the sensor data through the nearest set of self-powered router nodes to the base station for real-time monitoring.
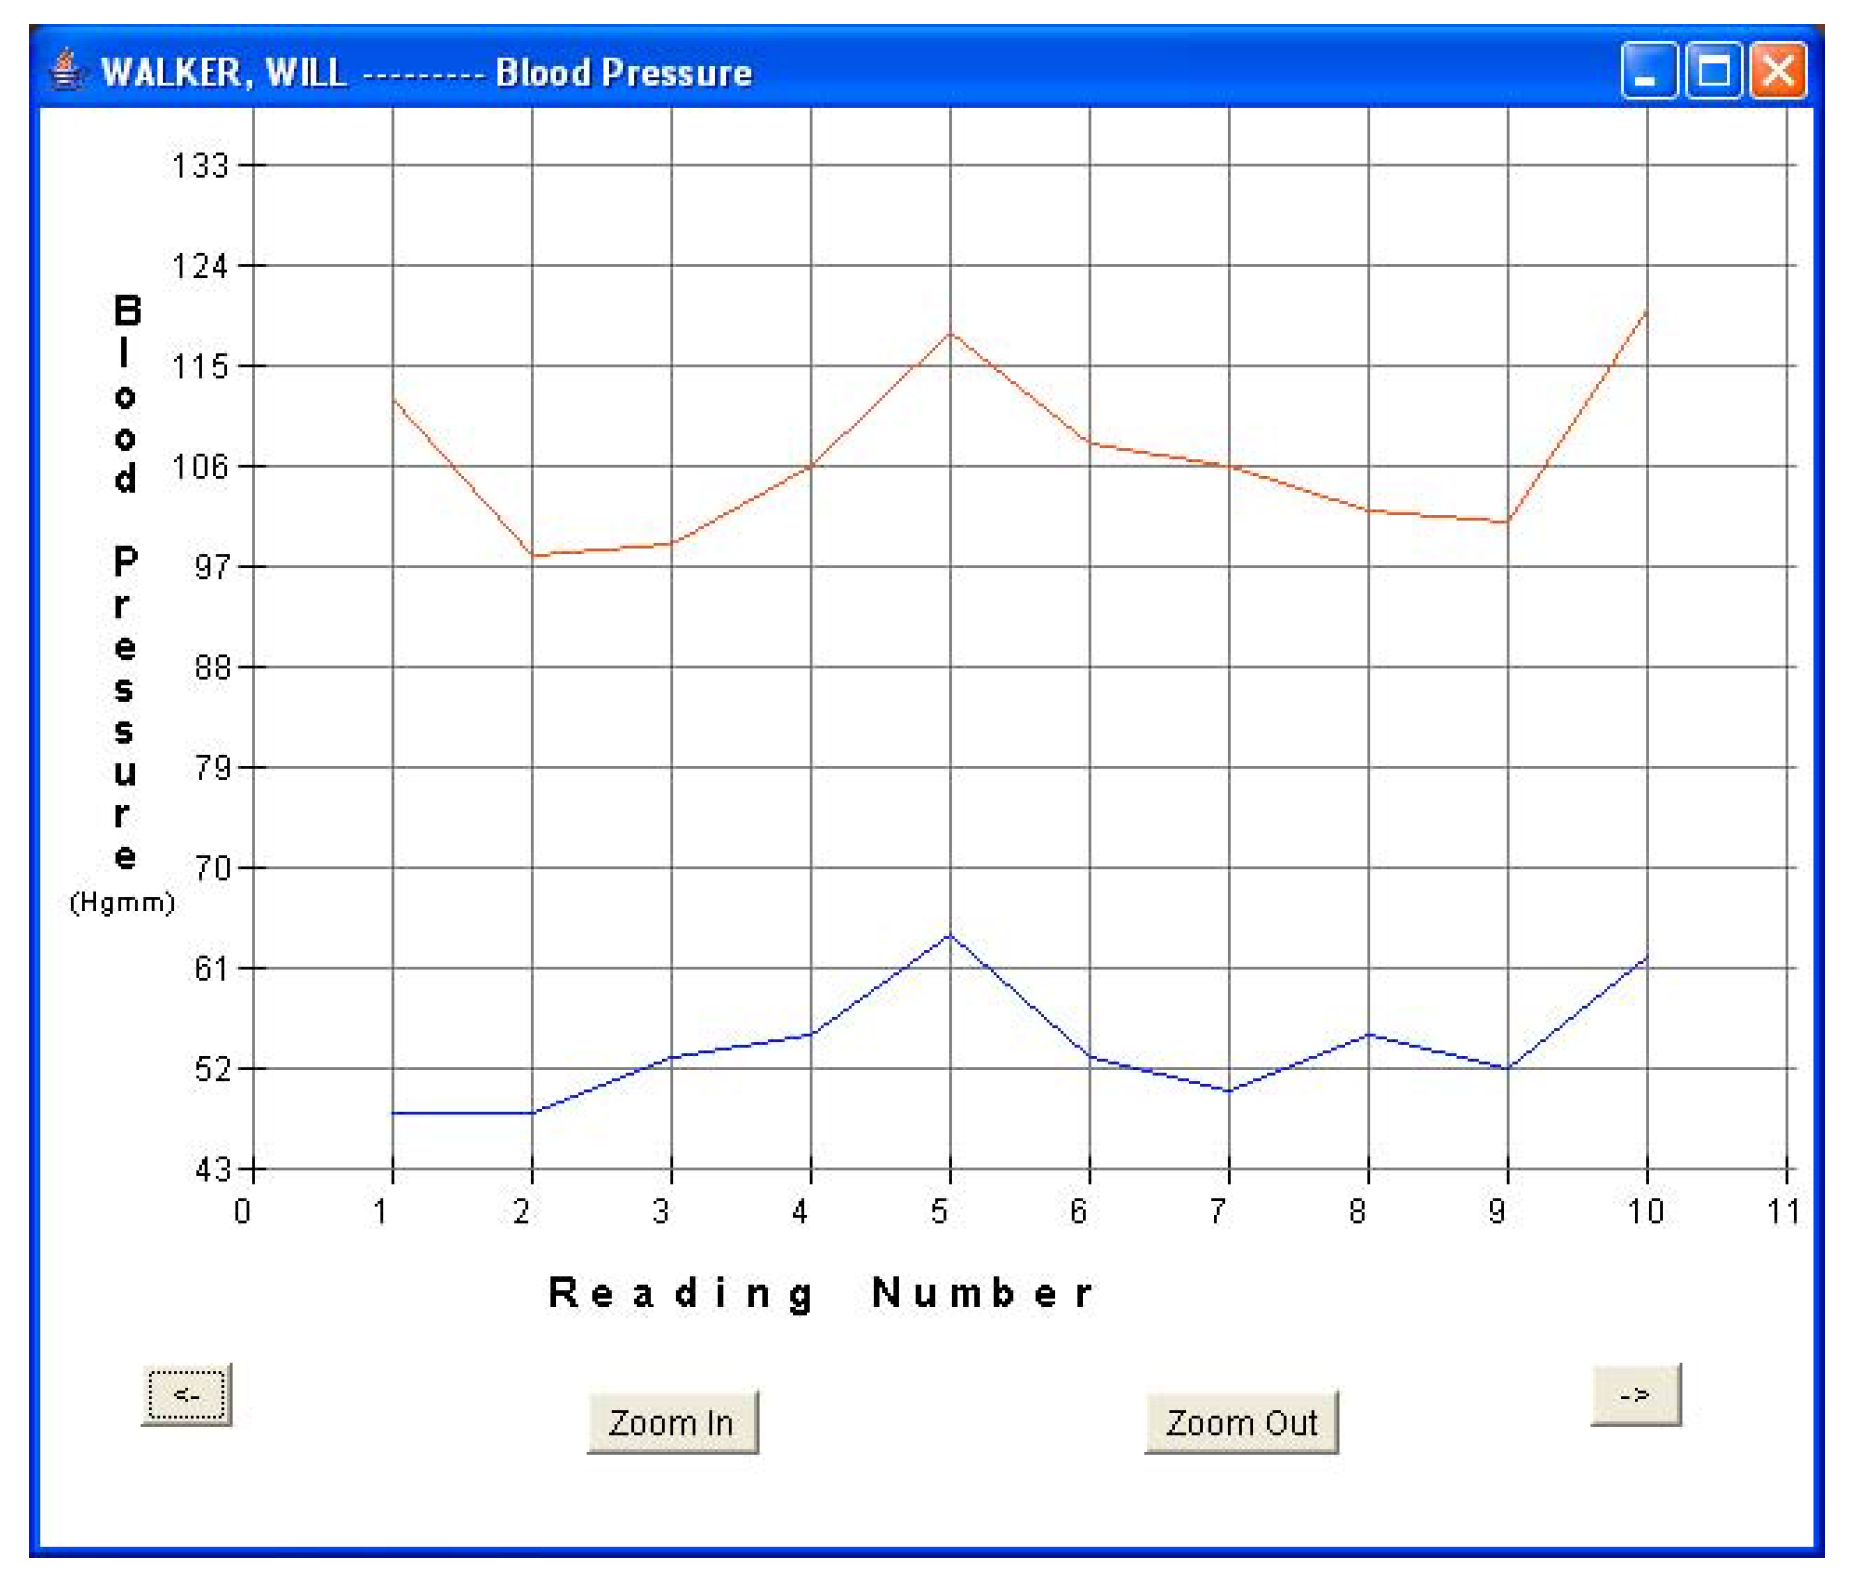
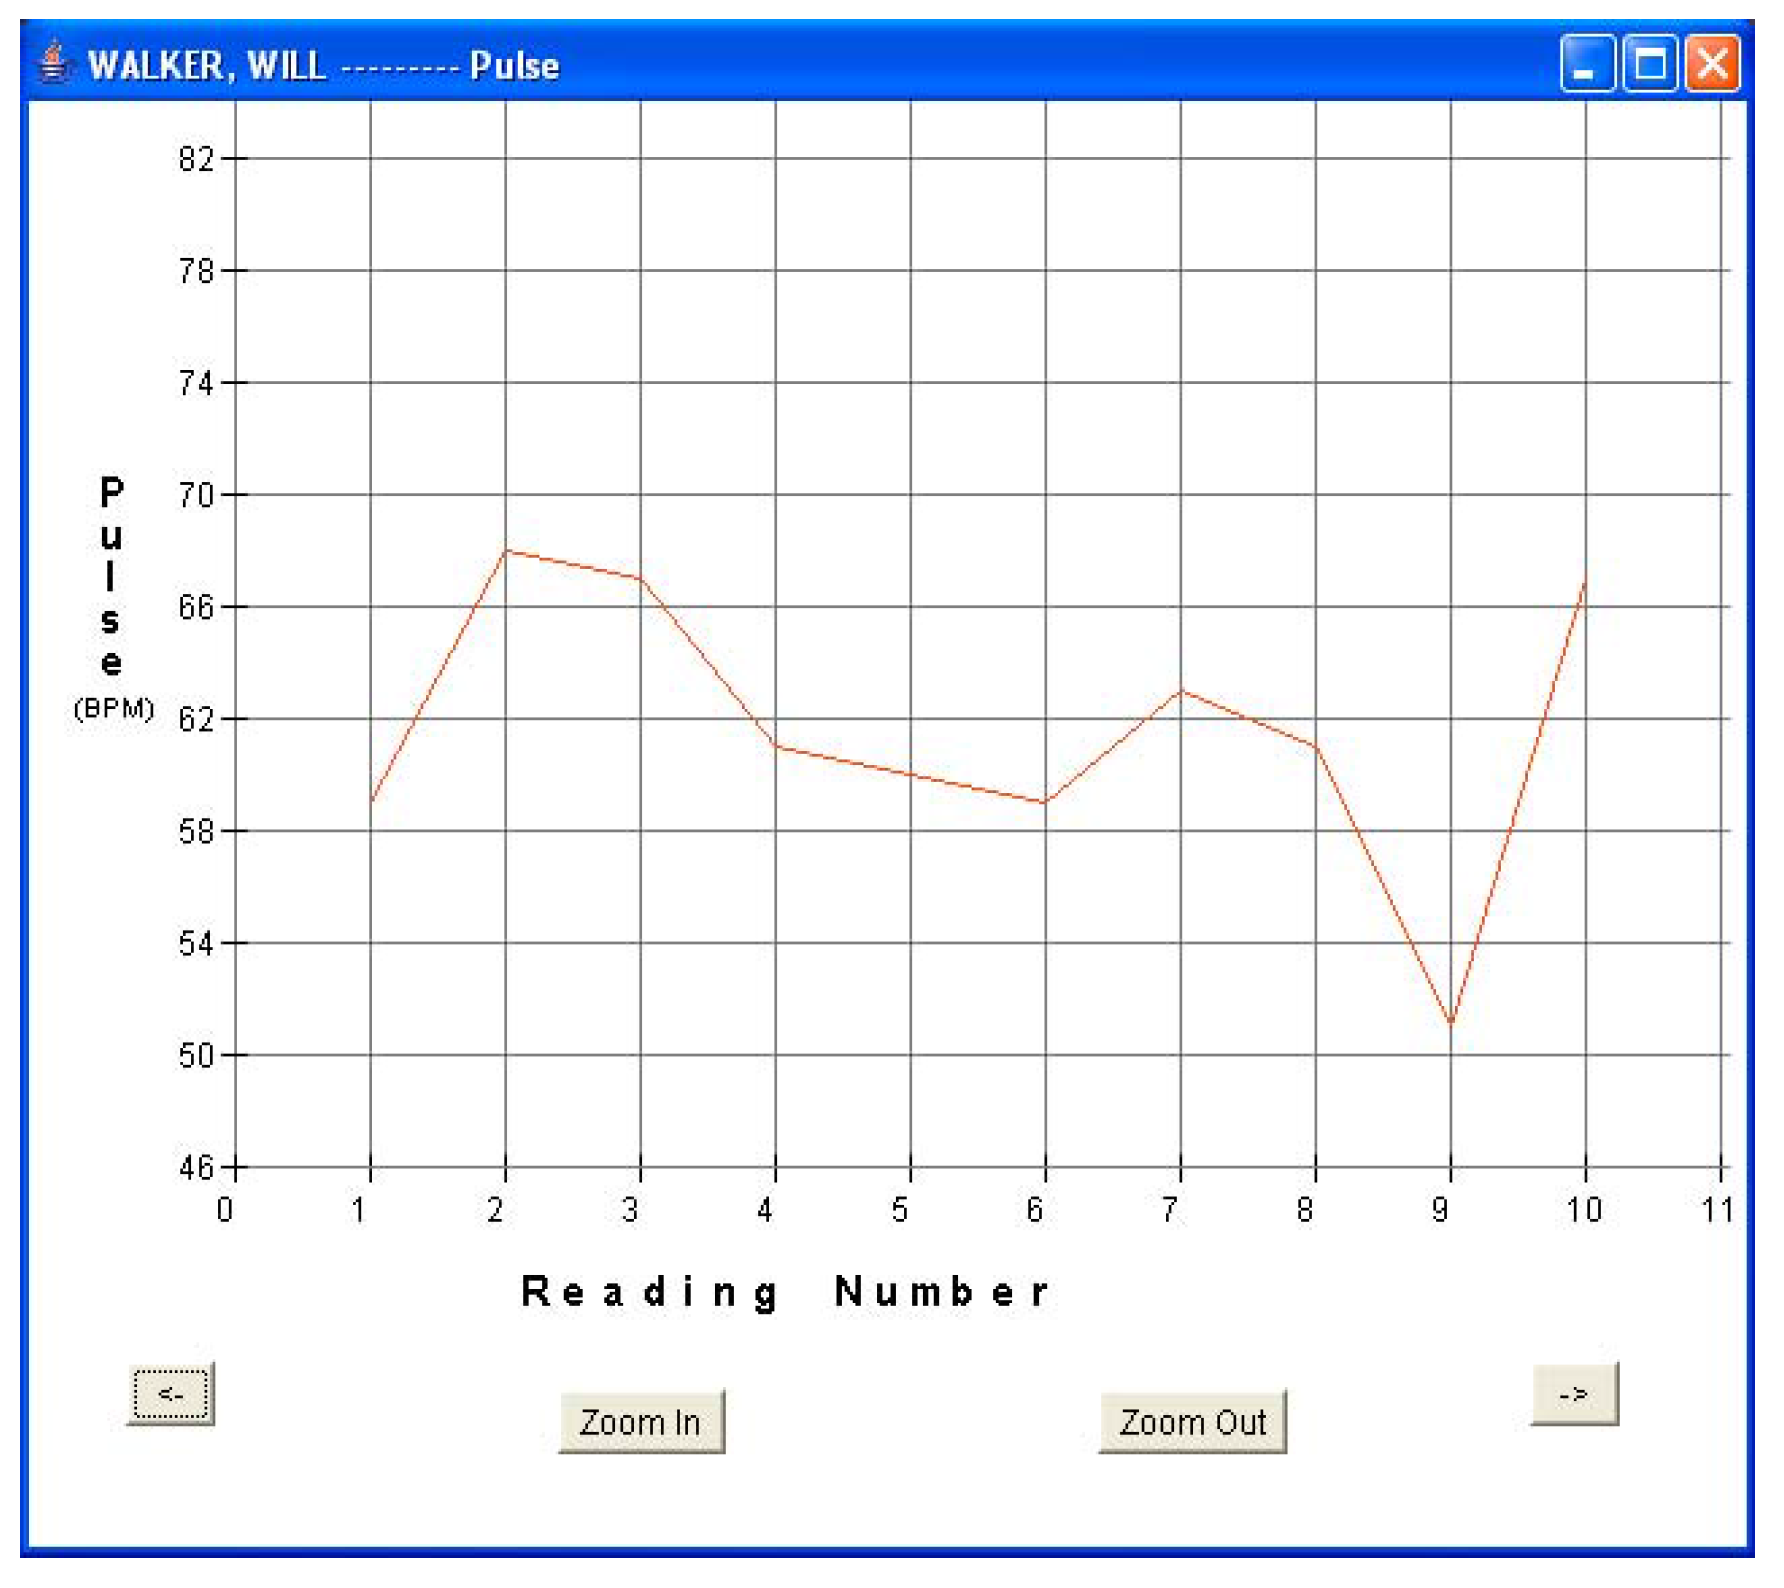
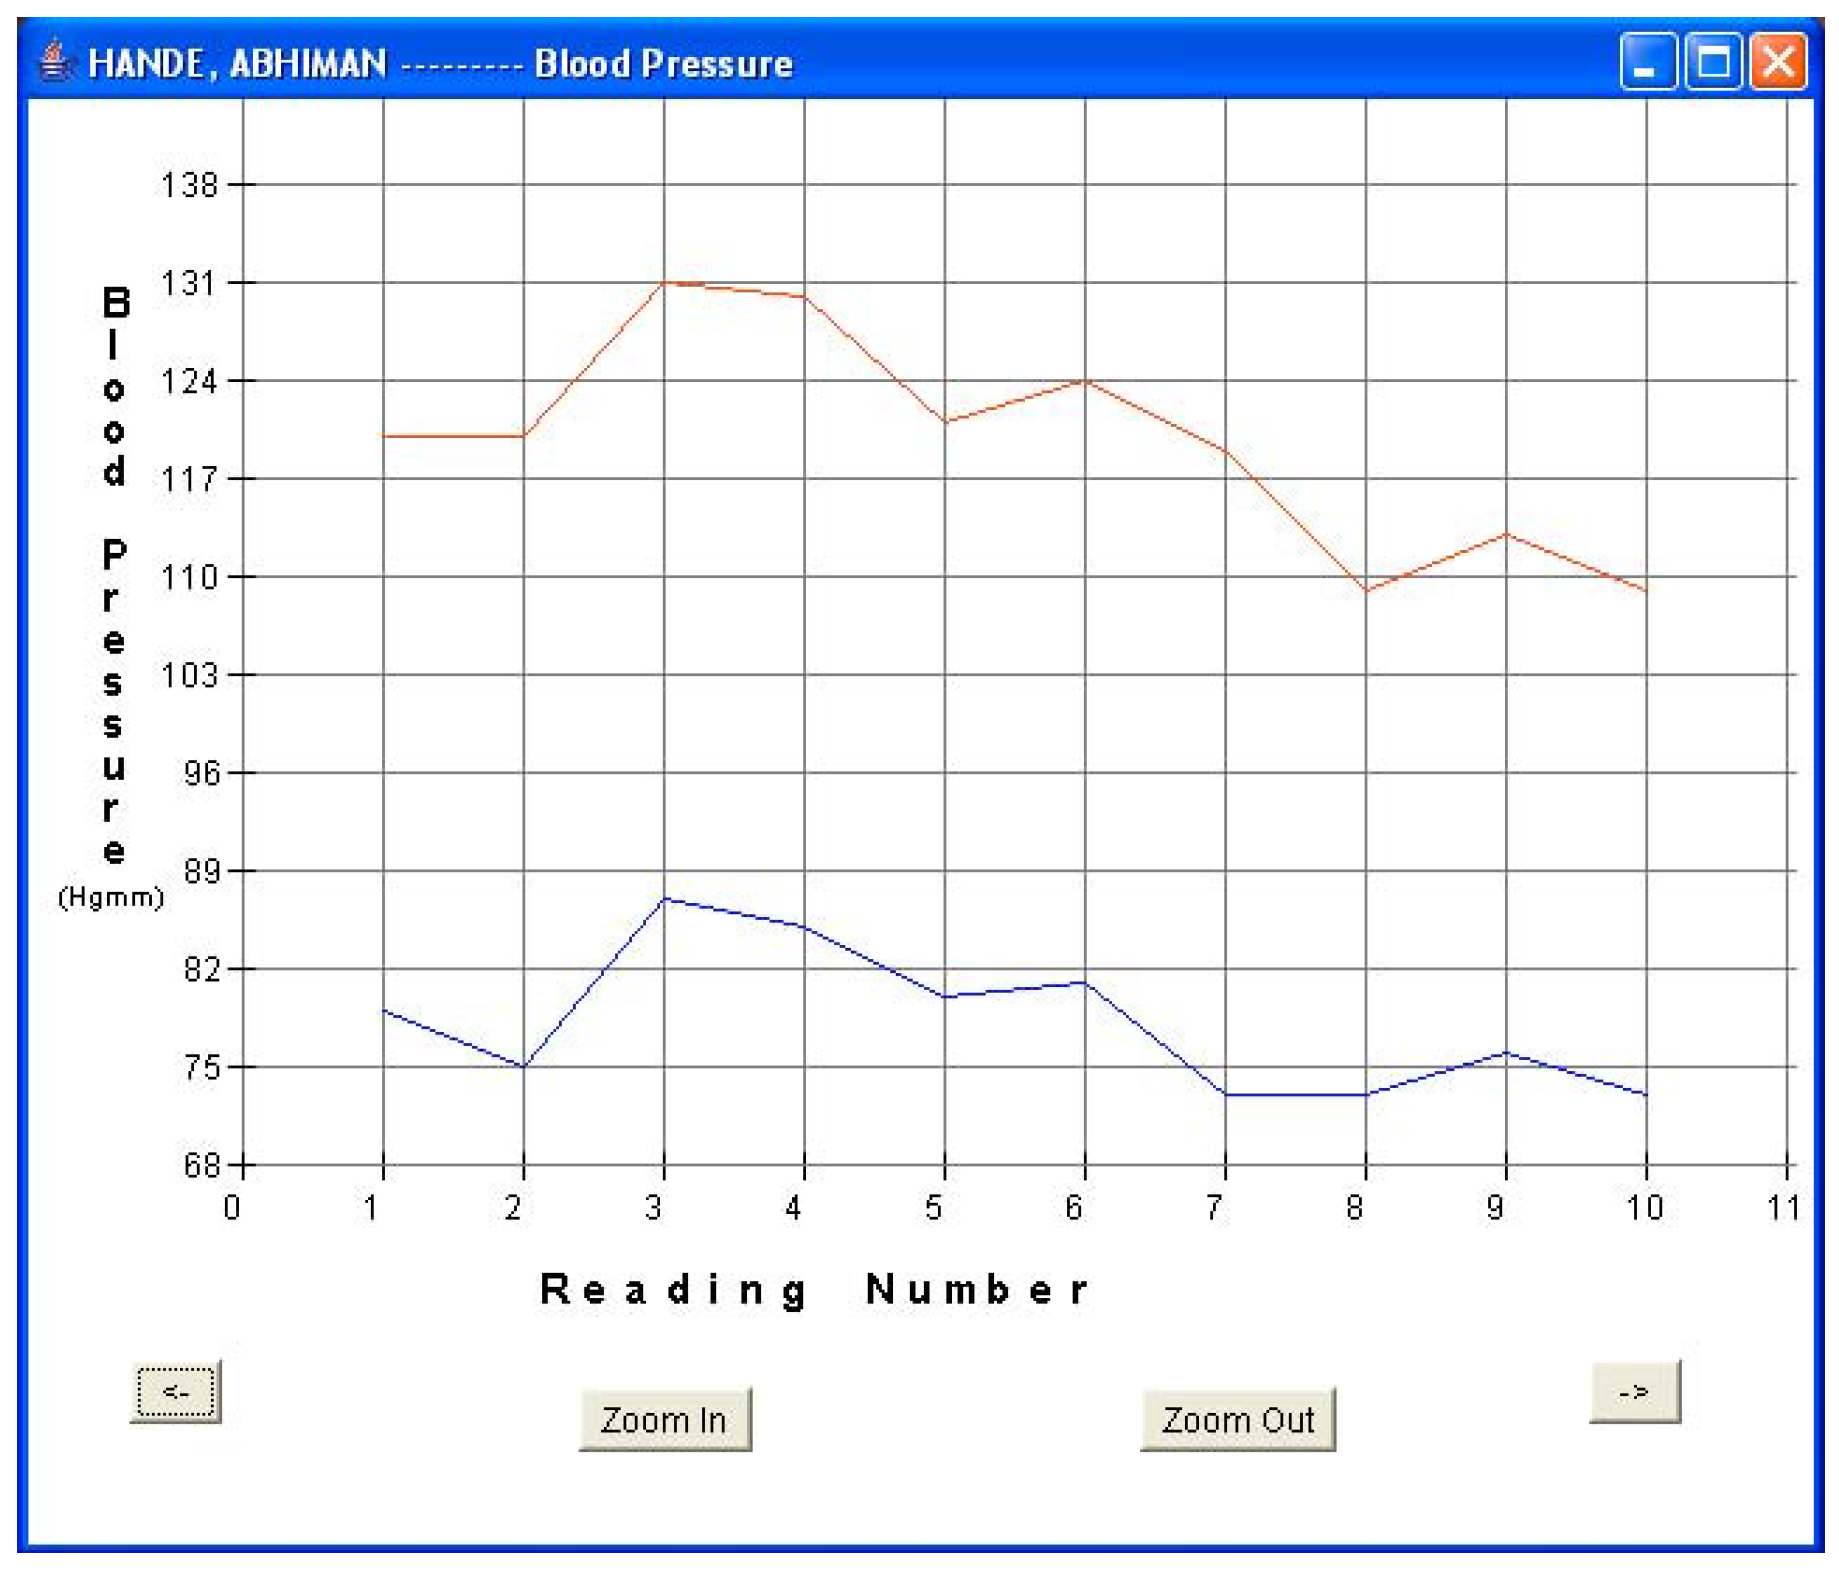
Every fifteen minutes, each patient turned on his sensor node to initiate a reading. The sensor node followed the algorithm described in Section 5.1 and forwarded the readings via a router pair to the base station PC for storage and display. The GUI was used to monitor the incoming patient data for real-time monitoring. Data was displayed in both text and graphical formats. Figure 8a and Figure 8b show the plots of blood pressure and pulse data for patient 1. Results indicated an average BP of 107/54 and average heart-rate of 61.6 for patient 1. The GUI was also used to display data in textual format. Figure 5b shows one such snap-shot for patient 1 that displays the last data set received at the base station. Similarly, Figure 9a and Figure 9b show the results for patient 3. Results indicated an average BP of 119.6/78.2 and average heart-rate of 72.1 for patient 3. No packet loss was observed during these experiments. During each measurement, the BPM LCD display value was also noted and compared with the routed values received at the base station. It was observed that every BPM LCD display reading was exactly equal to the values obtained at the base station GUI.
Figure 8a.
Patient 1 BP data.

Figure 8b.
Patient 1 pulse data.


7. Discussion
Although the proposed system is primarily focused towards in-hospital applications, it can be used to monitor a patient’s BP and heart-rate data from the patient’s household. Presently, in order to continuously track a patient’s BP and heart-rate over a period of time, physicians hand over specialized devices to patients as described in [23]. Most of these devices are cuff-based that are worn on the arm or wrist, and store patient data on their local memory over a period of time. The patient then takes the device back to his physician who downloads the data from the device to his PC for analysis. Such systems, although extremely useful and necessary, suffer from lack of real-time monitoring. While the sensor might detect an extremely high BP reading which can generate a local alarm at the patient vicinity, it is up to the discretion of the patient to inform his physician immediately rather than waiting for his next appointment. The proposed system can address such situations by routing data in real-time from a patient’s home to a website database where the data can be accessed by his physician without any time lag. In this case, any dangerous situation can be avoided because the technology will generate an alarm to alert the physician rather than requiring the patient to inform his physician of the situation. Such systems, however, will need an alternate means to power router nodes within the household since solar energy harvesting would not be a viable option. Energy scavenging through piezoelectric vibration generators might be a practical solution for powering router nodes in such applications and will be explored by the authors in the near future.
8. Conclusions
A prototype BP and heart-rate monitoring system using WSNs has been designed, developed and tested. The system allows health personnel to monitor a patient’s BP and heart-rate vital signs from a remote location without requiring the physician to be physically present to take the measurements. The system concept can be used for routing vital sign information to a central location within the hospital premises as well as in applications that require monitoring from within a patient’s home. The present design is modular in nature wherein every route point uses two router nodes that are self-powered drawing power from solar panels located close to overhead 34W fluorescent lights. Each node in a router pair operates at a 50% duty cycle which provides 100% availability at each route point. This is a critically important feature for any telemedicine application. The router nodes utilize an intelligent power management strategy that minimizes the solar panel requirement, and overall node cost and size.
Initial tests have shown that it is possible to route patient BP and heart-rate data to a central monitoring station within the hospital premises using practical WSNs. Specific technical requirements in terms of the kinds of vital sign sensors to be used, how often to sample data, data transfer rates, network layout, etc. are still being finalized. These requirements will be hospital specific based on our preliminary experiments and hospital requirements. Presently, we have started to look into the layout of one floor of the Erik Jonsson School of Engineering and Computer Science at the University of Texas at Dallas. Here, RPs will be placed every ten meters at strategic locations to facilitate multi-hop routing. Tests are under way to document the network capabilities and limitations such as what is maximum data traffic allowable, what router nodes handle maximum data traffic, and techniques to distribute the traffic accordingly. These tests, in turn, will help us document network limitations and calculate how often to sample vital sign data before routing it through the network. Later, tests will be conducted within a hospital setting to observe whether there is any packet loss. The present system uses a readily available commercial BPM monitor to acquire patient data. Future tasks involve integrating smaller OEM medical sensor boards [24] to Crossbow sensor nodes to miniaturize their size and make the system more practical and portable. Additional features such as incorporating an alarm generation capability to alert the care provider of a reading outside prescribed limits and patient data transfer from the hospital base station to a doctor’s handheld PDA will be explored. Also, the feasibility of designing a basic location algorithm, based on the fixed hospital router infrastructure to track patient movement will be investigated.
Acknowledgements
This research was conducted in the Embedded and Adaptive Computing Group (EACG) at the University of Texas at Dallas (UTD) and the work was carried out in the Wireless Sensor Development Group (WSDG) laboratory. The authors would like to acknowledge the support received from EACG, and the advice and assistance provided by Dr. Padmakar Kulkarni from University of Texas Southwestern Medical Center.
References
- Connor, W.; Krishnamurthy, L.; Want, R. Making Everyday Life Easier Using Dense Sensor Networks. In Proceedings of the ACM International Symposium on Ubiquitous Computing, Atlanta, Georgia, USA, 2001; pp. 49–55.
- Roark, J. Healthcare Information Technology: Are You Plugged In. Surgicenteronline. 2003. http://www.surgicenteronline.com/articles/341feat1.html.
- Lorincz, K; Malan, D. J.; Fulford-Jones, T. R. F.; Nawoj, A.; Clavel, A.; Shnayder, V.; Mainland, G.; Welsh, M.; Moulton, S. Sensor Networks for Emergency Response: Challenges and Opportunities. IEEE Pervasive Computing 2004, 3(4), 16–23. [Google Scholar]
- Lubrin, E.; Lawrence, E.; Navarro, K. F. Wireless Remote Healthcare Monitoring with Motes. In Proceedings of the IEEE International Conference on Mobile Business (ICMB’05), Sydney, Australia, 2005; pp. 235–241.
- Shnayder, V.; Chen, B.; Lorincz, K.; FulfordJones, T. R. F.; Welsh, M. Sensor Networks for Medical Care. Technical Report TR-08-05. 2005. http://www.eecs.harvard.edu/~mdw/papers/codeblue-techrept05.pdf.
- Dishman, E. Inventing Wellness Systems for Aging in Place. IEEE Computer 2004, 37(5), 34–41. [Google Scholar] [CrossRef]
- Jafari, R.; Encarnacao, A.; Zahoory, A.; Dabiri, F.; Noshadi, H.; Sarrafzadeh, M. Wireless Sensor Networks for Health Monitoring. In Proceedings of the Second Annual IEEE International Conference on Mobile and Ubiquitous Systems: Networking and Services (MobiQuitous’05), San Diego, California, USA, 2005; pp. 479–481.
- PBI Media. Strong Prognosis for Wireless in Healthcare. Communications Today. 2003. http://www.findarticles.com/cf_0/m0BMD/35_9/98013124/p1/article.jhtml.
- Laerhoven, K. V.; Lo, B. P.; Ng, J. W.; Thiemjarus, S.; King, R.; Kwan, S.; Gellersen, H. W.; Sloman, M.; Wells, O.; Needham, P.; Peters, N.; Darzi, A.; Toumazou, C.; Yang, G. Z. Medical Healthcare Monitoring with Wearable and Implantable Sensors. In Proceedings of the Sixth International Conference on Ubiquitous Computing, Tokyo, Japan, 2004.
- Card Guard Inc. Wireless Blood Pressure Monitors. 2005. http://www.cardguard.com/site/products-list.asp?id=20.
- Managing Diabetes with Wireless Insulin Pump. thewbalchannel.com. 2004. http://www.thewbalchannel.com/womansdoctor/2850769/detail.html.
- Konstantas, D.; Jones, V.; Bults, R.; Herzog, R. Mobihealth – Innovative 2.5/3g Mobile Services and Applications for Healthcare. In Proceedings of the Eleventh Information Society Technologies (IST) Mobile and Wireless Telecommunications Summit, Thessaloniki, Greece, 2002.
- Lim, L.; Yee, B. Coach's Companion - Athlete's Health Monitoring System. University of California Berkeley: Berkeley, 2005. http://pinnacon.com/limlloyd/ucb/FIRE/Paper/Information%20Dynamics%20Approach%20to%20System%20Development%20v1.0.pdf.
- GE Healthcare. Corometrics 340M – Telemetry Ambulatory Monitoring during Labor. 2005. http://www.gehealthcare.com/usen/perinatal/mat_fetal_mon/products/colo340M.html.
- Crossbow Technology Inc. MICAz ZigBee Series (MPR2400). 2005. http://www.xbow.com/Products/productsdetails.aspx?sid=101.
- HealthFrontier Inc. ecgAnywhere. 2005. http://www.healthfrontier.com.
- Smiths Medical PM, Inc. BCI Micro Power Oximeter Board. 2005. http://www.smiths-bci.com/html/Products/oem_products.htm.
- A & D Medical, Inc. UA-767BT Wireless Blood Pressure Monitor. 2005. http://www.lifesourceonline.com/products/telemonitoring.cfm.
- Hande, A.; Polk, T.; Walker, W.; Bhatia, D. Indoor Solar Energy Harvesting for Sensor Network Router Nodes. Journal of Microprocessors and Microsystems -Special Issue on Sensor Systems (accepted for publication) 2006. [Google Scholar] [CrossRef]
- A & D Medical, Inc. UA-767PC Wireless Blood Pressure Monitor. 2005. http://www.andmedical.com/and_med.nsf/html/UA-767PC.
- A & D Medical, Inc. UA-767PC RS-232 Command Sets and Data Format Specification v2.1. 2004. [Google Scholar]
- Walker, W.; Polk, T.; Hande, A.; Bhatia, D. Remote Blood Pressure Monitoring Using a Wireless Sensor Network. In Proceedings of the IEEE Sixth Annual Emerging Information Technology Conference, Dallas, Texas, 2006.
- Bodytronics.com. Blood Pressure Monitors. 2006. http://bodytronics.com/CTGY/Blood_Pressure.
- Medlab, Inc. OEM Modules for Patient Monitors. 2005. http://www.medlab-gmbh.de/english/modules/index.html.
© 2006 by MDPI, (http://www.mdpi.org). Reproduction is permitted for noncommercial purposes.
Share and Cite
MDPI and ACS Style
Hande, A.; Polk, T.; Walker, W.; Bhatia, D. Self-Powered Wireless Sensor Networks for Remote Patient Monitoring in Hospitals. Sensors 2006, 6, 1102-1117. https://doi.org/10.3390/s6091102
AMA Style
Hande A, Polk T, Walker W, Bhatia D. Self-Powered Wireless Sensor Networks for Remote Patient Monitoring in Hospitals. Sensors. 2006; 6(9):1102-1117. https://doi.org/10.3390/s6091102
Chicago/Turabian StyleHande, Abhiman, Todd Polk, William Walker, and Dinesh Bhatia. 2006. "Self-Powered Wireless Sensor Networks for Remote Patient Monitoring in Hospitals" Sensors 6, no. 9: 1102-1117. https://doi.org/10.3390/s6091102