1. Introduction
Potentiometric techniques are well-known, simple and versatile methods in analytical chemistry and several examples of electronic tongues based on potentiometric measurements have been reported [
1] most of them having in common the use of membrane potentiometric electrodes [
2]. These membranes can be of different materials and usually display certain selectivity toward particular chemical species. Sometimes these membrane-based sensors show large cross-sensitivities and their response, in combination with pattern-recognition algorithms, has been used for discriminating aqueous solutions such as different types of waters and foodstuffs. As an alternative approach to the use of membrane-based electrodes we have developed recently an electronic tongue that used simple non-coated surfaces (i.e. metal electrodes) as unspecific sensors [
3,
4,
5] for the differentiation of somewhat similar water samples using potentiometric measurements combined with PCA algorithms and a fuzzy ARTMAP neural network. The underlying idea in the use of plain metal electrodes is that these surfaces might be polarized due to either physisorption or/and chemisorption processes in aqueous environments. In fact, for long time, the metallic electrodes have been utilized in several applications. Thus for instance, gold or platinum electrodes are used for the determination of the redox potential [
6,
7]. This process however is very unspecific and gives poor information about the nature and concentrations of the ionic species in the solution. Others types of metal-based electrodes are metal/metal-oxide electrodes (M/MO/OH
-) and metal/metal insoluble salt electrodes (M/MX/X) (where M is a metal, X represents an anion and MX are barely insoluble salts of the respective anions and cations). The former have been used as pH sensors [
8,
9,
10,
11] whereas the latter have been used for the determination of anions and as reference electrodes [
12,
13]. However in many cases M/MO and M/MX electrodes have been reported to be affected by pH and unspecifically by whatever anion capable of forming a scarcely soluble salt with the corresponding metal cation of the electrode [
14]. Moreover, that unspecific response in complex realistic media of M, M/MO/OH
- and M/MX/X electrodes can be of interest for the development of electronic tongues. We believe that the use of these systems might be a promising sensing approach due to the large number of available possibilities to tune the composition of the final sensor array that might result in controlling the response to different complex liquid mixtures. As it has been reported, in the electronic tongue approach, the strategy is not to measure single chemical components but to get images of more complex attributes (i.e. waters differentiation) via the use of a set of rather unspecific sensors.
We report here a rational study of the response of a set of noble metal and not-noble metal based electrodes towards different aqueous solutions containing known concentrations of anions and cations. Differentiation of very similar solutions can be achieved by using these simple potentiometric measurements combined with pattern recognition algorithms such as principal component analysis and neural networks. Interestingly, the set of electrodes respond differentially to the ion content in the solutions.
2. Experimental
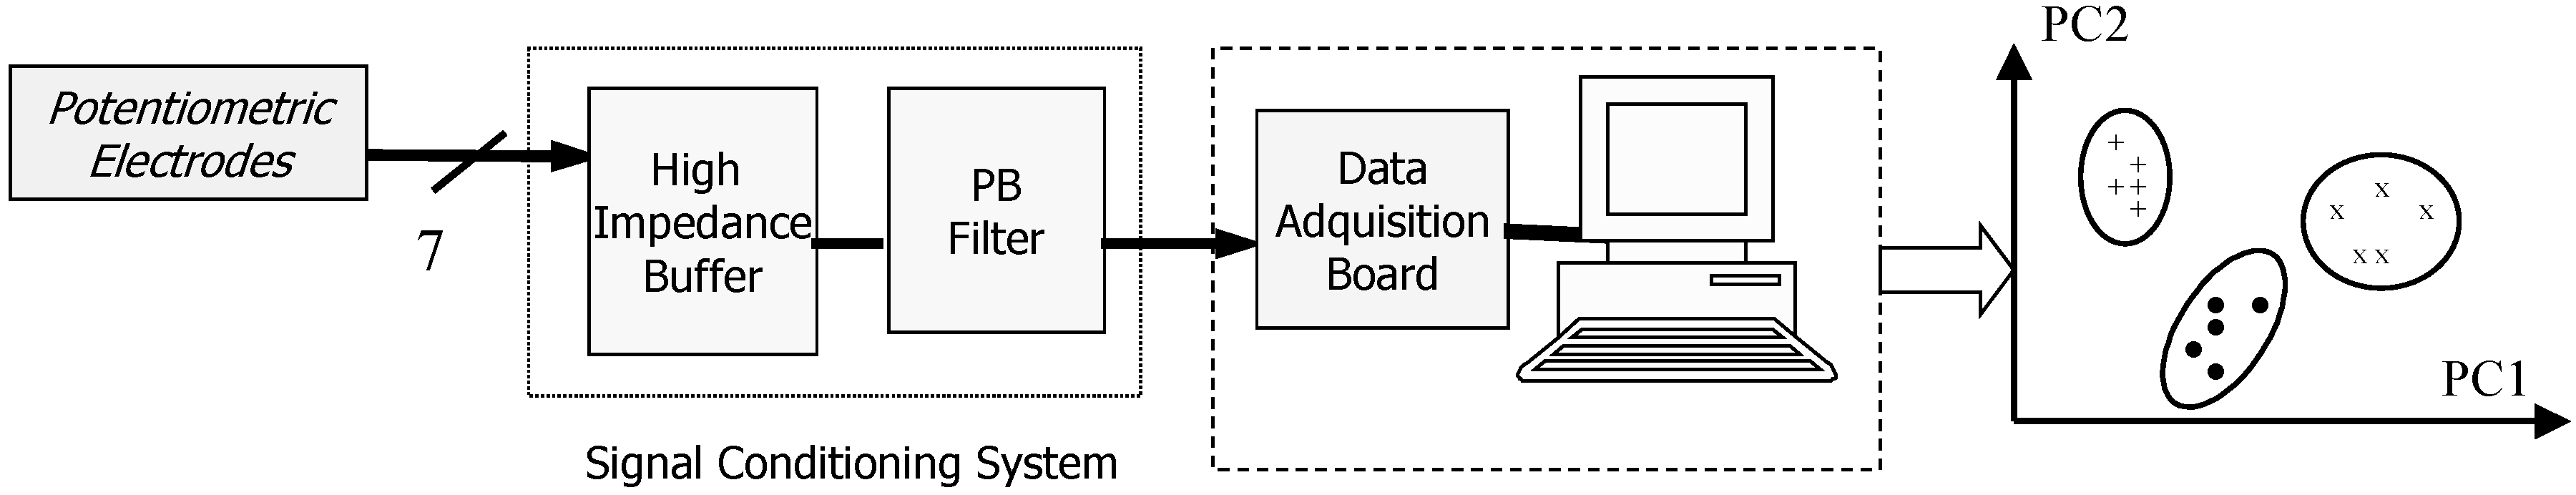
The measurement system consists of an array of potentiometric electrodes and a conductimeter. The data are collected by a PC through a signal conditioning system, and multivariate analysis is employed to discriminate the samples. A scheme of the system is shown in
Figure 1.
Figure 1.
Block diagram of the electronic tongue.
Figure 1.
Block diagram of the electronic tongue.
The samples have been studied by using an array of potentiometric electrodes in thick-film technology; the printed electrodes consisted in the following components: RuO
2, Ag, and Cu. We also used as electrodes small sticks of elements such as Au, Pb, Zn and Ni. This gave a set of seven electrodes, which were used as active system for potentiometric measurements. The electrodes in thick-film technology were printed onto an alumina substrate (RUBALIT 708 supplied by Ceramic Tec.) with an area of 50.8mm x 25.4mm and thickness of 0.635mm. In order to prepare the above mentioned set of electrodes, three screens were made, corresponding to three layers, the conductive layer working as a conductor of the signal, the active layer and the upper protection layer [
5]. The conductive paste used was Ag/Pd/Pt (supplied by HERAEUS model C4081T) and the active pastes are RuO
2 with a resistivity of 10Ω/sq (supplied by HERAEUS model R8921), Cu (supplied by HERAEUS model C7257), Ag (supplied by HERAEUS model C1075S).
Thick-film electrodes were made using serigraphic methods, using polyester screens with a density of 230 mesh (Saatilane Hitech 90/48 supplied by Saatline) and films of 50 μm thickness (Ulano CDF5 supplied by Ulano). The pastes were placed by a semiautomatic serigraphic machine (AUREL model C1010). A final thickness of 30 μm after firing was achieved. The firing process of the conductive paste was carried out at 850ºC in a cycle of 60 minutes with a peak of 10 minutes. The same cycle was used for RuO2. A similar cycle but heating at 900ºC under inert atmosphere was used to prepare the electrodes of Cu. The burning process for the protective paste was carried out at a temperature of 600ºC in a cycle of 30 minutes with a peak of 5 minutes.
To perform the measurements, an Ag/AgCl reference electrode was used. The set of electrodes were submerged into a 50 mL vessel containing the aqueous solutions samples. The vessel was thermostated at 25ºC and, for measurements not to be affected by oxygen; experiments were conducted under argon atmosphere, introducing Ar gas by a tube on the upper side of the vessel. The potential of the electrodes was measured when they were in contact with the solution to analyze until they reached the steady state. It is considered that steady state is reached when the variation of electrode potential in the last 5 samples of the response signal is smaller than 1 mV. The time necessary to obtain this stability was of approximately 10 minutes. After each measurement, the electrodes were cleaned with distilled water.
This signal was acquired and processed by a PCI-9112 Adlink acquisition board, included in a PC. To achieve a suitable signal, the measurements were carried out using a high impedance input buffer with LMC6001 electrometric amplification circuits, input impedance larger than 1 TΩ and a very low bias current (25 fA). Although the output impedance of metallic electrodes is quite small, it is necessary to perform measurements with a very high input impedance, since to meet the conditions of potentiometric measurement, a near to zero input current is needed. In a second step a Butterworth second order filter with a cutoff frequency of 1.2 Hz was used in order to remove the electric noise signals coming essentially from the electrical network (50 Hz). The software for visualization and data storage was developed using HP-VEE Pro®. Data processing and analysis was performed using principal component analysis (PCA), fuzzy ARTMAP and partial least squares (PLS). The software MATLABTM and its PLS_Toolbox were used.
3. Results and discussion
As stated above, the most common approach in the development of potentiometric electronic tongues has been the use of membrane potentiometric sensors. As an alternative, we have used a set of simple metal-based electrodes to build up an electronic tongue for the discrimination of waters. The following electrodes were used: RuO
2, Ag, and Cu in thick-film technology and Au, Pb, Zn and Ni as small bars of the corresponding metal. Noble metal electrodes, such as Au and Ag (M type electrode) are expected to be sensitive to the redox potential (and therefore to the pH) and un-specifically to the concentration of ions in the solution. Additionally non-noble metal electrodes such as Cu, Pb, Zn and Ni are expected to be partially oxidized and therefore to behave as M/MO/OH
- electrodes. These typically respond to pH because proton concentration might affect the oxide surface on the electrode and, therefore, to the potential of the M/MO couple. The RuO
2 electrode also is known to respond to pH [
3]. Additionally, in the presence of certain anions the non-noble metal electrodes Ag, Cu, Pb, Zn and Ni can partially behave as M/MX/X electrodes and are expected to respond to anions (M is a metal, X represents anion and MX are barely insoluble salts). This behavior is quite un-specific because the metals such as Ag, Cu, Pb, Zn and Ni form several insoluble salts with a number of anionic species.
The possibility of using simple metal electrodes to differentiate water samples containing different ions is a subject of interest. To test this possibility the response of the designed “electronic tongue” was studied on a family of 10 different aqueous solutions, each one containing the corresponding pure salt. Namely KNO3, NaNO3, K2SO4, Na2SO4, KCl, NaCl, KHCO3, NaHCO3, KH2PO4 and NaH2PO4, all of them with a concentration of 0.05 M, which matches the concentration of salts in most natural waters. We have also measured the conductivity of the different solutions, which gives also unspecific information about the total quantity of ions present, including inactive anions to metallic electrodes like, for example, nitrates.
Three different measurements for each type of dissolution (there were 10 different dissolutions, which corresponded to the different salts analyzed) were performed in a disordered way. This gave a total of 30 measurements within the pure salt database. In order to analyze the possible existence of patterns in emf variation, PCA algorithms were used. In a preliminary analysis of data, it was observed that the Cu electrode gave very low signals, near to zero and with very small variance among the different solutions measured. This circumstance does make inadvisable to include this electrode in a PCA analysis because its contribution is either negligible (its loadings are near to 0 when a mean centering is used as preprocessing) or can be seriously affected by noise (in case an autoscaling is used as preprocessing). For this reason, the data from the Cu electrode were ignored in subsequent analyses.
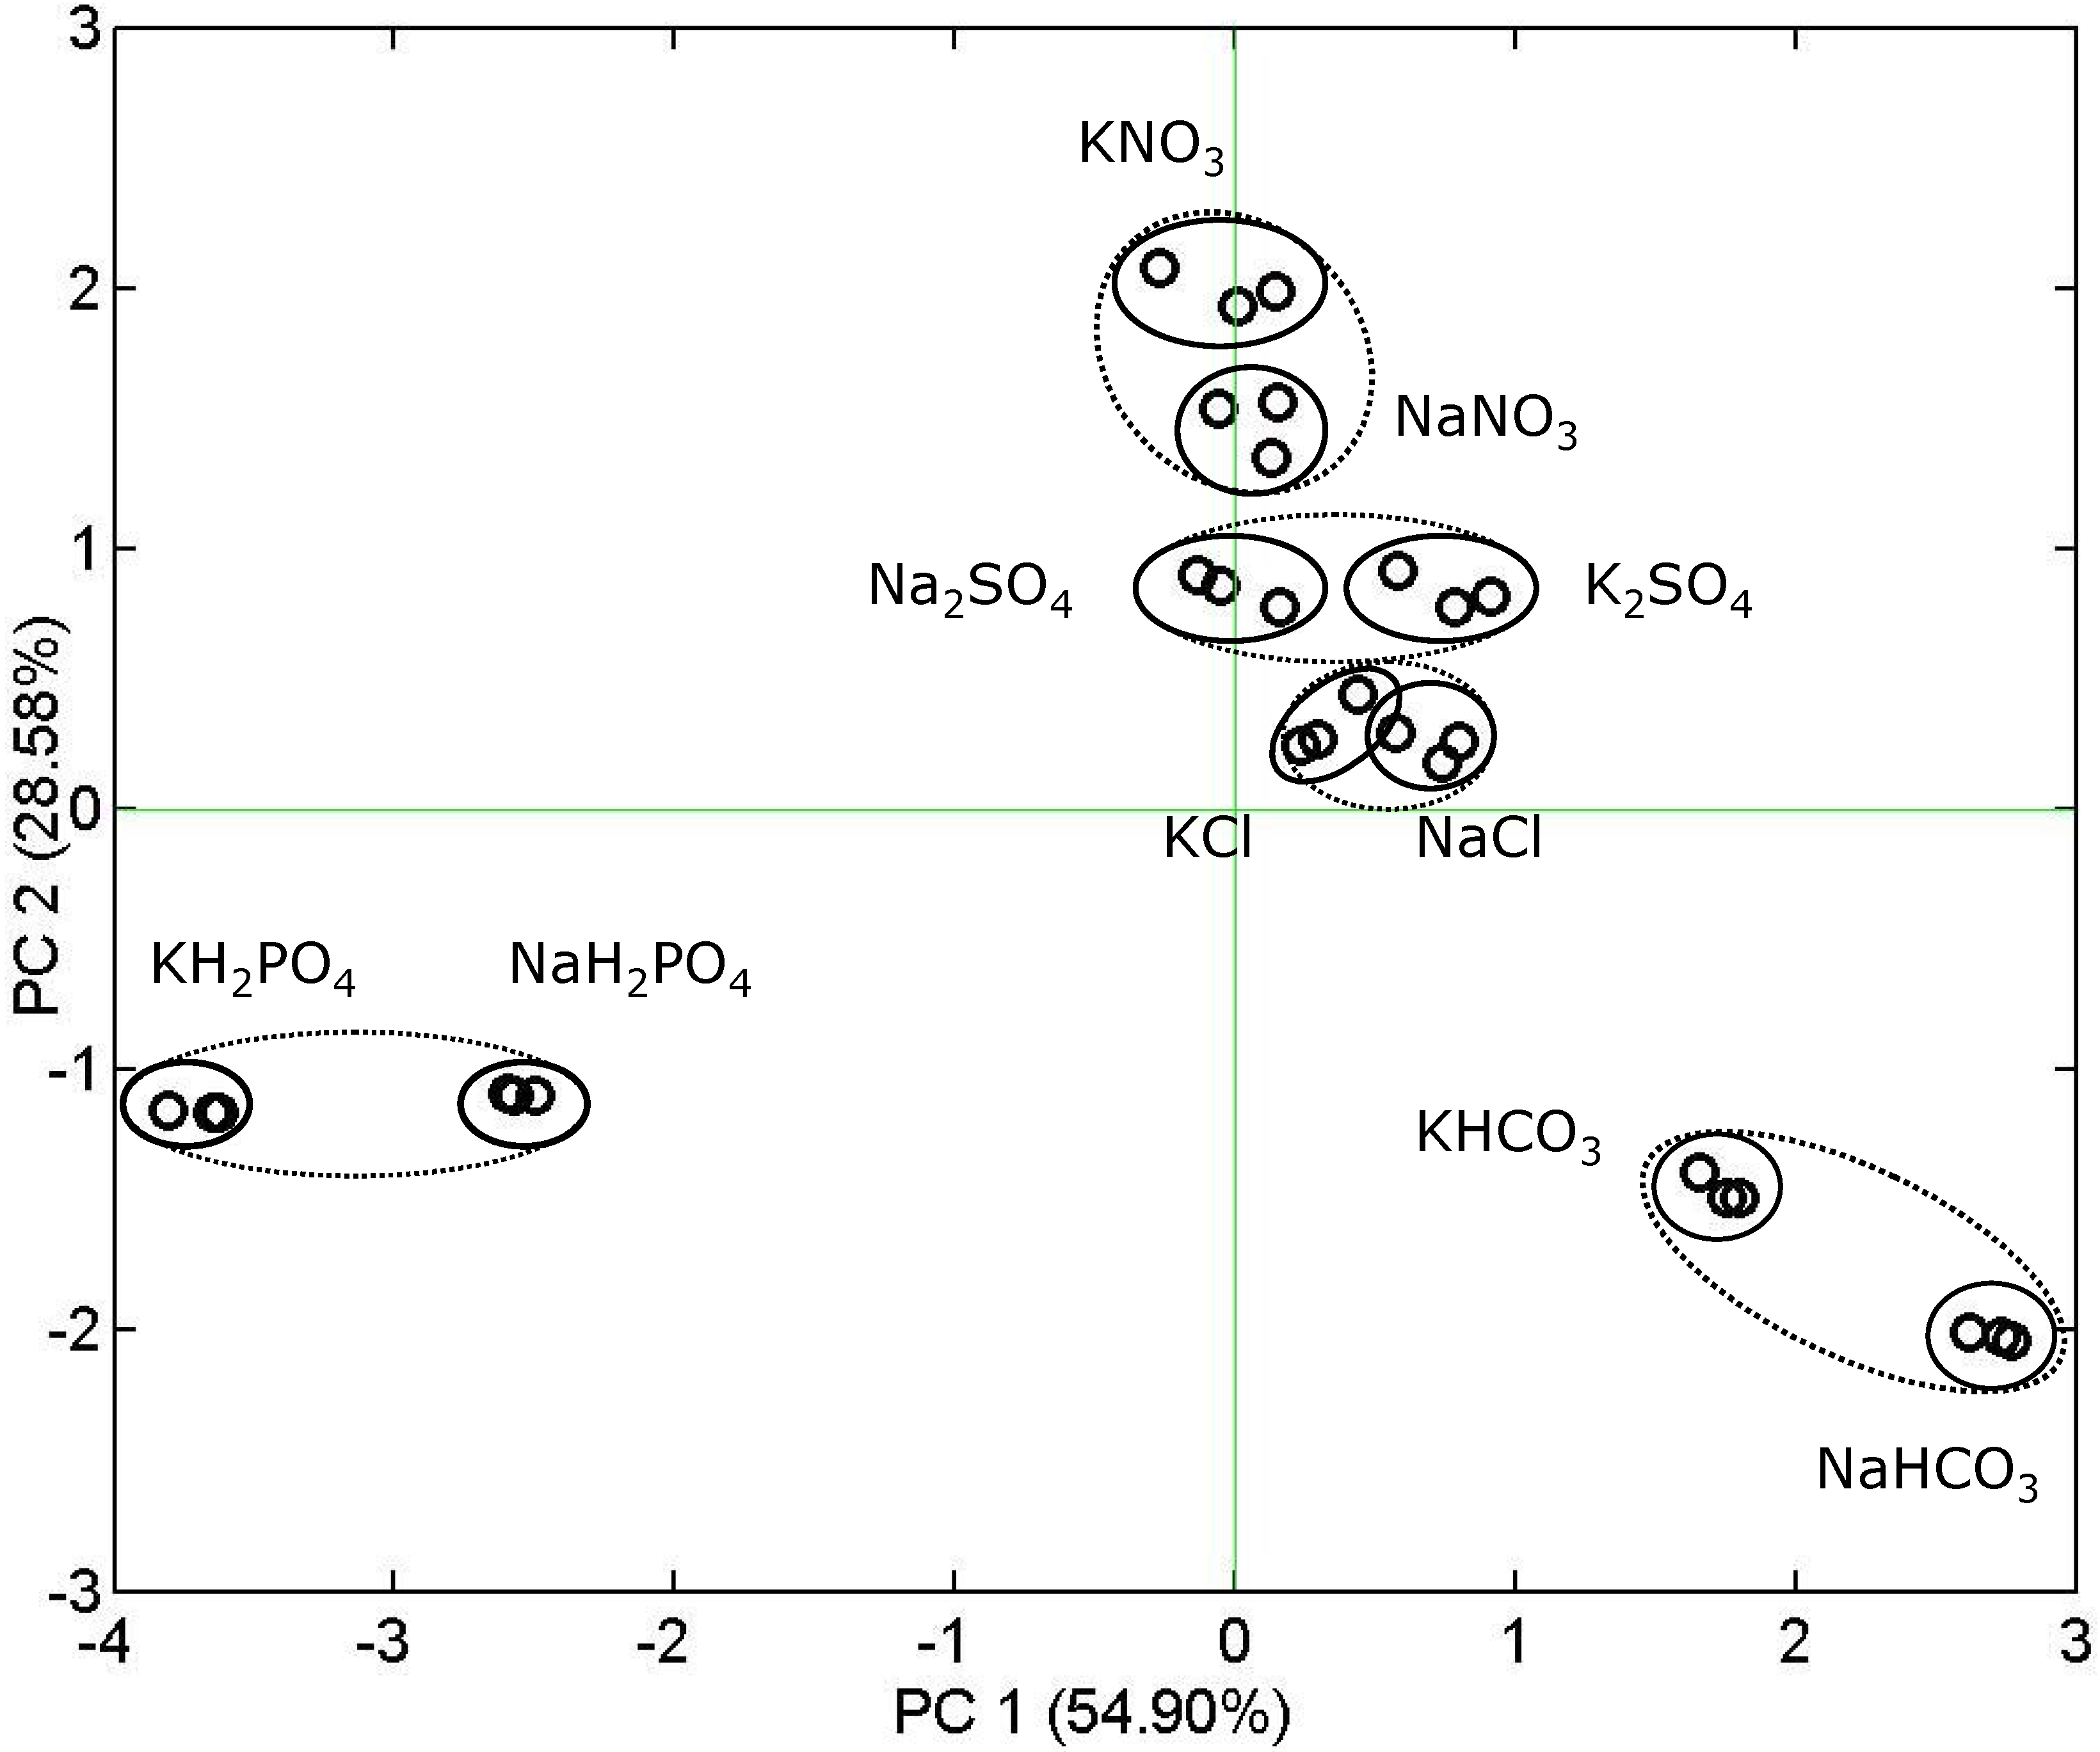
The score plot of the PCA is shown in figure 2. Given the similar nature of the sensors within the electronic tongue, the preprocessing technique implemented was mean centering. The first two principal components accounted for 83.48% of data variance. PCA shows a very effective discrimination between phosphate, carbonate and anions, and, less effective but also clear, between chlorides, nitrates and sulfates. Additionally, “anionic” groups are divided in two subgroups, corresponding to the two cations Na+ and K+. There is a predominant and remarkable anion differentiation.
Figure 2.
Principal component analysis (PCA) score plot for different aqueoussolutions containing pure salts measured with a 6-electrode array.
Figure 2.
Principal component analysis (PCA) score plot for different aqueoussolutions containing pure salts measured with a 6-electrode array.
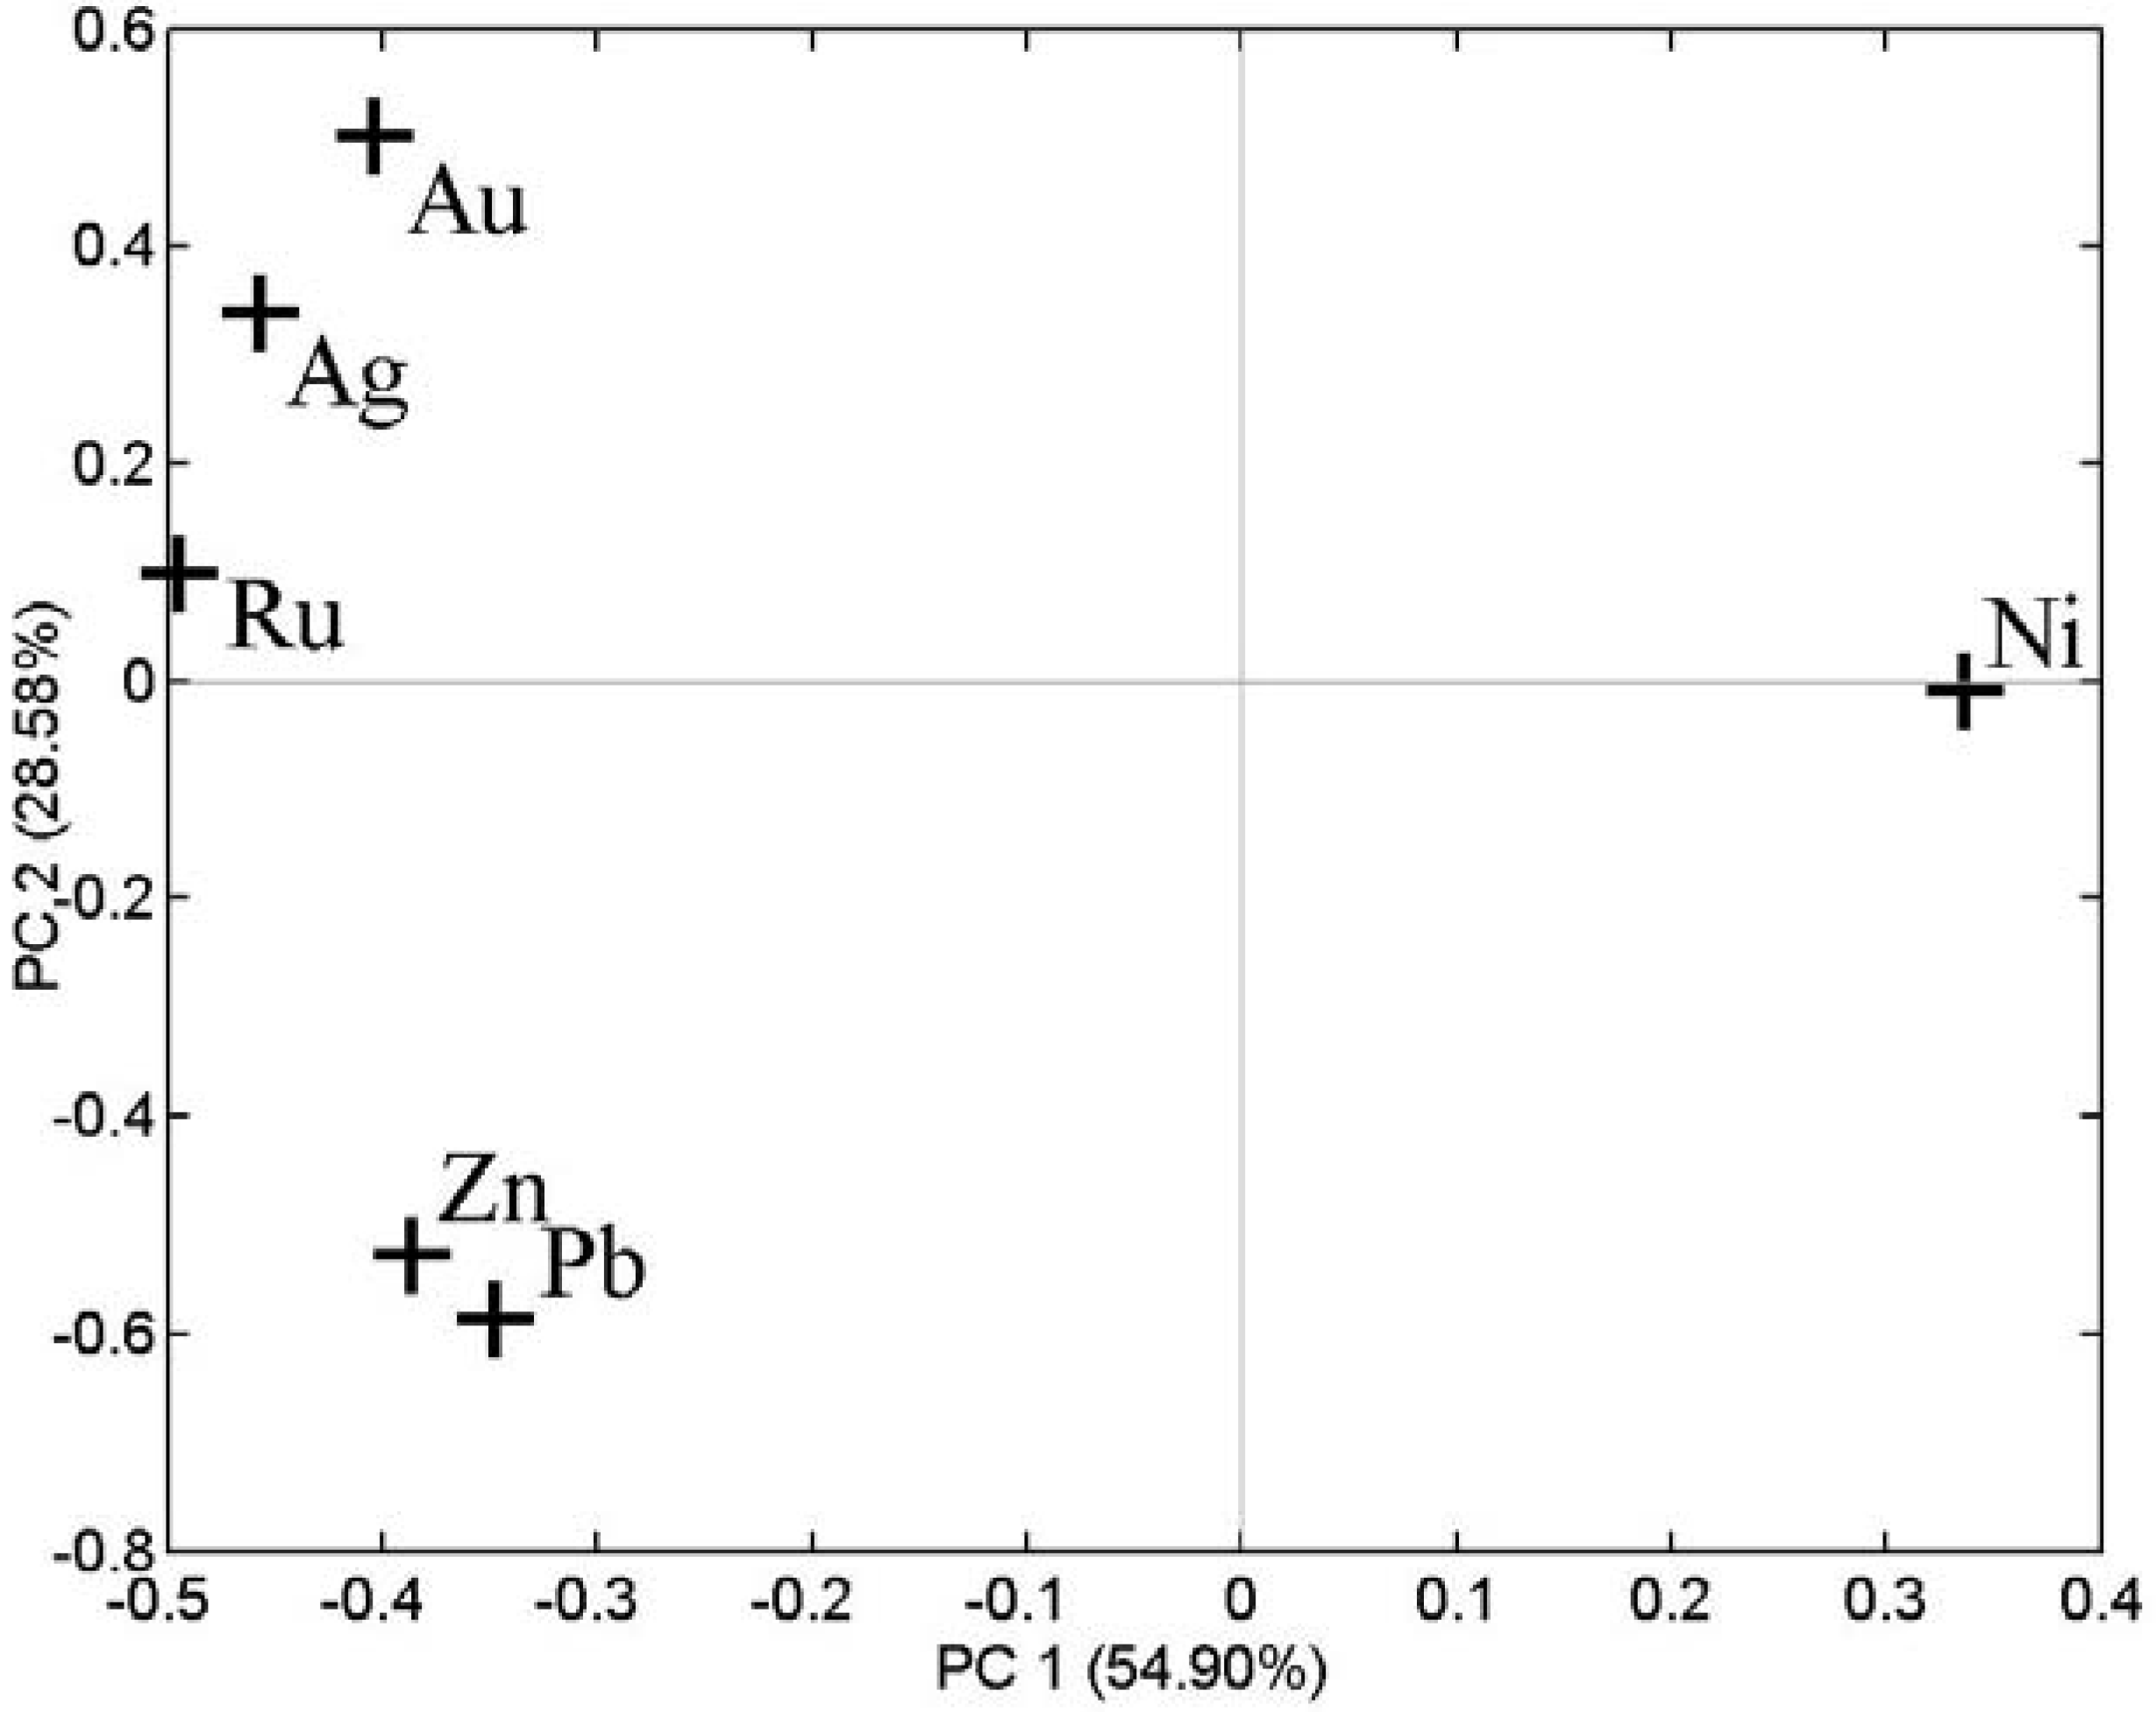
In order to elucidate the relation between the different electrodes used, the loading plot of the principal component analysis was studied (see
Figure 3).
Figure 3 shows that three groups of electrodes exist, the first group being formed by Au, Ag and Ru electrodes, the second by Zn and Pb electrodes and finally the Ni electrode. While the first two groups of electrodes show similar loadings on the first PC, their loading values on the second PC differ substantially. Finally, the Ni electrode shows a negative correlation with the other electrodes on the first PC but interestingly, does not contribute to the second PC.
Figure 3.
Loading plot of the PCA analysis performed on the responses of the6-electrode array to different aqueous solutions.
Figure 3.
Loading plot of the PCA analysis performed on the responses of the6-electrode array to different aqueous solutions.
An interesting analysis is the relation between PCA results and sample conductivity. A conductimeter model CRISON GLP32 was employed to measure the conductivity of the samples analyzed.
Table 1 shows the conductivity obtained for each one of the aqueous solutions.
Table 1.
Conductivity (μS) of the different solutions studied.
Table 1.
Conductivity (μS) of the different solutions studied.
| NaCl | KCl | NaH2PO4 | KH2PO4 | NaNO3 | KNO3 | NaHCO3 | KHCO3 | Na2SO4 | K2SO4 |
| 596 | 707 | 376 | 490 | 611 | 647 | 449 | 532 | 1081 | 1254 |
An idea about the amount of ions present in each solution is obtained via conductivity measurements. If conductivity values are compared with the score plot of the PCA, it can be derived that these two analyses are not related. For example, aqueous solutions with sulfates show the highest conductivity but they appear in a central position in the score plot close to samples containing nitrates and of chlorides, which have lower conductivity. Additionally, solutions containing phosphates and carbonates have got a similar conductivity and, however, appear far apart in the score plot. According to these results, it can be stated that the discrimination among the different aqueous solutions reached with the 6-electrode electronic tongue is not based on the amount of ions present in the solutions (i.e., in their conductivity). To better assess the discriminating power of the 6-element electronic tongue, a neural network approach was used. The goal was to classify each sample according to the type of anions (5 different possibilities) and cations (2 possibilities) present. A fuzzy ARTMAP neural network was implemented because these networks are trained fast and efficiently, even when there is an uneven number of training samples within each category [
15]. The network had 6 inputs, since the response of each electrode within the array was employed and 7 outputs, since the presence/ absence of 7 different ions had to be predicted by the network. The first 5 output neurons codified anions and the last 2 output neurons codified cations. A one-of-five and one-of-two codes were used to code anions and cations, respectively. For example, the occurrence of a 1;0;0;0;0;1;0 code in the output corresponded to a sample being identified as containing the anion Cl
- and the cation Na
+. To estimate the success rate in sample identification using a fuzzy ARTMAP classifier a leave one out cross-validation was implemented. Given the 30 measurements available, a fuzzy ARTMAP was trained 30 times using 29 training samples and validated using the validation sample that had been left out. In this re-sampling approach all measurements available act as validation sample once. A 100% success rate in classification was obtained using this approach. These results are in good agreement with the PCA analysis, where a good separation among the aqueous solutions analyzed was obtained in the score plot when the first two principal components were employed. This confirms that the 6-element electronic tongue is able to discriminate the different aqueous solutions according to the presence of different anions and cations.
The results of the electronic tongue with simple aqueous solutions are promising but it would be desirable to check its behavior in the analysis of more complex solutions. To test this possibility we have created in the laboratory different “artificial waters” by mixing mother solutions of different salts in different concentrations. Five solutions named A, B, C, D and E were prepared using the following procedure. Mother solutions consisted of salt solutions (0.05 M) in distilled water were prepared. By mixing different volumes of these mother solutions, five “artificial waters”, labeled A, B, C, D and E were obtained.
Table 2 specifies the volume of each mother solution that was used to synthesize these ‘artificial waters’. As this table shows, both sodium and potassium salts were used.
Table 2.
The five artificial waters studied (labeled A to E) resultfrom mixing different volumes (in mL) of 0.05 M salt solutions.
Table 2.
The five artificial waters studied (labeled A to E) resultfrom mixing different volumes (in mL) of 0.05 M salt solutions.
| | K2SO4 | NaCl | NaPO4H2 | KCO3H | NaNO3 |
| A | 5 | 10 | 15 | 20 | 30 |
| B | 30 | 5 | 10 | 15 | 20 |
| C | 20 | 30 | 5 | 10 | 15 |
| D | 15 | 20 | 30 | 5 | 10 |
| E | 10 | 15 | 20 | 30 | 5 |
Table 3 shows the ions present in solutions A to E and their concentration. Each solution contains a mixture of anions and cations, whose concentrations range between 3.12 × 10
-4 and 4.69 × 10
-3.
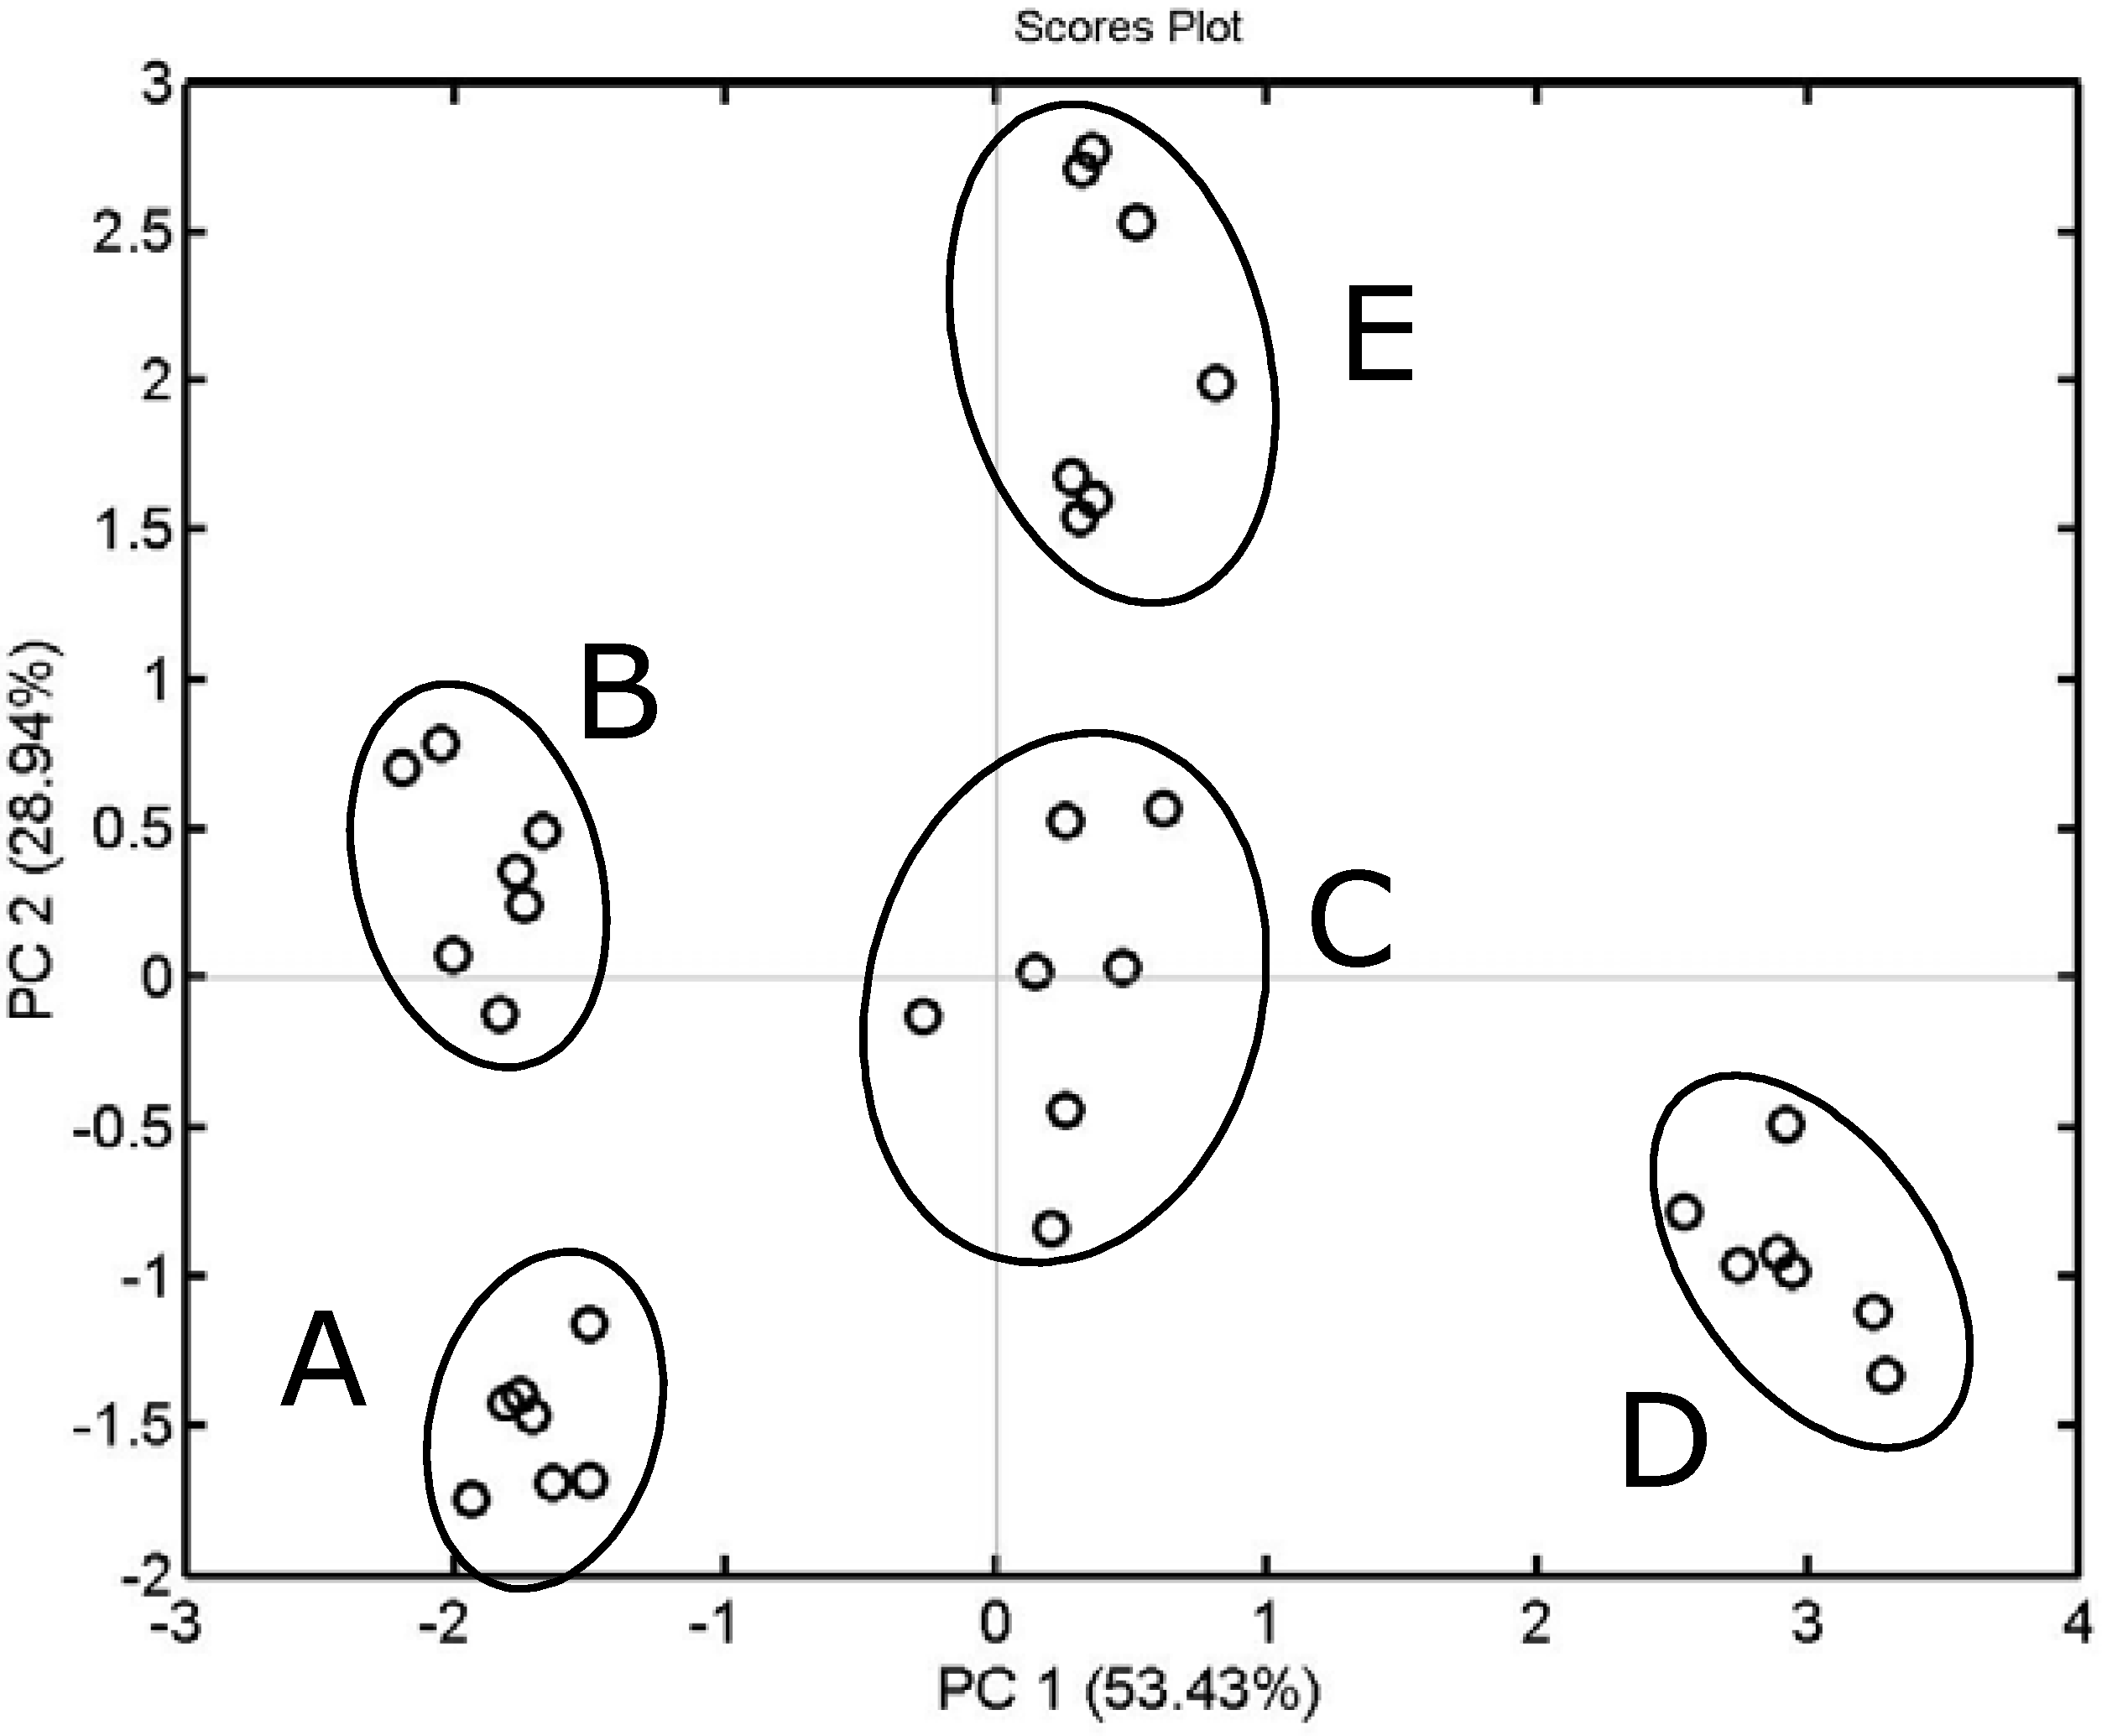
The different water samples were measured using the 6-electrode electronic tongue. Each water sample was measured 7 times and measurements were performed in a disordered way. This resulted in 35 measurements belonging to this database. In order to analyze the possible existence of patterns in the e.m.f. variation, once again PCA algorithms were used, which yielded the results shown in
Figure 4. This figure shows a two dimensional score plot for the first two principal components, which accounted for 82.4% of data variance (data were mean centered prior to perform the PCA). As can be deduced from the figure, samples belonging to the same type of ‘artificial water’ tend to cluster together and the clusters do not overlap. As the difference between water samples A to E is not the presence or absence of a given ion but the different concentration of ions, it is clear from
Figure 4 that the set of electrodes are mostly capable of discriminating the anionic content in the samples analyzed. This could be anticipated from a theoretical point of view based on the use of M, M/MO/OH
- and M/MX/X systems. The loading plot corresponding to the PCA analysis is very similar to the one shown in
Figure 3 and, therefore, is not shown.
Table 3.
Anion and cation concentrations (in mol/L) forthe five (labeled A to –E) aqueous mixtures.
Table 3.
Anion and cation concentrations (in mol/L) forthe five (labeled A to –E) aqueous mixtures.
| | SO4= | Cl- | Phosphate | Carbonate | NO3- | Na+ | K+ |
| A | 3.125×10⁻⁴ | 6.25×10⁻⁴ | 9.375×10⁻⁴ | 1.25×10⁻³ | 1.875×10⁻³ | 3.4375×10⁻³ | 1.8750×10⁻³ |
| B | 1.875×10⁻³ | 3.125×10⁻⁴ | 6.25×10⁻⁴ | 9.375×10⁻⁴ | 1.25×10⁻³ | 1.0625×10⁻³ | 4.6875×10⁻³ |
| C | 1.25×10⁻³ | 1.875×10⁻³ | 3.125×10⁻⁴ | 6.25×10⁻⁴ | 9.375×10⁻⁴ | 3.0250×10⁻³ | 3.1250×10⁻³ |
| D | 9.375×10⁻⁴ | 1.25×10⁻³ | 1.875×10⁻³ | 3.125×10⁻⁴ | 6.25×10⁻⁴ | 3.7500×10⁻³ | 2.1875×10⁻³ |
| E | 6.25×10⁻⁴ | 9.375×10⁻⁴ | 1.25×10⁻³ | 1.875×10⁻³ | 3.125×10⁻⁴ | 2.5000×10⁻³ | 3.1250×10⁻³ |
Figure 4.
Principal component analysis (PCA) score plot for differentartificial waters measured with a 6-electrode array.
Figure 4.
Principal component analysis (PCA) score plot for differentartificial waters measured with a 6-electrode array.
In order to better analyze the basis for the discrimination power shown by the electronic tongue, a quantitative analysis was envisaged. The objective was to build calibration models to see whether it was possible to correctly estimate the concentration ions (SO
42-, Cl
-, Phosphate, Carbonate, NO
3-, Na
+ and K
+) present in the different dissolutions studied. The calibration models built were based on partial least squares (PLS). A specific PLS model was built for each ion analyzed. The data input to the models were the mean-centered responses of the 6-element sensor array. A 7-fold training/ validation approach was used. Since there were 7 measurements available per ‘artificial water’, 7 different training and validation sets were defined as follows. One measurement per water type integrated a validation set and the six remaining measurements of each water type integrated its corresponding training set. By selecting a different measurement each time, 7 different training and validation sets could be defined. Each training set comprised 30 measurements and each validation set comprised 5 measurements. Initially, each model was fully cross-validated to determine the number of factors (latent variables) to be used. In other words, the prediction error sum of squares (PRESS), estimated by a leave-one out cross-validation was plotted against the number of latent variables (i.e. from 1 up to 6). This was done using the measurements in the 7 training sets. The criterion employed consisted of choosing the minimum number of latent variables that produced a sharp decrease in PRESS and selecting the same number of latent variables for the 7 training sets available. Once the number of latent variables to be used had been decided, PLS models were built using the training sets and their performance estimated using the measurements in the corresponding validation sets. More specifically, accuracy was estimated using three parameters: the correlation coefficient between predicted and actual ion concentration values, the slope and intercept of the linear fit between predicted and actual values. The closer to 1 are slopes and correlation coefficients and the closer to 0 are intercepts, the better (more accurate) are the calibration models. The results of this analysis are summarized in
Table 4. This table shows that a good estimation of the concentration of nitrates and sodium is possible and that a fair estimation of the concentrations of carbonates, potassium, chlorides and phosphates is possible too. Finally, the performance in the estimation of sulfate ion concentration is rather poor. However, the overall performance of the electronic tongue in the quantitative analysis of ions present in the different waters studied is good enough for water discrimination.
Table 4.
Cross-validation results of the calibration models built to predict theconcentration of ions within the dissolutions studied (intercept is in mmol/L).
Table 4.
Cross-validation results of the calibration models built to predict theconcentration of ions within the dissolutions studied (intercept is in mmol/L).
| Ion | # latent var. | Corr. coeff. | Slope | Intercept |
| SO4= | 5 | 0.757 | 0.566 | 0.434 |
| Cl- | 3 | 0.843 | 0.702 | 0.302 |
| Phosphate | 5 | 0.807 | 0.649 | 0.350 |
| Carbonate | 5 | 0.888 | 0.738 | 0.265 |
| NO3- | 2 | 0.979 | 0.935 | 0.062 |
| Na+ | 5 | 0.941 | 0.887 | 0.249 |
| K+ | 5 | 0.869 | 0.748 | 0.760 |


