A Urea Biosensor from Stacked Sol-Gel Films with Immobilized Nile Blue Chromoionophore and Urease Enzyme

School of Chemical Sciences and Food Technology, Faculty of Science and Technology, Universiti Kebangsaan Malaysia, 43600 Bangi, Selangor, Malaysia
*
Author to whom correspondence should be addressed.
Sensors 2007, 7(10), 2251-2262; https://doi.org/10.3390/s7102251
Submission received: 3 August 2007
/
Accepted: 13 September 2007
/
Published: 11 October 2007
(This article belongs to the Special Issue Optical Biosensors)
Abstract
:An optical urea biosensor was fabricated by stacking several layers of sol-gel films. The stacking of the sol-gel films allowed the immobilization of a Nile Blue chromoionophore (ETH 5294) and urease enzyme separately without the need of any chemical attachment procedure. The absorbance response of the biosensor was monitored at 550 nm, i.e. the deprotonation of the chromoionophore. This multi-layer sol-gel film format enabled higher enzyme loading in the biosensor to be achieved. The urea optical biosensor constructed from three layers of sol-gel films that contained urease demonstrated a much wider linear response range of up to 100 mM urea when compared with biosensors that constructed from 1-2 layers of films. Analysis of urea in urine samples with this optical urea biosensor yielded results similar to that determined by a spectrophotometric method using the reagent p-dimethylaminobenzaldehyde (R2 = 0.982, n = 6). The average recovery of urea from urine samples using this urea biosensor is approximately 103%.
1. Introduction
Sol-gel has good properties for the fabrication of biosensors. One of the main features of the sol–gel is that it can entrap biomolecules such as proteins, enzymes, antibodies, etc. The immobilized biomolecules in sol-gel matrix exhibit structural integrity, very often full biological functions and also significant stability to resist chemical and thermal deactivation. This is due to simple sol–gel processing conditions and a possibility of tailoring the process for specific requirements and provides inherent versatility. Sol–gel-derived glasses can be a potential host matrix for chemical sensing and biosensing. The sol–gel transparency with diverse chemistries and configurations for the entrapment of many biomolecular dopants also enables the development of optical biosensors [1,2].
A few urea optodes based on sol-gel film have been reported. One example is urease immobilized in sol-gel matrix with fluorescein isothiocyanate-dextran as a florescence dye by Tsai et al. [3]. Another urea optode reported by Gulcev et al. [4] contained 500 nm thick film immobilized with urease enzyme or lipase and fluorescein/carboxy-seminaphtharhodafluor-1 (SNARF-1) as the sensing materials. The materials were conjugated to a dextran polymer backbone, and mixed with hydrolyzed alkoxysilane solutions and then cast onto a planar surface to form a biologically active sol–gel derived film.
In this study, a urease-based optical biosensor using spectrophotometric detection based on a lipophilic Nile Blue chromoionophore in sol–gel films was designed for the detection of urea. Urea can be hydrolysed by urease to products that cause pH changes:
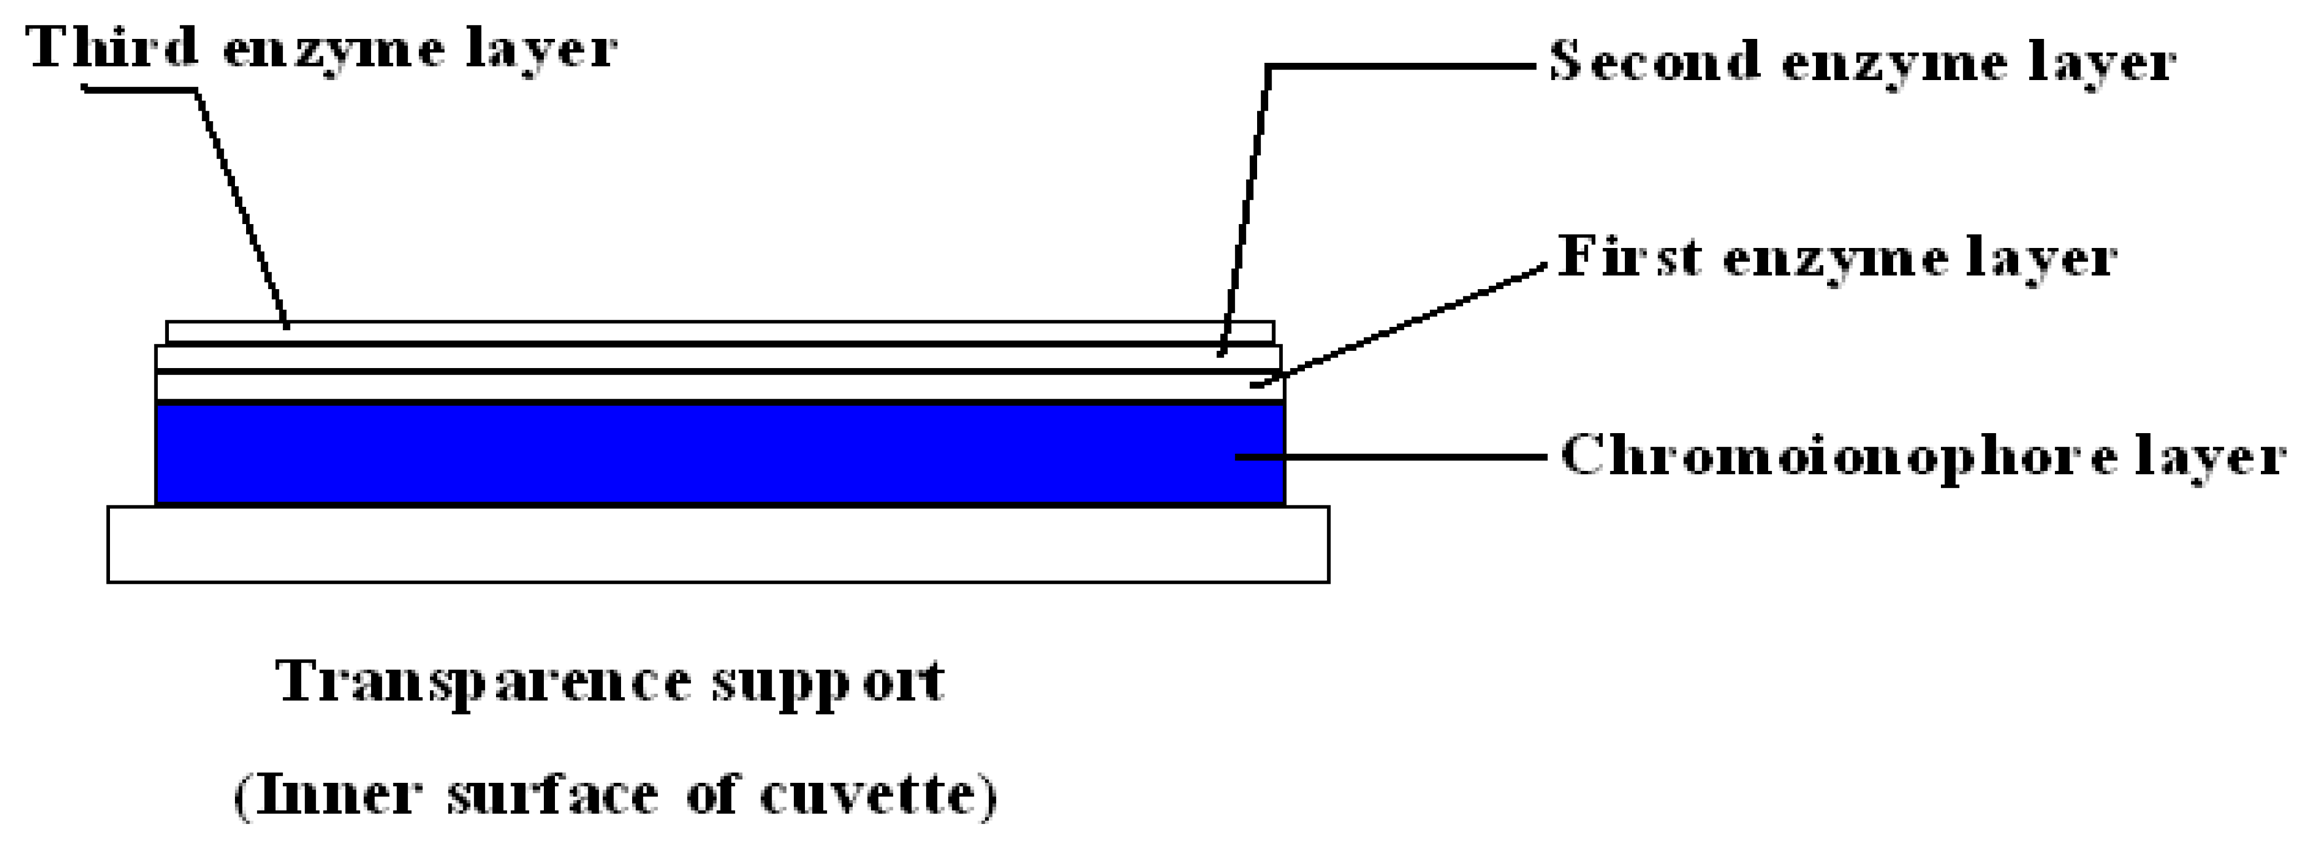
The complete urea hydrolysis can cause a large change in pH and leads to a change in the immobilized chromoionophore's colour. Thus, the over all colour change is related to the urea concentration. Several types of lipophilic Nile Blue chromoionophores have been used frequently with plasticized PVC membrane for urea biosensor constructions [5-7] but recently it was employed successfully with sol-gel films for a pesticide biosensor [8]. In this work, the Nile Blue chromionophore was immobilized in the first layer of the sol-gel film and multilayers of urease enzyme in sol-gel were deposited over the first. The cross-section of the biosensor construction is illustrated in Figure 1.
They are many advantages of using multi-layers of sol-gel films to form a stack membrane. The main advantage is to prevent a direct mixing of the chromoionophore and the urease enzyme, which may impair the activity of the enzyme [8]. Furthermore, by using many layers of sol-gel film, the amount of enzyme for the biosensor can be increased when compared to employing a single layer of the sol-gel film, which can only accommodate a limited amount of immobilized enzyme. Increasing the amount of immobilized enzyme potentially improve the response of the biosensor. Furthermore because a lipophilic Nile blue chromoionophore is used, the leaching of the pH indicator dye from the sol-gel film can also be prevented without the necessary covalent immobilization of the compound.
2. Results and Discussion
2.1 The pH sensor based on sol-gel Nile blue chromoionophore film
The response of the sol-gel film containing immobilized Nile Blue chromoionophore to pH is shown in Figure 2. The behaviour of the immobilized chromoionophore towards pH changes is close to those observed in similar sol-gel materials reported [8] or that immobilized in plasticizer-free polymers such as methacrylic-acrylic membranes [10]. The linear response range of the pH sensitive sol-gel layer is from pH 4.28 to 10.36 (y = 0.0219x - 0.0782, R2 = 0.9549) (Figure 2). This good response of the pH sensor can be utilised for the construction of urea biosensor where the hydrolysis of urea by the enzyme urease will lead to changes in pH and detected by the chromoionophore sol-gel layer.
2.2 Effect of buffer capacity on the optical biosensor response
From 1 mM to 10 mM of the concentrations of TrisHCl buffer used, the response of the biosensor to urea showed no statistically significant changes (α = 0.05) and buffer concentration at 10 mM was then chosen as an optimum buffer concentration because of a better reproducibility in the response (Table 1). Tsai et al. [3] and Rajesh et al. [11] reported optimum response for a urea biosensor was obtained when the Tris-HCl buffer was at 1 mM.
2.3 Effect of pH on the response of the optical biosensor
Because the transducer of the biosensor is pH sensitive and the urease used is also affected by the pH condition, it is necessary to fix the pH and optimize it when the measurement is carried out. The response of the optical urea biosensor with changing pH values is depicted in Table 2 for a fixed amount of urea. TrisHCl buffer of pH 7.5 appeared to provide an optimum response since the biosensor gave the best linearity and sensitivity when compared with pH 5 and 9. The range of optimum pH for urea biosensors using different immobilization matrices was reported to be from 7.0 to 8.5 [3,11].
2.4 Effect on enzyme loading on the biosensor response
The response of a biosensor is also dependent on the amount of enzyme immobilized. For a fixed amount of matrix used for enzyme immobilization, most matrices can accommodate only a limited amount of enzyme. One way to increase the amount of immobilized enzyme for a biosensor beyond that can be accommodated by certain weight of matrix is to deposit many layers of enzyme immobilized matrix. In this study, the effect of coating several layers of sol-gel films on the response of the biosensor was evaluated and each layer of the sol-gel film contained 0.4 mg of urease. The relationships between ∆A vs. urea concentration for different loadings of urease are illustrated in Figure 3.
The rate of enzyme-catalyzed reaction depends on the concentrations of enzyme and substrate. With a fixed enzyme concentration, the velocity of reaction increases hyperbolically with the substrate concentration until a limiting maximal velocity (saturation) is reached. At saturation or zero-order kinetics, the enzyme activity is directly proportional to the enzyme concentration and it is independent on substrate concentration [12-14]. At lower amount of enzyme under a fixed pH and buffer capacity, this saturation occurs at lower concentration of substrate. This is observed for one and two layers of urease immobilisation as shown in Figure 3. It seems that for one and two layers of urease immobilized, the saturation behaviour appears after about 20 mM of urea substrate. But for the three-layer urease immobilization, no obvious saturation encounters even at 100 mM urea. The increase of enzyme immobilized resulted in more hydrolysis of urea and thus increasing the linearity of the biosensor response to urea because of less saturation effect.
2.5 The reproducibility and repeatability characteristics of the urea biosensor
The reproducibility study for the biosensor was carried out by using 19 biosensors. Each biosensor was used only once. The average of ΔA was calculated and this was 0.37±0.04 yielding a relative standard error (RSD) of 9.53 %. This RSD value is considered acceptable for the reproducibility studies.
For the repeatability study, a biosensor was used seven times. Four biosensors were used for the evaluation and average value of ΔA was calculated. The value found was 0.41±0.04. The RSD for the repeatability of four biosensors is 9.79%. The difference observed for different biosensors may be due to the slightly differences in the thickness of the sol-gel film. The fast solidification of the enzyme layer might not give enough time to create a uniform morphology of the surface and this may affect the thickness of the biosensor film at different locations. Thus, the variation of the thickness can cause fluctuation of ΔA between measurements.
2.6 The validation results of the optical urea biosensor with urine samples
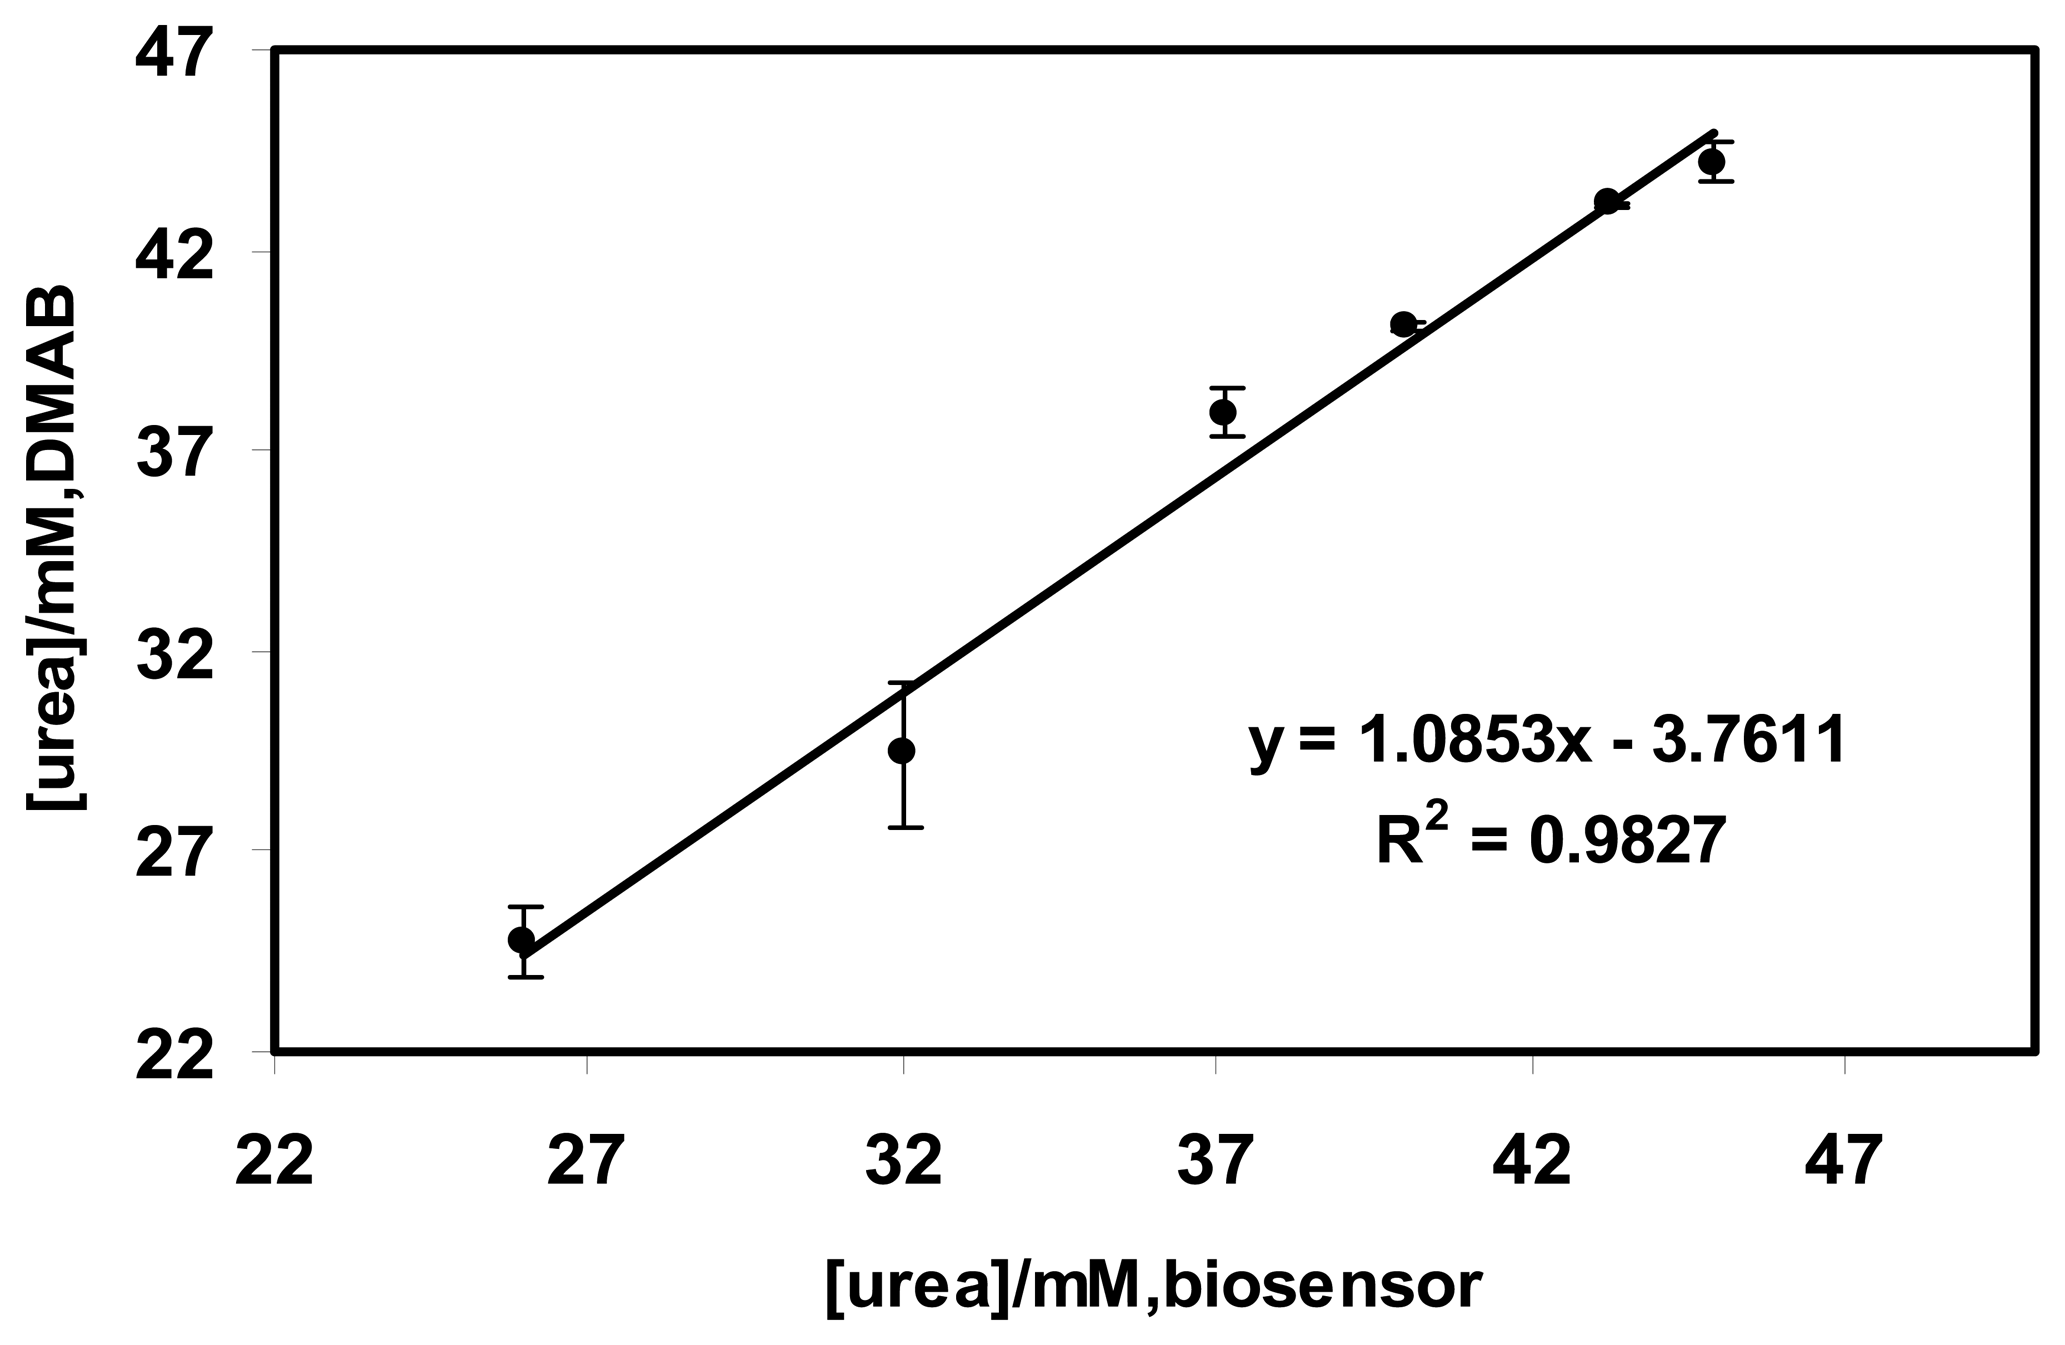
The evaluation of the sensitivity of the biosensor can be performed by comparing the biosensor performance with other standard methods for urea determination. The method chosen was p-dimethylaminobenzaldehyde (DMAB) spectrophotometric method [9]. A urine sample spiked with different concentrations of urea was used for comparison study between the urea biosensors and DMAB chemical methods. A comparison of the two methods for urea determined in urine samples is depicted in Figure 4. The correlation coefficient (R2) for urea concentrations between the biosensor and DMAB methods was 0.9828 and the slope was 1.0853. This good correlation indicates that the urea biosensor developed in this study can be used to measure urea concentrations satisfactory in sample with a complex matrix such as urine without suffering from other interferences.
2.7 Recovery characteristics of urea biosensor in urine samples
Urea content in urine is a measure of protein breakdown in the human body. As urea is excreted by the kidneys, excretion of urea can reflect kidney function. However, the test of urea in urine is mainly used to assess the protein balance and the amount of dietary protein needed by severely ill patients. The normal range of urea excreted via urine is 6-17 gm in 24 h (60-90 mg/dL). To evaluate whether the optical urea biosensor is suitable for the determination of urea in urine, a urine sample was spiked with different amounts of urea. The percentage of recovery of the urea after determination employing the urea biosensor is shown in Table 3. From the urea concentration of 12 – 27 mM, the urea biosensor demonstrated average recovery percentage of close to 103%, which showed that no major interference on the analysis for urine samples.
2.8 Stability of the urea biosensor
Over a period of 100 days, the response of the biosensor towards a fixed amount of urea was observed to decrease progressively at approximately 0.4% per day (n = 15). However, at the end of 100 days, 60% of the response still remained relative to the response at day-1. Other studies indicated that sol-gel encapsulated urease normally declined over time [15]. As much as 45% loss of sensitivity in 28 days when stored in buffer solution has been reported before [3]. Thus, the optical biosensor developed here can be used to measure urea routinely over the studied period but calibration is required.
2.9 Comparison with other urea biosensors
Many urea biosensors using both optical and electrochemical methods are reported in the literature (Table 4). Different matrices were used to immobilize the enzyme urease. Tsai & Doong [3] reported co-entrapment of urease and acetylcholinesterase in FITC-dextran and sol–gel matrix and 10% glycerol was doped into TMOS-based sol-gel. Sahney et al. [16] used porous silicate matrix for the encapsulation of urease enzyme on a glass electrode for sensing urea in blood samples. The immobilized enzyme in sol-gel was stable for about 25 days at 4°C with 80% urease activity. Gulcev et al. [4] co-entrapped hydrolytic enzymes with polymers that are labeled with pH sensitive fluorophores. The performance of the co-entrapped enzyme depended on the type and amount of additive.
When compared with other urea biosensors studied, the optical urea biosensor developed in this work demonstrated by far the largest linear response range, i.e. up to 100 mM of urea whilst many other reported urea biosensors showed largest linear response range of up to 50 mM only (Table 4). This improved in the linear response range is probably attributed to the ability to immobilise more enzyme with the stacked sol-gel films design and also the higher buffer capacity employed in this work. But the many layers of the stacked films also increased the response time of the urea biosensor when compared to other urea biosensors reported. The response time of the optical pH sensor was 5-6 min whilst for the urea biosensor it was 10-15 min. The higher buffer capacity used in this work also led to a less sensitive urea biosensor [17].
The use of sol-gel multi-layer films has enabled the immobilization of both indicator dye and urease enzyme using the same matrix materials. The significance of the method is the immobilization of both of these sensing materials without have to covalently attach them to prevent leaching problem. Another advantage of the use of multi-layer of sol-gel films is the possibility for increasing the loading of the enzyme beyond that can be accommodated by a single layer of sol-gel film. This work has demonstrated that increasing loading of enzyme in this manner could yield a urea biosensor with a larger dynamic linear range and acceptable sensitivity. The optical urea biosensor based on this design also demonstrated good analytical performance in terms of reproducibility, repeatability and accuracy.
3. Experimental
3.1 Materials
Tetraethosilicate (TEOS, 98%), chitosan (CM-100), Nile Blue chromoionophore ETH5294 (Fluka), ethanol (95%) (Systerm), Tris(hydroxylmethyl) aminomethane hydrochloride (TrisHCl) (99.5%) (Duchefa), hydrochloric acid (Baker) and sodium hydroxide (98%) (Normapur), urea (Univar), urease type IX Jack bean (EC 3.5.1.5) (Sigma-Aldrich), p-dimethylaminobenzaldehyde (DMAB) (Riedel de Haen) were used without further purification. All aqueous solutions were prepared by doubly distilled and deionized water.
3.2 Preparation of optical pH sensor and evaluation of response
A sol–gel solution was prepared by mixing an optimized composition of 4.5 mL of TEOS, 1.4 mL of distilled water and 0.1 mL of 0.1 M HCl. A volume of 100 μL of 1% chitosan solution was added to 10 mL of this mixture. It was then stirred vigorously at room temperature for 3 h until a clear sol was formed. The sol was then stored in a refrigerator at 4°C when not in use.
A stock solution of the Nile Blue chromoionophore (ETH5294) was prepared by dissolving 1.8 mg chromoionophore in 7 mL of dichloromethane. A volume 60 μL of this stock solution was pipette out and then evaporated at room temperature to dryness. This was followed by an addition of 100 μL of sol-gel solution. The mixture was stirred for a few minutes until became homogenous. The bluish sol-gel chromoionophore solution was kept in a refrigerator at 4 °C until use. To prepare the pH sensitive sol-gel film, the sol-gel solution containing chromoionophore was droped coated on the inner transparent surface of a 1.5 mL-plastic cuvette by dispensing 110 μL of the mixture into the cuvette laid horizontally. The cuvette was then sealed tight with a rubber stopper and laid in a horizontal position to allow the sol-gel film to be formed when the gel solidified. This would normally take 24 h and a film of blue color with a thickness of approximately 300 μm would be obtained. The cuvette coated with the sol-gel film on one side was then ready for use as a pH sensing device.
The optode films were tested from pH 2 – 12 in a TrisHCl buffer of 1 mM. Changes in the absorbance were measured using a spectrophotometer (Model Cary 50). A Dell personal computer was used for on-line data collection. To test the response of the pH, cuvettes containing the a sensing film were first filled with 2 mL of the test solution and then placed in a spectrophotometer with the sensing film nearer to the incoming light source. These films were first scanned in the wavelength range of 400-800 nm to demonstrate the presence of peaks at 550 nm (deprotonation), 600 and 650 nm (protonation) [10]. Absorption peak of 550 nm was selected for optode studies because it was separated from the other two peaks. The difference (∆A) between the absorbance of each wavelength and the baseline value was taken and plotted against the pH values. The changes of the absorbance were attributed to the deprotonation and protonation processes at basic and acidic pHs respectively. The changes in the absorbance were recorded every one minute until a stable response was obtained, this usually took approximately 5 min.
3.3 Preparation urea biosensor and evaluation of biosensor response
A fixed quantity of 10 mg of urease enzyme was added to 1.0 mL of 10 mM Tris-HC1 buffer (pH=7.5) and stirred for a few minutes until the mixture became homogeneous. 80μL of the solution was added to 20 μL of sol-gel mixture (without chromoionophore) and mixed. This urease/sol-gel mixture was then drop-coated on top of the chromoionophore layer formed earlier in the cuvette. Additional layers of urease/sol-gel could be added by using the same coating procedure. The cuvette was then sealed tight with a rubber stopper to allow the sol-gel solidification process to occur.
The effect of buffer capacity on the response of the urea biosensor was examined by using a series of TrisHCl buffer concentrations ranged from 1-12.5 mM with a fixed pH of 7.5 and urea concentration at 20 mM. The optimisation of pH response of the urea biosensor was carried out by using fixed concentration of TrisHC1 buffer (10 mM) but changing urea concentrations of 5-20 mM at pHs 5, 7.5 and 9. The change of absorbance was measured in each case at 550 nm.
Several solutions of urea with concentrations of 10-100 mM in 10 mM Tris-HCl buffer (pH 7.5) were used for the evaluation of the biosensor response to urea. The absorbance change of the biosensor was measured at 550 nm. The measurements were also performed for biosensors containing two and three layers of coated urease/sol gel films. The linear response range of urea for these biosensors was determined from the plots of urea concentrations against the absorbance change at 550 nm. The measurement procedures using a spectrophotometer followed that explained for the pH sensor above.
3.4 Assessment of the reproducibility and repeatability of the optical urea biosensor
Nineteen biosensors were prepared and tested in a concentration of 20 mM urea at pH 7.50, 10 mM Tris-HCl buffer. The reproducibility of the absorbance measurements (∆A) of each biosensor to urea was carried out at 550 nm. Repeatability study was performed by using the same procedure but four biosensors were used and seven measurements were taken for every biosensor. The average and relative standard deviation (RSD) of ∆A were calculated.
3.5 Validation and recovery studies using urine samples
To validate the biosensor response a standard procedure employing a non-enzymic method for the analysis of urea based on p-dimethylaminobenzaldehyde (DMAB) [9] was employed to compare with the biosensor response. A solution containing 16 g of DMAB dissolved in 1L alcohol and 100 mL HC1 was used for the chemical analysis of urea. The range of standard urea concentrations used was 1.5 - 5.5 mM. Equal volumes (1.5 mL) of the standard urea solutions and DMAB were mixed thoroughly and left for 10 min in a water bath at 25°C before the absorbance was measured at 420 nm. A reagent blank was also prepared similarly. Absorbance values (∆A) were plotted against urea concentrations to obtain the calibration curve of the DMAB method.
A urine sample (1.5 mL) was spiked with 25 - 45 mM of urea before used for urea determination with three different optical urea biosensors at 550 nm. Urea concentrations in the same urine sample were also determined by DMAB method. In this case 0.1 mL of urine was added to 0.9 mL of phosphate buffer to dilute the sample before addition of 1 mL of DMAB followed by absorbance measurement at 420 nm. The dilution was necessary to adjust the urea concentration within the calibration range of the DMAB method and also to reduce the yellowish colour of the sample, which may interfere with the measurement at 420 nm.
The recovery study involved a recovery of spiked urea from urine samples. The urine samples were spiked with 25 - 45 mM of urea to each sample. The urea concentration of each spiked urine sample was determined by the biosensor method. Absorbance was also recorded for urine sample without the addition of urea. The percentage of recovery of urea from all samples for the biosensor method was calculated according to:
Where Cs is the concentration of urea determined by the biosensor and C is the actual concentration of urea spiked.
3.6 Procedure for long term stability evaluation of the urea biosensor
Six biosensors were fabricated and used for the determination of 20 mM of urea over a period of 100 days. Each biosensor was repeatedly tested for up to 15 times over this period. While not in use, they were kept at 4°C. The change in absorbance was determined and the stability evaluated.
Acknowledgments
We like to thank Universiti Kebangsaan Malaysia for their funding support via the Research University Operation Grant under the Advance Materials and Technology Cluster. This project is also funded by the National Biotechnology Directorate, Ministry of Science, Technology and Innovation of Malaysia via grant 09-03-03-006.
References
- Gupta, R.; Chaudhury, N.K. Entrapment of biomolecules in sol-gel matrix for applications in biosensors: Problems and future prospects. Biosensors and Bioelectronics 2007, 22, 2387–2399. [Google Scholar]
- Jeronimo, P.C.A.; Araujo, A.N.; Montenegro, M.; Conceicao, B.S.M. Optical sensors and biosensors based on sol–gel films. Talanta 2007. In press. [Google Scholar]
- Tsai, H.C.; Doong, R.A.; Chiang, H.C.; Chen, K.T. Sol–gel derived urease-based optical biosensor for the rapid determination of heavy metals. Analytica Chimica Acta. 2003, 481, 75–84. [Google Scholar]
- Gulcev, M.D.; Goring, L.G.; Gillian, R.M.; Brennan, J.D. Reagentless pH-based biosensing using a fluorescently-labelled dextran co-entrapped with a hydrolytic enzyme in sol–gel derived nanocomposite films. Analytica Chimica Acta. 2002, 457, 47–59. [Google Scholar]
- Wofbeis, O.S.; Li, H. Fluorescence optical urea biosensor with an ammonium optrode as transducer. Biosensor Bioelectronics 1993, 8, 161–166. [Google Scholar]
- Preininger, C.; Wolfbeis, O.S. Disposable cuvette test with integrated sensor layer for enzymatic determination of heavy metals. Biosensor Bioelectronics 1996, 11, 981–990. [Google Scholar]
- Kovács, B.; Nagy, G.; Dombi, R.; Tóth, K. Optical biosensor for urea with improved response time. Biosensors and Bioelectronics 2003, 18, 111–118. [Google Scholar]
- Wong, F.C.M.; Ahmad, M.; Heng, L.Y.; Peng, L.B. An optical biosensor for dichlovos using stacked sol-gel containing acetylcholinesterase and a lipophilic chromoionophore. Talanta 2006, 69, 888–893. [Google Scholar]
- Williams, S. Official Methods of Analysis of the Association of Official Analytical Chemists; Association of Official Analytical Chemists: Colombia, Maryland, 1984. [Google Scholar]
- Heng, L.Y.; Fang, T.H.; Chern, L.H.; Ahmad, M. Influence of methacrylic-acrylic copolymer composition on plasticizer-free optode films for pH sensors. Sensors 2003, 3, 83–90. [Google Scholar]
- Rajesh, B.V.; Takashima, W.; Kaneto, K. An amperometric urea biosensor based on covalent immobilization of urease onto an electrochemically prepared copolymer poly (N-3-aminopropyl pyrrole-co-pyrrole) film. Biomaterials 2005, 26, 3683–3690. [Google Scholar]
- Conn, E.E.; Stumpf, P.K. Outlines of Biochemistry, 3rd Edition ed; John Wiley & Sons: New York, 1972. [Google Scholar]
- Naz, S. Enzymes And Food; Oxford University Press: Oxford, 2002. [Google Scholar]
- Voet, D.; Voet, J.G. Biochemistry, 3rd Edition ed; John Wiley & Sons: Hoboken, NJ, 2004. [Google Scholar]
- Lee, W.Y.; Kim, S.R.; Kim, T.H.; Lee, K.S.; Shin, M.C.; Park, J.K. Sol-gel derived thick-film conductometric biosensor for urea determination in serum. Anal Chim. Acta. 2000, 404, 195–203. [Google Scholar]
- Sahney, R.; Puri, B.K.; Anand, S. Enzyme coated glass pH-electrode: Its fabrication and applications in the determination of urea in blood samples. Anal. Chim. Acta. 2005, 542, 157–161. [Google Scholar]
- Koncki, R.; Mohr, G.J.; Wolfbeis, O.S. Enzyme biosensor for urea based on a novel pH bulk optode membrane. Biosensors Bioelectronics 1995, 10, 653–659. [Google Scholar]
Figure 1.
The cross-section of a urea biosensor based of stacked sol-gel films.

Figure 2.
The response of the Nile Blue chromoionophore towards the changes of pH measured at 550 nm.
Figure 2.
The response of the Nile Blue chromoionophore towards the changes of pH measured at 550 nm.
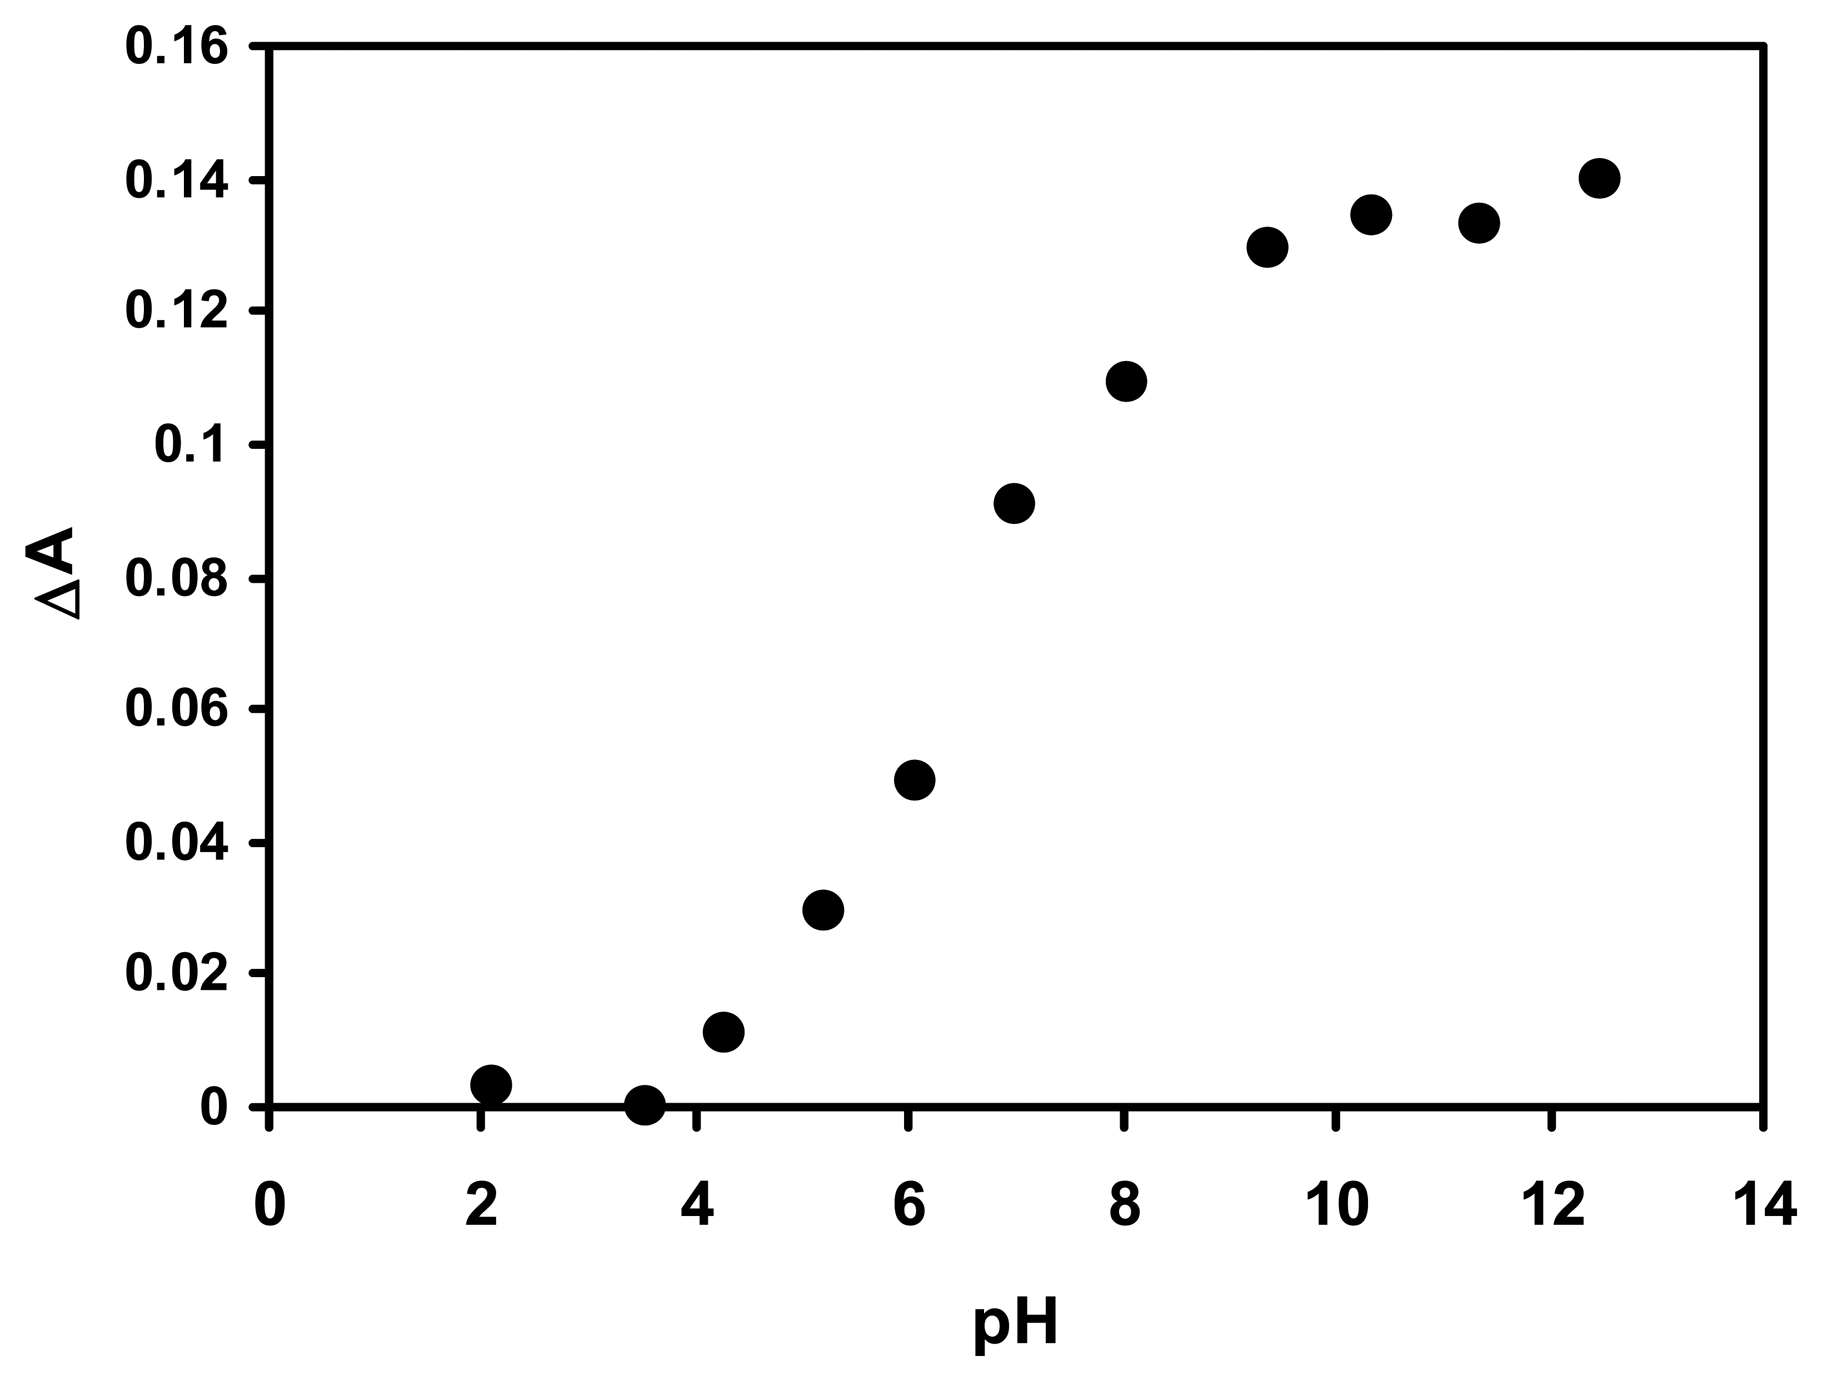
Figure 3.
The relationship between ∆A vs. [urea] at 550 nm for biosensors with different number of layers of urease enzyme in sol-gel (pH 7.5, 10 mM of Tris-HCl buffer;.
Figure 3.
The relationship between ∆A vs. [urea] at 550 nm for biosensors with different number of layers of urease enzyme in sol-gel (pH 7.5, 10 mM of Tris-HCl buffer;.
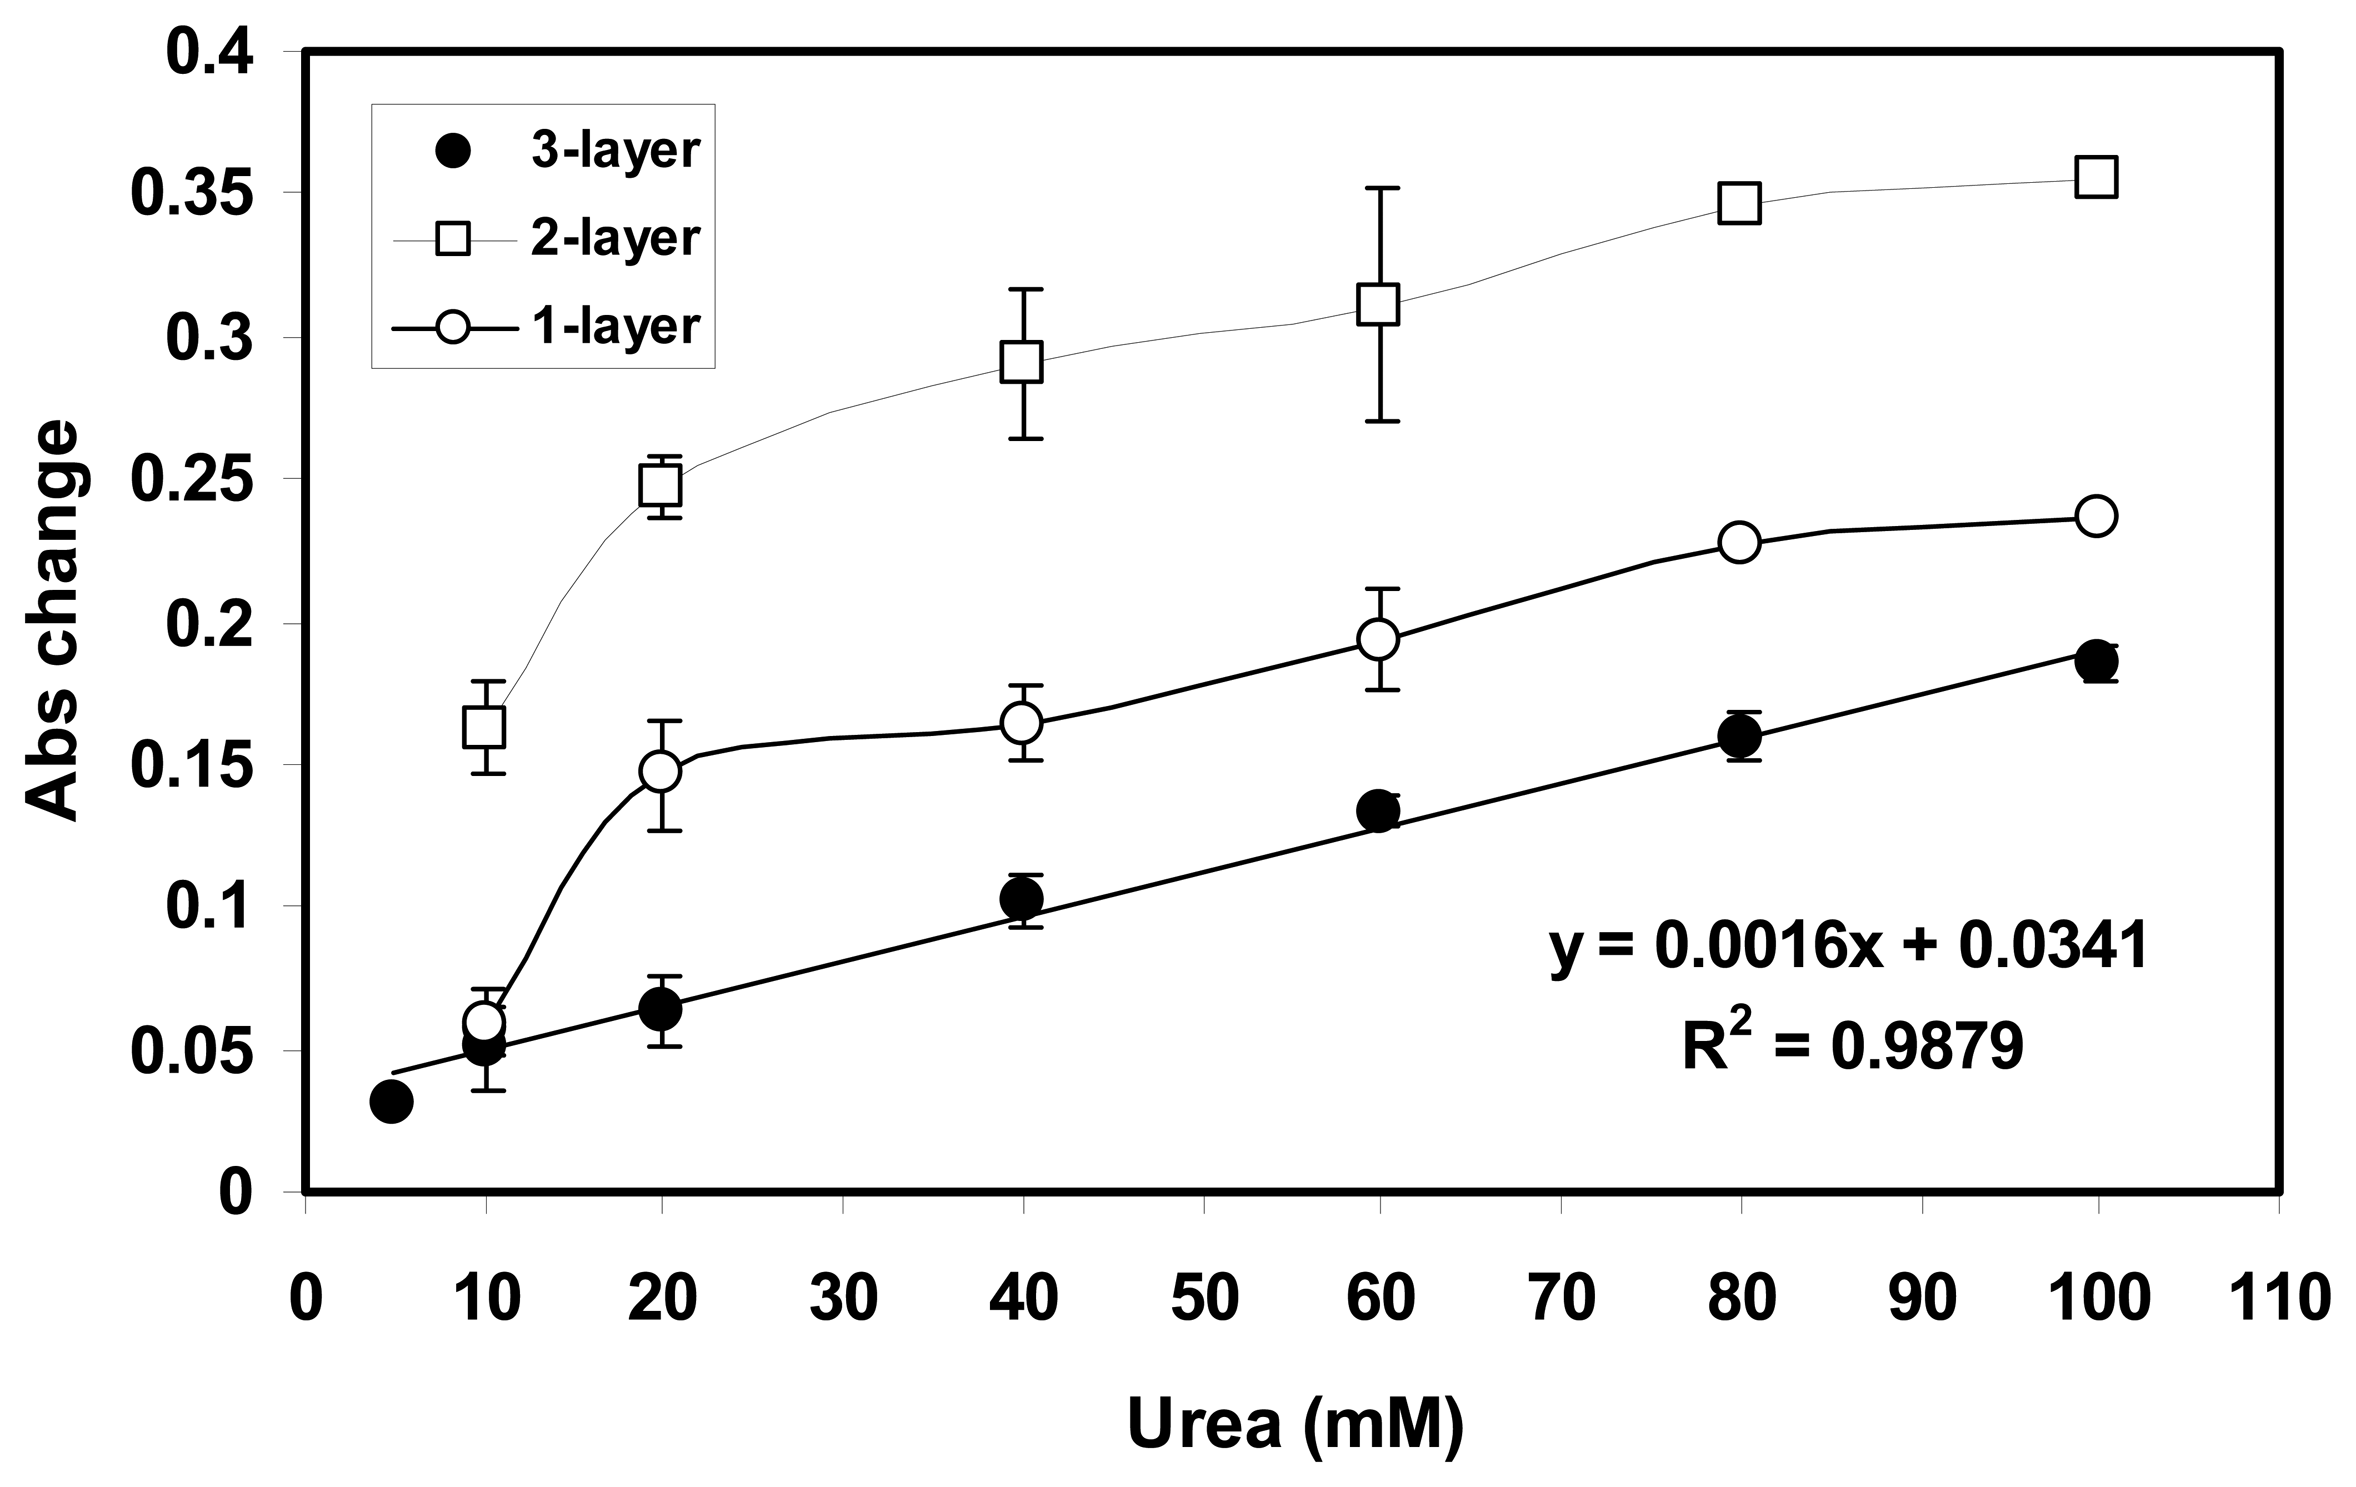
Figure 4.
The relationship between spiked urea concentrations in urine samples determined by biosensor method and DMAB method.
Figure 4.
The relationship between spiked urea concentrations in urine samples determined by biosensor method and DMAB method.


Table 1.
The changes in absorbance (ΔA) of the urea biosensor to 20mM urea in TrisHCl buffer concentrations of 1, 5 and 10 mM at pH=7.5.
| TrisHCl (mM) | Mean absorbance change (ΔA) (n = 3) | Relative standard deviation (%) |
|---|---|---|
| 1 | 0.238 ± 0.066 | 27.7 |
| 5 | 0.271 ± 0.075 | 27.6 |
| 10 | 0.294 ± 0.066 | 22.4 |
Table 2.
The linear correlation coefficients (R2) and the sensitivity of the biosensor response to urea at various pHs (∆A vs. [urea]; at wavelength 550 nm.
| pH value | Linear correlation coefficient (R2) (n = 4) | Sensitivity (ΔA/mM) | Urea concentration (mM) |
|---|---|---|---|
| 5 | 0.9854 | 0.0043 | 5-20 |
| 7.5 | 0.9968 | 0.0060 | 5-20 |
| 9 | 0.7136 | 0.0026 | 5-20 |
Table 3.
The recovery of urea from spiked urine samples based on urea biosensor determination (n = 3).
| Urea spiked (mM) | Urea determined by biosensor (mM) | % of recovery |
|---|---|---|
| 12.76 | 12.06±0.49 | 94.51 |
| 18.36 | 17.89±0.33 | 97.44 |
| 23.10 | 25.31±1.56 | 109.6 |
| 27.17 | 30.58±2.41 | 112.6 |
Table 4.
A summary of some reported urea biosensors compared with the biosensor reported in this work.
| Principle of detection | **Sensing matrix | Urea concentration range | Response time | Reference |
|---|---|---|---|---|
| Absorption | Sol-gel/Nile blue indicator | 5.0 – 100 mM | 10-15 min | This work |
| Absorption | Nonactin+Nile blue indicator/Plasticicized PVC | 0.1-1 mM | 16-20s | [17] |
| Fluorescence | Sol-gel(TMOS) FITC-dextran | 1.25μM-50mM | 10 min | [3] |
| Fluorescence | TEOS+ MTES+ DMDMS+ SNARF-1 | 1-30 mM | <2 min | [4] |
| Potentiometric | Sol-gel(TMOS) | 0.03-30 mM | > 5 min | [16] |
| Amperometric | PAPCP\ITO | 0.16-5.02 mM | 40s | [11] |
MTES: methyltriethoxysilane, DMDMS: dimethyldimethoxysilane TMOS: Tetramethylorthosilicate, PAPCP: N3-aminopropyl pyrrole-co-pyrrole, ITO: indium-tin-oxide, PVC: Poly(vinylchloride), SNARF-1: carboxy-seminaphtharhodafluor-1
© 2007 by MDPI ( http://www.mdpi.org). Reproduction is permitted for noncommercial purposes.
Share and Cite
MDPI and ACS Style
Alqasaimeh, M.S.; Heng, L.Y.; Ahmad, M. A Urea Biosensor from Stacked Sol-Gel Films with Immobilized Nile Blue Chromoionophore and Urease Enzyme. Sensors 2007, 7, 2251-2262. https://doi.org/10.3390/s7102251
AMA Style
Alqasaimeh MS, Heng LY, Ahmad M. A Urea Biosensor from Stacked Sol-Gel Films with Immobilized Nile Blue Chromoionophore and Urease Enzyme. Sensors. 2007; 7(10):2251-2262. https://doi.org/10.3390/s7102251
Chicago/Turabian StyleAlqasaimeh, Muawia Salameh, Lee Yook Heng, and Musa Ahmad. 2007. "A Urea Biosensor from Stacked Sol-Gel Films with Immobilized Nile Blue Chromoionophore and Urease Enzyme" Sensors 7, no. 10: 2251-2262. https://doi.org/10.3390/s7102251