Article

Operational Mapping of Soil Moisture Using Synthetic Aperture Radar Data: Application to the Touch Basin (France)

1
French Geological Survey (BRGM), BP 36009, 45060 Orléans Cedex 2, France
2
Météo-France, 42 avenue G. Coriolis, 31057 Toulouse Cedex, France
3
SCHAPI, 42 avenue Coriolis, 31057 Toulouse Cedex, France
4
CETP/CNRS, 10/12, avenue de l'Europe, 78140 Velizy, France
*
Author to whom correspondence should be addressed.
Sensors 2007, 7(10), 2458-2483; https://doi.org/10.3390/s7102458
Submission received: 31 August 2007 / Accepted: 21 October 2007 / Published: 22 October 2007
(This article belongs to the Special Issue Remote Sensing of Natural Resources and the Environment)

Abstract

:
Soil moisture is a key parameter in different environmental applications, such as hydrology and natural risk assessment. In this paper, surface soil moisture mapping was carried out over a basin in France using satellite synthetic aperture radar (SAR) images acquired in 2006 and 2007 by C-band (5.3 GHz) sensors. The comparison between soil moisture estimated from SAR data and in situ measurements shows good agreement, with a mapping accuracy better than 3%. This result shows that the monitoring of soil moisture from SAR images is possible in operational phase. Moreover, moistures simulated by the operational Météo-France ISBA soil-vegetation-atmosphere transfer model in the SIM-Safran-ISBA-Modcou chain were compared to radar moisture estimates to validate its pertinence. The difference between ISBA simulations and radar estimates fluctuates between 0.4 and 10% (RMSE). The comparison between ISBA and gravimetric measurements of the 12 March 2007 shows a RMSE of about 6%. Generally, these results are very encouraging. Results show also that the soil moisture estimated from SAR images is not correlated with the textural units defined in the European Soil Geographical Database (SGDBE) at 1:1000000 scale. However, dependence was observed between texture maps and ISBA moisture. This dependence is induced by the use of the texture map as an input parameter in the ISBA model. Even if this parameter is very important for soil moisture estimations, radar results shown that the textural map scale at 1:1000000 is not appropriate to differentiate moistures zones.

1. Introduction

Soil moisture plays a crucial role in the continental water cycle, more specifically in the distribution of precipitation between surface runoff and infiltration, which is the main driver behind most hydrological and geomorphologic processes [1-3]. The retrieval of soil moisture data is of considerable importance in various applications, such as hydrology, risk prediction, agriculture, and meteorology. It is a key indicator for constraining the initial conditions of infiltration/runoff rates when modeling overland flow. The knowledge of the initial water content at the beginning of the rainfall event is a prerequisite because all infiltration models integrate this information. In the context of implementing the Water Directive and the forthcoming Soil Framework Directive in Europe, there is a need for operational tools to evaluate land management scenarios and to provide sound references for targeting land use planning and the protection of natural resources. More specifically, operational services in charge of flood prevention and forecasting, such as the SCHAPI (National Flood Forecasting Agency) in France are investing in the continuous distributed modeling of soil surface moisture.
Only spatial remote sensing allows monitoring of environmental problems over large areas at regular intervals. Moreover, radar sensors allow mapping whatever the meteorological conditions (clouds, fog, etc.), both day and night. This is not the case with optical sensors, which are difficult to operate if there is cloud cover, a frequent situation in periods where flood events occur. The Soil Surface Characteristics (SSC) can be estimated from microwave remote sensing sensors due to the sensitivity of radar signal to soil characteristics such as the soil's roughness and dielectric constant [4-6]. In addition, the radar signal depends on various radar parameters such as the polarization, incidence angle and frequency.
The SAR sensors currently operational are PALSAR/ALOS, ASAR/ENVISAT, RADARSAT-1 and ERS-2. ERS-2 and RADARSAT-1 provide data based on a single polarization (VV for ERS-2, and HH for RADARSAT-1) whereas ASAR allows the scientific community to acquire images in dual-polarization mode (HH/HV, HH/VV, VV/VH). The radar incidence angle is 23° for ERS-2, between 20° and 50° for RADARSAT-1, and ranges from 14° to 45° for ASAR. The nominal swath width for ASAR and ERS-2 is greater or equal to 100 km, with a spatial resolution of, at best, 25 m (12.5 m pixel size). For RADARSAT-1, the nominal swath width is greater than or equal to 50 km, with a spatial resolution of, at best, 10 m (6.25 m pixel size). These three radar sensors operating in C-band (∼5.3 GHz), have been widely used for retrieving soil moisture [e.g. 4, 7-15]. The SAR data are more and more used to derive soil parameters. Although many improvements have been achieved, this field is still not fully operational.
When using ERS-1/2, RADARSAT-1 and ASAR, a better estimate of soil moisture is obtained with a radar configuration that minimizes the effects of other soil surface characteristics (mainly surface roughness). Several studies have shown that the best C-band estimates of soil moisture when using only one radar channel are obtained with SAR images acquired at low and medium incidence angles [13, 15, 16]. These optimal configurations of incidence angle (≤37°) can be attained with current SAR sensors (ERS-2, RADARSAT-1, ASAR, and ALOS) about 10 times per month on a study site in Europe. The arrival of new sensors (TerraSAR-X, COSMO-SkyMed, and RADARSAT-2) should improve this temporal frequency.
The use of two SAR images acquired at both low and high incidence angles markedly improves the precision of the moisture estimate because the backscattering coefficients ratio eliminates the effects of roughness and thus permits linking of the radar backscattering coefficients to only the moisture [13, 15, 16]. This solution is not possible with current SAR sensors and will not be possible either with the sensors planned for the near future (ALOS, RADARSAT-2 and Terra SAR-X). Indeed, the time separating two SAR images acquired by the same sensor at two selected incidence angles (20° and 40°) is of the order of a few days (about 7 days with ASAR over the Touch basin), which limits the use of this possibility because the soil surface characteristics could change rapidly between the two acquisitions. Only the single incidence case is thus possible. The use of SAR images with two polarizations (case of ASAR sensor) does not provide a significant improvement in estimating soil moisture (improvement <1%, [15, 17]) when compared with the results obtained with a single polarization.
Soil moisture can be measured (in situ or using remote sensors) and also modeled. In situ soil moisture measurements are performed using two techniques: TDR (Time Domain Reflectometry) probes and gravimetry. TDR measurements are quicker to carry out, but less precise than those stemming from the gravimetric method. A drift in TDR measurements is often observed, and it is for this reason that the calibration of probes by several gravimetric measurements is often recommended. In practice, the volumetric water content on a field scale is assumed to be equal to the mean value estimated from several representative samples collected from the top layer of soil.
Estimation of soil moisture by inversion of SAR data can be performed in using physical or semi-empirical approaches. The physical approach uses backscattering models capable of reproducing the radar backscattering coefficient from the sensor configuration (wavelength, polarization, and incidence angle) and soil parameters (soil moisture and surface roughness for bare soils). However, several studies have reported a poor agreement between measured radar signals and those predicted by the models [18-21]. Differences between simulations and measurements may reach several decibels, rendering the inversion results inaccurate. The second approach consists of establishing experimental calibration relationships linking the signal radar to soil parameters (surface roughness and soil moisture of bare soils) and to sensor parameters (frequency, polarization, and incidence). This approach requires an important experimental database, acquired from several study sites and representative of possible physical soil conditions. The validity of these relationships for use in operational mode depends on the quality of the database and its representativeness. With current SAR sensors, the cartography in operational mode of the surface moisture of bare soils is carried out on images with one channel (one incidence and one polarization), which leads to the elaboration of experimental relationships between the signal radar and the soil moisture whatever the surface roughness [11, 15, 16]. Using this technology the precision on the prediction of soil surface moisture varies between 3 and 10 % of moisture depending on the incidence angle. Uncertainty analyses carried out with the Green and Ampt infiltration/runoff model showed that this degree of accuracy is adapted to the use of this kind of hydrological models [22].
Another approach for the estimation of soil moisture is to use a Soil-Vegetation-Atmosphere-Transfer model (SVAT). In this case, the SVAT is forced by analyzed or observed meteorological data to estimate mesoscale soil moisture over large areas. Such an approach is used within the SAFRAN-ISBA-MODCOU chain in France, which is composed of a meteorological analysis system (SAFRAN), a SVAT (ISBA) and a hydrological model (MODCOU, [23]). This system is able to simulate the water and energy budget at the surface, the soil moisture and the discharge of the main French rivers. It is run on an operational mode to evaluate the soil moisture at the scale of France. The typical scale of application of the SAFRAN-ISBA-MODCOU model is 8 km × 8 km over all of France. A comparison with satellite data is of great interest to validate the variables simulated by the system.
The objective of the present paper is to test the applicability of experimental relationships established between the C-band radar backscattering coefficient (ERS-2, RADARSAT-1, and ASAR sensors) and the soil moisture from a great experimental database collected between 1995 and 2005 at several study sites. Next, in the soil moisture mapping process, these relationships will be inverted and applied to ERS-2 and ASAR images, acquired in 2006 and 2007 over the Touch catchment basin (located near Toulouse in France) to provide additional key indicators to improve flood forecasting over the Touch catchment basin. The correlation between textural units and soil moisture will also be studied. Moreover, the soil moisture maps estimated from SAR images will be compared with simulations obtained by the ISBA soil-vegetation-atmosphere transfer model. This model, developed by Météo-France models the main surface processes and is currently coupled to atmospheric prediction model. As the soil moisture is prognostic variable of ISBA, it is thus necessary to quantify its quality. Soil moisture in situ data, measured by gravimetry, will be used to validate obtained results. Given that the presence of dense and high vegetation cover prevents C-band radar signal (wavelength ∼ 6 cm) from reaching the ground, the soil moisture mapping from ERS and ASAR sensors is focused on bare soils or zones with little vegetation cover.

2. Description of Databases

2.1. Database 1995-2005

An extensive experimental database collected at seven study sites was used for building relationships between radar backscattering coefficient and soil moisture. This database is composed of SAR images acquired between 1995 and 2005, and in situ soil moisture measurements (bare soils only) carried out jointly with radar acquisitions:
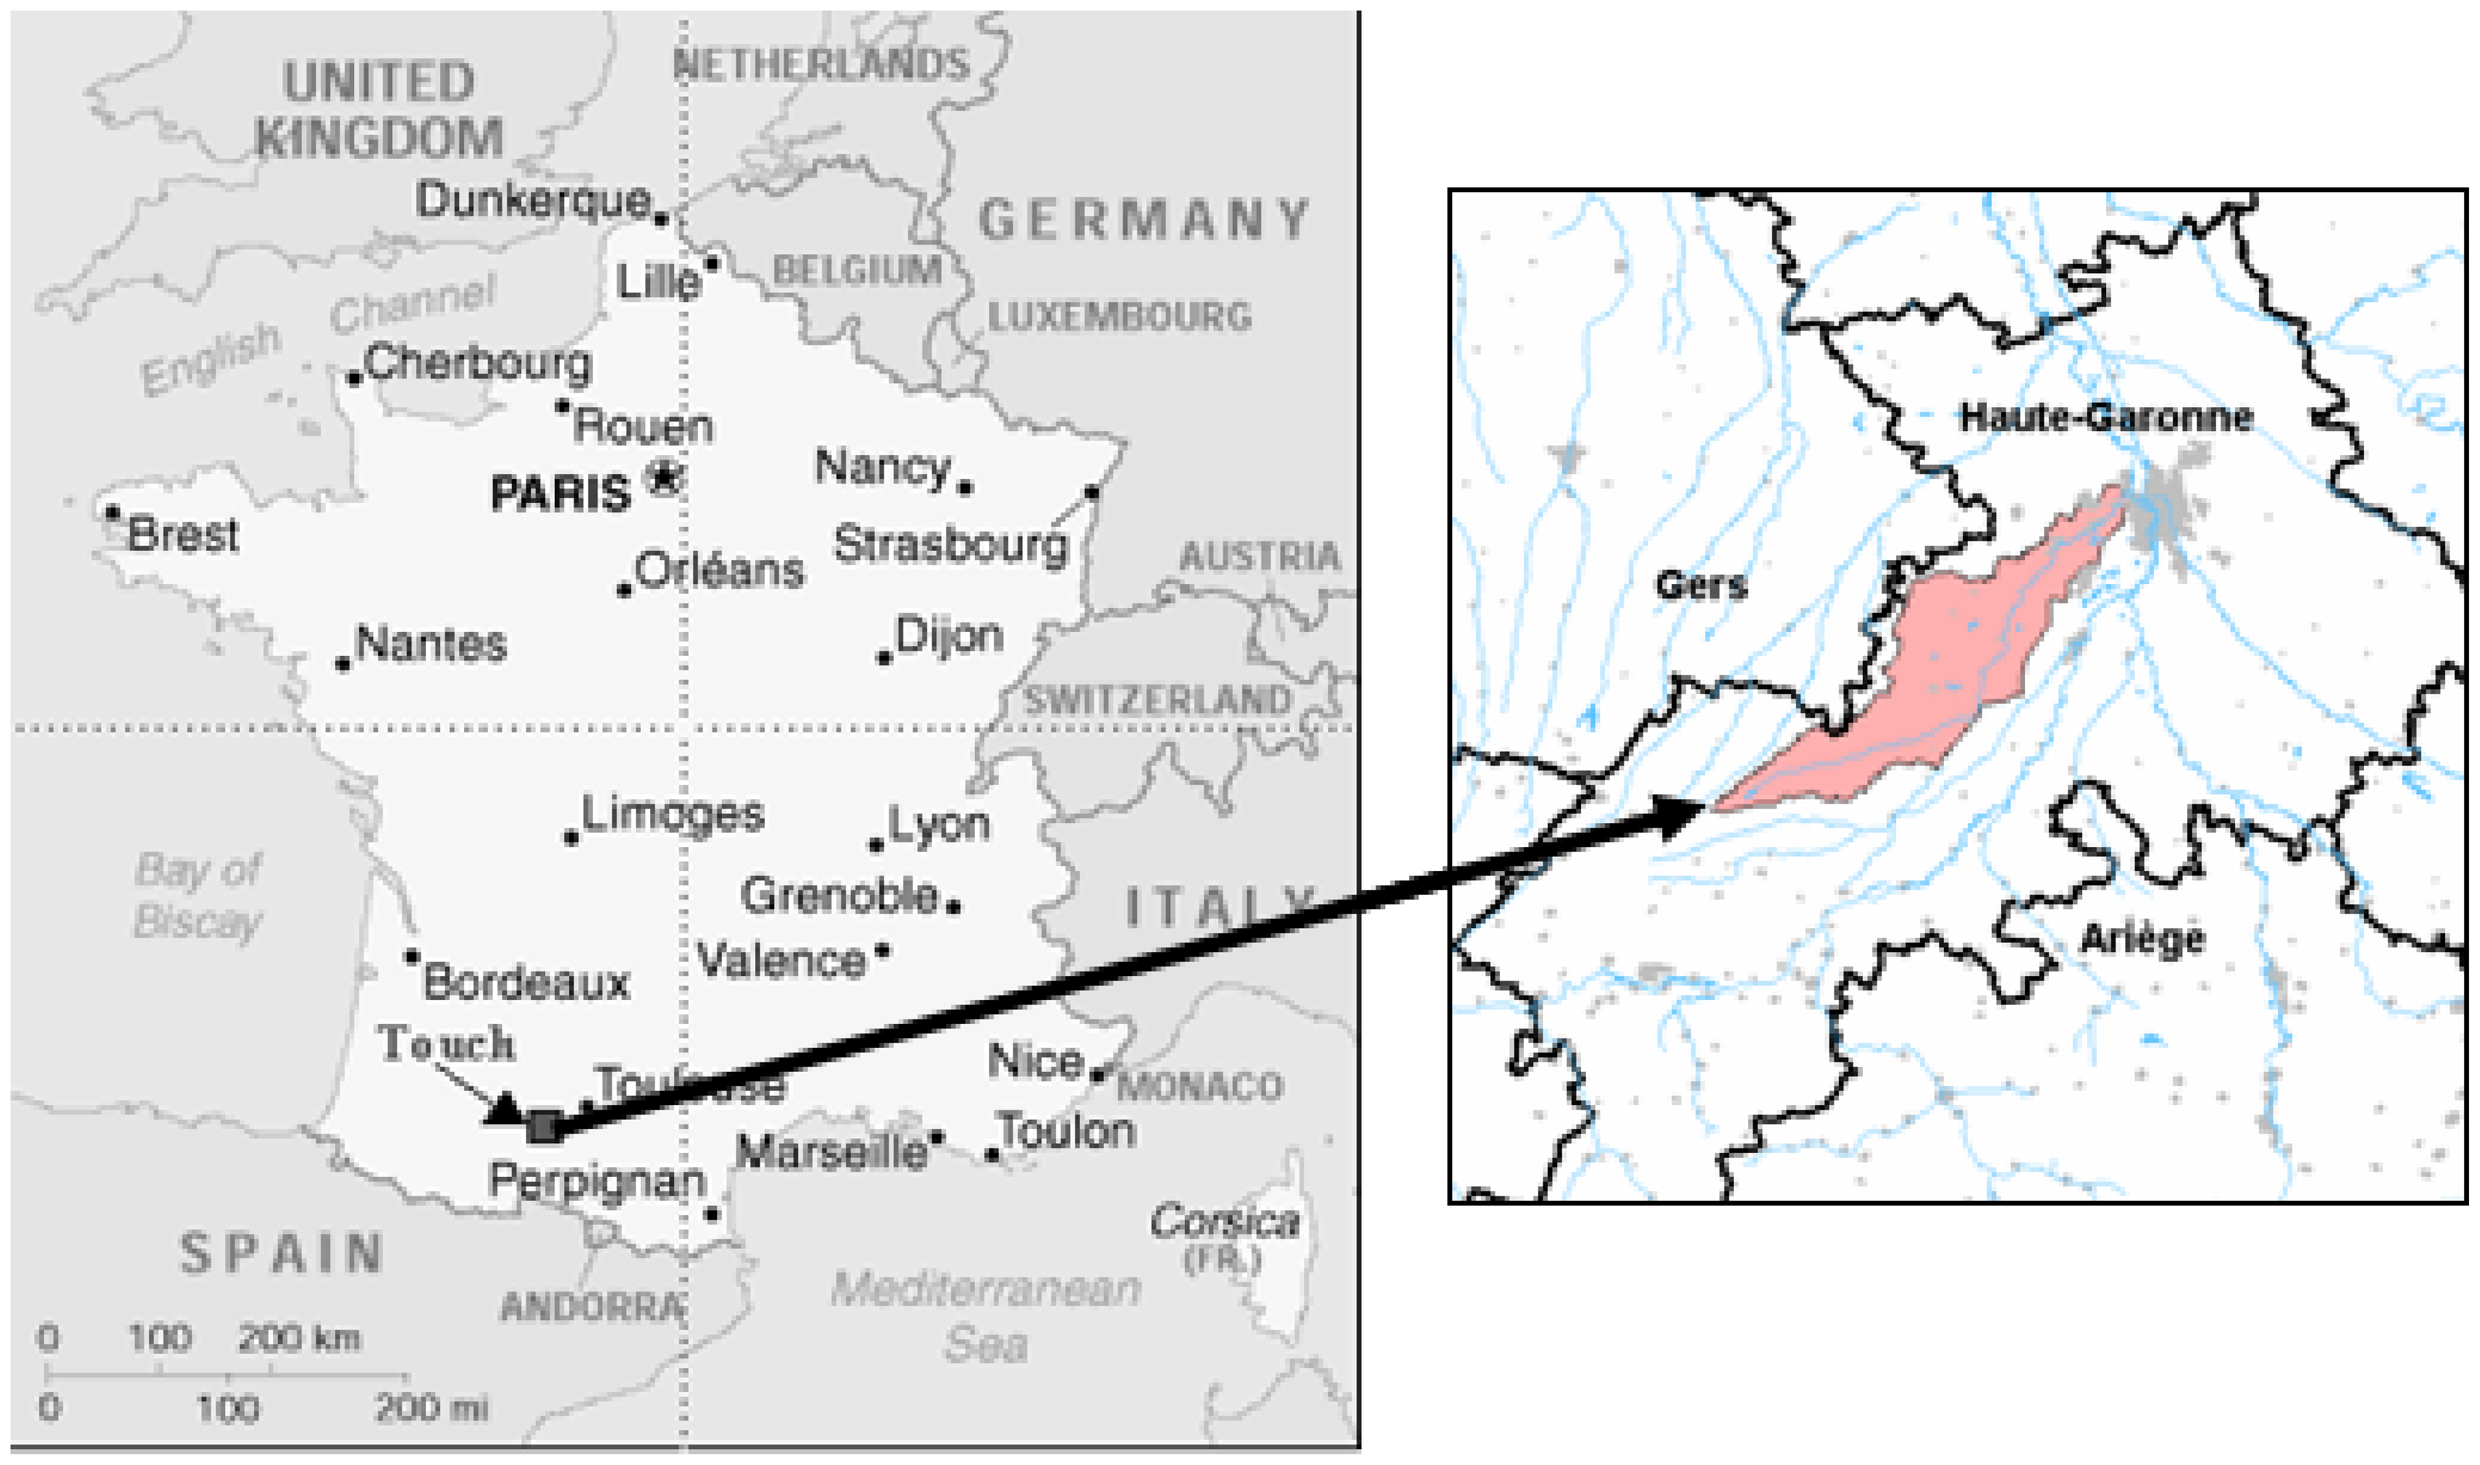
  • Touch site, near Toulouse, France (long. 01°02′ E, lat. 43°27′ N). Soil composition is about 55% silt, 21% clay, and 24% sand. Data were acquired in 2004 and 2005.
  • Villamblain site, near Orléans, France (long. 01°34′ E, lat. 48°00′ N). Soils composed of about 60% silt, 30% clay, and 10% sand. Data were acquired in 2003, 2004, and 2005.
  • Châteauguay site, near Montreal, Canada (long. 73°46′ W, lat. 45°19′ N). Soil composition at both sites is about 42% silt, 36% clay, and 20% sand. Fieldwork was carried out in 1999.
  • Brochets site, near Montreal, Canada (long. 72°54′ W, lat. 45°08′ N). Soil composition at both sites is about 42% silt, 36% clay, and 20% sand. Fieldwork was carried out in 1999.
  • Alpilles site, Rhône valley, France (long. 4°45′ E, lat. 43°47′ N). Soil composition is 54% silt, 40% clay, and 6% sand. Fieldwork was carried out in 1997.
  • Orgeval site, near Paris, France (long. 3°07′ E, lat. 48°51′ N). Soil composition is about 78% silt, 17% clay, and 5% sand. Fieldwork was carried out in 1995 to measure soil moisture and surface roughness.
  • Pays de Caux site, Normandy, France (long. 0°50′ W, lat. 49°47′ N). Soil composition is approximately 67% silt, 13% clay, and 17% sand. Fieldwork was carried out in 1994, 1998, and 1999 to measure soil moisture and surface roughness.
These sites are characterized by agricultural fields intended for growing wheat and corn. The measurements of volumetric soil moisture have been carried out on the first top 10 cm using two techniques: a TDR probe and gravimetry. The soil moisture ranges from 5.4% to 47.3%. SAR images used were acquired by ERS-2, RADARSAT-1 and ASAR, with a great range of incidence angles (20° to 48°), and at HH/HV/VV polarizations.
The database available for this study consists of about 400 doublets of backscattering coefficients and soil moisture. Each point of this database corresponds to the mean radar signal over a reference plot and the corresponding in situ soil moisture. The reference plots were chosen with a low local topography (generally flat).
Soil roughness measurements were also carried out, using a 1 or 2 m long profilometer with a 1 or 2 cm sampling interval (pinmeter or laser). For radar applications, the surface roughness of a given bare soil is defined statistically by two variables, determined from the surface height profiles: the standard deviation of surface height (rms), which specifies the vertical scale of the roughness, and the correlation length (L), representing the horizontal scale. The rms values vary in our database between 0.25 cm and 5.29 cm; the lowest ones correspond mainly to sown fields and the highest ones to ploughed fields. The correlation length ranges from 2 to 20 cm for 95% of measurements. Recent investigations have indicated that roughness variables estimated on the basis of field measurement data and simulations are very sensitive to profile length [e.g. 24-26]. The limited length of conventional profilers (one or two metres long) leads to large uncertainties in the estimated roughness variables. In a theoretical study based on simulated profiles, Oh and Kay [24] demonstrated that in order to measure rms surface height and correlation length with a precision of ±5% of their mean values, the length of the roughness profiles had to be at least 100L and 270L respectively. Measurement precision can be improved by averaging multiple profiles. For a correlation length that ranges from 2 to 20 cm, and for 10 averaged profiles, we deduce that the 2 m profiles provide a precision better than ±5% for rms surface height and between ±5% and ±15% for correlation length. At 1 m profile length, the precision can reach 10% for rms height and 20% for correlation length.

2.2. Database 2006-2007

Study site

Our study site is the Touch catchment basin, located at the south-west of Toulouse in France (latitude: 43°17′ N to 43°37′ N, longitude: 0°48′ E to 01°24′ E; Figure 1). It covers a total area of about 500 km2. The site is composed mainly of agricultural fields intended for growing wheat and corn. It is flat or slightly undulated with altitudes varying between 135 and 377 m. The Touch basin was selected as it is a site representative of the region where several catchments suffer from excessive runoff due to the conjunction of fragile soils and intensive agricultural practices, responsible for many damages. It is now selected as reference basin for several official authorities of flood forecasting and prevention, such as DIREN (Regional Direction of the Environment) and SCHAPI (National Flood Forecasting Agency).

Radar and optical images

Images used in this study were acquired by the ERS-2 and ASAR SARs between 08 March 2006 and 12 March 2007. Fifteen ASAR images and three ERS-2 images were obtained with incidence angles between 18° and 44°, and at HH/VV/VH polarizations (Table 1). Optical images obtained from SPOT and ASTER sensors were also used to allow a reliable mapping of bare soils. Before analyzing the SAR images, the data were radiometrically calibrated, which enables extraction of the backscattering coefficient (σ°) from the signal intensity of each pixel (BestW software, [27]). The radiometric calibration of SAR images allows converting the raw digital numbers (DN) to backscattering coefficients (σ°):
σ ° = DN 2 sin θ K
where θ is the radar incidence angle, and K the calibration constant given in the image header. The backscattering coefficients are then expressed in decibels (dB):
σ ° dB = 10 log 10 ( σ ° )
This calibration makes it possible to carry out multi-temporal analysis of different images (with same incidence and polarization). All SAR and optical images were then georeferenced using topographic maps with a root mean square error of the control points of about 30 m. The registration error of SAR images is taken into account by selecting areas of interest (AOI) within each training site and the border pixels were removed (defined by GPS control points).
Speckle noise, due to the coherent interference of waves reflected from many elementary scatterers, is present on SAR images and makes the pixel-by-pixel interpretation of SAR images extremely difficult. This explains why the estimation of soil characteristics is generally carried out on homogeneous sectors with several pixels or at field scale (which helps reducing speckle). In practice, the mean backscattering coefficients are calculated from calibrated SAR images by averaging the linear σ° values of all pixels within the field (or sub-field). A reduction in speckle and an improvement in the quality of our estimations are highly dependent on the size of the fields [e.g. 28, 29]. Consequently, parcels with a homogeneous surface of 200 pixels or more are often used to study the behaviour of the signal as a function of SSC. In the case of ERS and ASAR sensors, this corresponds to fields of around two hectares or more.

ISBA data

The soil moistures simulated by the ISBA (Interactions between Soil Biosphere and Atmosphere) SVAT [30, 31] were also used. The simulations were compared to the soil moistures estimated from SAR images and measured by gravimetry on March 12, 2007. ISBA is a SVAT designed to run in stand alone mode or in atmospheric models. The version used in the SAFRAN-ISBA-MODCOU is the force restore version of ISBA. The temperature evolution is described using two temperatures (surface temperature and deep soil). Three layers are used to describe the hydrological processes: the surface layer (one centimeter), the root zone layer (∼1.50 m, depending of the vegetation type in the grid), the sub-root zone (usually down to 2 m below the surface). The hydrological processes which influence the liquid water content of the surface layer are precipitation (except the part intercepted by the vegetation) and evaporation from bare ground. In addition, it is relaxed to an equilibrium value which account for the balance between gravity and capillary forces (this value depends on the soil texture). The second layer accounts for the root depth zone. It is in relation with the surface layer via the relaxation term and with the sub-root zone via the gravitational drainage and the diffusion term (capillary versus gravitational drainage). The surface runoff occurs on the saturated part of the ISBA grid, which depends on the root zone wetness. It is calculated using the Variable infiltration capacity scheme [23]. Since the purpose of this study was to depict the state of surface moisture, only the surface level soil moisture was used in this study. For temperature, a force restore approach is used. The soil and vegetation parameters are derived from the ECOCLIMAP database [32] and from textural information (clay and sand fractions).
The surface water and energy budget were calculated by ISBA using the SAFRAN [33, 34] meteorological data as input. SAFRAN used meteorological model outputs and meteorological observations to derive the variables used to force ISBA (near surface air temperature, wind and humidity, precipitation and incoming long wave and short wave radiation). The analysis is produced for climatologically homogeneous regions (approximately 30 km × 30 km), then interpolated on the 8 km × 8 km grid used to run ISBA. The data used in this paper are the data produced on an operational mode by Météo-France and used for soil moisture and drought monitoring.
It is important to underline that in this study the radar soil moisture estimates are obtained exclusively for bare soils or for soils with little vegetation, whereas ISBA simulations are carried out whatever the landuse (bare soils, forest, cultures …). A preliminary study has shown the absence of correlation between the ISBA moisture values and the percentage of bare soil in ISBA grids. Comparisons between radar moisture estimated on only bare soil and ISBA moisture calculated on 8 km × 8 km grids regardless of land use can therefore be carried out.

In situ measurements
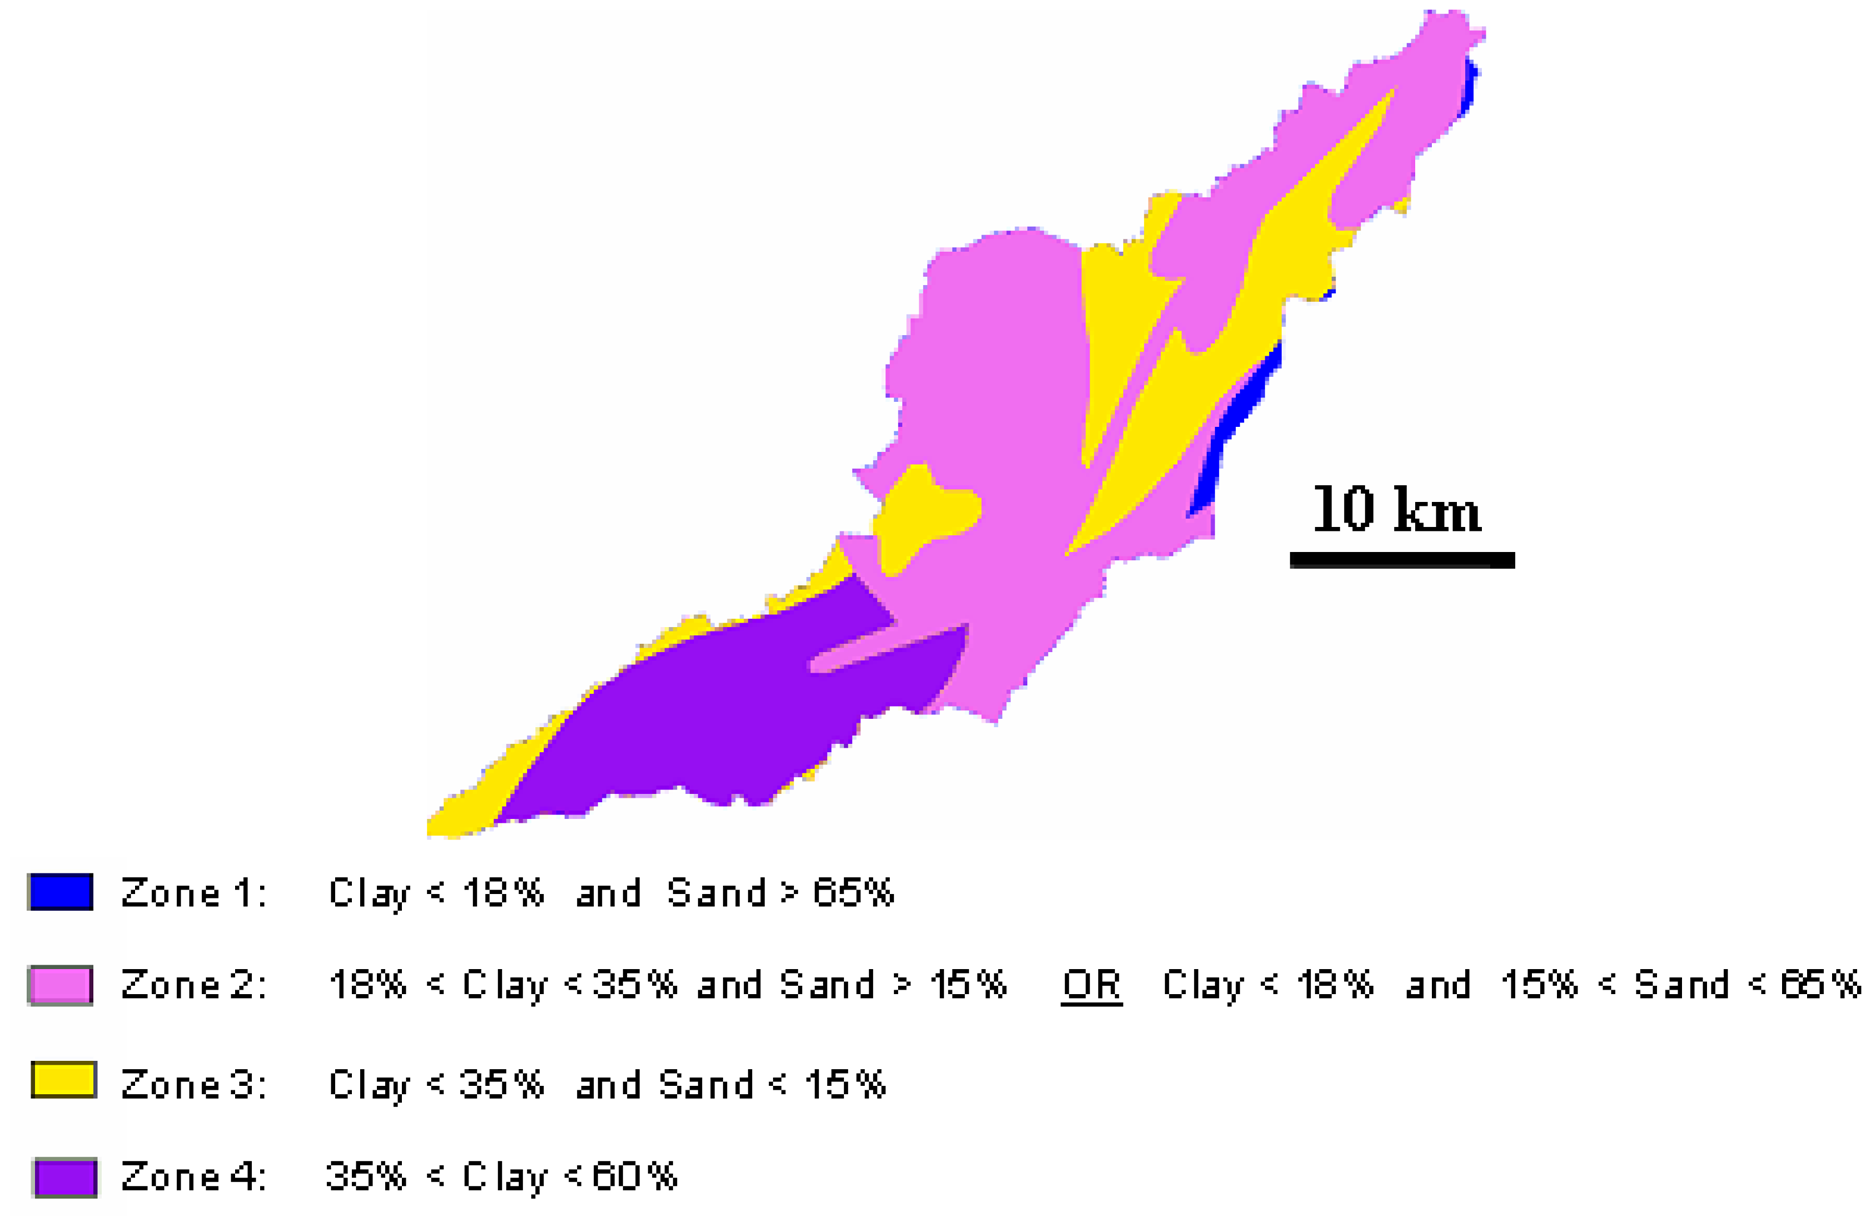
Simultaneously with the acquisition of the SAR image of 12 March 2007, true ground measurements of soil moisture were performed on several test fields. Gravimetric moisture measurements on 33 test fields of bare soil well distributed on the whole of the catchment basin within ± 3 h of the SAR overpass were carried out. Gravimetric measurements were carried out on the upper 0-10cm soil layer because the radar signal penetration depth is only of few centimetres at C-band [e.g. 5, 35]. The soil moisture on a field scale is assumed to be equal to the mean value estimated from 5 samples collected from the top layer of soil. The gravimetric soil moisture content is then transformed into volumetric moisture content by multiplying it by the bulk density of the soil. The volumetric soil moisture measurements range from 19.4% to 32.6% (standard deviation on the field scale about ±3%), and the soil bulk density ranges from 0.9 g/cm3 to 1.6 g/cm3 (standard deviation on the field scale about ±0.15 g/cm3). During the ground campaign of 12 March 2007, the surface roughness of test fields varied from smooth (wheat and corn sown fields) to rough (ploughed fields). No roughness measurement was taken on March 12, 2007.
The lack of in situ moisture data encourages the analysis of radar and ISBA moistures using climatic and pedologic factors. For climatic factors, daily precipitation and temperature data recorded on six meteorological stations installed on the basin (Toulouse Blagnac, Toulouse Francazal, Fabas, La Bastidette, Lherm, and Rieumes) were used. Concerning pedologic factors, soil texture was used as its influence on soil moisture has already been demonstrated in numerous studies [36]. Other pedological factors are usually used to determine moisture, as organic carbon content, density, and depth of root zone [37, 38]. These factors were not considered in this study because they show little variation within the basin.

Textural map

The textural map of the Touch basin, extracted from the Europe map at 1:1000000, has been thus used (Soil Geographical Database of Europe, SGBDE, [39]). This database contains information on soil texture (Figure 2) and it was possible to define four textural units on the Touch basin. The South-western part of the basin is mainly composed of clayey material. In the center of the basin, the majority formation is the clayey-sandy soils. Silty soils are primarily present in the North-East of the catchment.

3. Soil moisture mapping

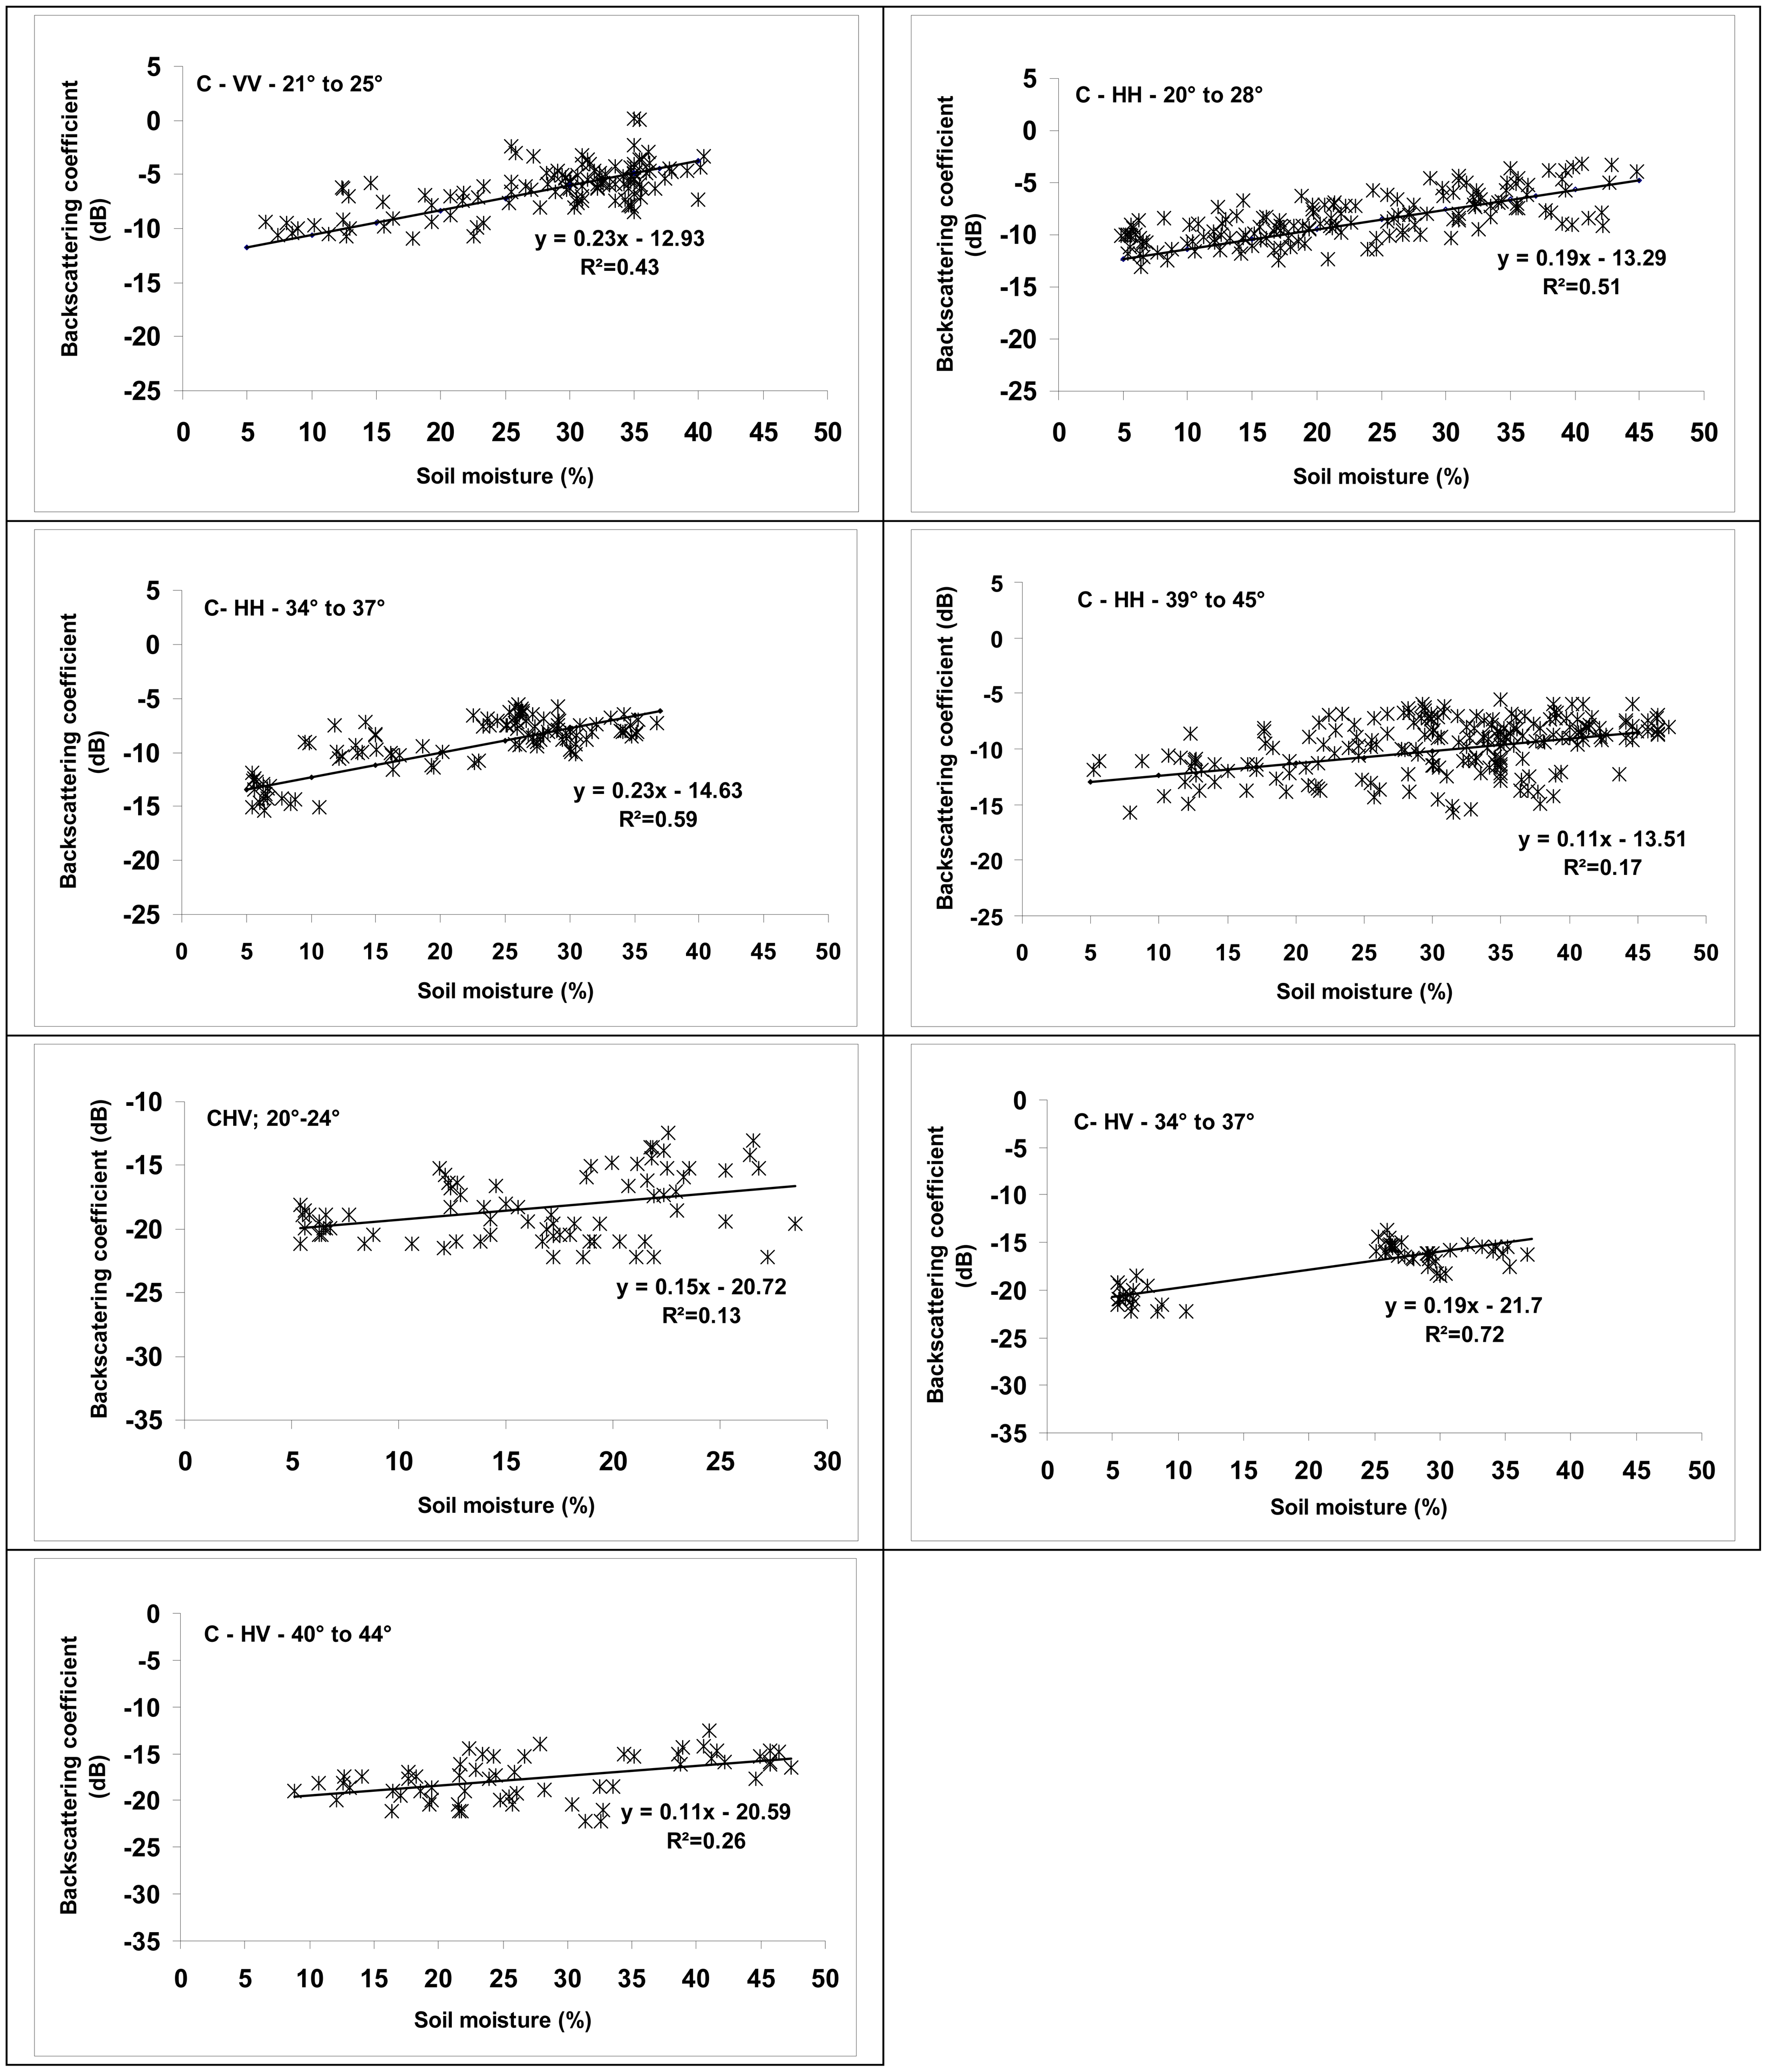
3.1. Relationship between radar signal and soil moisture
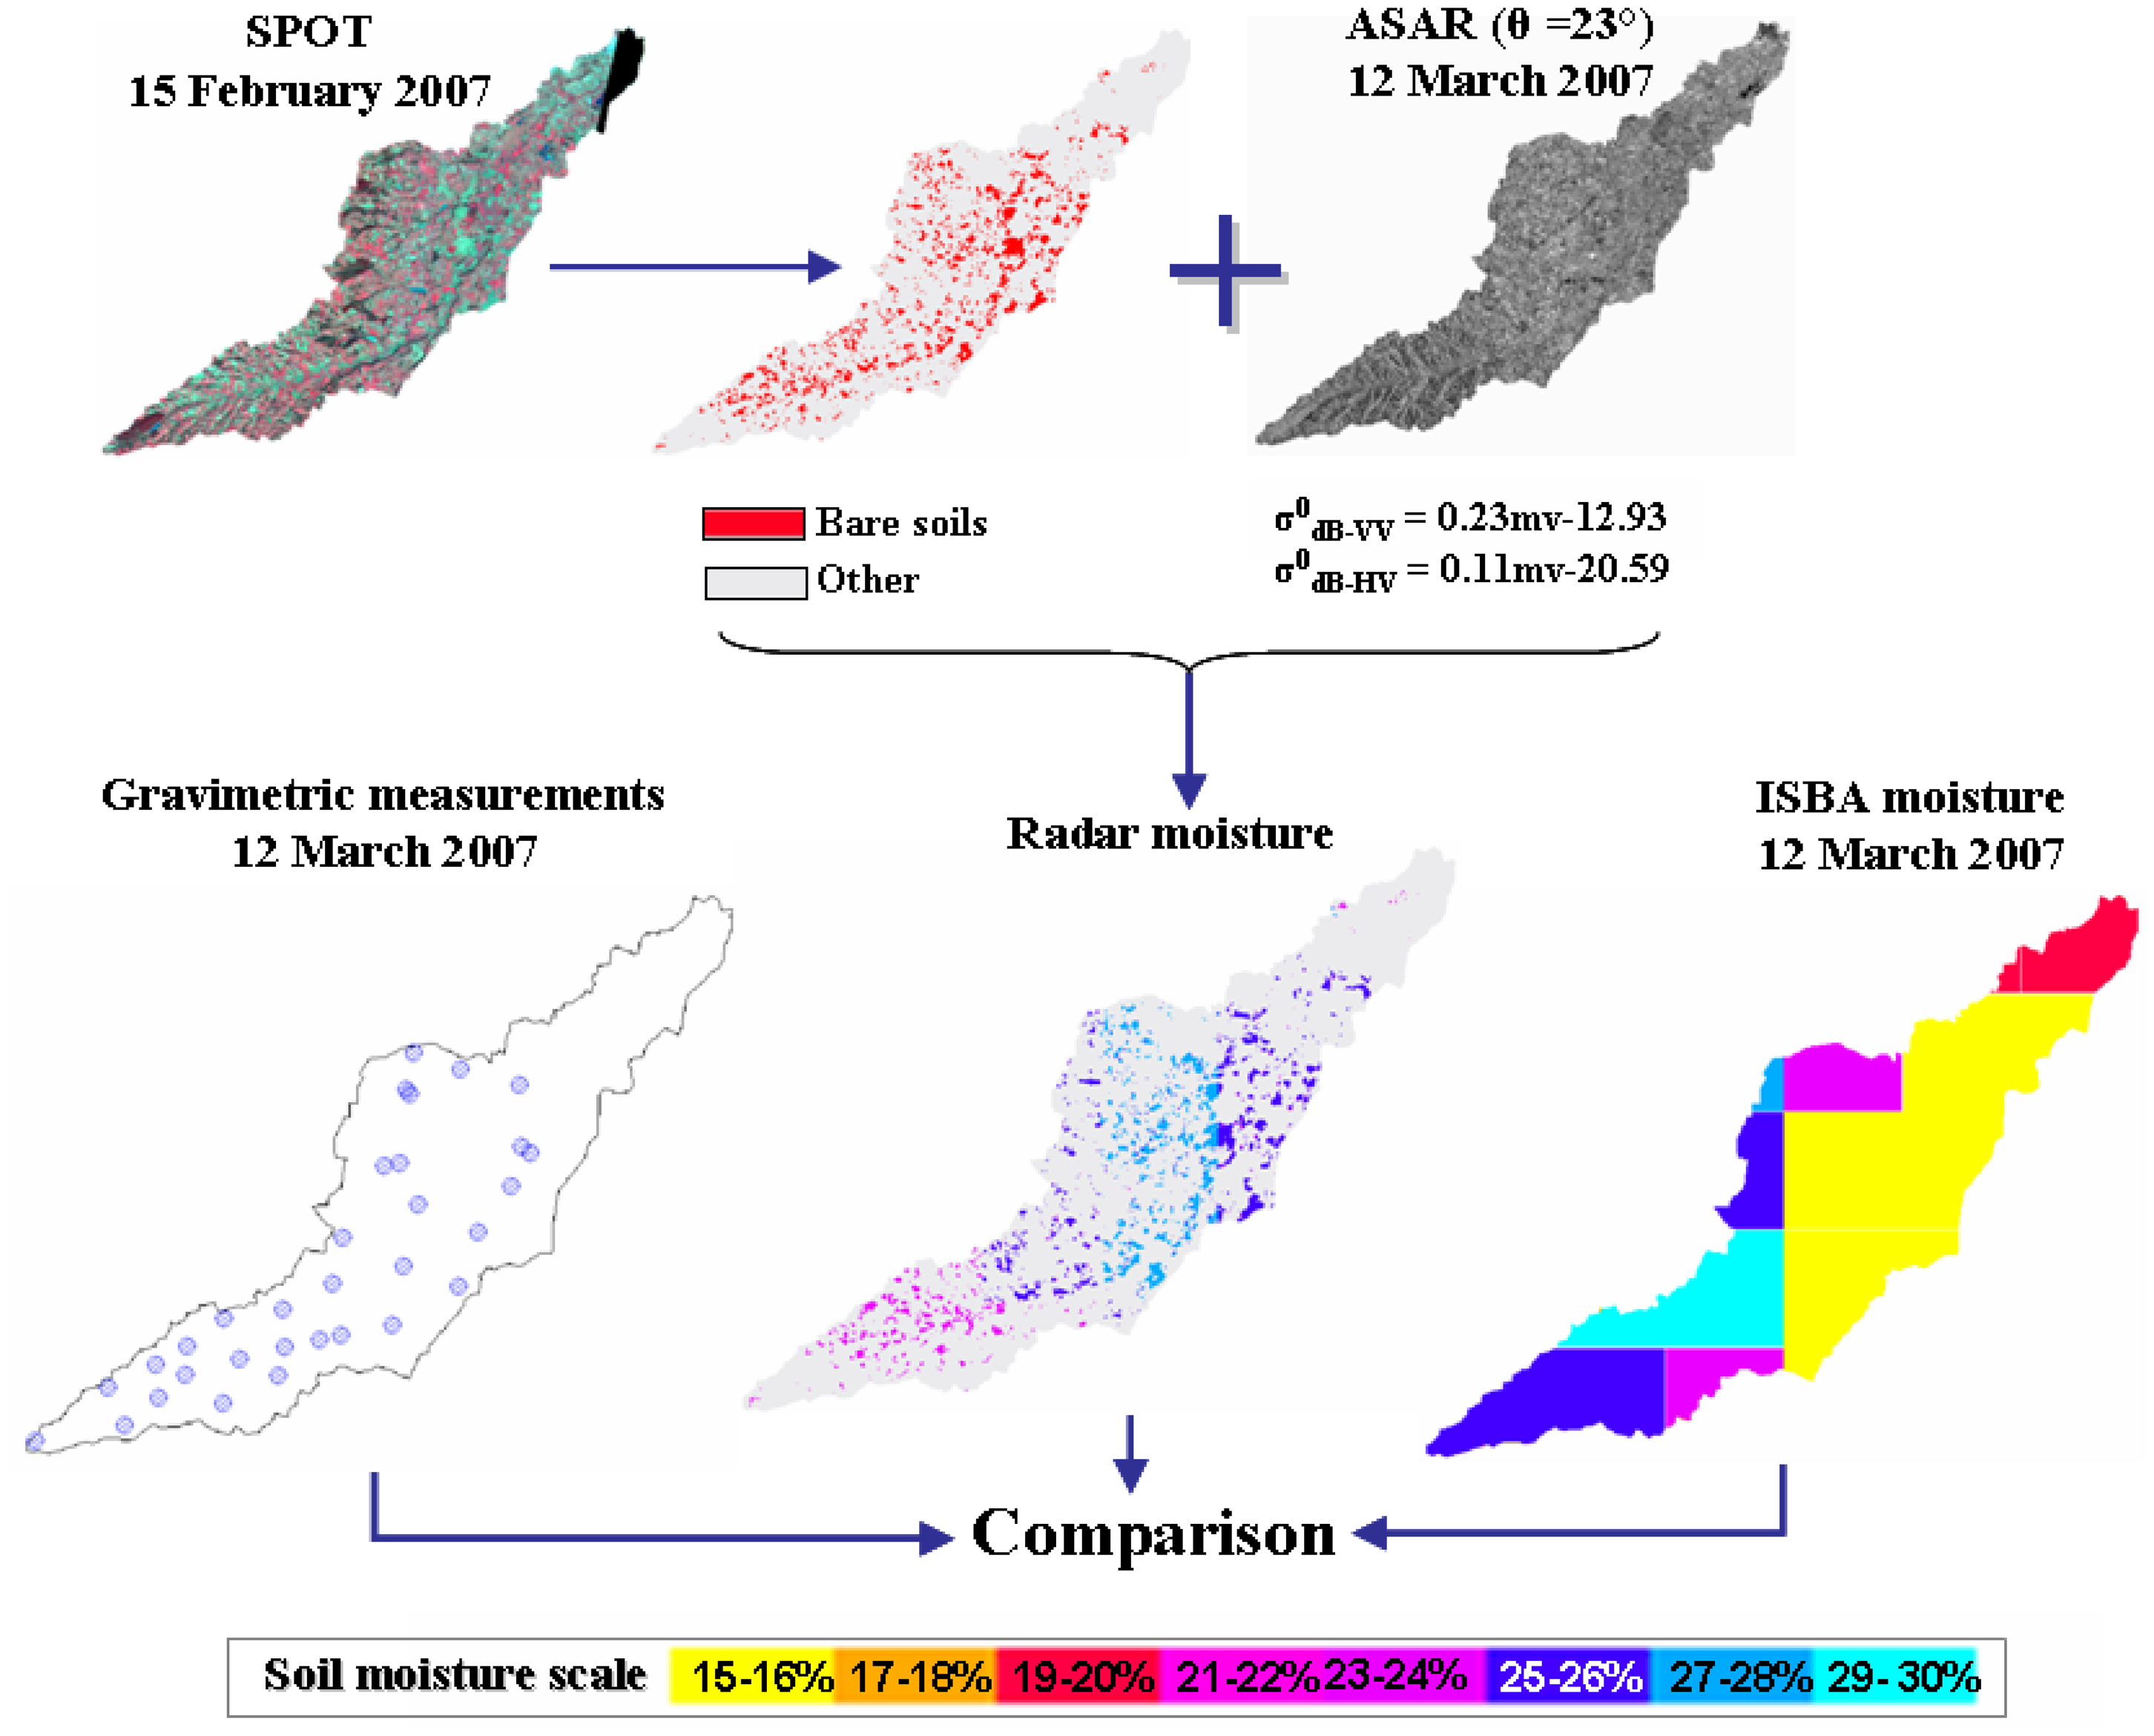
For bare soils, the radar backscattering coefficient in decibels can be written as the sum of two functions : the first one, f (linear), describes the dependence of radar signal on volumetric surface soil moisture, while the second, g (exponential), illustrates the dependence of σ° on surface roughness [13, 15]:
σ d B 0 = a m v + b e krms + c
where k is the wave number (≈1.11 cm-1 for C-band), and rms is the root mean square surface height (characteristic parameter of surface roughness). For a given radar wavelength, the coefficients a, b, and c are observed to be dependent on both radar incidence angle and polarization [15, 16, 17]. In this equation, the correlation length is not taken into account.
To retrieve soil moisture (mv) from a single radar configuration, it is necessary to establish a relationship between the radar backscattering coefficient (σ°) and mv alone, without having any knowledge of the rms surface height. As a first approximation, the radar backscattering coefficient (in dB) may be expressed as follows [15, 40]:
σ d B 0 = a m v + d
This simplified relationship ignores the surface roughness. The coefficient a is dependent on both incidence angle and polarization. The coefficient d is primarily controlled by incidence angle, polarization and surface roughness. However, the coefficients describing the linear relationship between radar signal and soil moisture can be different from one catchment to another and also from one year to the next, and sometimes need to be calibrated. This difference is mainly due to the effects of roughness variation [41].
The coefficients a and d of the equation (4) were calculated using the database of 1995-2005 for 7 radar configurations defined by one polarization and a range of incidence angle (Figure 3): (VV 21°-25°), (HH 20°-28°), (HH 34°-37°), (HH 39°-45°), (HV 20°-24°), (HV 34°-37°), and (HV 40°-44°). These coefficients were established for radar configurations in C-band, as a function of polarization and incidence angle, regardless of soil roughness. They are valid only for the same ranges of soil texture and surface roughness. The large database acquired over the last twelve years from study sites in France and Canada shows that the sensitivity of the radar signal to soil moisture is important for low and medium incidence angles (≤37°). The sensitivity of radar signal to soil moisture is slightly different with polarization (for low incidences, 0.23 dB/% in VV compared to 0.19dB/% in HH and 0.15 dB/% in HV). It is of the same order of magnitude for incidences between 20° and 37° (between 0.19 dB/% for HH20°-28° and 0.23 dB/% for HH 34°-37°) and seems to decrease for incidences greater than 39° (0.11 dB/%). These results therefore show that moisture mapping is optimal at low and medium incidences (≤37°).
These results are comparable with the observed sensitivities by various studies [11, 16, 17, 42]. Next, the inversion procedure was applied to the database of 2006-2007 for the estimation of soil moisture. The validity of this procedure was verified by comparing the inversion output with experimental data of soil moisture.

3.2. Methodology

Based on single SAR images (one polarization and one incidence), a simple procedure was used for mapping the surface soil moisture over bare soils [equation (4)]. The mapping of soil moisture was carried out on the Touch catchment using SAR data acquired in 2006 and 2007. For each SAR image, the relationship σ°dB(mv) corresponding to the same radar configuration (incidence and polarization) was used (equation (4), Figure 3). All images were used, even those which correspond to low sensitivities of radar signal to soil moisture (18 March 2006 – IS7), except the VV-33° and VV-44° configurations because the relationships between σ° and mv could not be established for lack of data. Three soil moisture mapping scales estimates were carried out: an estimate for each ISBA cell (8 km × 8 km), an estimate for each textural unit, and an average estimate on the basin. For each SAR image, the bare soils map used corresponds to the one obtaining from the nearest optical image (SPOT and ASTER). The surface of bare soil covered between 8.7% (30 March 2006) and 24.1% (08 to 18 March 2006) of the basin's total area (cf. Table 1).
For mapping soil moisture on the ISBA grid (8 km × 8 km), the basin was divided into contiguous windows before calculating the mean backscattering coefficient on the whole of bare soil pixels of each cell. For the mapping according to textural units, the mean radar signal is calculated for each textural unit (Figure 2). The estimation of mean soil moisture on the scale of catchment basin uses the mean backscattering coefficient of all bare soils pixels present on the basin. Finally, soil moisture estimates are obtained by inverting the relationship between radar signal and the soil moisture [equation (4)]. The gravimetric soil moisture on ISBA grid scale is assumed to be equal to the mean value of all gravimetric measurements carried out in each grid. On the scale of catchment basin, the gravimetric soil moisture is obtained in averaging all in situ measurements.
The inversion performance of radar signal for retrieving soil moisture is evaluated to show the robustness of the presented technique. The ground truth measurements of soil moisture carried out the March 12, 2007 allow comparing effectively estimated soil moisture by SAR image and observed soil moisture. As suggested by Willmott [43], three statistical indexes were used:
Mean Absolute Error:
MAE = 1 N i = 1 N | P i O i |
Root Mean Square Error:
RMSE = 1 N i = 1 N ( P i O i ) 2
Index of agreement:
d = 1 [ i = 1 N ( P i O i ) 2 i = 1 N ( | P i 1 N i = 1 N O i | + | O i 1 N i = 1 N O i | ) 2 ] , 0 d 1
where P is the field or simulated variable, O the estimated variable, and N the data number. MAE and RMSE are expressed in %, while d is dimensionless.

3.3. Results and discussion

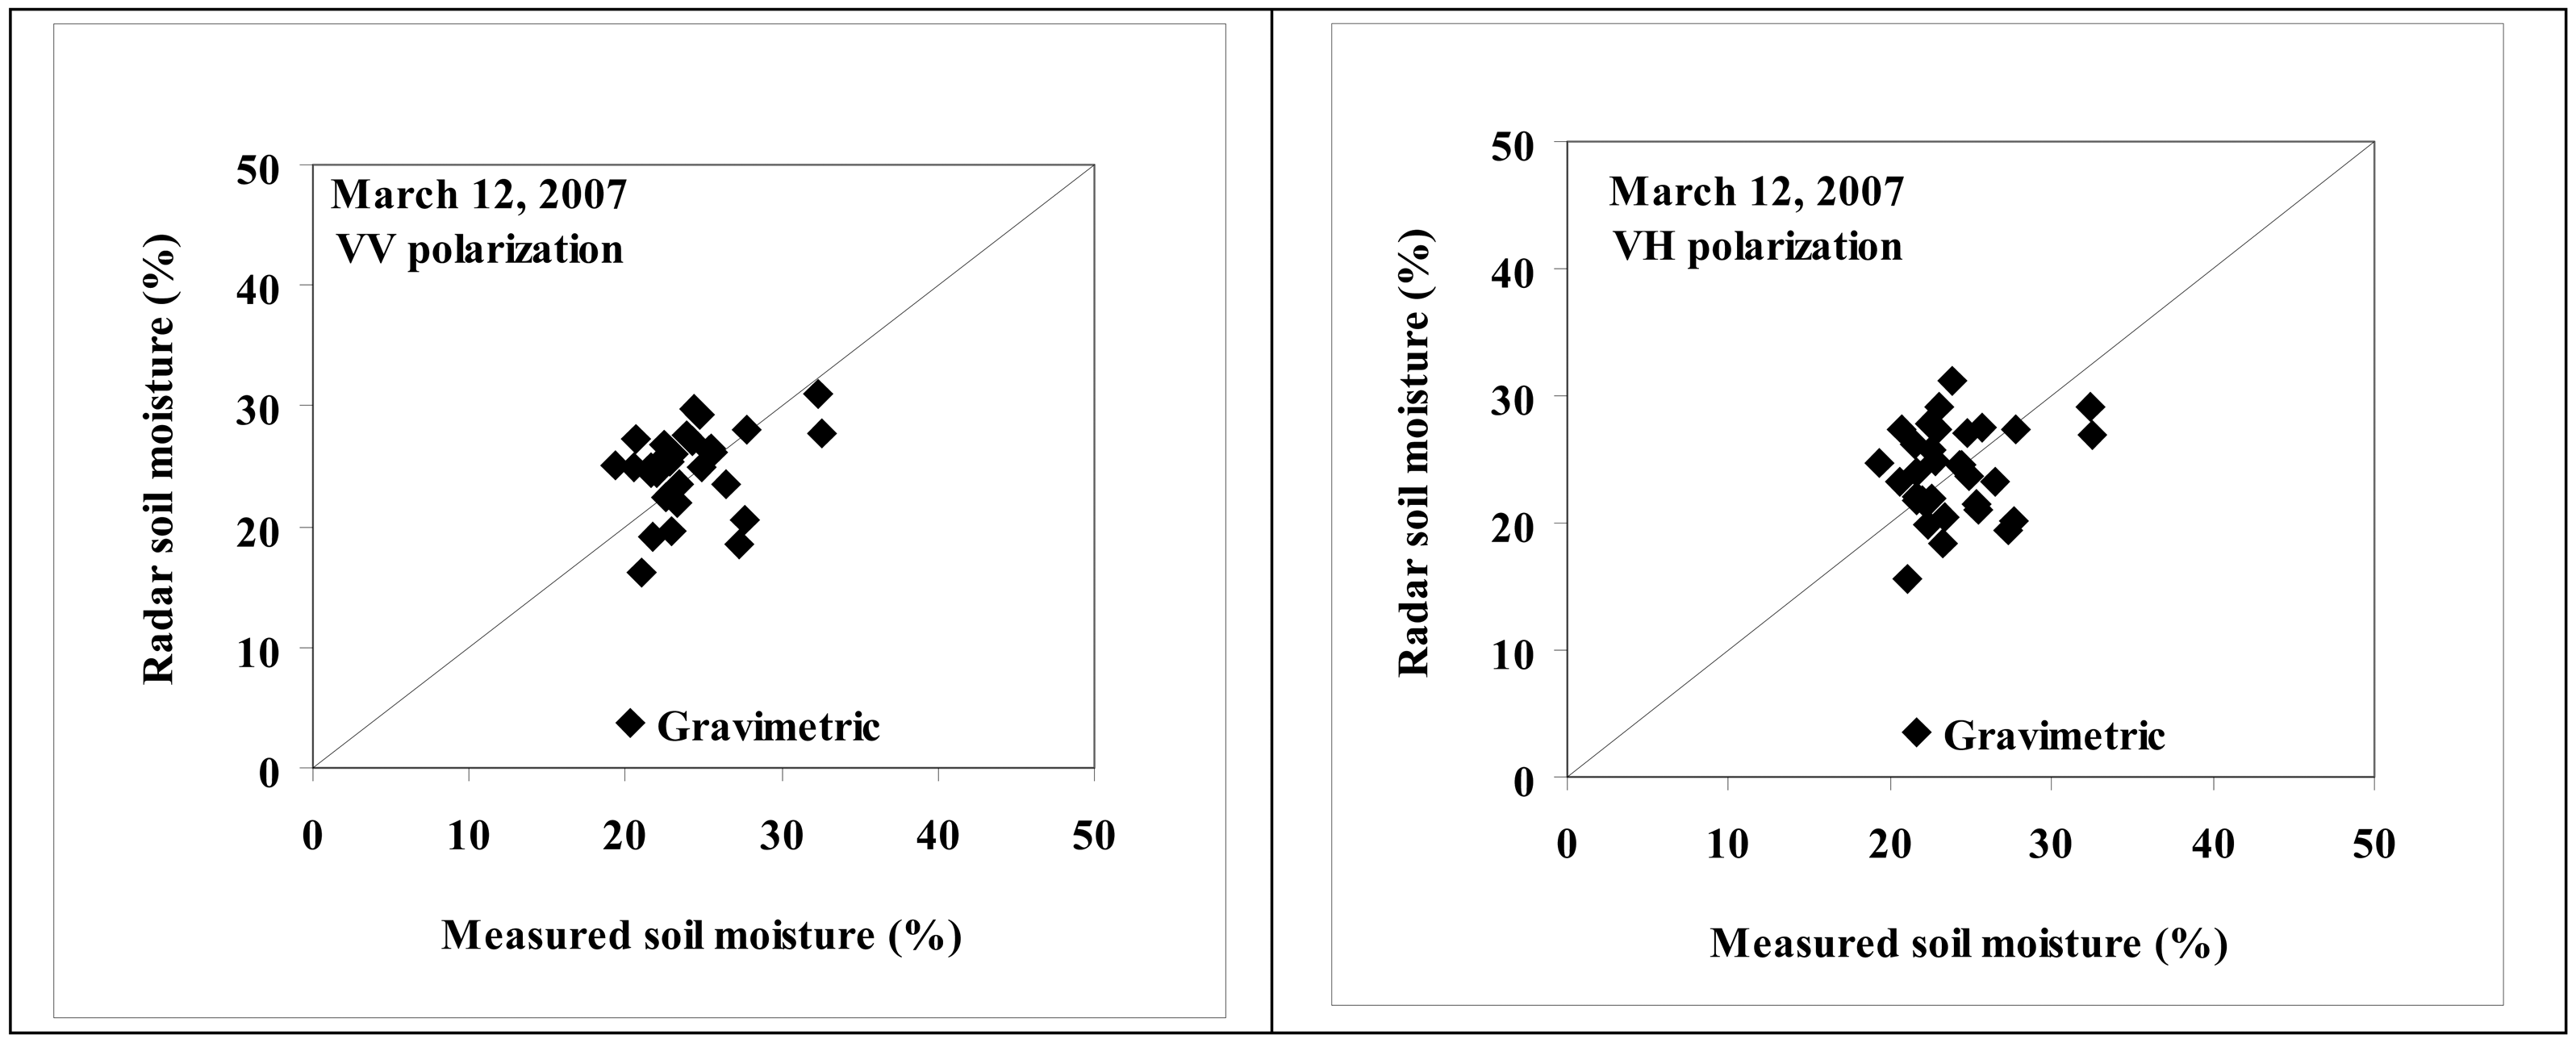
Comparison between radar estimates and gravimetric data

The comparison between soil moistures estimated from SAR images of March 12, 2007 and gravimetric moistures shows a good agreement between estimated and measured soil moistures, with a bias about 2% and a RMSE of the order of 3% (Figure 4, Table 2). VV and VH polarizations give similar performances. According to the radiometric accuracy of ASAR and ERS sensors, typically of ±1dB, the accuracy on the soil moisture estimation will be about ±5% (for a sensitivity of radar signal to soil moisture of 0.20 dB/%). This value is consistent with results presented in Table 2. The relationships between radar signal and soil moisture are then robust and can be used in the mapping process of soil moisture.
Figure 5 shows the procedure applied for soil moisture mapping on the SAR image acquired the 12 March 2007 (VV polarization; incidence angle ∼ 23°). The map of bare soils was recognized by SPOT 5 image acquired the 15 February 2007. The soil moisture estimated was next compared to in situ soil moisture measurements.

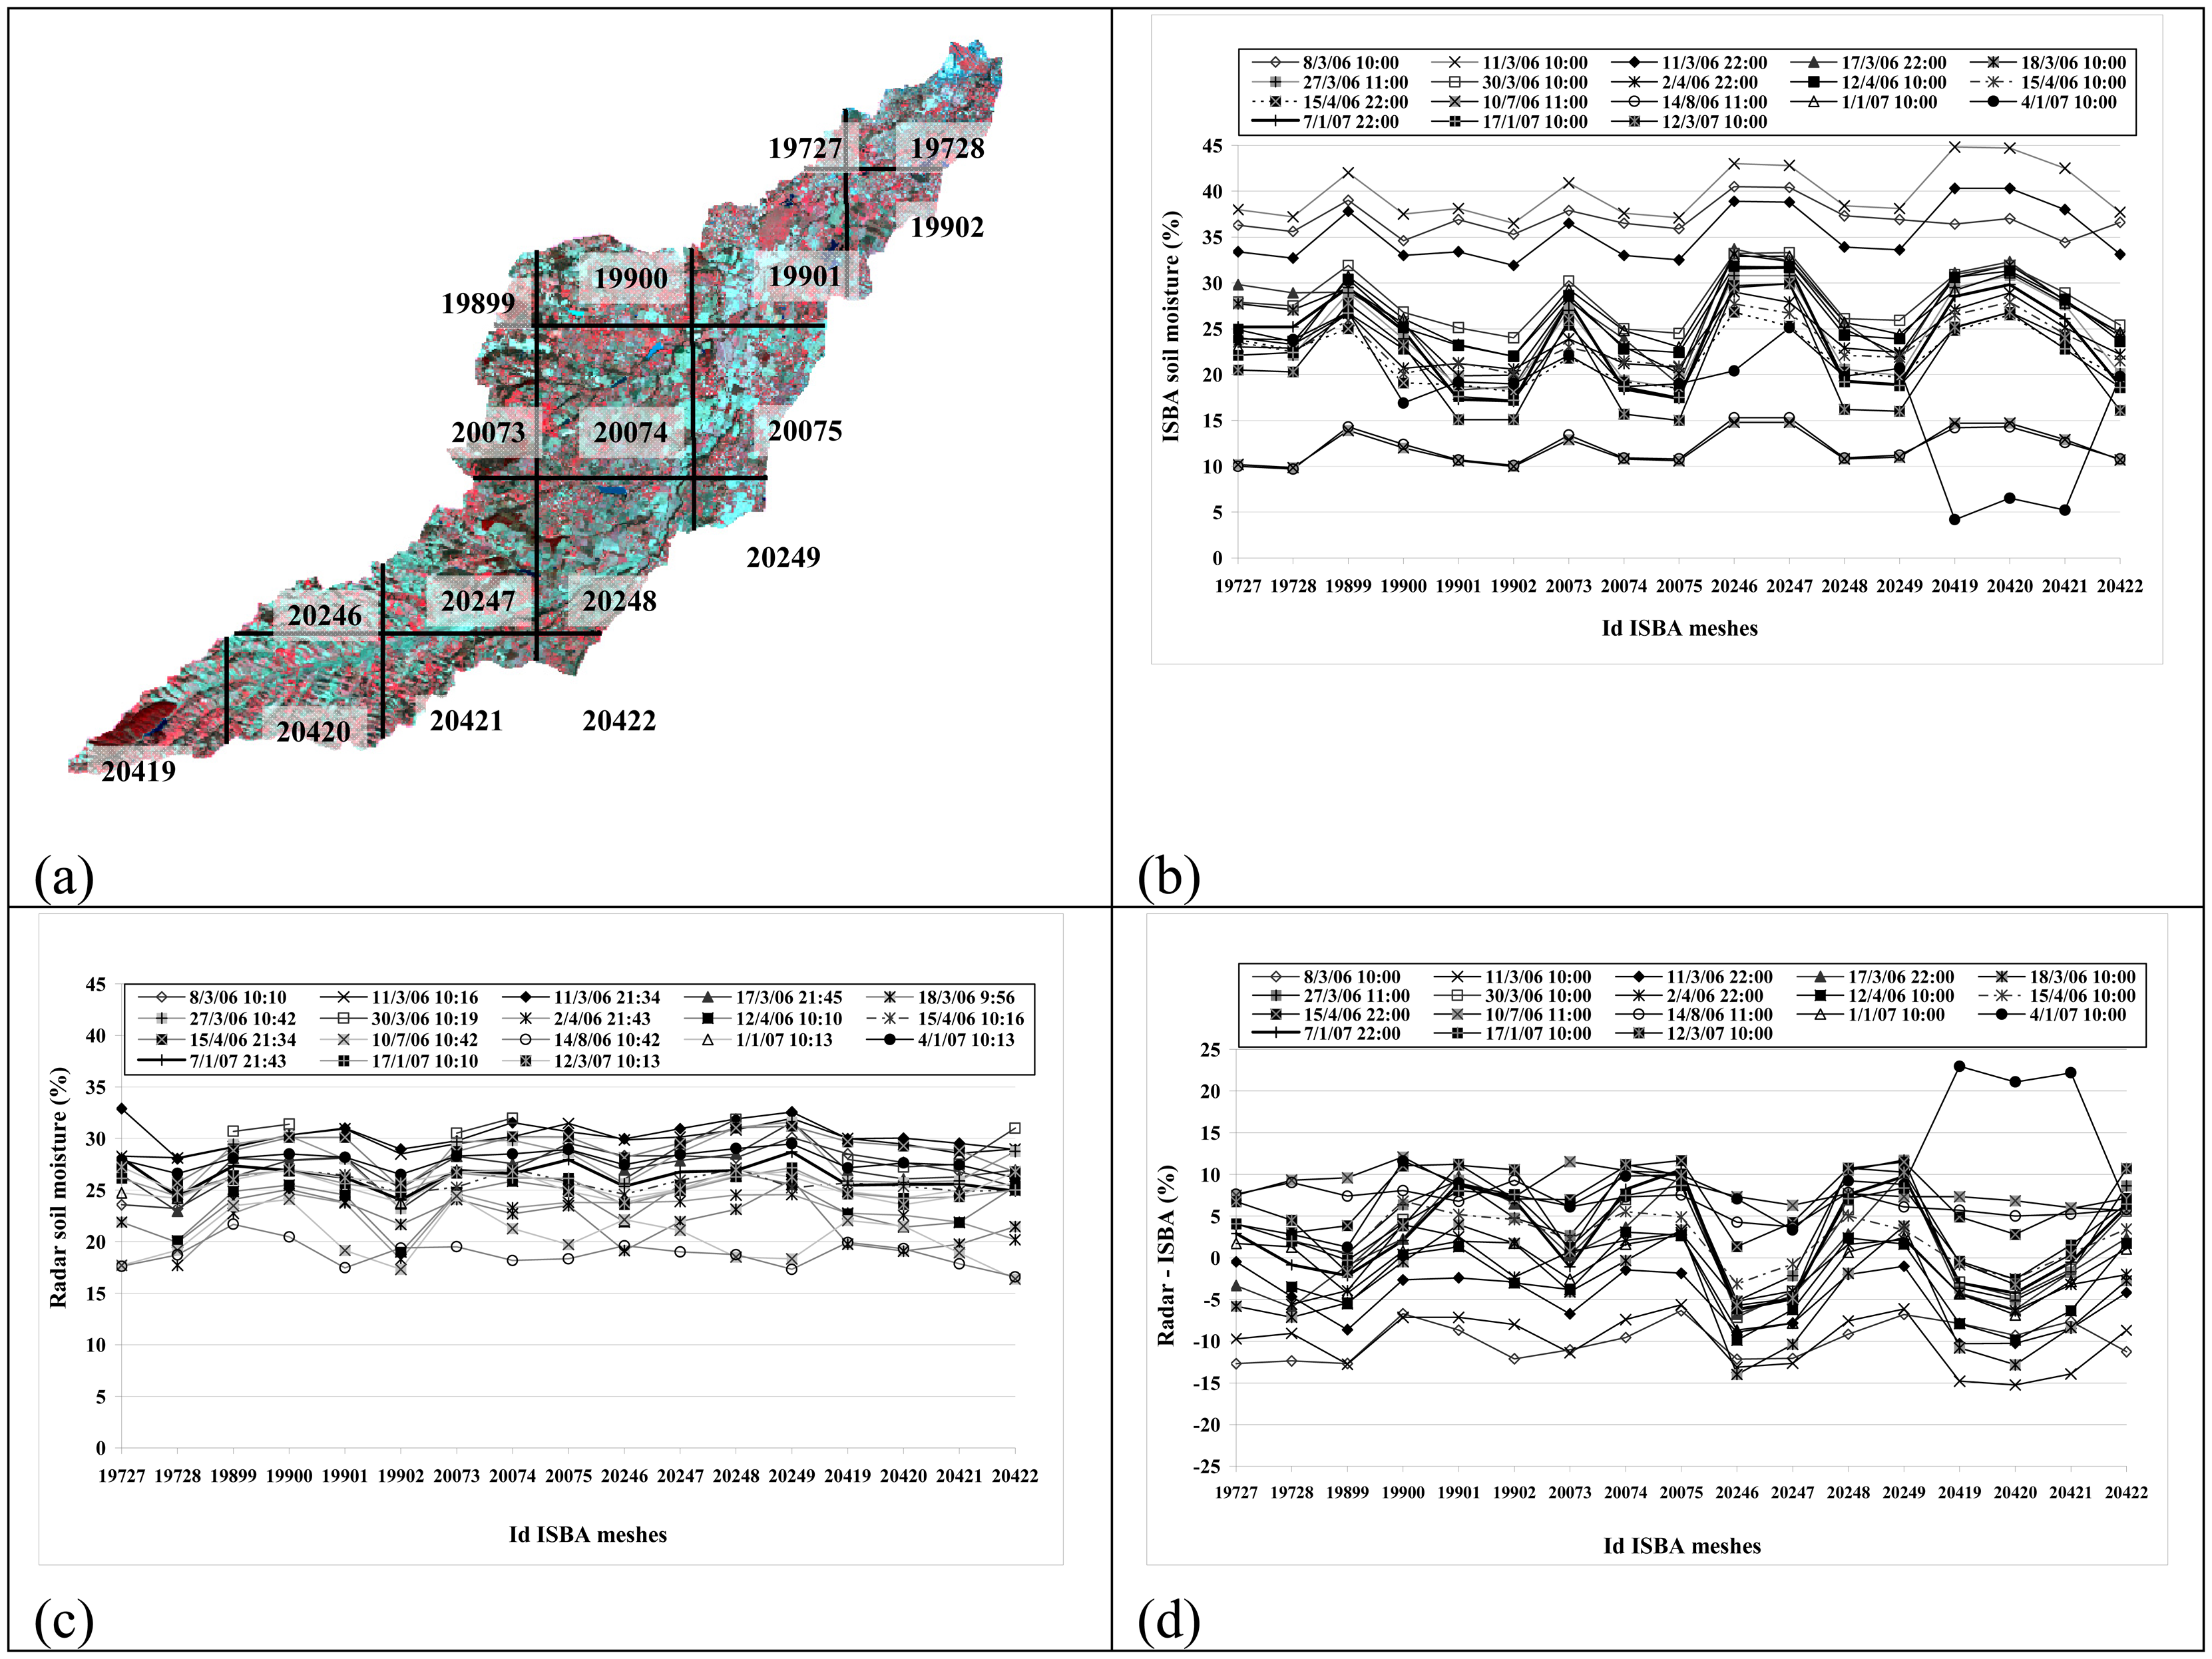
Analysis of ISBA simulations

ISBA moisture values were analyzed spatially according to the ISBA grid (Figures 6a and 6b). For very wet soil conditions (approximately 35%), the soil moistures simulated by ISBA show a maximum variation between ISBA cells of about 8%. For moistures about 25%, the ISBA moistures vary strongly between grids to reach 15%. For low moistures (approximately 15%), the maximum variation between grids is about 5% except for January 04, 2007 where a strong difference between some grids is observed (about 23%). Indeed, for January 04, 2007, ISBA simulates curiously low moistures on grids 20419, 20420 and 20421 (moistures 5% approximately whereas the other grids are about 20%). These comparisons are made at radar acquisition time (T_radar). Only ISBA moistures obtained by the average of ISBA simulations over all the day of January 04 showed moisture values of the same order for all grids. The three grids having an atypical behavior (20419 to 20421) are located in the SW part of the catchment basin.
The precipitations measured in the basin by the six meteorological stations show that it rained as much in December on the various stations. Indeed, the total amount of rainfall over December varies from 26 to 37 mm according to station. The nearest station to the three grids (20419 to 20421), located at the SW of the basin (Fabas station), had recorded a total amount of rainfall over December about 35 mm, while the station located at the centre of the basin (Rieumes station) indicated approximately 37 mm. The analysis of precipitations over the period January 01-04, 2007 shows a total rainfall which varied between 04 and 11 mm, according to stations, with a total rainfall of 7 mm on the Fabas station (situated to the SW of basin). Moreover, according to meteorological stations and Safran previsions, there no was rain on January 04, 2007 in the basin before the acquisition time of the radar image (10 h). In conclusion, the precipitations data measured on the stations do not explain the atypical behavior of ISBA model on January 04, 2007 on the 3 grids (20419 to 20421). The analysis of ISBA input parameters for January 04, 2007 at 10 h (T_radar) shows that the soil was frozen. Freezing was much more marked on the three grids 20419 to 20421 than on the other grids because they are in another meteorological zone. By adding the frozen bulk soil water content, the total soil water content in the superficial reservoir becomes about 35% on the three grids 20419 to 20421. With the use of the total soil water content instead of the liquid soil water content only, the difference between radar and ISBA moistures becomes lower than 5%.
Figure 6b shows also that moistures simulated by ISBA are distributed according to two groups. Indeed, cells located at the North-East of the basin correspond to ISBA moistures lower than those of other cells. Moreover, moistures of each group are similar for a given date (variation inter group inferior to 5%). The comparison between ISBA simulations and textural map (Figure 2) shows that ISBA moistures are correlated with the soils texture, due to the fact that infiltration and runoff processes are driven in ISBA by the texture characteristics of the soil.

Comparison between ISBA and radar moistures

The radar moisture estimation was aggregated to produce moisture estimation for each ISBA cell. It shows that the maximum variations between grids are of 7% (18 March 2006, Figure 6c) for the radar, while they are around 15% with the ISBA model. For radar acquisitions dates (March 2006 to March 2007), the moisture estimated by radar on ISBA cells shows values ranging from 17% to 33%, whereas ISBA simulations varied between 10 and 45%. The comparison carried out between radar and ISBA soil moistures in using the same ISBA cells show that the difference between radar and ISBA moistures vary from -15% to +12%, except for January 04, 2007 where the difference reaches 23% (Figure 6d). Results show also that ISBA simulations averaged on the basin are well comparables to radar estimates with a mean difference lower than 5% for 12 dates among the 18 examined dates. For the six remaining dates, differences between 5% and 10% are observed (Figure 7).

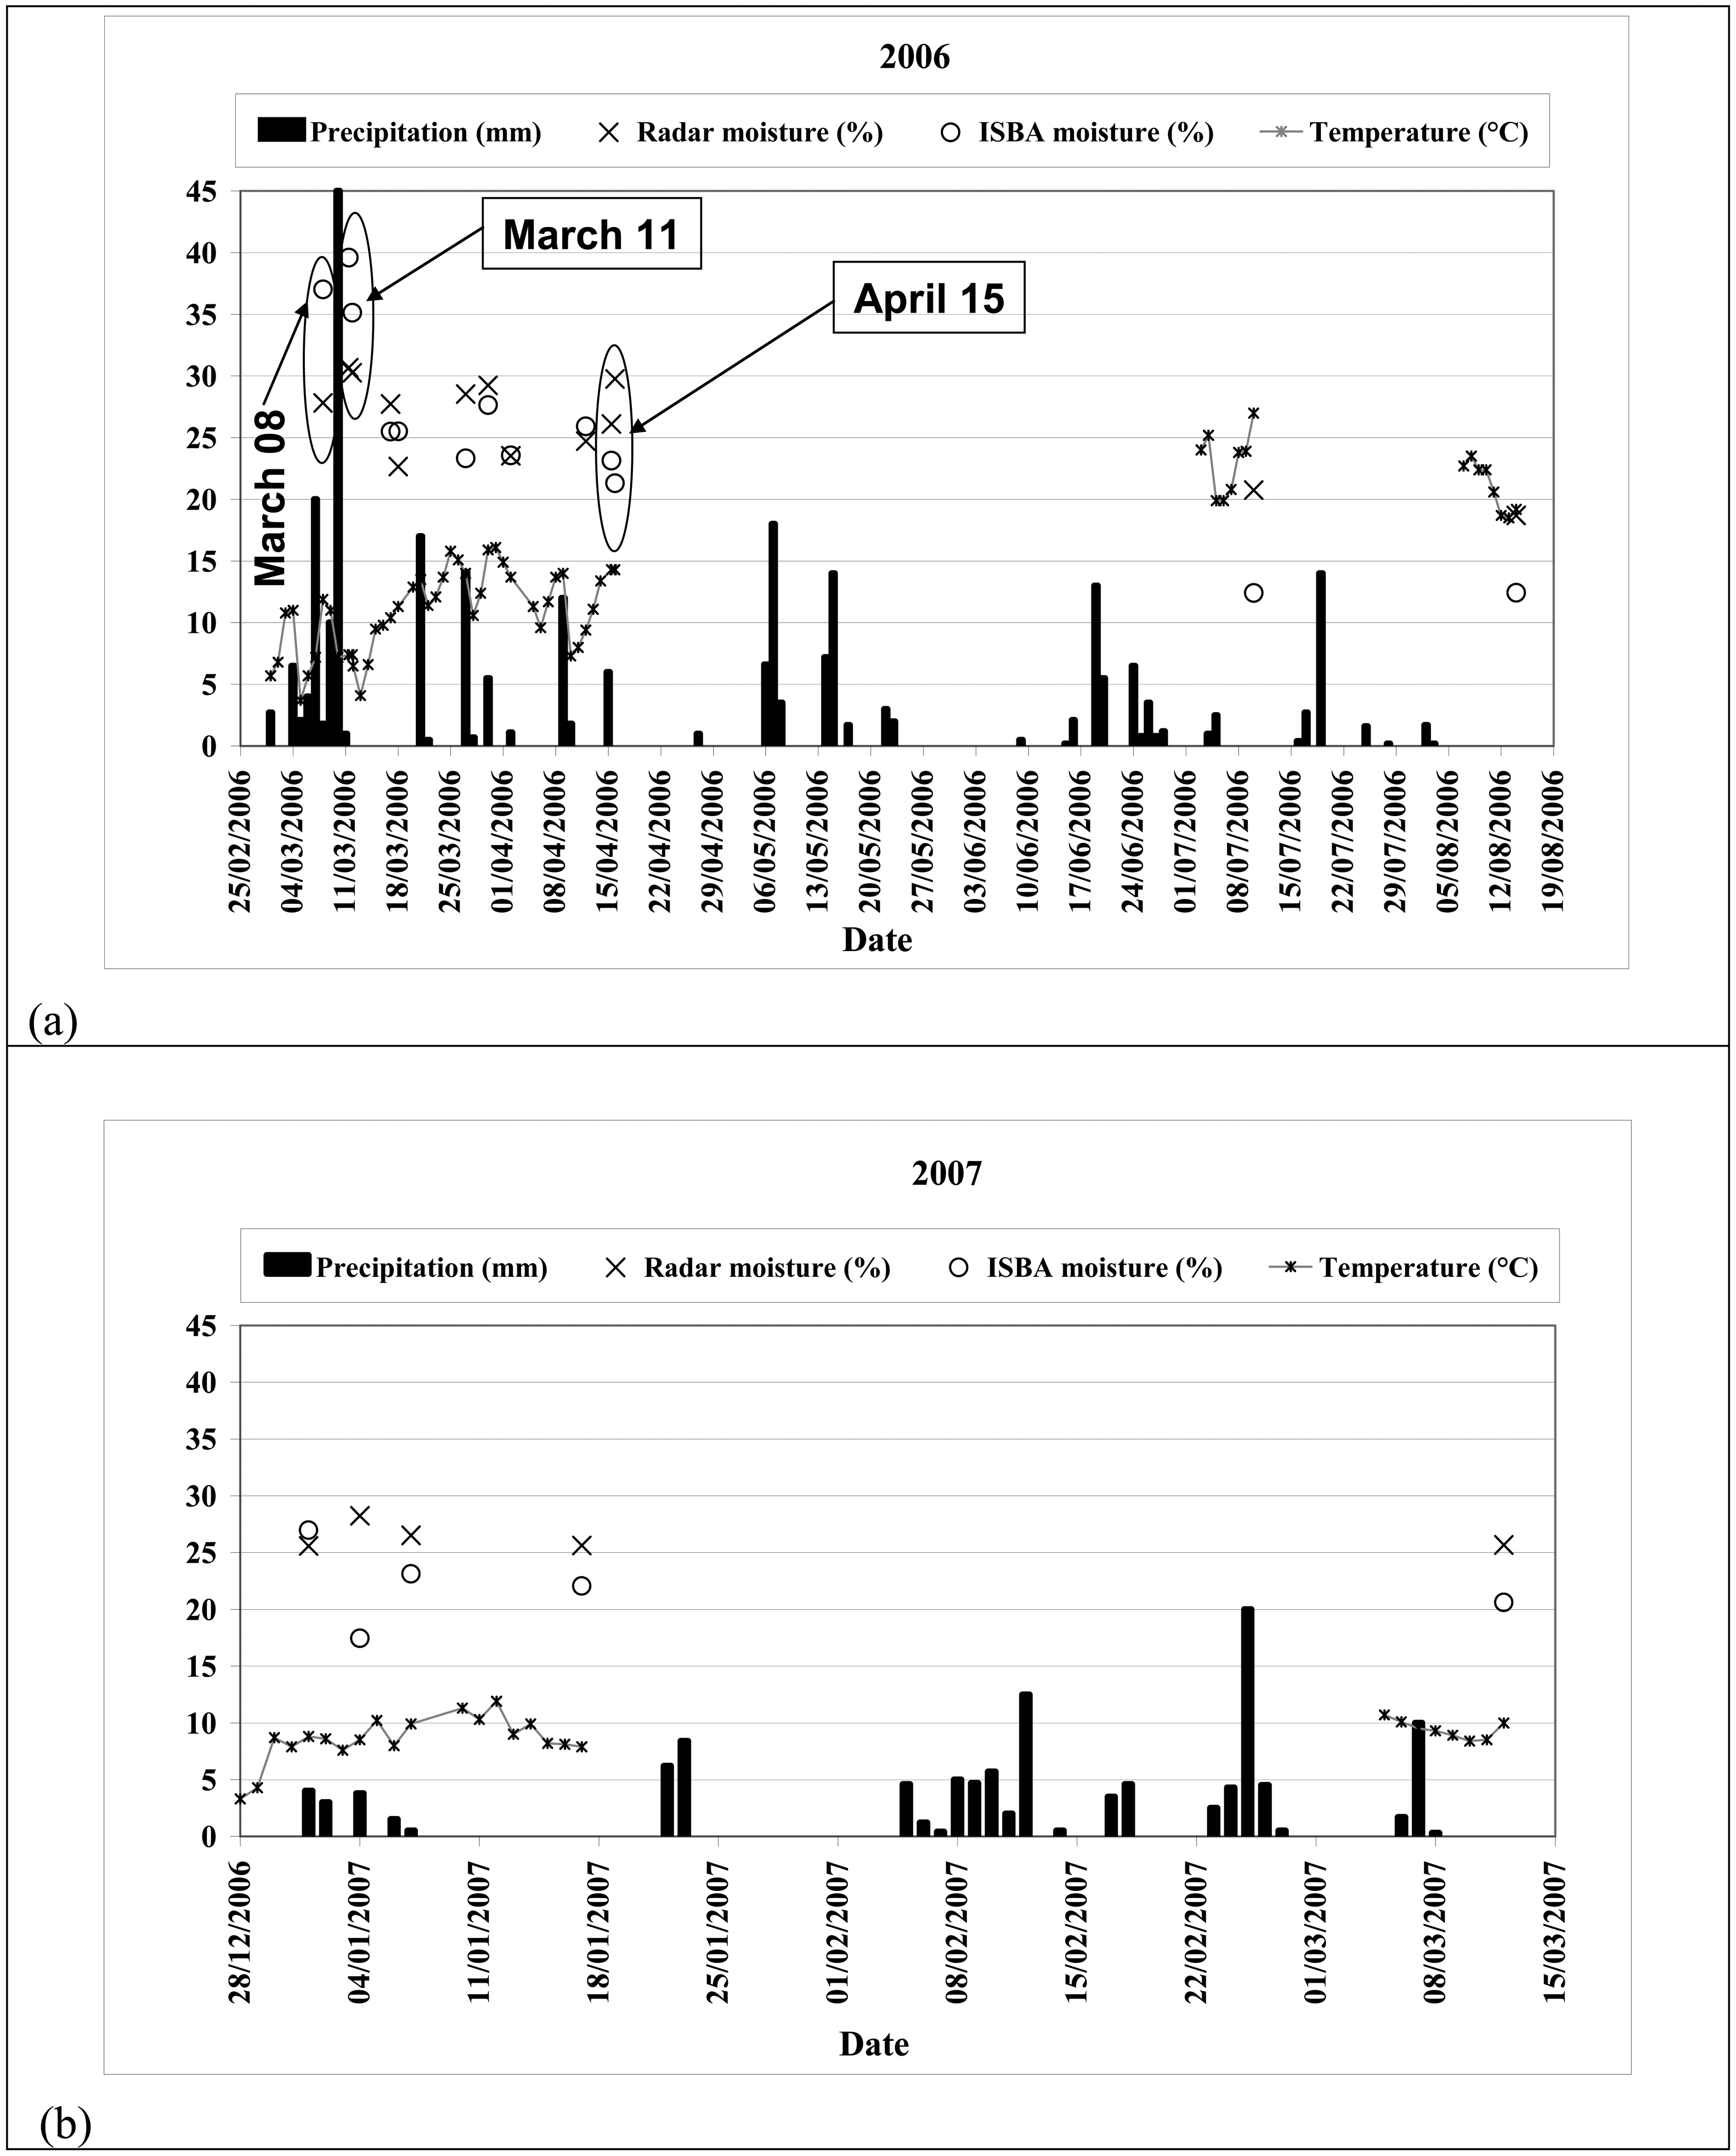
Correlation analysis between precipitations and soil moistures (ISBA and radar)

The lack of in situ moisture data on the basin at the time of radar acquisitions (except for March 12, 2007) encouraged the analysis of radar moistures according to daily precipitations. Precipitations were given by six stations installed in the basin. Figure 7 shows the temporal variation of soil moisture estimated by SAR sensors between March 08, 2006 and March 12, 2007. This variation correlated with precipitations, which confirms that radar estimates are qualitatively coherent. For example, after important precipitations on March 10, 2006 (45 mm) the radar soil moisture increased from 28% on March 08, 2006 to 31% on March 11, 2006. From March 11, 2006 the radar soil moisture starts to decrease to reach 23% on March 18, 2006. This tendency is completely coherent because there no were precipitations between these two dates and the soil has thus dried. A good correlation between radar moisture and precipitations is also observed on the database of 2007. The radar moisture increased from 26% on January 01 to 28% on January 04, and decreases then to 27% on January 07, 2007. This behavior is coherent with precipitations about 13 mm between 01 and 04 January, and 2 mm between 04 and 07 January. The mean temperature during the first fortnight of January was of approximately 10°C.
ISBA simulations follow well the distribution of precipitations. Figure 7 shows ISBA moistures varying between 35 and 40% for the period of 08 to 11 March 2006. These high moisture values correspond to important precipitations between 07 and 10 March 2006 (20mm for 07 March and 45mm for 10 March 2006). Moistures simulated by ISBA decrease after the 11 March to reach soil moisture of 25%. This value is coherent with the absence of precipitations between the 10 and 18 March 2006.
The strong values simulated by ISBA on March 08, 2006 at 10h and on March 11, 2006 at 10 h (time of radar acquisitions) are higher than radar moistures from approximately 9%. This strong over-estimate of moisture by ISBA for these two dates does not seem to correspond to meteorological conditions. Indeed, simulations ISBA from March 11, 2006 at 10 h is about 40%, against 35% at 21 h. It would seem that the strong ISBA value on March 11, 2006 at 10 h is relates well to strong precipitations of March 10, 2006 (45 mm) whereas that of March 08 at 10 h seems to over-estimate the soil moisture. The decrease of ISBA soil moisture between 10 h and 21 h on March 11, 2006 is well justified, since there no was rain between 10 h and 21 h.
From 17 March to 15 April 2006, ISBA moistures fluctuated between 28% and 21%, with values close to radar moistures (difference inferior to 5%). Radar and ISBA moistures of April 15, 2006 are very close for the 10 h radar acquisition time (difference about 3%), but they are very different for the 21h radar acquisition (difference about 9%). According to meteorological data, it rained 0.6 mm between 0 h and 10 h and 4.8 mm between 10 h and 21 h on April 15, 2006. The precipitation of April 15 explains the increase of the soil moisture observed on the radar image acquired at 21 h (increase of 4% between 10 h and 21 h), and shows that the decrease of moisture in the ISBA simulations (3%) is not coherent. This wrong simulation of soil moisture by the ISBA model on April 15 at 21 h can be explained by the wrong precipitation distribution used in the input of the ISBA model (Safran model). For some meteorological situations, the hourly interpolation of precipitations carried out by Safran gives sometimes values which are wrongly distributed by the hourly resolution. Indeed, in the ISBA model, it was predicted and then used precipitations of 0.8 mm between 7 h and 10 h and 0 mm between 10 h and 21 h. Radar estimates are superior to ISBA simulations of about 9% on July 10 and 7% on August 14, 2006. However, it is difficult to know if radar or the ISBA model better estimates the soil moisture for these two dates.
From 01 to 04 January 2007, it rained approximately 11 mm (Figure 7b). The soil moistures estimated by radar increases of 3% between 01 and 04 January, whereas ISBA moistures decrease approximately of 10% (from 27 to 17%). This decrease of ISBA moisture is not correlated with meteorological conditions of this period. From 04 to 17 January 2007, the behavior of radar moisture is coherent with the weak precipitations recorded between these dates. For March 12, 2007 the soil moisture is of 25.7% with radar, 20.6% with ISBA, and 23.4% with gravimetric measurements.

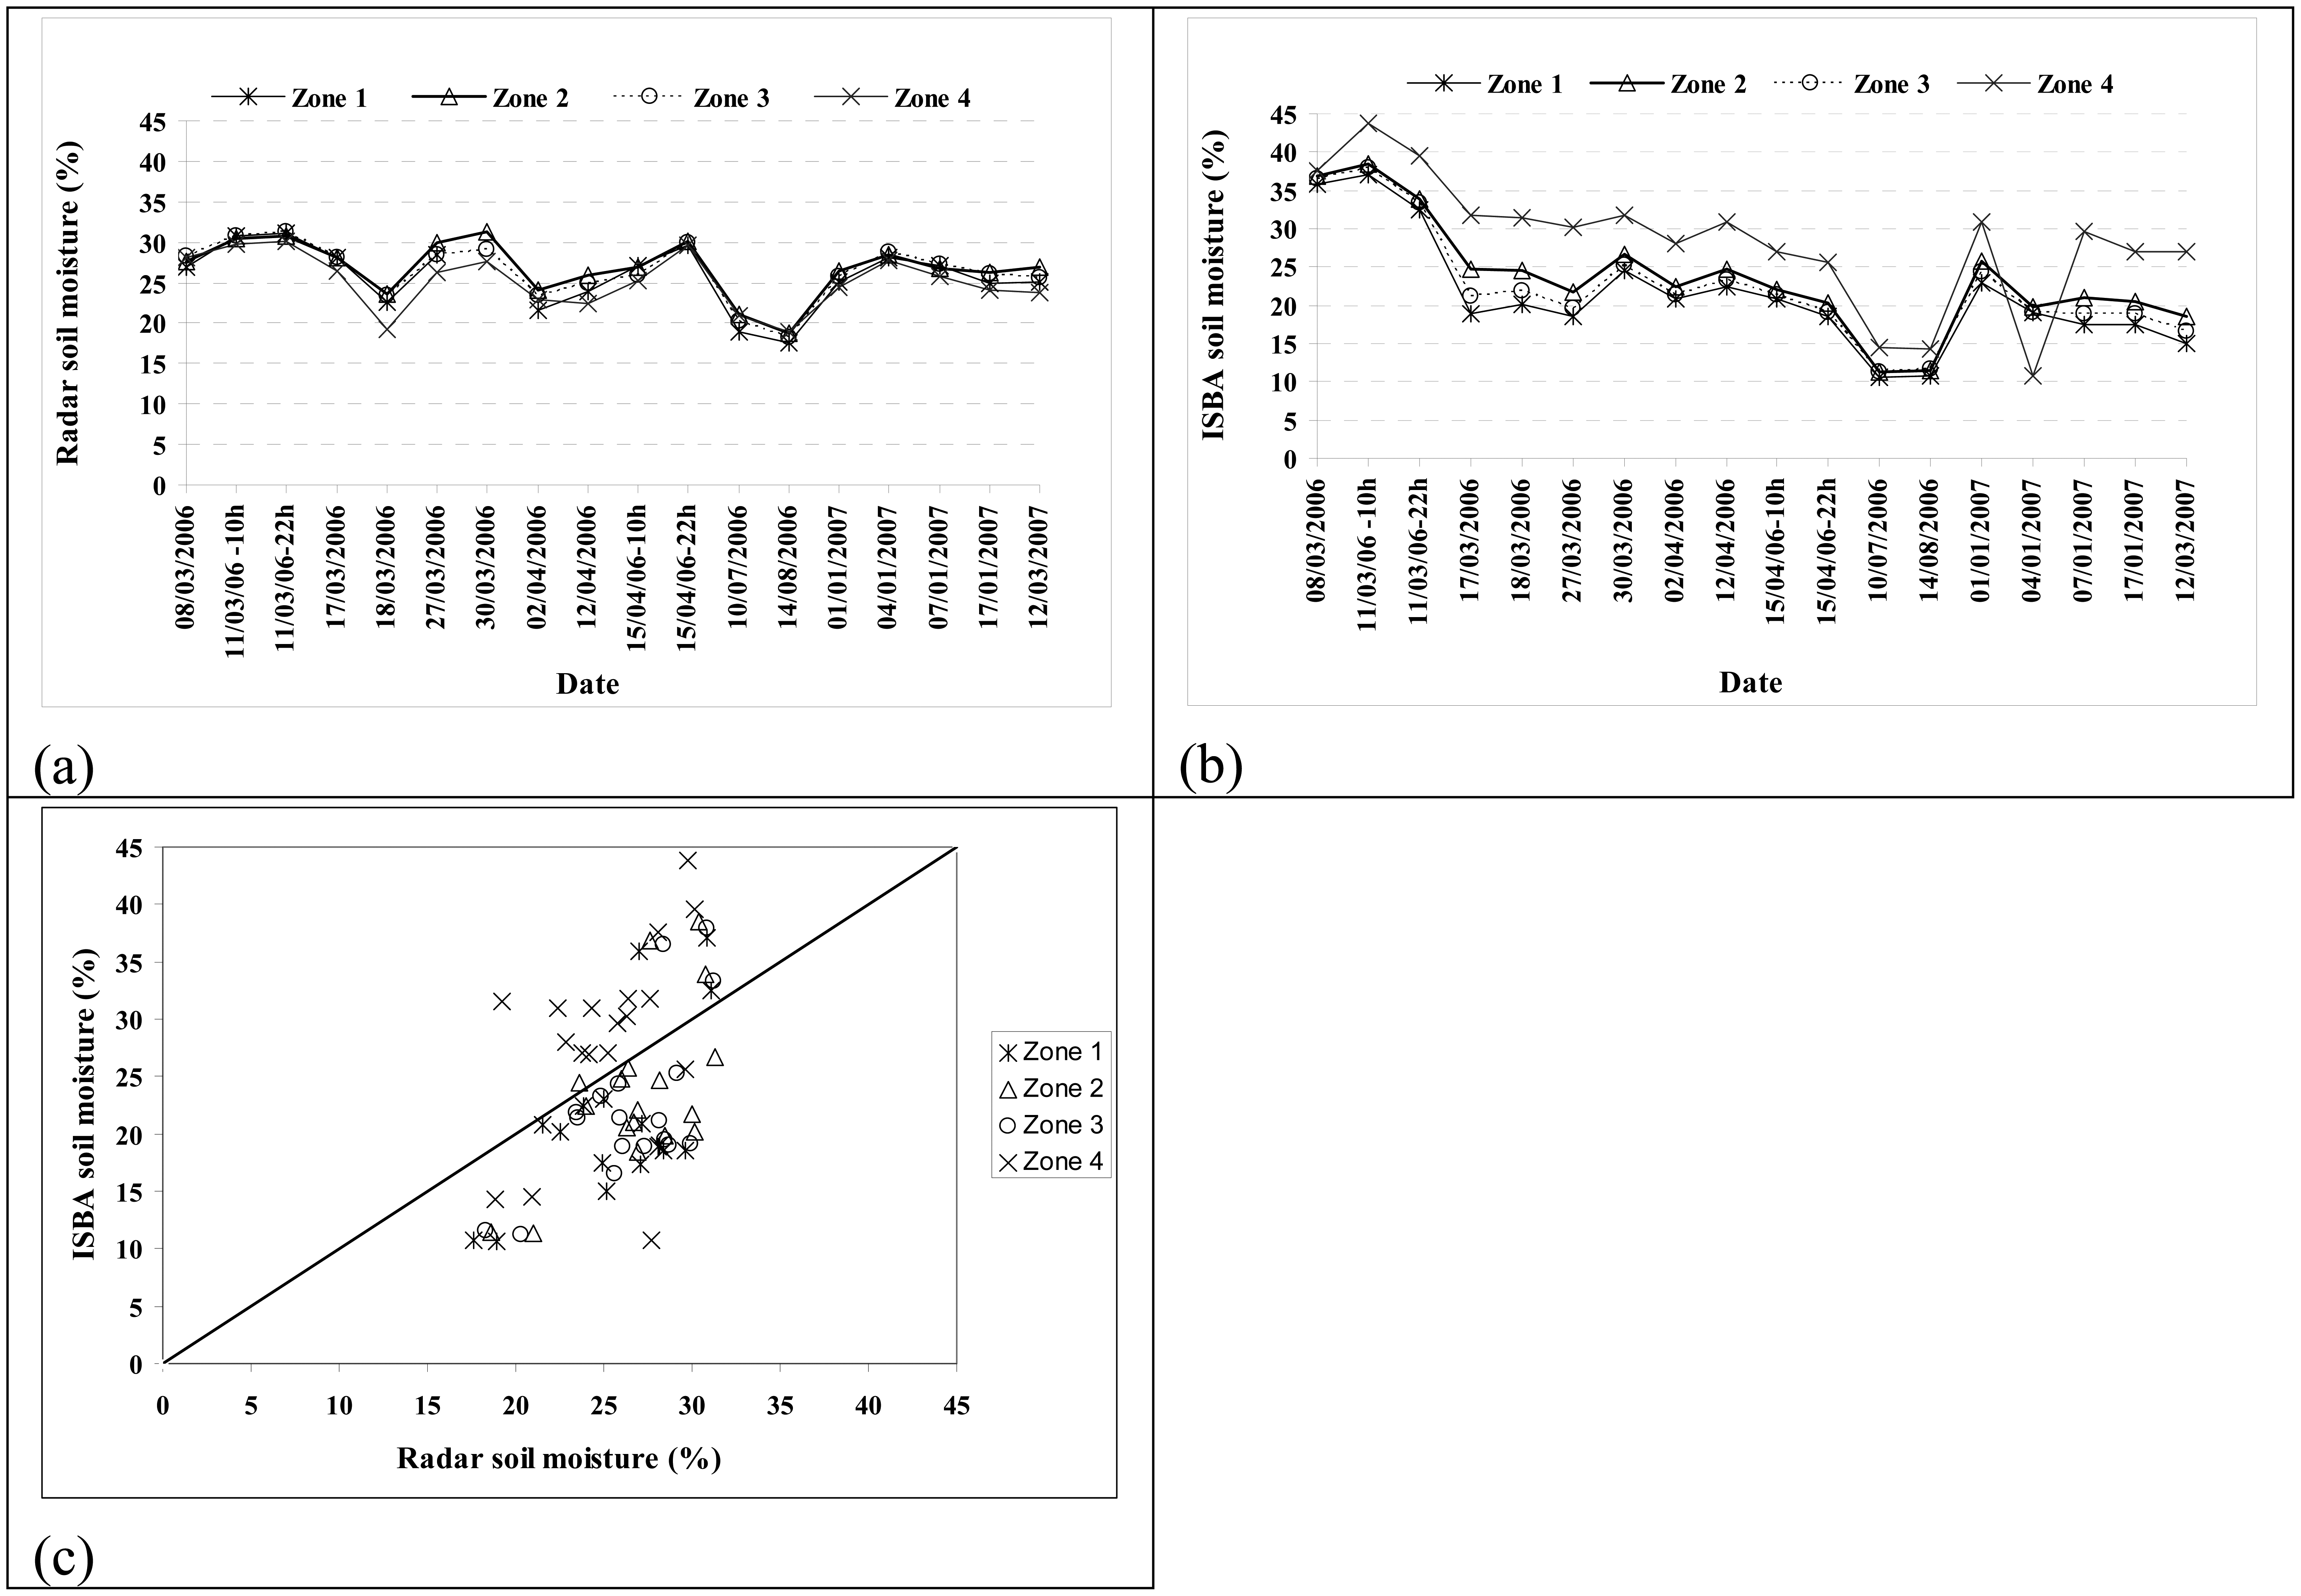
Soil moisture mapping according to soil surface texture of the SGBDE

Spatial variations of soil moisture obtained by gravimetry, radar images, and ISBA simulations were studied at textural zones scale. The textural zones (Figure 2) were defined according to the textural information contained in the 1:1000000 Soil Geographical database. The gravimetric data, measured on 33 test fields, were classified according to their textural zones. Concerning radar data, the mean soil moisture was calculated for each date and each textural zone in using the mean radar signal of all bare soil pixels presents inside each zone (Figure 8a). For ISBA moistures, moisture values corresponding to bare soils were averaged on each textural zone (Figure 8b).
The behavior of the soil moisture calculated for textural zones is different for ISBA, radar, and gravimetric data. Figure 8a shows that there is no dependence between soil moistures estimated by radar images and the textural zones. However, an important dependence is obtained between ISBA soil moisture and textural zones (Figure 8b). Indeed, the ISBA soil moisture for zone 4, mainly composed of clayey material, is stronger than that for the other textural zones. The mean difference between radar estimates and ISBA simulations at textural class scale varies from -3.27% for zone 4 to +4.58 for zone 1 (bias=3.27% for zone 2 and 4.16 for zone 3). The standard deviation varies from 5.57% to 5.98% except for zone 4 where the value is 7.45% (Figure 8c).
Moreover, spatial distribution of moisture heterogeneities was displayed at textural zone scale, using box plots (Figure 9). For gravimetric database, 33 data points were used. For both radar and ISBA databases, 72 moisture values were used (18 dates × 4 textural zones). Results obtained between gravimetric or radar moistures do not show dependence with soil texture. On the contrary, ISBA data are well correlated to textural units.
Concerning gravimetry and radar data, the differences between the main quartiles (median, first and third quartiles) of 4 textural zones do not exceed 2% (Figures 9a and 9b). Indeed, moisture would have had to be higher for zone 4 (mainly clay) and to decrease while going towards zone 1 (rather sandy).
As the ISBA model uses the pedological characteristics among input parameters, it would be evident that the soil moisture is dependent of soil texture. In fact, ISBA database shows that zone 4, mainly composed of clay, is well differentiable of other zones (1, 2, and 3). Indeed, the difference between the quartiles of zone 4 and other zones varies between 6% and 10% (Figure 9c). Results show also that pedological zones 1, 2 and 3 differ only of about 2%.
In order to consolidate these results, a nonparametric Kruskal Wallis test was carried out with a confidence threshold of 5%. This test confirms that for radar and gravimetric data, the difference between soil moistures of textural zones is not significant. For ISBA moistures, a significant dependence was observed between the textural zones and soil moisture.
Radar estimations and gravimetric measurements of March 12, 2007 have shown that the differences of moisture observed between textural zones are not significant. The low spatial resolution of the textural map (1:1000000 scale) is not adapted to illustrate the moisture variations inside the basin. Indeed, in situ gravimetric data of 12 March 2007 show a moisture variation between the 33 test fields around 12% (moisture values between 21% and 33%), whereas at the textural zones scale the moisture variation is very weak (2%). It is then probable that the textural zones defined by the 1:1000000 map are not homogeneous and thus contain a mixture of textures. However, following the comparison between gravimetric moistures and the soil texture at the SGBDE textural zones scale, it was concluded that this scale is not adapted to explain the moisture variations on the basin. It would be thus more judicious to use in ISBA model a finer textural grid, at least on the scale of ISBA grids. Nevertheless, many studies concerning pedotransfer functions showed the importance of texture on the moisture estimation [36]. The hypothesis of dependence between moisture and soil texture is not excluded, but with the low spatial resolution of SGBDE map, this is not possible to quantify. In fact, textural spatial heterogeneities determining moisture values not appear at this scale. Thus, ISBA simulations based on textural criteria is legitimate but texture variations must be more precisely determined for obtain good moisture simulation.

4. Conclusions

This study examined the potential of ASAR and ERS-2 data for estimating volumetric soil moisture (mv) over bare soils. Soil moisture estimates obtained from SAR acquisitions were compared to those obtained by the operational Météo-France ISBA model and by in situ measurements. These results appear promising for the development of simplified algorithms for retrieving soil moisture from SAR data, and for monitoring multi-temporal moisture changes. The mapping algorithm of soil moisture from SAR data performed very well. The results on the soil moisture estimates may be summarized as follows:
  • The comparison between radar soil moisture and in situ measurements shows a RMSE for the soil moisture estimate of the order of 3% (in comparison with gravimetric moistures of March 12, 2007). Other SAR images with a wide range of soil moisture (<20% and >35%) are required to better validate the linear regressions established between radar signal and soil moisture.
  • The mean difference between ISBA simulations and radar estimates is lower than 5% for 12 dates among the 18 examined dates. The 6 remaining dates show a mean difference between 5% and 10%. The comparison between ISBA and gravimetric measurements of the 12 March 2007 shows a RMSE of about 6%. Generally, these results are very encouraging.
  • An important difference between ISBA and radar moistures is observed for some grids when the soil is frozen. The use of both liquid and frozen bulk soil water contents improves the results of the comparison between radar and ISBA model.
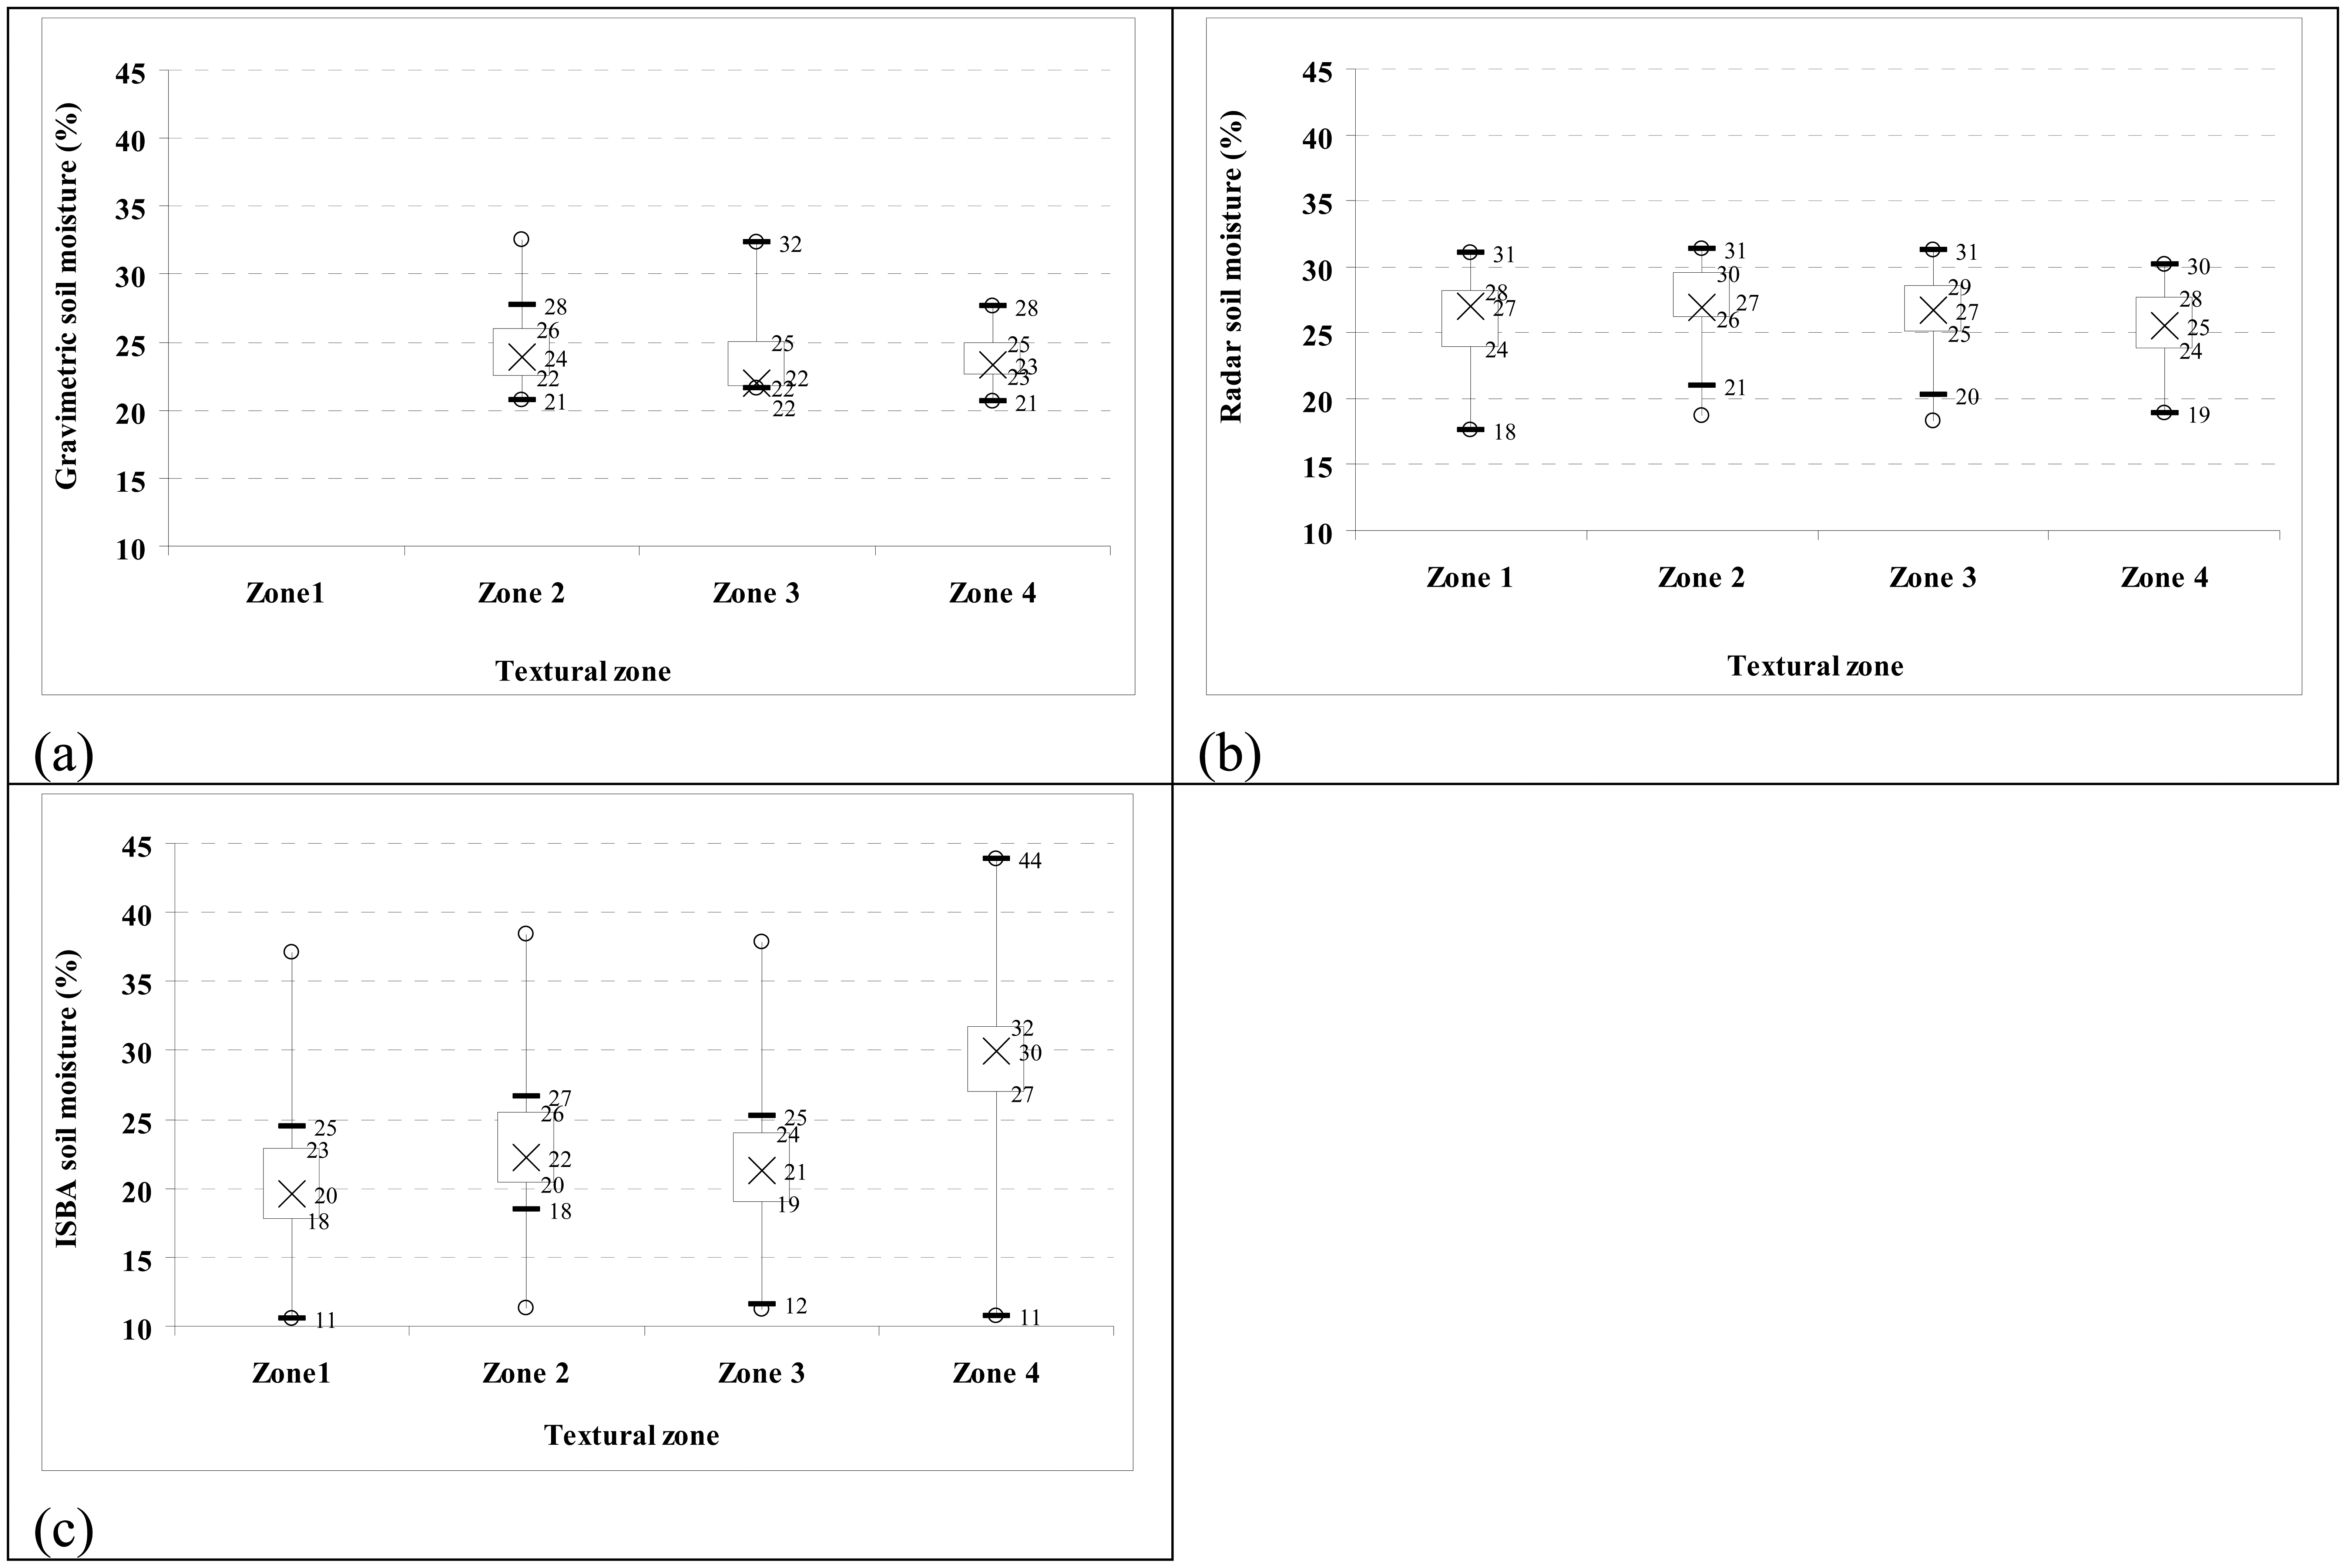
  • No dependence was observed between gravimetric or radar moistures and textural zones according to 1:1000000 textural map. The soil moisture mapping from SAR images at the textural scale shown a weak variation between textural units. The correlation observed between texture map and ISBA moisture is induced by the use of the texture map as an input parameter in the ISBA model. Even if this parameter is very important for soil moisture estimation, radar and gravimetric results shown that the scale at 1:1000000 of the used textural map is not appropriate to differentiate moistures zones. Finally, additional studies on the sensibility of soil moisture to each pedological parameter (texture, density, …) would be necessary in using higher resolution texture data.
Moreover, radar measurements are acquired with a given periodicity (some days) and cannot describe the continuous variations of moisture, whereas ISBA model provides moisture simulations every hour. Thus, it would be important to associate the radar remote sensing in the hydrological modelling. Assimilation of soil moisture data estimated from radar images could be used as calibration data to improve the forecast models (ISBA model for example).
The recent radar sensor (PALSAR/ALOS) and those that will come into operation early (TerraSAR-X, COSMO-SkyMed, RADARSAT-2) should provide us with polarimetric data (all polarizations), with the possibility of better characterising the soil surface. Polarimetry plays an important role as it allows a separation of soil moisture and surface roughness effects. Several inversion models are based on the use of fully polarimetric SAR images [14]. Polarimetric parameters such as, for example, the entropy, the α angle and the anisotropy should allow us to map two soil surface characteristics simultaneously [44]. Finally, the very high spatial resolution (metric) of future SAR sensors offers great potential in terms of improving the quality of SSC mapping. These new SAR sensors will provide a diagnosis suited to catchment areas where the parcels are of small size.
Currently it is difficult to map the moisture of soils covered by vegetation using C-band data. The arrival of L-band (ALOS) will enable to extend the soil moisture mapping from SAR data of bare soils only to soils with vegetation (depending on the density and height of the vegetation). Indeed, the penetration depth of radar wave in vegetable cover is more important at L-band than at C-band. Moreover, the use of L-band enables to map soils with vegetation without using optical images, which is not currently the case with C-band because an optical image is always used for this purpose. Dubois et al. [9] showed that the ratio of two polarizations HV/VV in L-band is strongly correlated with the NDVI (Normalized Difference Vegetation Index). If this information is confirmed, the cartography of soil moisture could be carried out directly from radar images without the use of optical data.

Acknowledgments

This work was carried out within the framework of a project supported by MEDD (French Environmental Ministry) and BRGM (French Geological Survey) in the frame of SCHAPI (National Flood Forecasting Agency) activities. The authors wish to thank ESA (European Space Agency) for kindly providing the SAR images under Dragon project n° 2551 and ENVISAT/ASAR project n° 351. The SPOT images were obtained at special rates through the CNES (French spatial agency) ISIS program. Authors are grateful for R. Malosti and H. Yesou, who very kindly helped for SAR data ordering and INRA-Orléans for providing the soil texture data. The authors thank M. Saplairoles, J.L. Izac, and N. Baran for their participation in ground measurements during the field campaigns. We would also like to acknowledge Ms Florence Habets which helped to clarify us the ISBA model.

References

  1. Beven, K.J.; Fisher, J. Remote sensing and scaling in hydrology. In Scaling up hydrology using remote sensing; Stewart, J.B., Engman, E.T., Fedes, R.A., Kerr, Y., Eds.; Wiley Press: Chichester, UK, 1996; pp. 1–18. [Google Scholar]
  2. Le Bissonnais, Y.; Jamagne, M.; Lambert, J.J.; Le Bas, C.; Daroussin, J.; King, D.; Cerdan, O.; Léonard, J.; Bresson, L.M.; Jones, R. Pan-European soil crusting and erodibility assessment from the European Soil Geographical Database using pedotransfer rules. Adv. Environ. Monitor. Model. 2005, 2, 1–15. [Google Scholar]
  3. Valentin, C.; Poesen, J.; Li, Y. Gully erosion: Impacts, factors and control. Catena 2005, 63, 132–153. [Google Scholar]
  4. Dobson, M.C.; Ulaby, F.T. Active microwave soil moisture research. IEEE Trans. Geosci. Remote Sens. 1986, 24, 23–36. [Google Scholar]
  5. Ulaby, F.T.; Moore, R.K.; Fung, A.K. Microwave Remote Sensing, Active and Passive, From Theory to Applications; Artech House Inc.: Norwood, MA, USA, 1986; Vol. 3. [Google Scholar]
  6. Fung, A.K. Microwave scattering and emission models and their applications; Artech House, Inc.: Boston, London, 1994. [Google Scholar]
  7. Ulaby, F.T.; Batlivala, P.P.; Dobson, M.C. Microwave backscatter dependence on surface roughness, soil moisture, and soil texture: Part I – Bare soil. IEEE Trans. Geosci. Remote Sens. 1978, GE-16, 286–295. [Google Scholar]
  8. Fung, A.K.; Chen, K.S. Dependence of the surface backscattering coefficients on roughness, frequency and polarization states. Int. J. Remote Sens. 1992, 13, 1663–1680. [Google Scholar]
  9. Dubois, P.; Van Zyl, J.J.; Engman, T. Measuring of soil moisture with imaging radars. IEEE Trans. Geosci. Remote Sens. 1995, 33, 915–926. [Google Scholar]
  10. Shi, J.; Wang, J.; Hsu, A.Y.; O'Neill, P.E.; Engman, E.T. Estimation of bare surface soil moisture and surface roughness parameter using L-band SAR image data. IEEE Trans. Geosci. Remote Sens. 1997, 35, 1254–1266. [Google Scholar]
  11. Le Hégarat, S.; Zribi, M.; Alem, F.; Weisse, A.; Loumagne, C. Soil moisture estimation from ERS/SAR data: Toward an operational methodology. IEEE Trans. Geosci. Remote Sens. 2002, 40, 2647–2658. [Google Scholar]
  12. Baghdadi, N.; Gaultier, S.; King, C. Retrieving surface roughness and soil moisture from synthetic aperture radar (SAR) data using neural networks. Can. J. Remote Sens. 2002, 5, 701–711. [Google Scholar]
  13. Zribi, M.; Dechambre, M. A new empirical model to retrieve soil moisture and roughness from C-band radar data. Remote Sens. Environ. 2002, 84, 42–52. [Google Scholar]
  14. Oh, Y. Quantitative retrieval of soil moisture content and surface roughness from multipolarized radar observations of bare soil surfaces. IEEE Trans. Geosci. Remote Sens. 2004, 42, 596–601. [Google Scholar]
  15. Baghdadi, N.; Holah, N.; Zribi, M. Soil moisture estimation using multi-incidence and multi-polarization ASAR SAR data. Int. J. Remote Sens. 2006, 27, 1907–1920. [Google Scholar]
  16. Srivastava, H.S.; Patel, P.; Manchanda, M.L.; Adiga, S. Use of multi-incidence angle RADARSAT-1 SAR data to incorporate the effect of surface roughness in soil moisture estimation. IEEE Trans. Geosci. Remote Sens. 2003, 41, 1638–1640. [Google Scholar]
  17. Holah, H.; Baghdadi, N.; Zribi, M.; Bruand, A.; King, C. Potential of ASAR/ENVISAT for the characterisation of soil surface parameters over bare agricultural fields. Remote Sens. Environ. 2005, 96, 78–86. [Google Scholar]
  18. Mattia, F.; Le Toan, T.; Souyris, J.C.; De Carolis, G.; Floury, N.; Posa, F.; Pasquariello, G. The effect of surface roughness on multifrequency polarimetric SAR data. IEEE Trans. Geosci. Remote Sens. 1997, 33, 915–926. [Google Scholar]
  19. Zribi, M.; Taconet, O.; Le Hegarat-Mascle, S.; Vidal-Madjar, D.; Emblanch, C.; Loumagne, C.; Normand, M. Backscattering behavior and simulation: Comparison over bare soils using SIR-C/X-SAR and ERASME 1994 data over Orgeval. Remote Sens. Environ. 1997, 59, 308–320. [Google Scholar]
  20. Baghdadi, N.; Holah, N.; Zribi, M. Calibration of the Integral Equation Model for SAR data in C-band and HH and VV polarizations. Int. J. Remote Sens. 2006, 27, 805–816. [Google Scholar]
  21. Baghdadi, N.; Zribi, M. Evaluation of Radar Backscatter Models IEM, OH and Dubois Using Experimental Observations. Int. J. Remote Sens. 2006, 27, 3831–3852. [Google Scholar]
  22. Cerdan, O.; Baghdadi, N.; Denux, J.P.; Desprats, J.F.; Gay, M.; Albergel, C.; Dubus, I.; Dupros, F.; Holah, N.; El Hajj, M. APIBAR: Appui à la Prévision des Inondations. Cas des Bassins Rapides du Sud de la France Final Report BRGM/RP-54218-FR. 2006. [Google Scholar]
  23. Habets, F.; Boone, A.; Champeaux, J.L.; Etchevers, P.; Franchistéguy, L.; Leblois, E.; Ledoux, E.; Le Moigne, P.; Martin, E.; Morel, S.; Noilhan, J.; Quintana Segui, P.; Rousset-Regimbeau, F.; Viennot, P. The SAFRAN-ISBA-MODCOU hydrometeorological model applied over France. J. Geophys. Res. 2007. submitted. [Google Scholar]
  24. Oh, Y.; Kay, Y. Condition for precise measurement of soil surface roughness. IEEE Trans. Geosci. Remote Sens. 1998, 36, 691–695. [Google Scholar]
  25. Baghdadi, N.; Paillou, P.; Davidson, M.; Grandjean, G.; Dubois, P. Relationship between profile length and roughness parameters for natural surfaces. Int. J. Remote Sens. 2000, 21, 3375–3381. [Google Scholar]
  26. Davidson, M.; Le Toan, T.; Marria, F.; Satalino, G.; Maninnen, T.; Borgeaud, M. On the characterisation of agricultural soil roughness for radar remote sensing studies. IEEE Trans. Geosci. Remote Sens. 2000, 38, 630–640. [Google Scholar]
  27. BEST - Basic Envisat SAR Toolbox, Version 4.0.3; European Space Agency (ESA), July 2005. http://envisat.esa.int/.
  28. Joughin, I.; Percival, D.; Winebrenner, D. Maximum Likelihood Estimation of K Distribution Parameters for SAR Data. IEEE Trans. Geosci. Remote Sens. 1993, 31, 989–999. [Google Scholar]
  29. Lee, J.S.; Jurkevich, I.; Dewaele, P.; Wambacq, P.; Oosterlinck, A. Speckle filtering of synthetic aperture radar images: A Review. Remote Sens. Rev. 1994, 8, 313–340. [Google Scholar]
  30. Noilhan, J.; Mahfouf, J.F. The ISBA land surface parameterization scheme. Global Planet. Change 1996, 13, 145–159. [Google Scholar]
  31. Noilhan, J.; Planton, S. A simple parameterization of land surface processes for meteorological models. Month. Weath. Rev. 1989, 117, 536–549. [Google Scholar]
  32. Masson, V.; Champeaux, J.L.; Chauvin, F.; Méringuet, C.; Lacaze, R. A global database of land surface parameters at 1 km resolution for use in meteorological and climate models. J. Clim. 2003, 16, 1261–1282. [Google Scholar]
  33. Durand, Y.; Brun, E.; Mérindol, L.; Guyomarc'h, G.; Lesaffre, B.; Martin, E. A meteorological estimation of relevant parameters for snow schemes used with atmospheric models. Ann. Glaciol. 1993, 18, 65–71. [Google Scholar]
  34. Quintana Seguí, P.; Le Moigne, P.; Durand, Y.; Martin, E.; Habets, F.; Baillon, M.; Franchisteguy, L.; Morel, S.; Noilhan, J. Analysis of near surface atmospheric variables: validation of the SAFRAN analysis over France. J. Appl. Meteorol. Climatol. 2007, in press. [Google Scholar]
  35. Bruckler, L.; Wittono, H.; Stengel, P. Near surface moisture estimation from microwave measurements. Remote Sens. Environ. 1988, 26, 101–121. [Google Scholar]
  36. Bruand, A.; Pérez-Fernandez, P.; Duval, O.; Quétin, P.; Nicoullaud, B.; Gaillard, H.; Razison, L.; Pessaud, J.F.; Prudhomme, L. Estimation des propriétés de rétention en eau des sols : Utilisation de classes de pédotransfert après stratification texturale et texturo-structurale. Etude Gest. Sols 2002, 9, 105–125. [Google Scholar]
  37. Gupta, S.C.; Larson, W.E. Estimating soil water retention characteristics from particle size distribution, organic matter percent and bulk density. Water Resour. Res. 1979, 15, 1633–1635. [Google Scholar]
  38. Puckett, W.E; Dane, J.H; Hajeh, B.F. Physical and mineralogical data to determine soil hydraulic properties. Soil Sci. Soc. Am. J. 1985, 49, 831–836. [Google Scholar]
  39. Soil Geographical Database of Europe at scale 1:1,000,000 (SGDBE). Version 2; http://eusoils.jrc.it/ESDB%5FArchive/ESDBv2/.
  40. Weimann, A.; Von Schönermark, M.; Schumann, A.; Jörn, P.; Günther, R. Soil moisture estimation with ERS-1 SAR data in the East-German loess soil area. Int. J. Remote Sens. 1998, 19, 237–243. [Google Scholar]
  41. Zribi, M.; Baghdadi, N.; Holah, N.; Fafin, O. New methodology for soil surface moisture estimation and its application to ENVISAT-ASAR multi-incidence data inversion. Remote Sens. Environ. 2005, 96, 485–496. [Google Scholar]
  42. Beaudoin, A.; Gwyn, Q.H.J.; Le Toan, T. SAR observation and modelling of the C-band backscatter variability due to multi-scale geometry and soil moisture. IEEE Trans. Geosci. Remote Sens. 1990, 28, 886–894. [Google Scholar]
  43. Willmott, C.J. Some comments on the evaluation of model performance. Bull. Am. Meteorol. Soc. 1982, 63, 1309–1313. [Google Scholar]
  44. Hajnsek, I.; Pottier, E.; Cloude, S. Inversion of surface parameters from polarimetric SAR. IEEE Trans. Geosci. Remote Sens. 2003, 41, 727–744. [Google Scholar]
Figure 1. Location of Touch basin.
Sensors 07 02458f1
Figure 2. Soil textural zones of the Touch catchment defined according to the 1:1000000 Soil Geographical database.
Sensors 07 02458f2
Figure 3. Sensitivity of radar signal in C-band (∼5.6 GHz) to surface soil moisture as a function of incidence angle and polarization. Results were obtained from ERS, RADARSAT-1 and ASAR data for clay loam sites (silt: 42 to 78%, clay: 13 to 40%, sand: 5 to 24%). Each point corresponds to the average backscattering coefficient in decibels for one test field.
Sensors 07 02458f3
Figure 4. Comparison between soil moisture estimated by ASAR image acquired the March 12, 2007 and soil moisture measured by gravimetry (at the field scale). Bias “Radar-Gravimetry”=0.34%; standard deviation=3.78%; MAE=3.06%; RMSE=3.74%; d=0.58.
Sensors 07 02458f4
Figure 5. Procedure for mapping soil moisture from SAR images. Optical images are used for bare soils mapping. Radar soil moisture is estimated only over bare soils. The class denominated “other” includes forests, soils covered with vegetation, etc. For the date of March 12, 2007 a comparison between radar soil moisture, in situ soil moisture measurements (gravimetric measurements), and ISBA simulations is realized.
Sensors 07 02458f5
Figure 6. Comparison between radar estimations and ISBA simulations for each ISBA grid (grids size 8km × 8km). (a) Id ISBA grids, (b) ISBA simulations, (c) Radar estimations, and (d) Difference (Radar – ISBA). The standard deviation of radar moisture values estimated on ISBA grid scale varies between 3% and 6% except for March 18, 2006 where the standard deviation varies between 5% and 9%.
Sensors 07 02458f6
Figure 7. Soil moistures obtained from radar images, ISBA model, and in situ measurements (Gravimetry) according to daily precipitation. Each soil moisture value corresponds to the average soil moisture on the catchment basin (one soil moisture value for the whole of the basin). The standard deviation of basin average soil moisture values is around 4.5% except for March 18, 2006 where the standard deviation is 9%.
Sensors 07 02458f7
Figure 8. Correlation between textural zones and surface soil moisture simulated from ISBA model, and estimated from ASAR images. Each symbol corresponds to the mean soil moisture on each textural zone. Zone 1 is mainly sandy and zone 2 is mainly composed of clay (cf. Figure 2).
Sensors 07 02458f8
Figure 9. Box plot comparing the results obtained for soil moistures according to textural zones. (a) Gravimetric, (b) Radar, (c) ISBA.
Sensors 07 02458f9
Table 1. Main characteristics of SAR images used for soil moisture mapping. Images are acquired over the Touch basin in 2006-2007. For each SAR date, there are the optical images used for mapping bare soils. 33 gravimetric measurements were performed on March 12, 2007.
Date(dd/mm/yy)SAR sensorAcquisition Time (TU)PolarizationIncidence angleOptical image DatePercentage of bare soil

12/03/2007ASAR10 :13VV , VHIS2 : 23°SPOT 15/02/200710.9
17/01/2007ASAR10 :10VV , VHIS3 : 28°SPOT 15/02/200719.9
07/01/2007ASAR21 :43VV , VHIS3 : 28°SPOT 15/02/200719.9
04/01/2007ASAR10 :13VV , VHIS2 : 23°SPOT 15/02/200719.9
01/01/2007ASAR10 :13VV , VHIS2 : 23°SPOT 15/02/200719.9
14/08/2006ERS-210 :42VV23°ASTER 01/07/200620.9
10/07/2006ERS-210 :42VV23°ASTER 01/07/200620.9
15/04/2006ASAR21 :34VV , HHIS1 : 18°SPOT 07/04/200616.1
15/04/2006ASAR10 :16VV , HHIS1 : 18°SPOT 07/04/200616.1
12/04/2006ASAR10 :10VV , HHIS3 : 28°SPOT 07/04/200616.1
02/04/2006ASAR21 :43VV , HHIS3 : 28°SPOT 07/04/200616.1
30/03/2006ASAR10 :19VV , HHIS1 : 18°SPOT 07/04/20068.7
27/03/2006ERS-210 :42VV23°SPOT 07/04/200616.0
18/03/2006ASAR09 :56VV , HHIS7 : 44°SPOT 15/03/200624.1
17/03/2006ASAR21 :45VV , HHIS4 : 33°SPOT 15/03/200624.1
11/03/2006ASAR21 :34VV , HHIS1 : 18°SPOT 15/03/200624.1
11/03/2006ASAR10 :16VV , HHIS1 : 18°SPOT 15/03/200624.1
08/03/2006ASAR10 :10VV , HHIS3 : 28°SPOT 15/03/200624.1
Table 2. Comparison between soil moistures measured by gravimetry, simulated by ISBA model, and estimated from ASAR images of March 12, 2007 (scale of ISBA grids).”RadMean” corresponds to radar soil moisture obtained by the mean estimate of VV and VH polarizations.
Id ISBA gridMeasured soil moisture by gravimetry (%)RadVV– GraviRadVH– GraviRadMean– GraviISBA – GraviRadMean– ISBA
Test field numberMean mv
19727------6.75
19728------4.51
19899-------1.77
19900423.23.664.023.8403.84
19901119.357.146.566.85-4.2511.10
19902------10.58
20073------0.77
20074325.721.820.531.17-10.0211.19
20075322.672.811.622.21-7.679.88
20246124.93-1.08-1.2-1.144.57-5.71
20247526.88-1.5-2.11-1.803.02-4.82
20248425.322.281.031.65-9.1210.77
20249------10.27
20419321.293.023.673.353.91-0.56
20420623.70.07-0.27-0.103.1-3.20
20421222.242.012.352.181.760.42
20422------10.70
Bias2.421.621.82-1.474.40
Standard deviation2.312.622.545.746.21
MAE1.552.021.865.035.43
RMSE3.252.973.025.647.46
d0.490.410.460.480.39

