1. Introduction
Recently a significant constant wine market growth has been registered all around the world [
1]. In fact, the latest International Organization of Vine and Wine (OIV) report, issued in March 2007, showed wine consumption rising slightly in European countries (1.4% in total), while for countries outside the European Union, the growth was even more consistent. For instance, consumption in the United States rose by 3.1%, in Argentina by 1.2%, 2 % in South Africa, by 1.7% in Australia and by 6.5% in New Zealand [
2]. In order to ensure uniformity within a brand and to avoid falsifications an accurate product control is strictly required for wine industry. The utility of chemical sensor arrays working in the liquid phase– ET - for this purpose has been shown recently [
3,
4]. Even if ET cannot provide information about the structure of the analyte without additional analytical determination (performed for example by LC/MS or GC/MS methods), however it provides a cheap, rapid and not tedious possibility for either the classification of samples of different quality or brand or quantitative determination of several parameters.
In the last period, several research efforts have been focused on the analysis of wines applying chemical sensor arrays. Thus, in [
5] Parra et al., reported the application of voltammetric hybrid ET, composed of phtalocyanines-based carbon paste electrodes (CPEs) and gold electrodes covered by polypyrrole doped with several counterions, for the detection of forbidden adulterants in wines, used to improve wine organoleptic characteristics. The same authors developed an array of CPEs modified with three rare-earth bisphthalocyaninate compounds and successfully applied it for the discrimination of different Spanish red wines, prepared from the same grape variety but from different geographic areas and with different ageing times, from 4 to 36 months [
6].
In [
7] Riul Jr. at al., showed the capability of an array of gold interdigitated sensors modified with LB films of conducting polymers/lipids and chitosan, to correctly distinguish different types of red wines, according to the vintage, vineyard, brand and storage conditions of the sample, using Principal Component Analysis (PCA) and Neural Networks as data analysis techniques. An ET composed of 28 potentiometric sensors was exploited to classify 160 Port wine samples of different ages (from 2 to 70 years) [
8]. The ET predicted the Port wine age with an accuracy similar to that obtained using chemical analysis data. The multiparametric analyser based on ISFET sensors for process control in the wine industry is reported in [
9]. Authors developed high sensitive and stable pH, calcium and potassium sensors capable to measure the saturation point of ion-exchange resins, used to control the tartaric stabilization of wines in real time.
Previously we reported an application of potentiometric ET system composed of porphyrin-based sensors for identification of beverages made of two different source materials: grape and barley. [
10]. Simultaneously a scale of beverages' ‘alcoholic degree’ in ethanol concentration units was evolved. The alcoholic strength of several commercial sorts of wine, beers, grappa and whiskey was successfully evaluated according to the evolved scale. Selectivity of potentiometric sensors with solvent polymeric membranes doped with various metallo-porphyrines and corroles was evaluated in [
11] and the ET system was developed and applied for the qualitative and quantitative analysis of artificial wines, characterized by the presence of polluting agents such as SO
2, H
2S and CH
3CO
2H. The ET was able to distinguish the wines with different polluting agents and to predict the amount of each pollutant even at low concentrations. However while many papers are related to the application of chemical sensor arrays for red wine analysis [
12-
14], only few works are related to the white wines analysis, although its consumption is growing during the last period [
1]. Moreover, the spoilage processes propagate even faster in white wines especially if the production or storage conditions were affected, making the development of a rapid, not expensive analytical procedure of strong importance.
In this work the electrochemical properties of all-solid state potentiometric sensors with PVC solvent polymeric porphyrin-based membranes were studied. Sensors cross-sensitivity properties were determined according to earlier suggested methods. ET analytical system, was composed of highly cross-sensitive sensors and applied for the analysis of white wines. In particular, Italian dry white wines of “Verdicchio D.O.C.” (Controlled Origin Denomination) quality were chosen both for identification and quantitative analysis. Several parameters, characteristic for white wines and markers of its production and storage conditions were defined and, by mathematical methods of pattern recognition, a correlation between sensors'responses and chosen markers values was evaluated.
2. Results and Discussion
The sensor properties, such as stability, reproducibility and selectivity strongly depend on the sensing material deposited on the electrode surface. Recent studies have shown that porphyrins have good performances as membrane active components of chemical sensors [
15,
16]. The selectivity properties of these macrocycles can be modulated by synthetic modifications on the molecule structure, by changing the metal ion coordinated in the centre of the molecule or by introducing peripheral substituents on the macroring [
17,
18].
In the present work we continue the recently started evaluation of cobalt- and platinum-tetraphenylporphyrinates (MeTPP) –based polymeric film sensors in order to utilise them for wine discrimination purpose. As it was shown previously, the sensitivity of Co(III)- and Pt(II)TPP towards aliphatic alcohols decreases in a following order [
9]: ethanol > methanol > isobutyl alcohol; while in [
11 and
19] the response of 5,10,15,20-tetraphenyl porphyrin (H
2TPP) and its Co(II) complexes-based sensors, towards the changes in acetic acid, ethanol, ammonia, NaCl, HCl, quinine, glucose, monosodium glutamate, dissolved SO
2, and H
2S content was evolved. Here we attempted to evaluate the cross-sensitivity of mentioned above sensors, since it is a crucial point when the sensor is to be used as a part of an ET multisensor system.
On the first stage of the study, the responses of sensors with different polymeric membranes (
Table 1), towards several ions were evaluated, then slopes were calculated for linear ranges of sensor calibration curves and used for cross-sensitivity parameters evaluation.
In general, H2TPP based membrane N 1, showed partial cationic response in analyzed salts, with slope varying in a range 4-24 mV/decade. The absence of lipophilic cationic additive TDA+ in the composition of membrane 2 evoked the partial cationic influence (11 - 19 mV/decade) in solutions of high concentrations of all studied salts except nitrite and iodide ions for which the sub-Nernstian slopes of -31±3 and -49±6 mV/decade correspondingly have been detected in all concentration range. While membrane 3 based on Co(II)TPP-R showed a partial anionic response with slopes in a range 10-17 mV/decade in all studied salt solution, an addition of lipophilic anionic TpClPB- particles (membrane 4) lead to the partial cationic sensitivity towards almost all analyzed cations, particularly for ammonium chloride solution, 40±3mV/decade and alkali ions (45±3 mV/decade in solutions of NaBr and 42±3mV/decade in solutions of KI and KCl). Dummy TOP-plasticized membrane N 5 showed a cationic response towards all cations, slope varied in a range 3 - 42 mV/pX.
Membranes based on Pt-porphyrins showed anionic responses, with higher slopes of Pt(IV)TPPCl
2 based membranes N 10, 11 and 12 towards anions and selectivity different from Hofmeister pattern for Quaternary Ammonium Salts. An addition of lipophilic cationic additive improved anionic response (membranes NN 8, 9, 11 and 12): the optimal content of TDACl was found 40 mol% relative to ionophore [
20]. It was found, that the better operating conditions for porphyrin-based PVC solvent polymeric membranes can be reached in acidic media (0.01M MES-NaOH pH 5.5) where a partial protonation of porphyrins can occur, which favor an ionophore-analyte complexation. This fact is favorable for porphyrin-based sensor application for acidic samples analysis as wine is.
Since there is not a well established method for the evaluation of sensors cross-sensitivity, we have used the method introdused in [
21], which suggest the evaluation of 3 parameters: an average sensor response slope S, a signal-to-noise ratio K, and a “non-selectivity factor” F describing the distribution of sensor sensitivity to different analytes. The higher are these values, the more cross-sensitive is a sensor. The cross-sensitivity parameters are presented in the
Table 1. Based on evaluated values, an array composed of highly cross-sensitive membranes has been evolved and applied for qualitative and quantitative analysis of Verdicchio dry white wines. Sensors with following membranes were included in the array: H
2TPP-based membrane N1, Co(III)TPPBr-based membrane N2, Co(II)Por-based membrane N4, dummy membrane N5, Pt(II)TPP-based membrane N8 and Pt(IV)TPPCl
2-based membranes NN11 and 12.
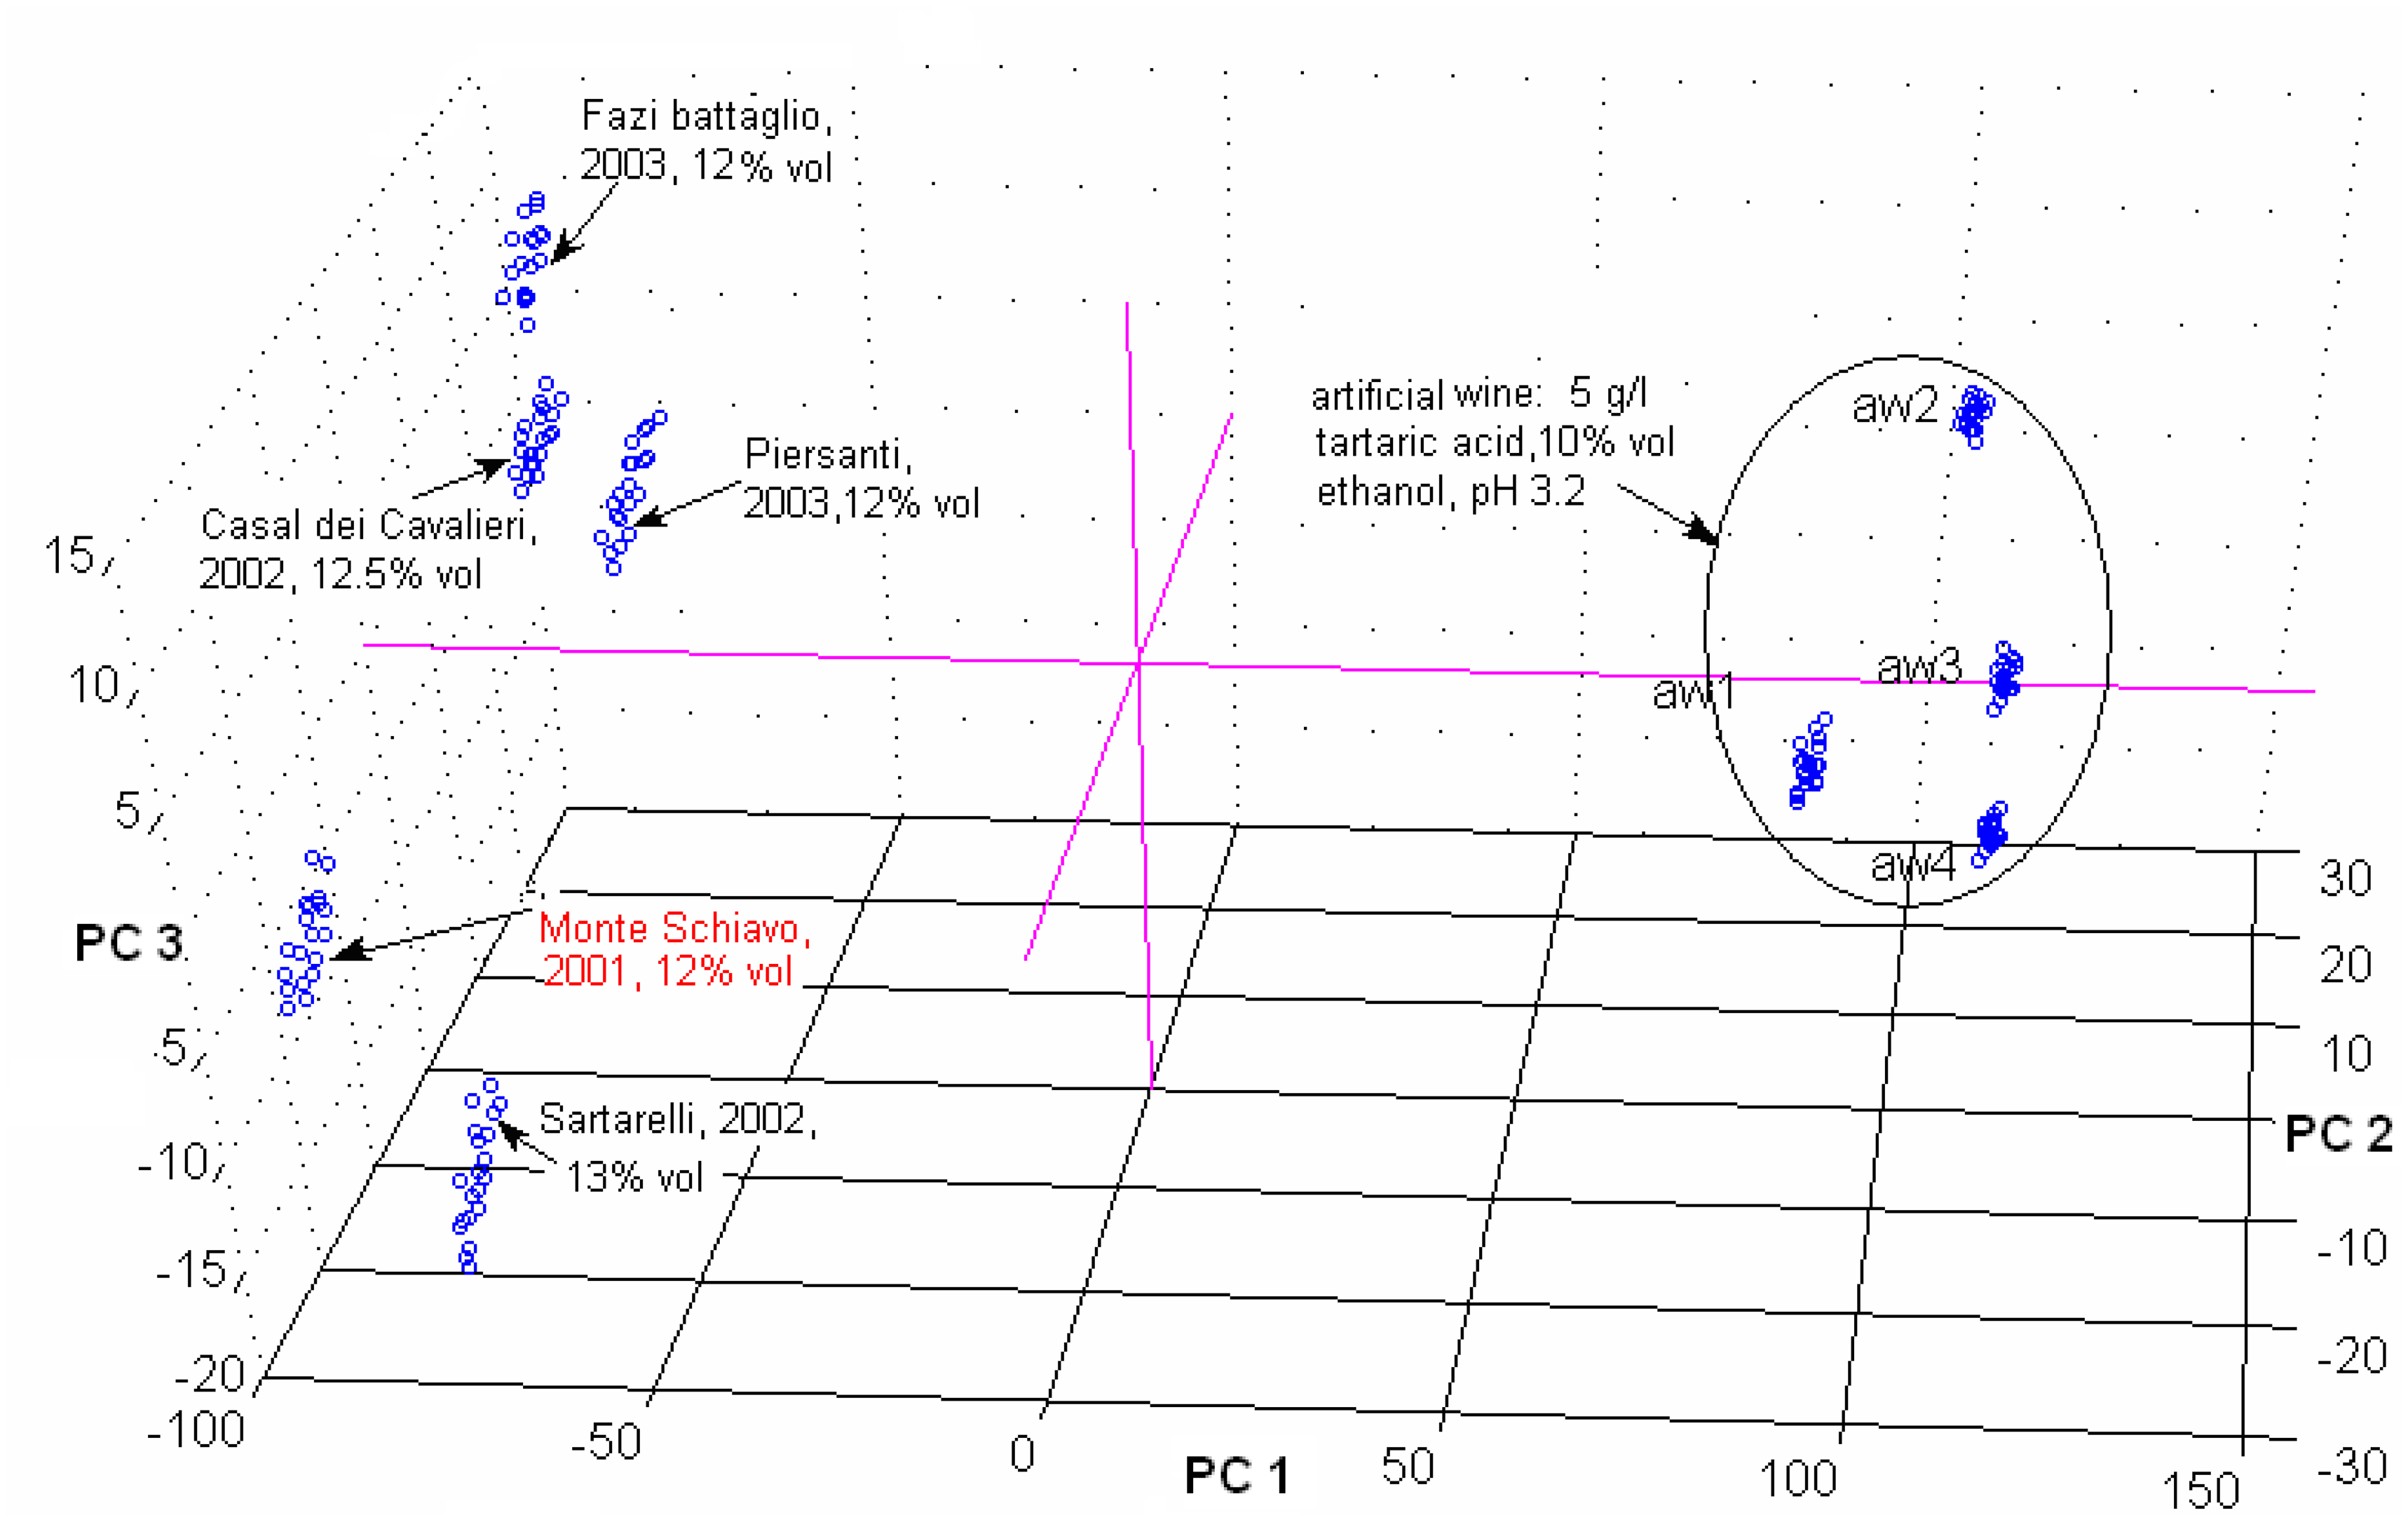
A PCA discrimination of five Verdicchio wines (“
Monteschiavo”, “
Sartarelli”, “
Fazi Battaglia”, “
Casal de' Cavalieri” and “
Piersanti”, see detailed information on graph) and artificial solution mimicking wine composition has been performed,
Figure 1.
The score plot shows 99% of total variance (PC1 94%, PC2 4%, PC3 1%) and a clear distinction between all analyzed samples can be seen. Along the PC1 axis, two well separated clusters, corresponding to the analysed wines and artificial wine can be observed. Moreover, two sub-clusters in Verdicchio wines group may be evolved: one contains wines “onteschiavo” and “Sartarelli” (on the top) and the other wines “Fazi Battaglia”, “Casal de' Cavalieri” and “Piersanti”. According to the information on samples, provided by manufactures this distinction may be attributed to the age of wines: in fact wines of the second group are older then other wine samples. The highest discriminative ability (and the largest loading values) have showed the sensors with membranes based on H2TPP(mb1), Co(II)TPP-R(mb3), dummy membrane N5 plasticised with TOP, TDACl based membrane N6 and Pt(IV)TPPCl2 based membrane N11.
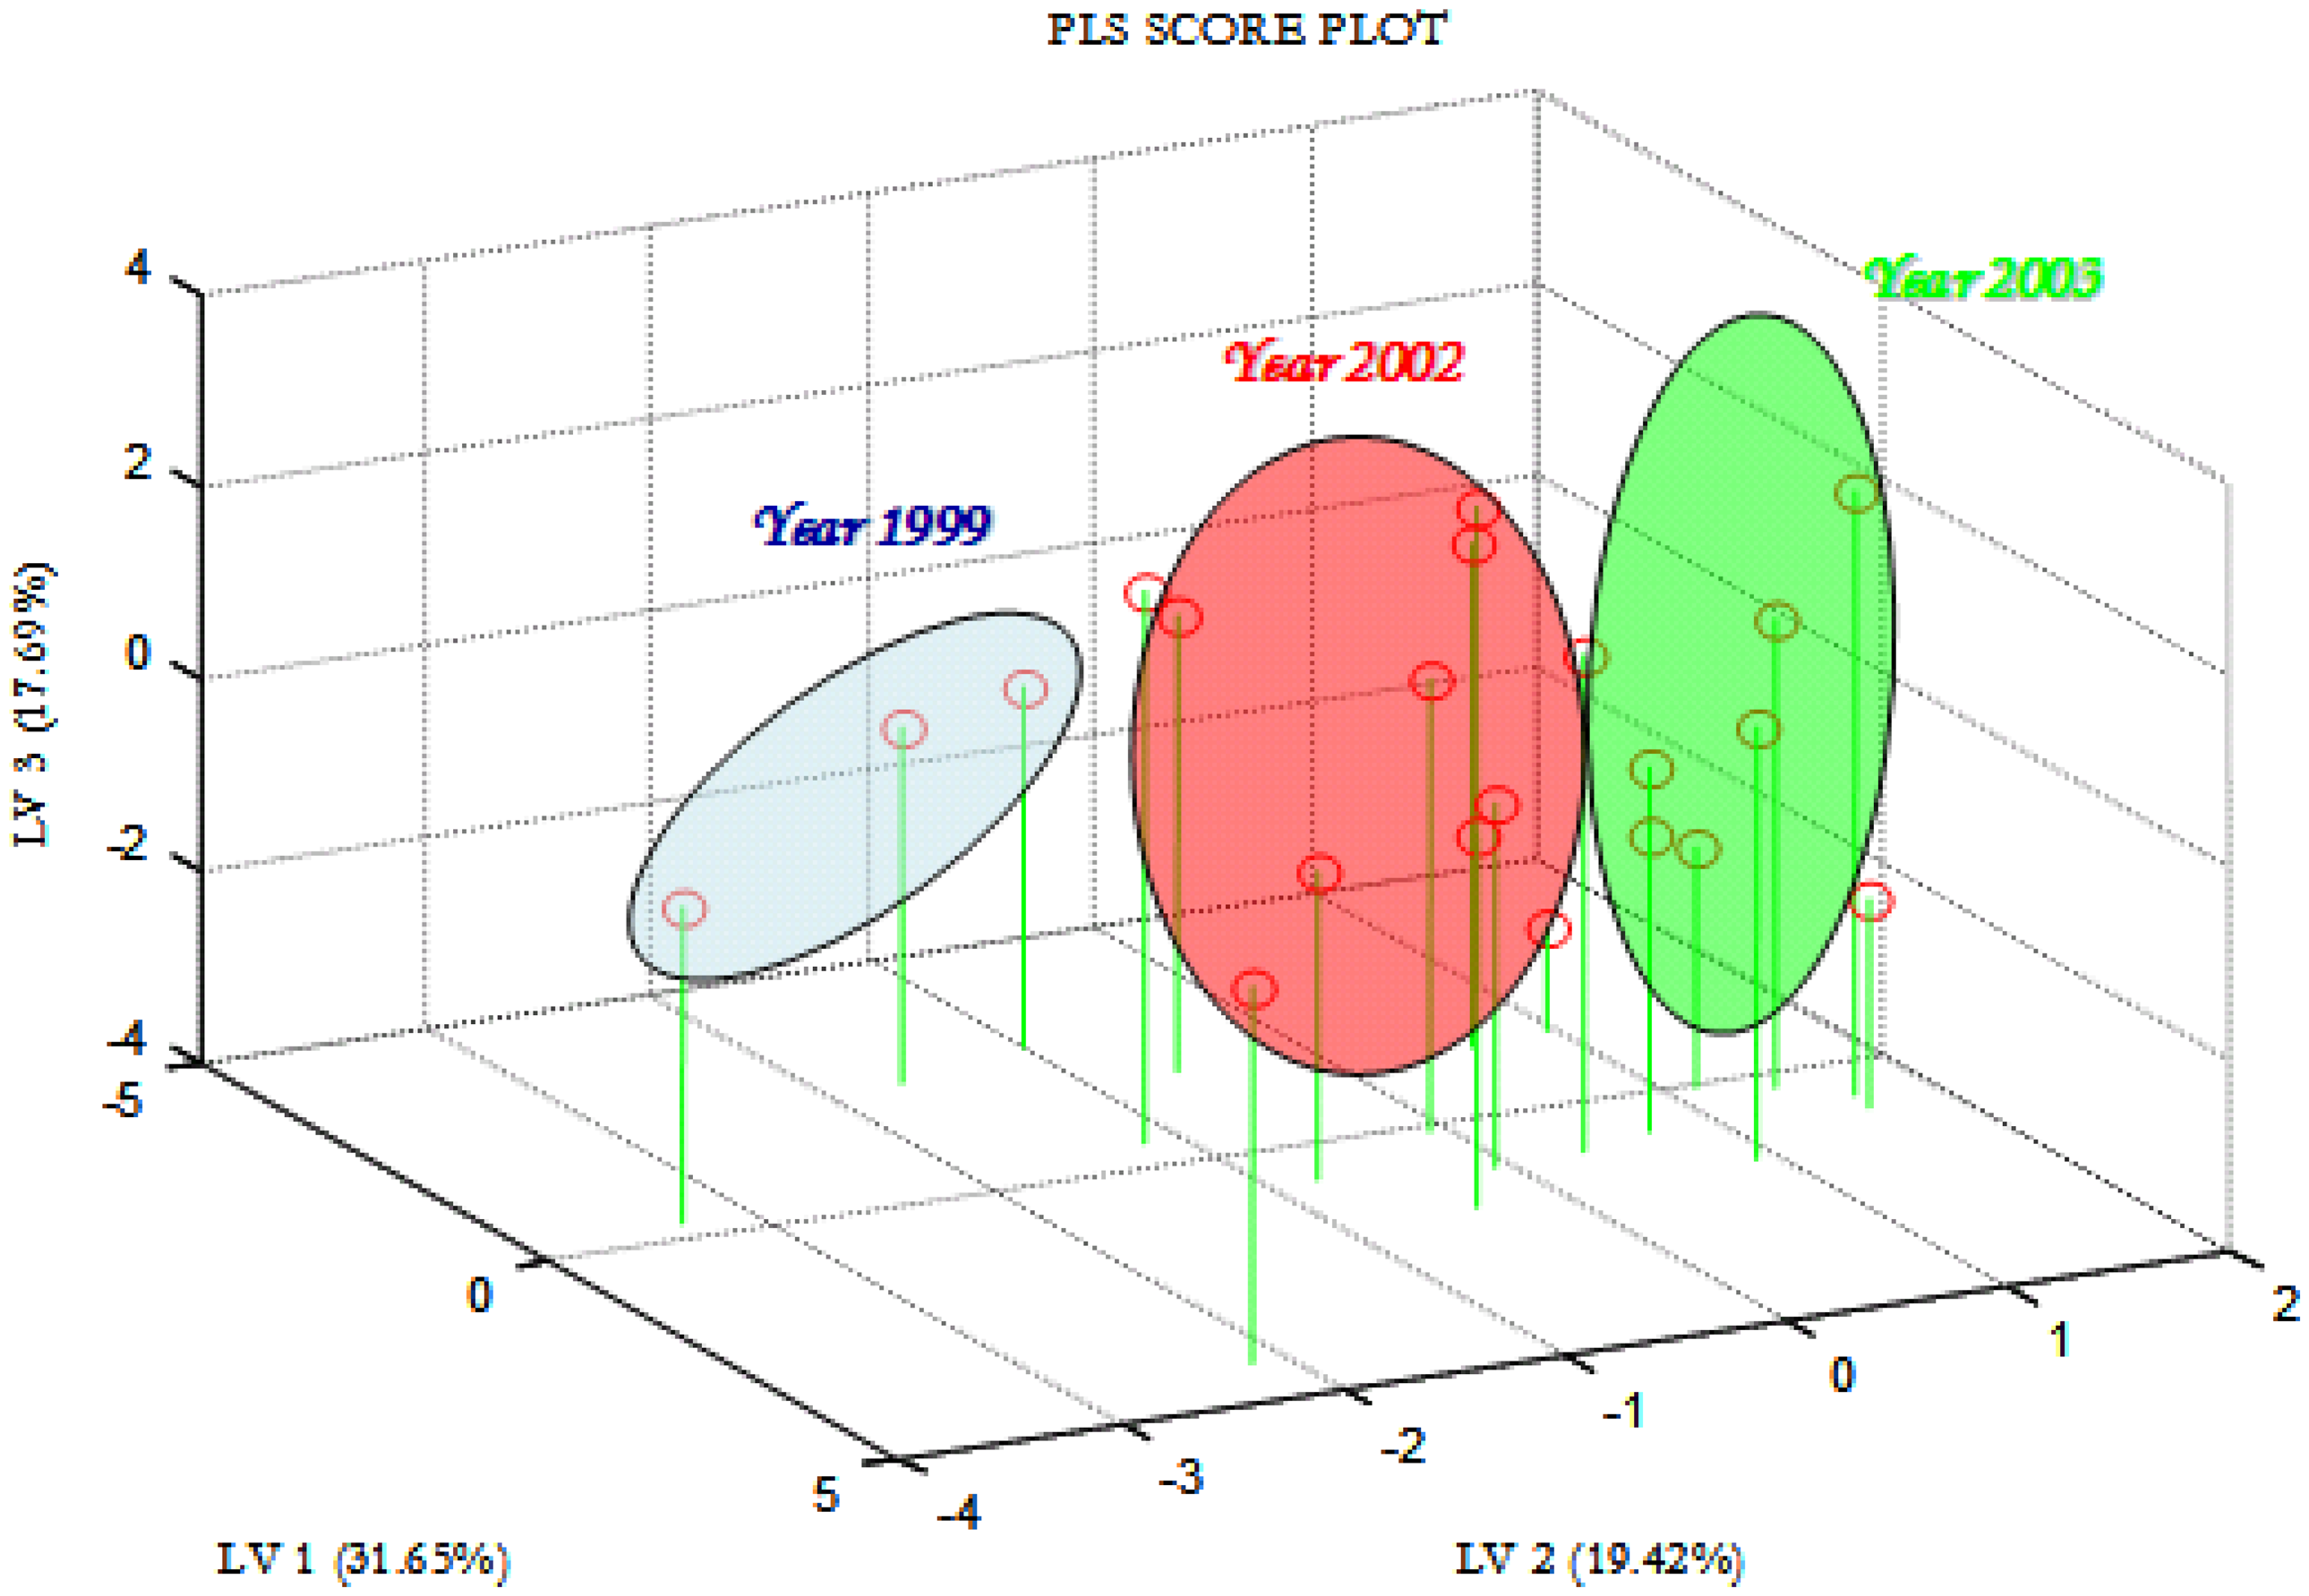
The array was then applied for the analysis of other group of seven Verdicchio wines, coming from cantinas ‘Caldirola’, ‘Casal de' Cavalieri’, ‘Fazi Battaglia’, ‘Piersanti’, ‘Moncaro’, ‘San Sisto’ and ‘Sant' Ignazio’, for which both discriminative analysis accoriding to the year of wine production, as far as quantitative evaluation of several wine components by regression methods have been performed.
On
Figure 2, a Partial Least Squares-Discriminate Analysis (PLS-DA) plot of first tree latent variables represent classification of Verdicchio wines according to the year of production. PLS-DA is an extension of supervised PLS technique. Prior to analysis Verdicchio wine samples have been divided in three different classes: years 1999, 2002 and 2003. Then discriminating plane has been found in order to separate the classes of observations on the basis of the
X-variables –sensor responses according to an
Y-vector that encodes the year of production in a set of categorised variables, denoted as positive and negative (1, 0 values, respectively). A high capability of porphyrin-based ET system to classify the Verdicchio wines in 3 groups corresponding to the year of production can be observed.
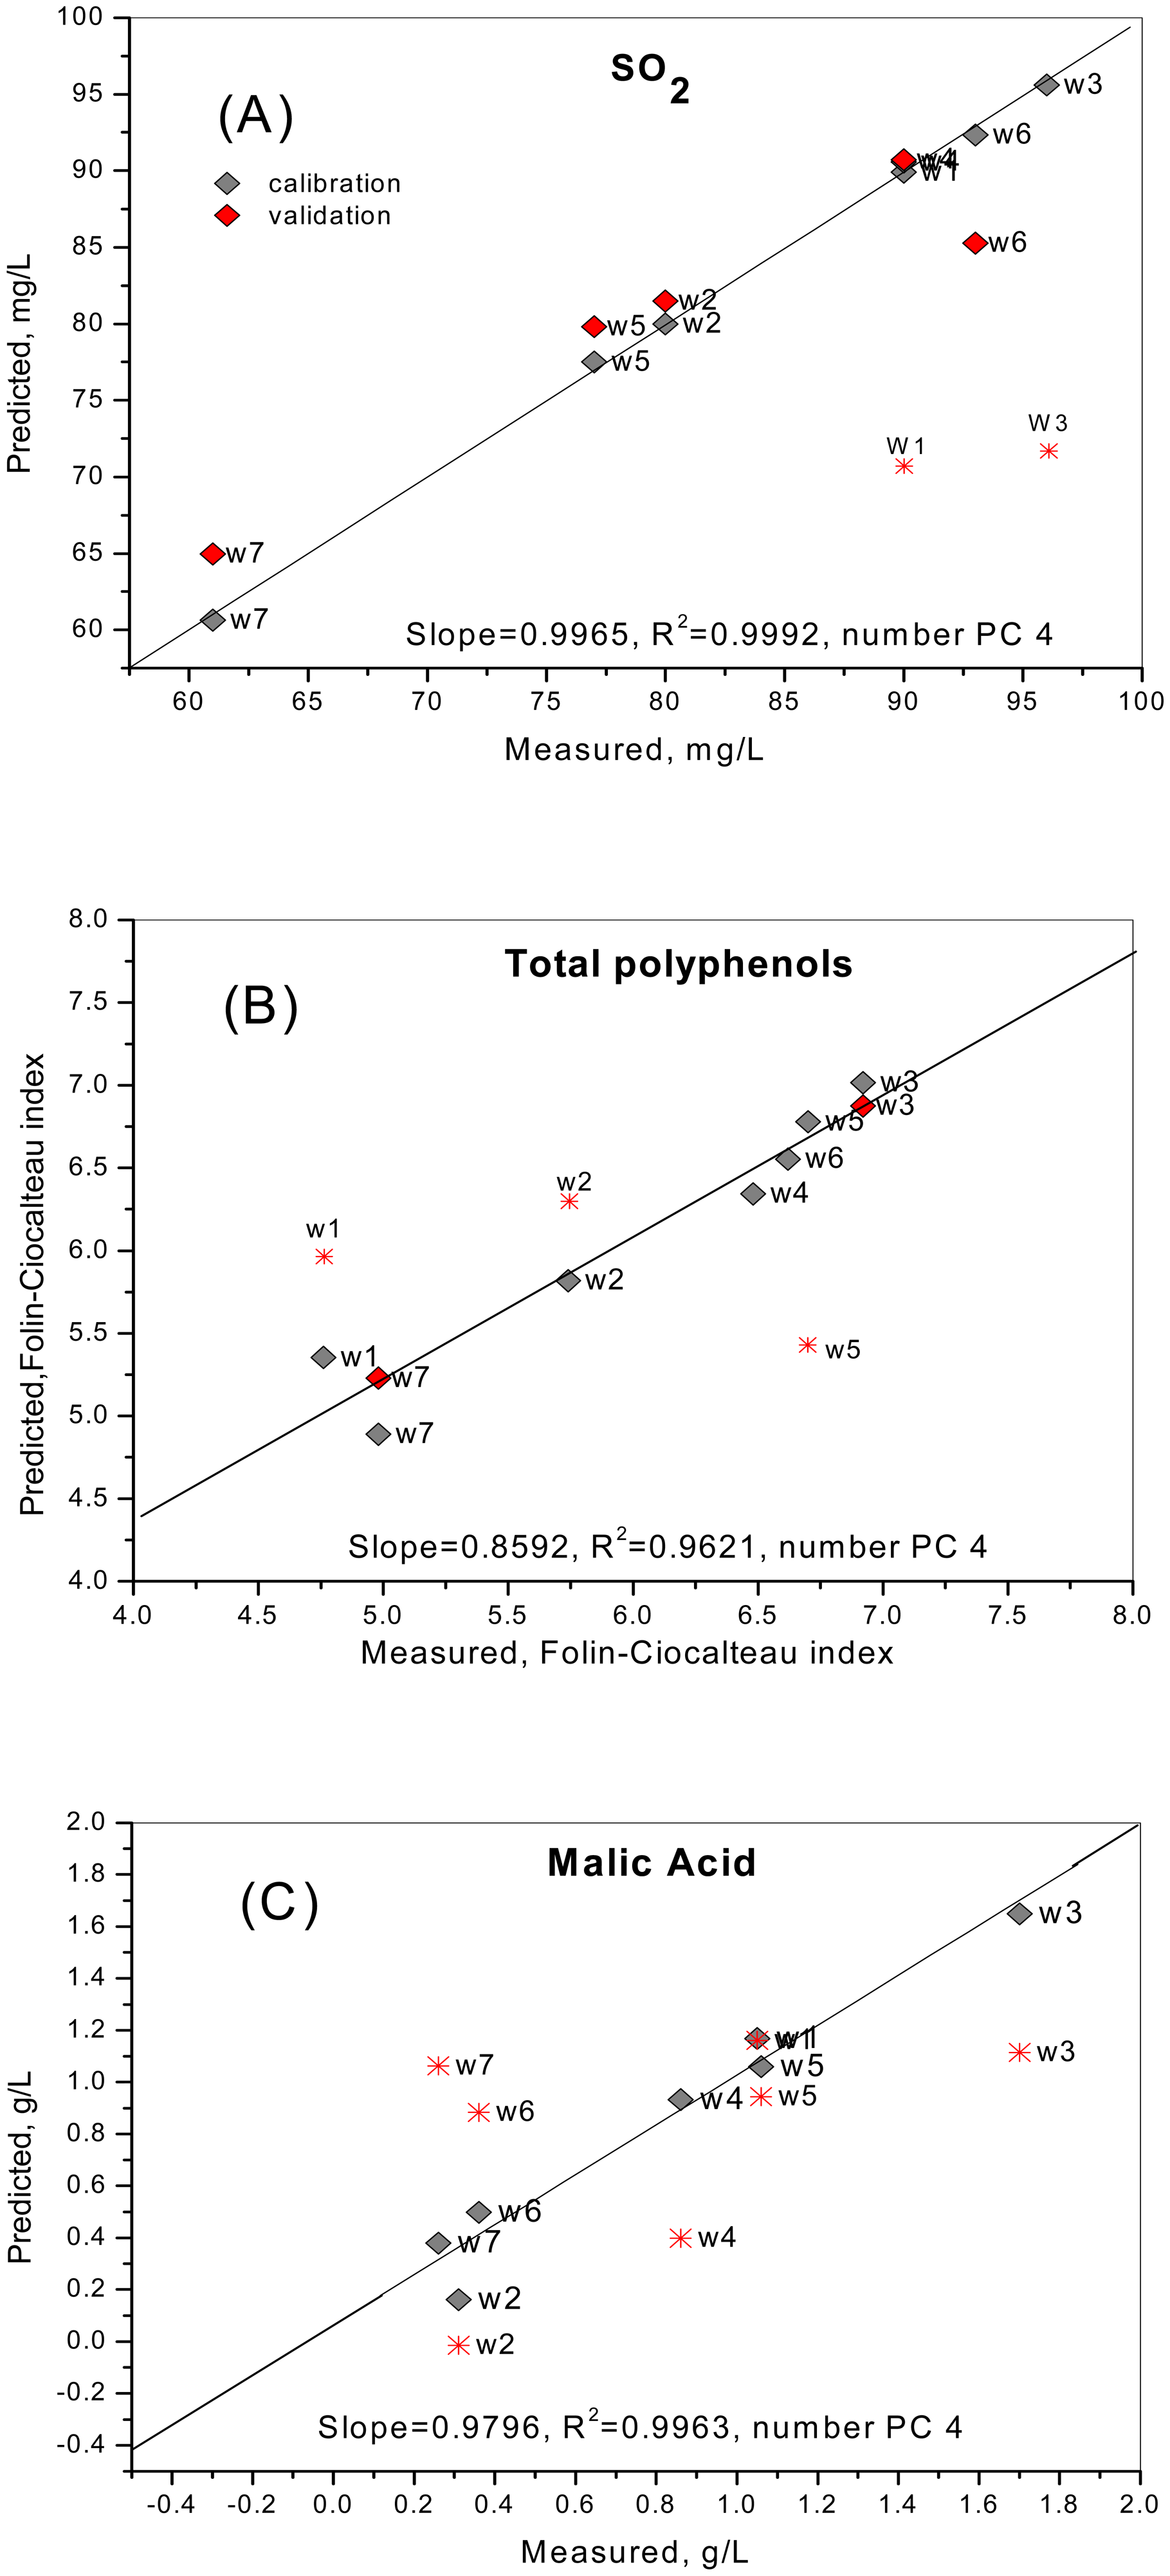
On the second stage if the study the possibility to determine the amounts of SO
2, polyphenols, malic and acetic acids in Verdicchio' dry white wines by means of metalloporphyrin-based ET system was studied. Sulphur dioxide is employed in wines as an antiseptic and antioxidant from the ancient times, but according to the nowadays legal limits for Italian wines, it should not exceed 200mg/L [
23]. Malic acid is an important parameter especially for white wines; its high amount in wine (may reach 0.5 g/100 ml) represents the cool years or regions of grapes cultivation. The phenols in wine give an astringent test, may cause the pungent odors and may indicate special flavoring or other adulterating agents added to the wine. PLS results of correlation for total dissolved SO
2, total polyphenols and malic acid content determined by ET system and compared to the values evaluated according to EEC certified analytical methods [
22],
Table 2, are shown on
Figure 3(A-C). It can be seen that a satisfactory correlation between predicted and measured values is reached in the calibration step for all tree analytes, while some deviations can be noticed in the validation phase mainly for samples NN 1, 3 and 7.
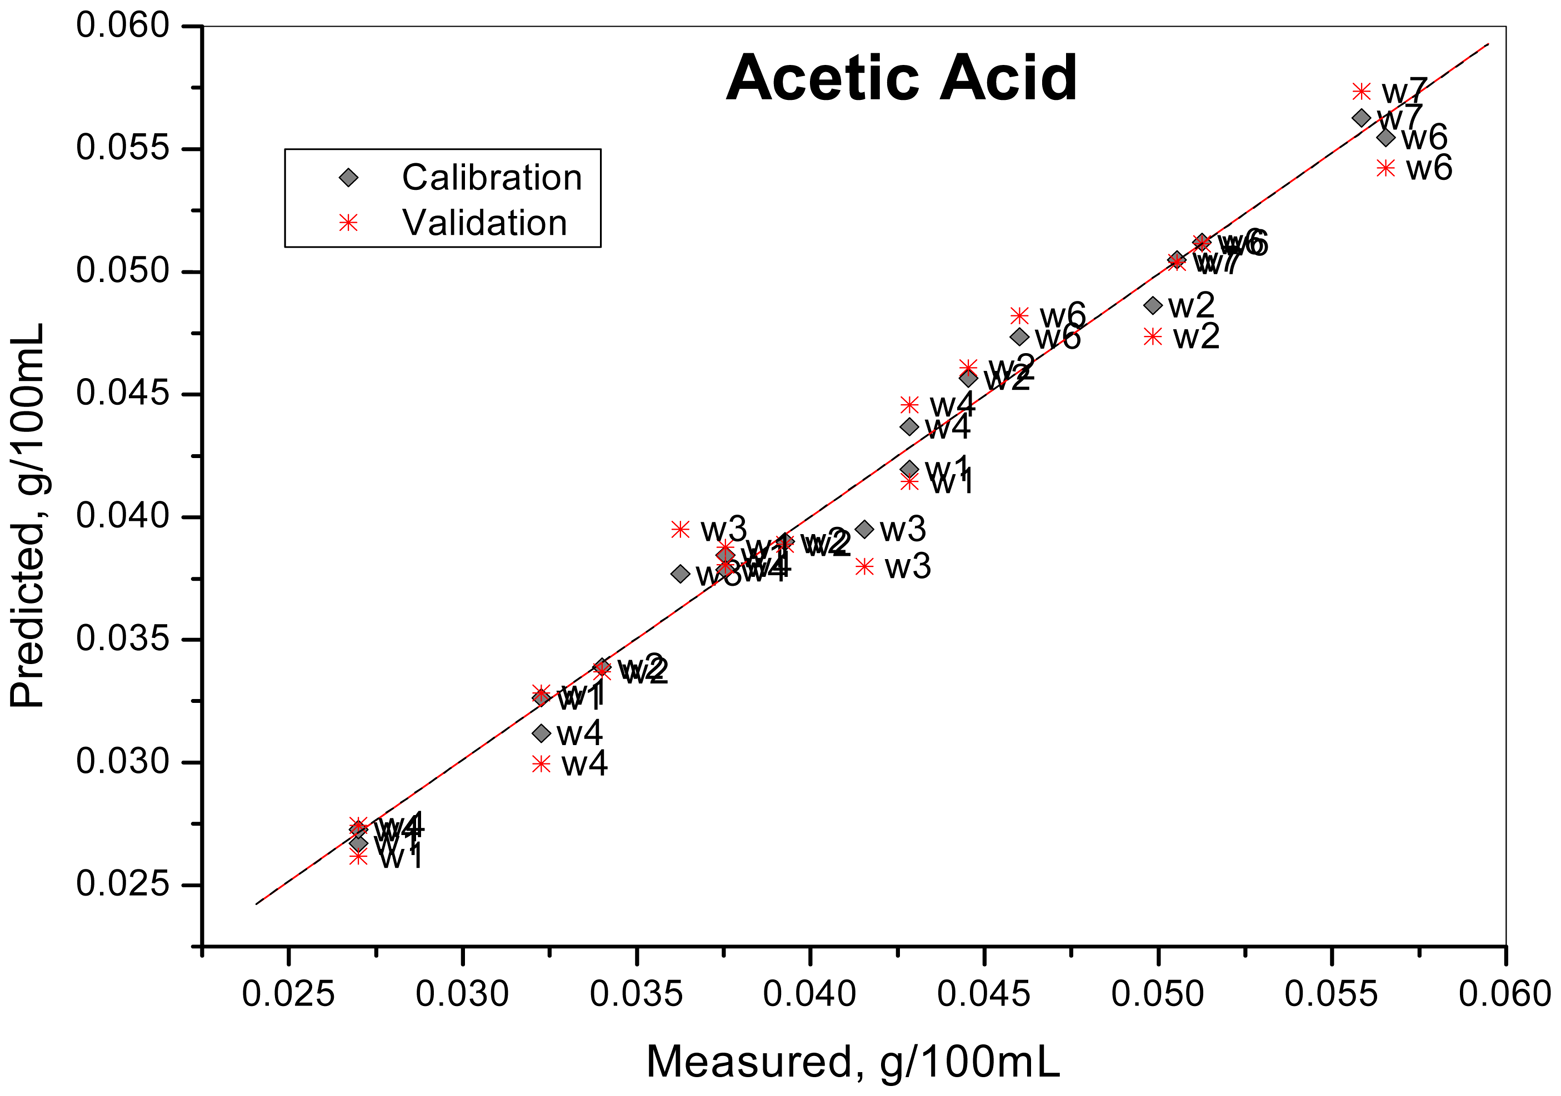
Volatile acidity (VA) is an important determination used by winemakers as wine spoilage marker; it is expressed as g acetic acid/100 ml of wine since the acetic acid is the organic acid mainly affecting VA. The VA maximum amounts permitted in white wines are 0.120, 0.110, 0.250 and 0.090 g/100ml for USA, France and Italian domestic and export market correspondingly [
22]. Small quantities of acetic acid are formed in wine during normal, bacteria-free alcoholic fermentation; normally this amount is within 0.03-0.06 g/100ml, and not noticeable to taste or smell. Once wines reach 0.07 g/100ml to just under 0.100 g/100 ml, a spoilage process becomes noticeable due to a sweet, sour vinegary smell and taste. Under this conditions the spoilage organisms, particularly
Acetobacter, are present and indicate that wine conditions may support the growth and activity of other spoilage yeast and bacteria and turn wine to vinegar. At low levels, acetic acid can enhance the flavour of a wine, while at higher levels (over 0.100 g/100ml) this flavour can dominate, and flaw the wine. That is why the accurate and rapid determination of acetic acid amount is necessary.
Acetic acid amount can be detected following the classical steam evaporation method [
23]. Moreover several sensor applications have been developed for this purpose during the last years [
24-
26]. Here we have applied porphyrin-based ET system for acetic acid content evaluation in white dry Verdicchio D.O.C. Italian wines. On the
Figure 4 the result of Multi Linear Regression (MLR) yielded a root mean square error of calibration (RMSEC) and prediction (RMSEP) values of 0.000917 and 0.001743 mg/L correspondingly which are lower then the value permitted for VA determination error recommended by EEC (0.08 g/L). The correlation coefficients for the calibration and validation were 0.9943 and 0.9799 respectively. The generated MLR calibration model was then applied to acetic acid content determination inreal Verdicchio wines. The results of prediction are given in
Table 3. As calibration models were constructed based on 10 times diluted training samples the predicted acetic acid concentrations in g/100 ml were back calculated to get the actual concentration of acetic acid in undiluted wine in g/L. As can be seen, the relative error of acetic acid content determination lies within the range 0.9 -17.5% which is satisfactory for an express monitoring of wine spoilage process initiation.
3. Experimental Section
3.1 Reagents
H
2TPP (5,10,15,20-tetraphenyl porphyrin) and related complexes with Cobalt (Co(III)TPPBr and Co(II)TPP-R) and Platinum (Pt(II)TPP and Pt(IV)TPPCl
2) were synthesized according to the literature methods [
27]. Poly(vinyl chloride) (PVC), plasticizers o-nitrophenyl octyl ether (o-NPOE), bis(2-ethylhexyl) sebacate (DOS), tris(2-ethylhexyl) phosphate (TOP), lipophilic additives potassium tetrakis(4-chlorophenyl) borate (TpClPBK) and tetra dodecylammonium chloride (TDACl), tetrahydrofurane (THF) were purchased from Fluka (Buchs, Switzerland). 2-[N-Morpholino]ethanesulforic acid (MES) and glacial acetic acid were from Sigma Chemical Co. (St. Louis, MO, U.S.A.). All aqueous solutions were prepared with distilled water; salts were obtained from Aldrich and used without further purification.
3.2 Sensors preparation and evaluation
The compositions of studied PVC solvent polymeric membranes are listed in
Table 1. Membranes of 100 mg weight were prepared according to the common procedure: 1 mg of ionophore, lipophilic additive (if needed), 33 mg of PVC were weighted on analytical balances and placed in a test-tube. All components were dissolved in 1 ml of THF, then plasticizer was added and the mixture was cast on Glassy Carbon (GC, AMEL, Italy) working electrodes. Solvent was allowed to evaporate overnight.
Potentiometric properties of freshly prepared electrodes were evaluated after at least 24 hours soaking in 0.01M NaCl solution. Potentials were measured versus double junction saturated calomel electrode (SCE, AMEL, Italy) using a PC equipped high-impedance input 8-channel A/D converter (Smartronix, Rome, ITALY). Sensors responses were examined in solutions of NaCl, NaBr, NaHCO3, NaNO3, NaNO2, NaCH3CO2, NH4Cl, Na2SO4, KI, KCl, CaCl2, MgCl2, CoCl2 and LiCl, by varying the concentration of salt in a range from 10-5M to 10-1M by stepwise addition of standard 1M stock solutions to the 0.01M TRIS-HCl pH 7.2 or 0.01M MES-NaOH pH 5.5 background every 100 sec. At least 3 replicas of every calibration were performed. pH response of membranes has been evaluated in universal buffer solution (citric acid 6.7 mM, boric acid 11.4 mM, NaH2PO4 10-2M) with initial pH 2.5 by additions of 1 M NaOH, to the pH 10.5. AMEL glass pH electrode (model 411CGG/6) was used to control pH.
Acetic acid content was determined by multiple standard addition method first approbated in artificial wine (see section 2.3 for composition details) and then in real wine samples. A 5 ml of wine sample were diluted by distilled water up to final volume of 50 ml; 3 consequent injections of 100 ul of glacial acetic acid to diluted wine sample were made and sensors potential was registered after every addition. The total content of acetic acid corrected to the final volume in training model solutions was then calculated as a sum of acetic acid in initial wine sample determined by EEC recommended method and amount of spiked acid. In total 4 solutions have been measured for every wine sample: those corresponding to the initial pure wine and wine with 3 consequent spikes of acetic acid.
3.3 Wine samples
All analyzed samples of Italian white wines were of ‘Verdicchio’ DOC quality, available in local stores (Rome, Italy); Verdicchio is a particular kind of wine produced in the middle eastern Italy, in Marche region. Following wines from nine cantinas produced in 4 subsequent years have been analysed: 1999- “San Sisto”, 13.5 vol.%; 2001 – “Monte Schiavo”, 12 vol.%; 2002 – “Casal de'Cavalieri”, 12.5 vol.%; 2002 – “Caldirola”, 12 vol.%; 2002 – “Sartarelli”, 13 vol.%; 2002 – “Fazi Battaglia”, 13 vol.%; 2003 – “Piersanti”, 12 vol.%; 2003 – “Moncaro”, 12 vol.%; 2003 – “Sant'Ignazio”, 13 vol.%.
All wines were measured immediately after opening a bottle; measurement procedure included no sample pretreatment. Initially, after open the bottle, wine was replaced in a plastic containers of 100 ml volume with a minimum headspace over the sample. A fresh portion of each wine was measured every time. Each wine sample was measured for 300 sec, potential readings were collected automatically every 2 sec. The samples were analyzed in 3 replicas in a random order; sensors were conditioned in “artificial wine” solution” (5 g/L of tartaric acid, 123 g/L of ethanol, 0.3 g/L of isobutyl alcohol, 0.06 g/L of isoamyl alcohol, pH=3.2) between measurements.
For quantitative analysis, peculiar parameters of white wines have been analysed in certified laboratory (
Institute of Agrarian Enology – “Istituuto Enologico Agrario di C. Vinciguerra&C”, Marino, RM, Italy) according to EEC recommended methods [
22] and compared by regression methods with response of sensor array. The determined parameters were as follows: alcoholic degree, volatile acidity, SO
2, L-Malic Acid, L-Lactic Acid and Total Polyphenols content (
Table 2).
3.3 Data processing
Principle component analysis (PCA) was applied for wines identification. Partial Least Regression (PLS) method was applied in order to correlate ET system output with results received by certified methods; data were used without any preprocessing and scaling. Validation was performed using either cross-validation or test set validation (especially for classification task). The RMSEP (Root Mean Square Error of Prediction), slope and correlation coefficient of predicted versus measured correlation line was used to evaluate the efficiency of applied regression model.
Data treatment was performed with commercial Unscrambler (v. 9.1, 2004, CAMO PROCESS AS, Norway) and Matlab (V.7.0.4, MathWorks, USA) software.

 and
and 


