Statistical Modeling of Spatio-Temporal Variability in Monthly Average Daily Solar Radiation over Turkey

1
Department of Environmental Engineering, Abant Izzet Baysal University, Golkoy Campus, 14280 Bolu, Turkey
2
Department of Agricultural Machinery, Faculty of Agriculture, Akdeniz University, Antalya, Turkey
*
Author to whom correspondence should be addressed.
Sensors 2007, 7(11), 2763-2778; https://doi.org/10.3390/s7112763
Submission received: 31 October 2007
/
Accepted: 14 November 2007
/
Published: 15 November 2007
Abstract
:Though one of the most significant driving forces behind ecological processes such as biogeochemical cycles and energy flows, solar radiation data are limited or non-existent by conventional ground-based measurements, and thus, often estimated from other meteorological data through (geo)statistical models. In this study, spatial and temporal patterns of monthly average daily solar radiation on a horizontal surface at the ground level were quantified using 130 climate stations for the entire Turkey and its conventionally-accepted seven geographical regions through multiple linear regression (MLR) models as a function of latitude, longitude, altitude, aspect, distance to sea; minimum, maximum and mean air temperature and relative humidity, soil temperature, cloudiness, precipitation, pan evapotranspiration, day length, maximum possible sunshine duration, monthly average daily extraterrestrial solar radiation, and time (month), and universal kriging method. The resulting 20 regional best-fit MLR models (three MLR models for each region) based on parameterization datasets had R2adj values of 91.5% for the Central Anatolia region to 98.0% for the Southeast Anatolia region. Validation of the best-fit MLR models for each region led to R2 values of 87.7% for the Mediterranean region to 98.5% for the Southeast Anatolia region. The best-fit anisotropic semi-variogram models for universal kriging as a result of one-leave-out cross-validation gave rise to R2 values of 10.9% in July to 52.4% in November. Surface maps of monthly average daily solar radiation were generated over Turkey, with a grid resolution of 500 m × 500 m.
1. Introduction
Solar radiation is one of the most significant driving variables that trigger changes in ecological processes such as biogeochemical cycles and energy flows [1-3]. The rate of total (both direct and diffuse) incoming solar energy on a horizontal plane at the earth's surface is referred to as global solar radiation and mathematically expressed as follows:
where SRg: global radiation on a horizontal surface; SRd: diffuse radiation; SRdb: direct beam radiation on a surface perpendicular to the direct beam; and z: Sun's zenith angle. Direct solar radiation is usually measured by a pyrheliometer, while global and diffuse solar radiation is measured by ground-based pyranometers [4]. However, solar radiation data are often estimated from statistical models, and remotely-sensed data for areas where there are limited or non-existent conventional ground-based measurements.
Satellite-derived solar radiation data provide coverage over large regions of 100 to 10,000 km2, with relatively long time intervals and are generally derived from such sensors as the geostationary Earth radiation budget satellites (GERBS), the geostationary operational environmental satellites (GOES), geostationary meteorological satellites (GMS), and NOAA-AVHRR (Advanced Very High Resolution Radiometer) [5-10]. Ground-based observation data are one point-measured data for relatively short time intervals. (Geo)statistical models can produce a reliable solar radiation database at the local-to-global scales for a given spatio-temporal range from a single variable (e.g. day length) or multiple variables (e.g. elevation, temperature, and evapotranspiration) [2,4,11-14].
This study aims at national and regional quantifications of spatial and temporal patterns of monthly average daily solar radiation on a horizontal surface at the ground level through multiple linear regression (MLR) and semi-variogram models.
2. Materials and Methods
2.1. Statistical Performance Indicators and Validation of National and Regional MLR Models of Daily Solar Radiation
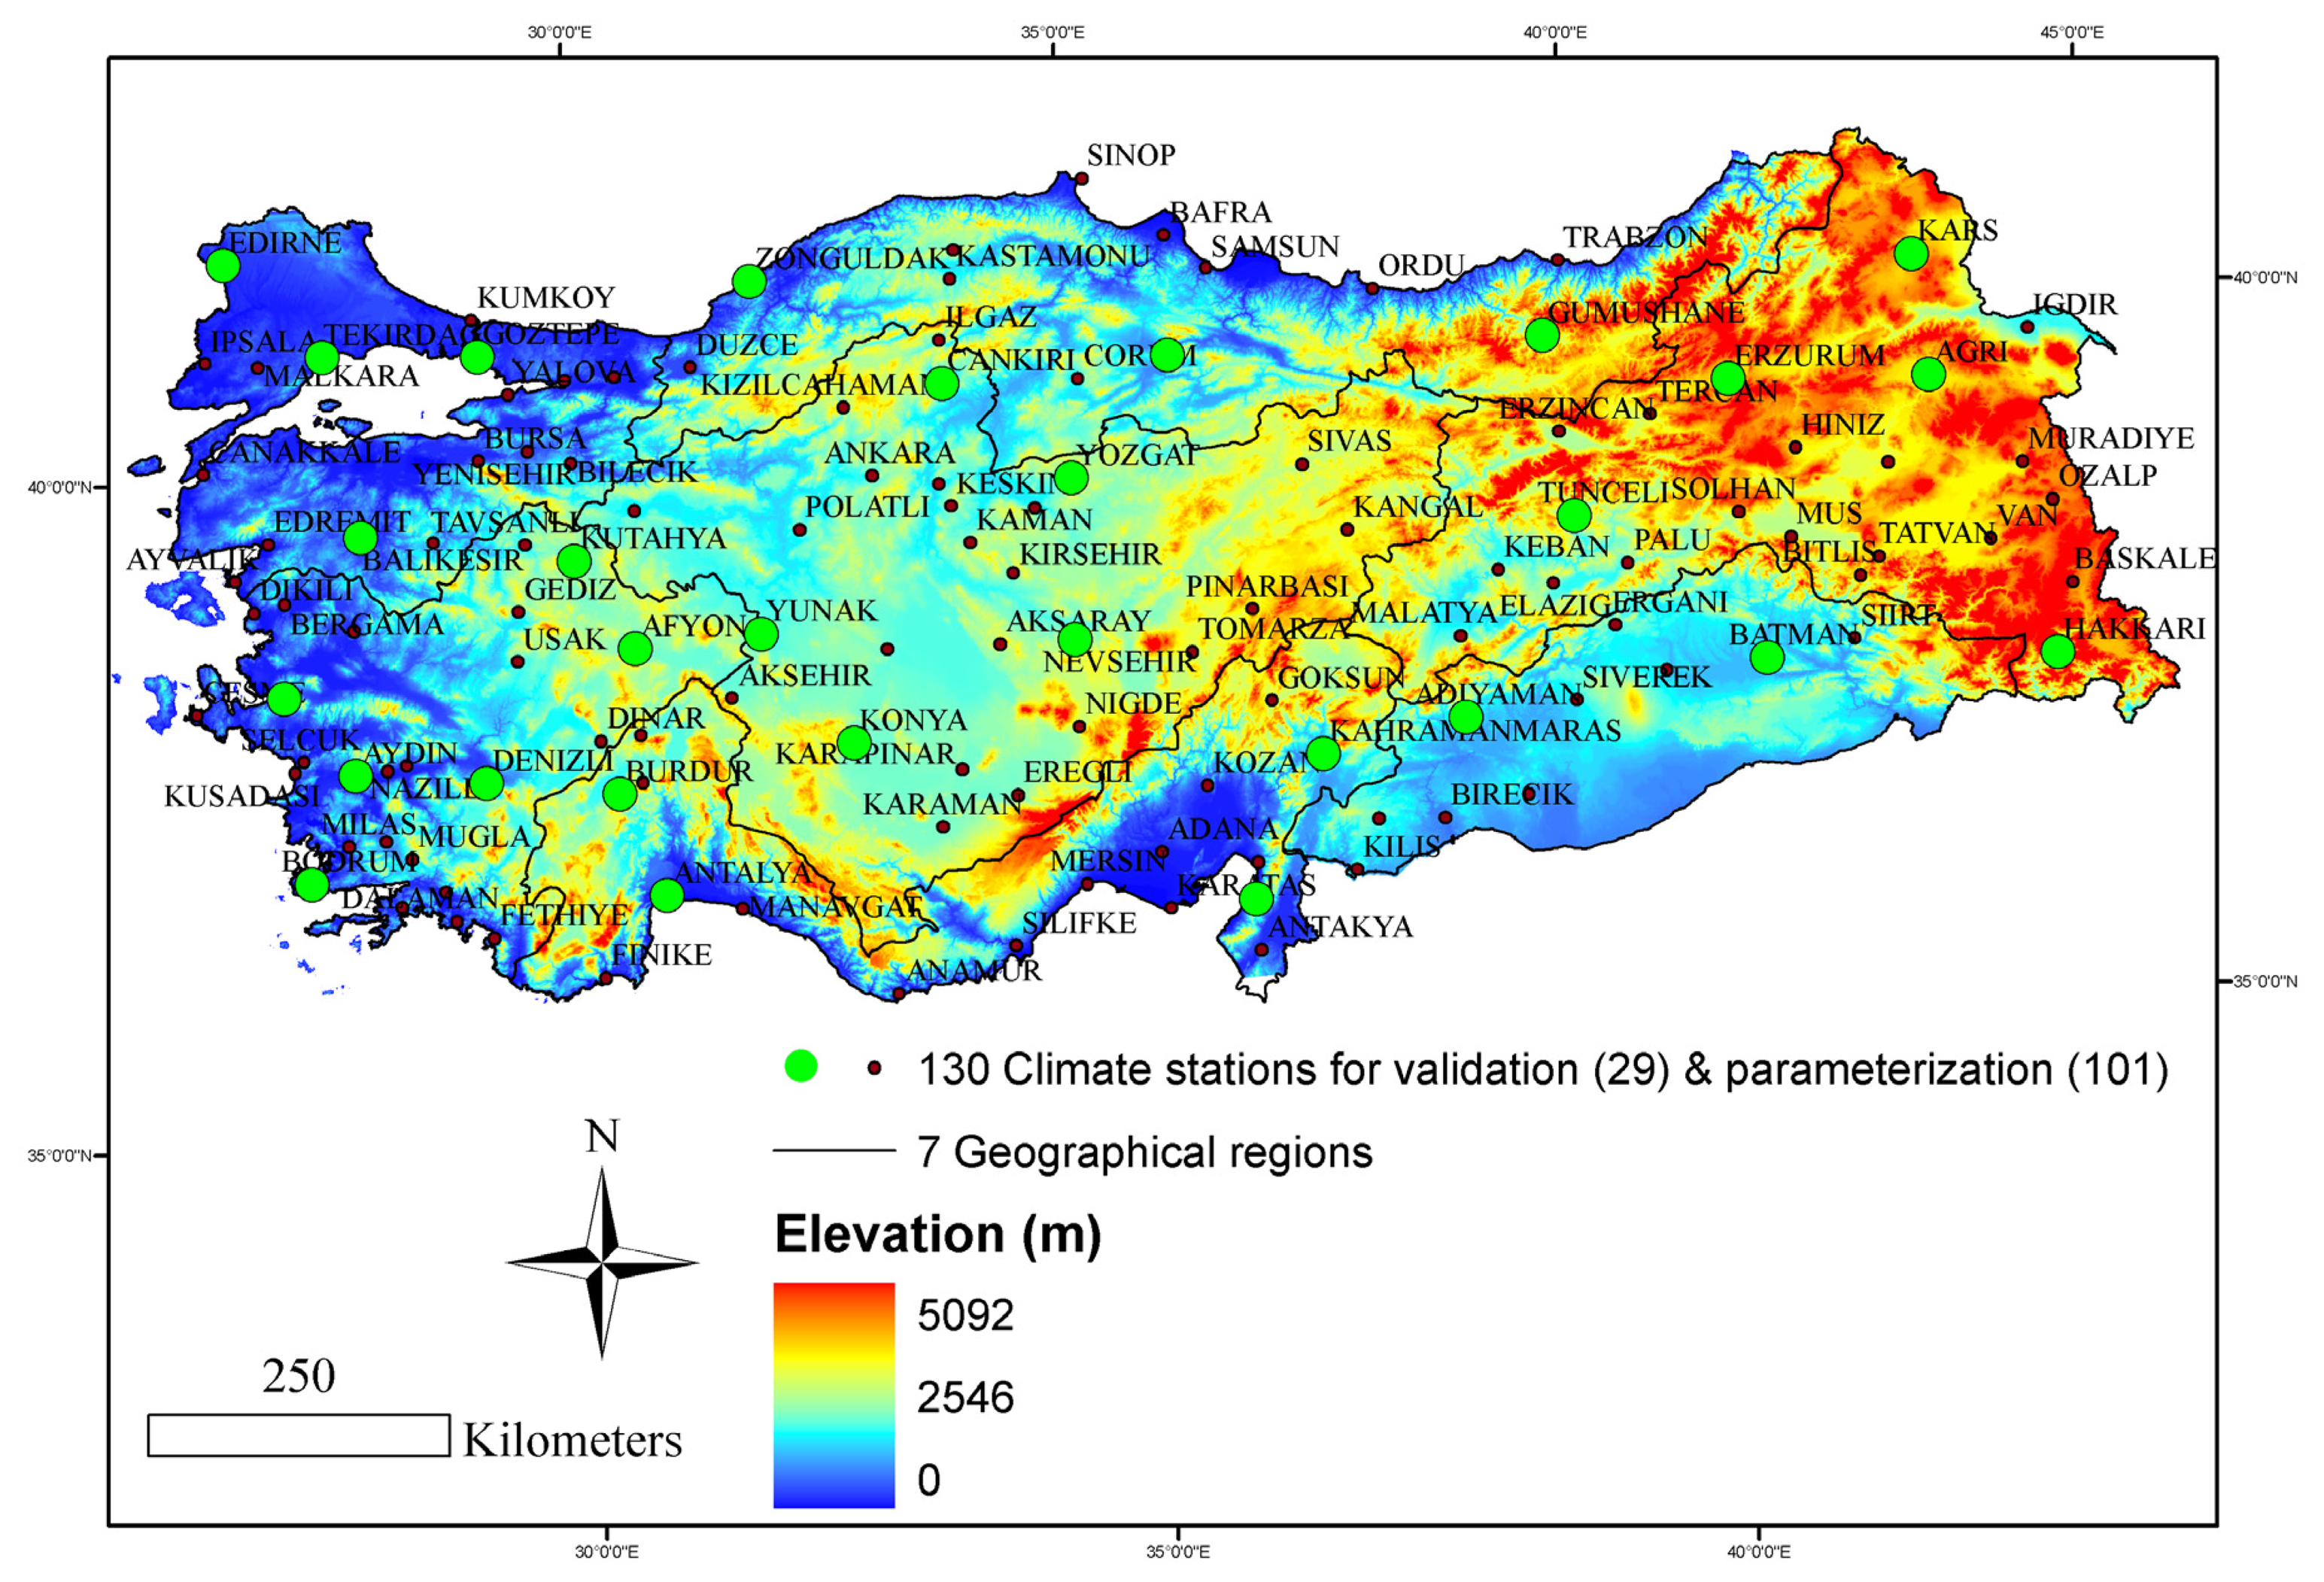
The MLR models were based on five geographical variables of latitude (decimal degree), longitude (decimal degree), altitude (m), aspect (compass degree), and distance to sea (DtS, km); 11 monthly-observed climate variables of minimum, maximum and mean air temperature (Tmin, Tmax and T, °C) and relative humidity (RHmin, RHmax and RH, %), soil temperature (ST, °C at the depth of 0 to 5 cm), cloudiness (CLD, %), precipitation (PPT, mm), pan evapotranspiration (PET, mm), and day length (S, h); two monthly-derived climate variables of maximum possible sunshine duration (So, h), and monthly average daily extraterrestrial solar radiation (Ho, MJ m-2 day-1); and time (month) for the entire Turkey and its conventionally-accepted seven geographical regions (Mediterranean, Aegean Sea, Black Sea, Central Anatolia, East Anatolia, Southeast Anatolia, and Marmara). Monthly climate variables were acquired between 1968 and 2004 from 130 climate stations across Turkey through the Turkish State Meteorological Service. Based on the Jackknifing procedure, the dataset was randomly divided into independent parameterization and validation datasets, so as to make the ratio of number of climate stations of validation dataset to those of parameterization dataset equal to or greater than 25% for each region and the entire country (Figure 1).
Through the parameterization datasets for each region and the entire country, best MLR models with site-specific explanatory variables and parameters were determined. Three optimum MLR models were recommended for each region and the entire country based on a forward stepwise selection. In forward stepwise selection, each variable that is not already in the model is tested for inclusion one at a time in the model. The most significant ones of these variables are added to the model provided that their P values ≤ 0.001 pre-set in this study. In this approach, variables once entered in the model may be dropped if they are no longer significant as other variables are added.
The degree of model accuracy, and thus, comparative performances of MLR models were quantified using the following four statistical indicators: (1) coefficient of determination (R2, %); (2) the adjusted coefficient of determination (R2adj, %); (3) the root mean square error (RMSE, MJ m-2 day-1); and (4) Mallows's Cp statistic [15]. The coefficient of determination (R2) is the proportion of variation in a response variable explained by a regression model, while the adjusted coefficient of determination (R2adj) is the coefficient of determination modified to account for the number of explanatory variables added to a model and sample size. The R2 and R2adj are calculated as follows:
where SRp, SRo, and SRm are the predicted, observed and mean values of the response variable, monthly average daily solar radiation, respectively. p is the total number of explanatory variables, and n is sample size.
The RMSE reveals the level of scatter that a model produces and provides a comparison of the absolute deviation between the predicted and observed values. The lower the RMSE values are, the better a model is indicated to perform. The RMSE can be calculated as follows:
Mallows's Cp statistic is mathematically expressed as follows:
where SSres is the residual sum of squares for the best model with p (the number of parameters in the model) (including the intercept). MSres is the residual mean square when using all available explanatory variables. If the model fits the data well, then Cp value is expected to be approximately equal to p. Models with considerable lack-of-fit have values of Cp larger than 2p [16].
Three optimum MLR models chosen for each region and the entire country with the forward stepwise selection were tested comparing observed versus predicted values of daily solar radiation through the validation datasets. The degree of model fit between observed versus predicted values of daily solar radiation was quantified using R2 values (%).
2.3. Construction and Cross-Validation of National Geo-statistical Model of Daily Solar Radiation
The surface maps of monthly average daily solar radiation were created for the entire Turkey of 780,580 km2 with a grid resolution of 500 m × 500 m using 130 weather stations using the ArcGIS 9.1 [17]. The assumption of spatial autocorrelation for daily solar radiation data from 130 climate stations was verified by examining Moran's Index (I) values and their statistical significance as an indicator of the strength of correlation between observations as a function of the distance separating them [18]. The values of Moran's I range from 1 to -1 (strong positive and negative spatial autocorrelations, respectively), with 0 indicating a random pattern. To satisfy stationarity assumption prior to the spatial interpolation, trend analysis was performed to determine whether or not a global trend, an overriding process that affects all observed data in a deterministic manner, exists. Detrending was implemented by removing first order trends from all the semi-variogram models and adding back before predictions were made in order to more accurately model the random short-range variation in monthly average daily solar radiation over Turkey. Directional influences (anisotropy) detected in the spatial autocorrelation were accounted for in the semi-variogram models. Spatial interpolation was carried out using universal kriging method, and thus, a semi-variogram model that defines variance as a function of distance and direction as follows [19]:
where γ(h) is the semi-variance of variable z as a function of both lag distance or separation distance (h); N(h) is the number of observation pairs of points separated by h used in each summation; and z(xk) is the random variable at location xk.
The selection of the best-fit semi-variogram model was based on the six error statistics of leave-one-out cross-validation: (1) the mean prediction error (MPE), (2) the root mean square prediction error (RMSPE), (3) the average kriging standard error (AKSE), (4) the mean standardized prediction error (MSPE), (5) the root mean square standardized prediction error (RMSSPE), and (6) R2 as follows:
where zok is the observed value at location k, zpk is the predicted value at k through the ordinary kriging method, N is the number of pairs of observed and predicted values, and σ(k) is the prediction standard error for location k.
As an indicator of prediction errors, the MPE and MSPE values reveal the degree of bias in model predictions and should be close to zero. In the assessment of uncertainty (variability in predictions), the RMSPE and AKSE values show the precision of prediction and should be equal to one another. Overestimation and underestimation of variability in predictions occur when the AKSE > and < the RMSPE, respectively. The RMSSPE values provide comparison of the error variance to the kriging variance and should be close to unity. Underestimation and overestimation occur when the RMSSPE values > and < unity, respectively [20].
3. Results and Discussion
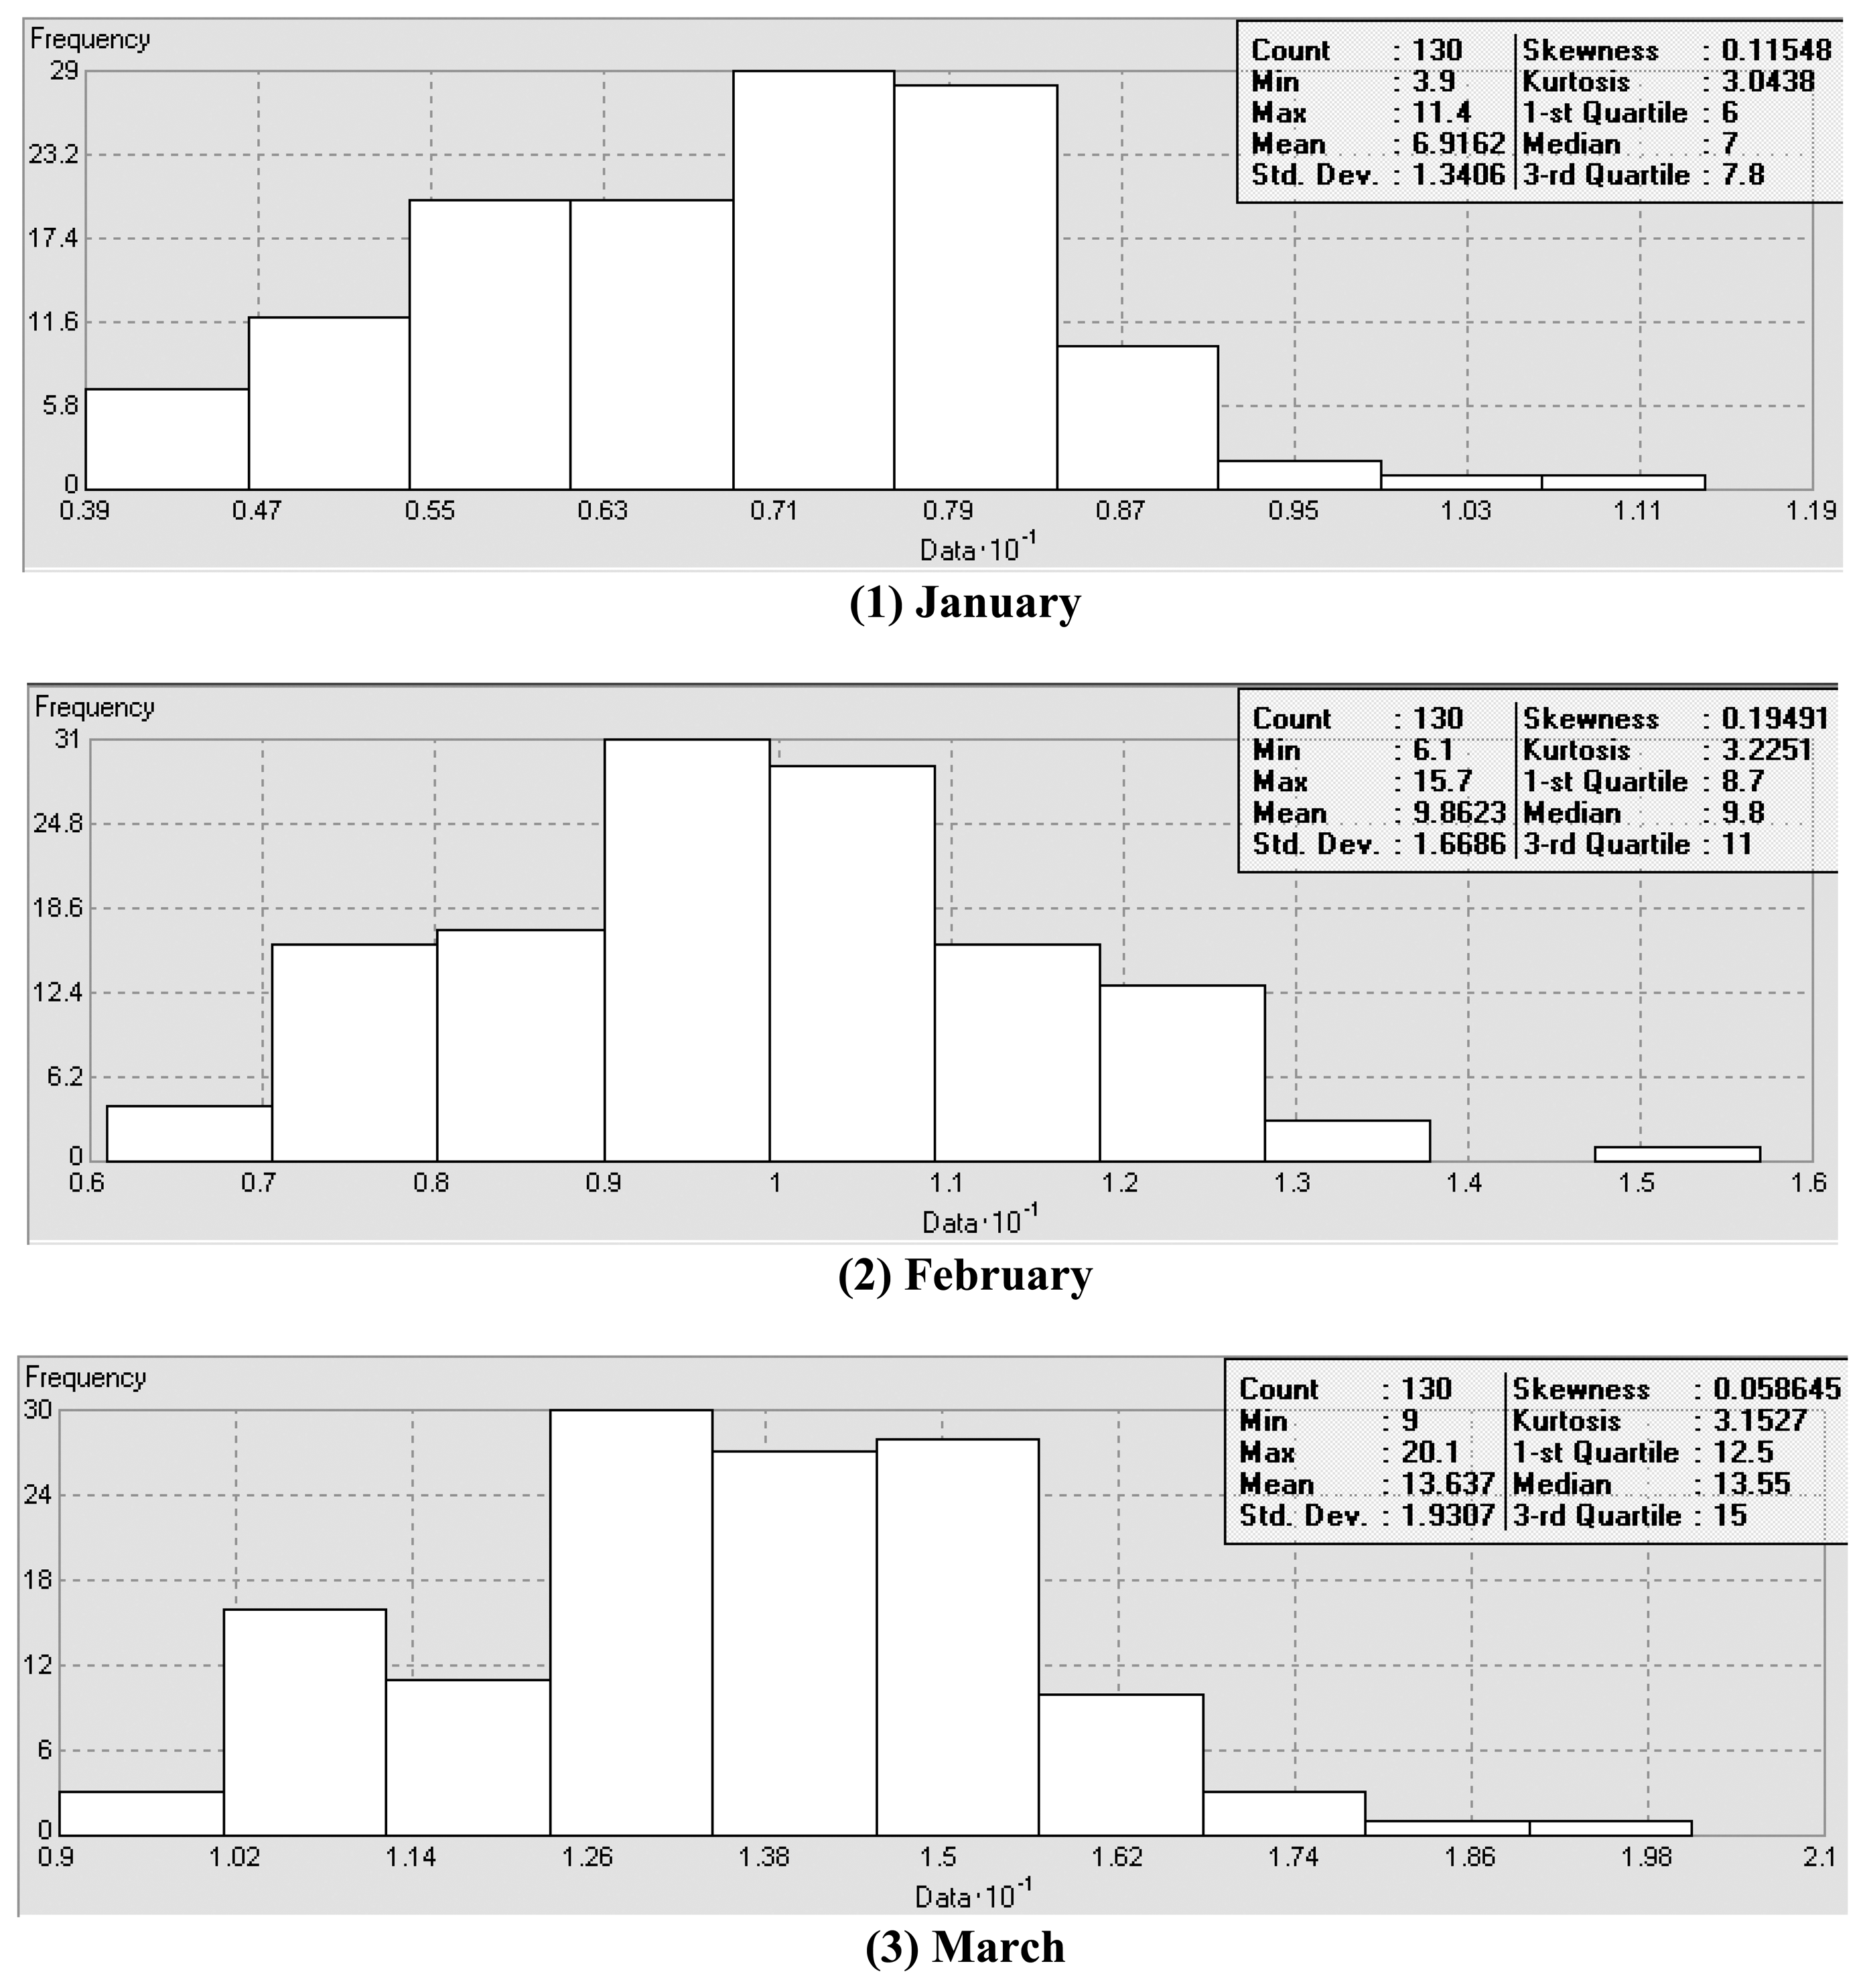
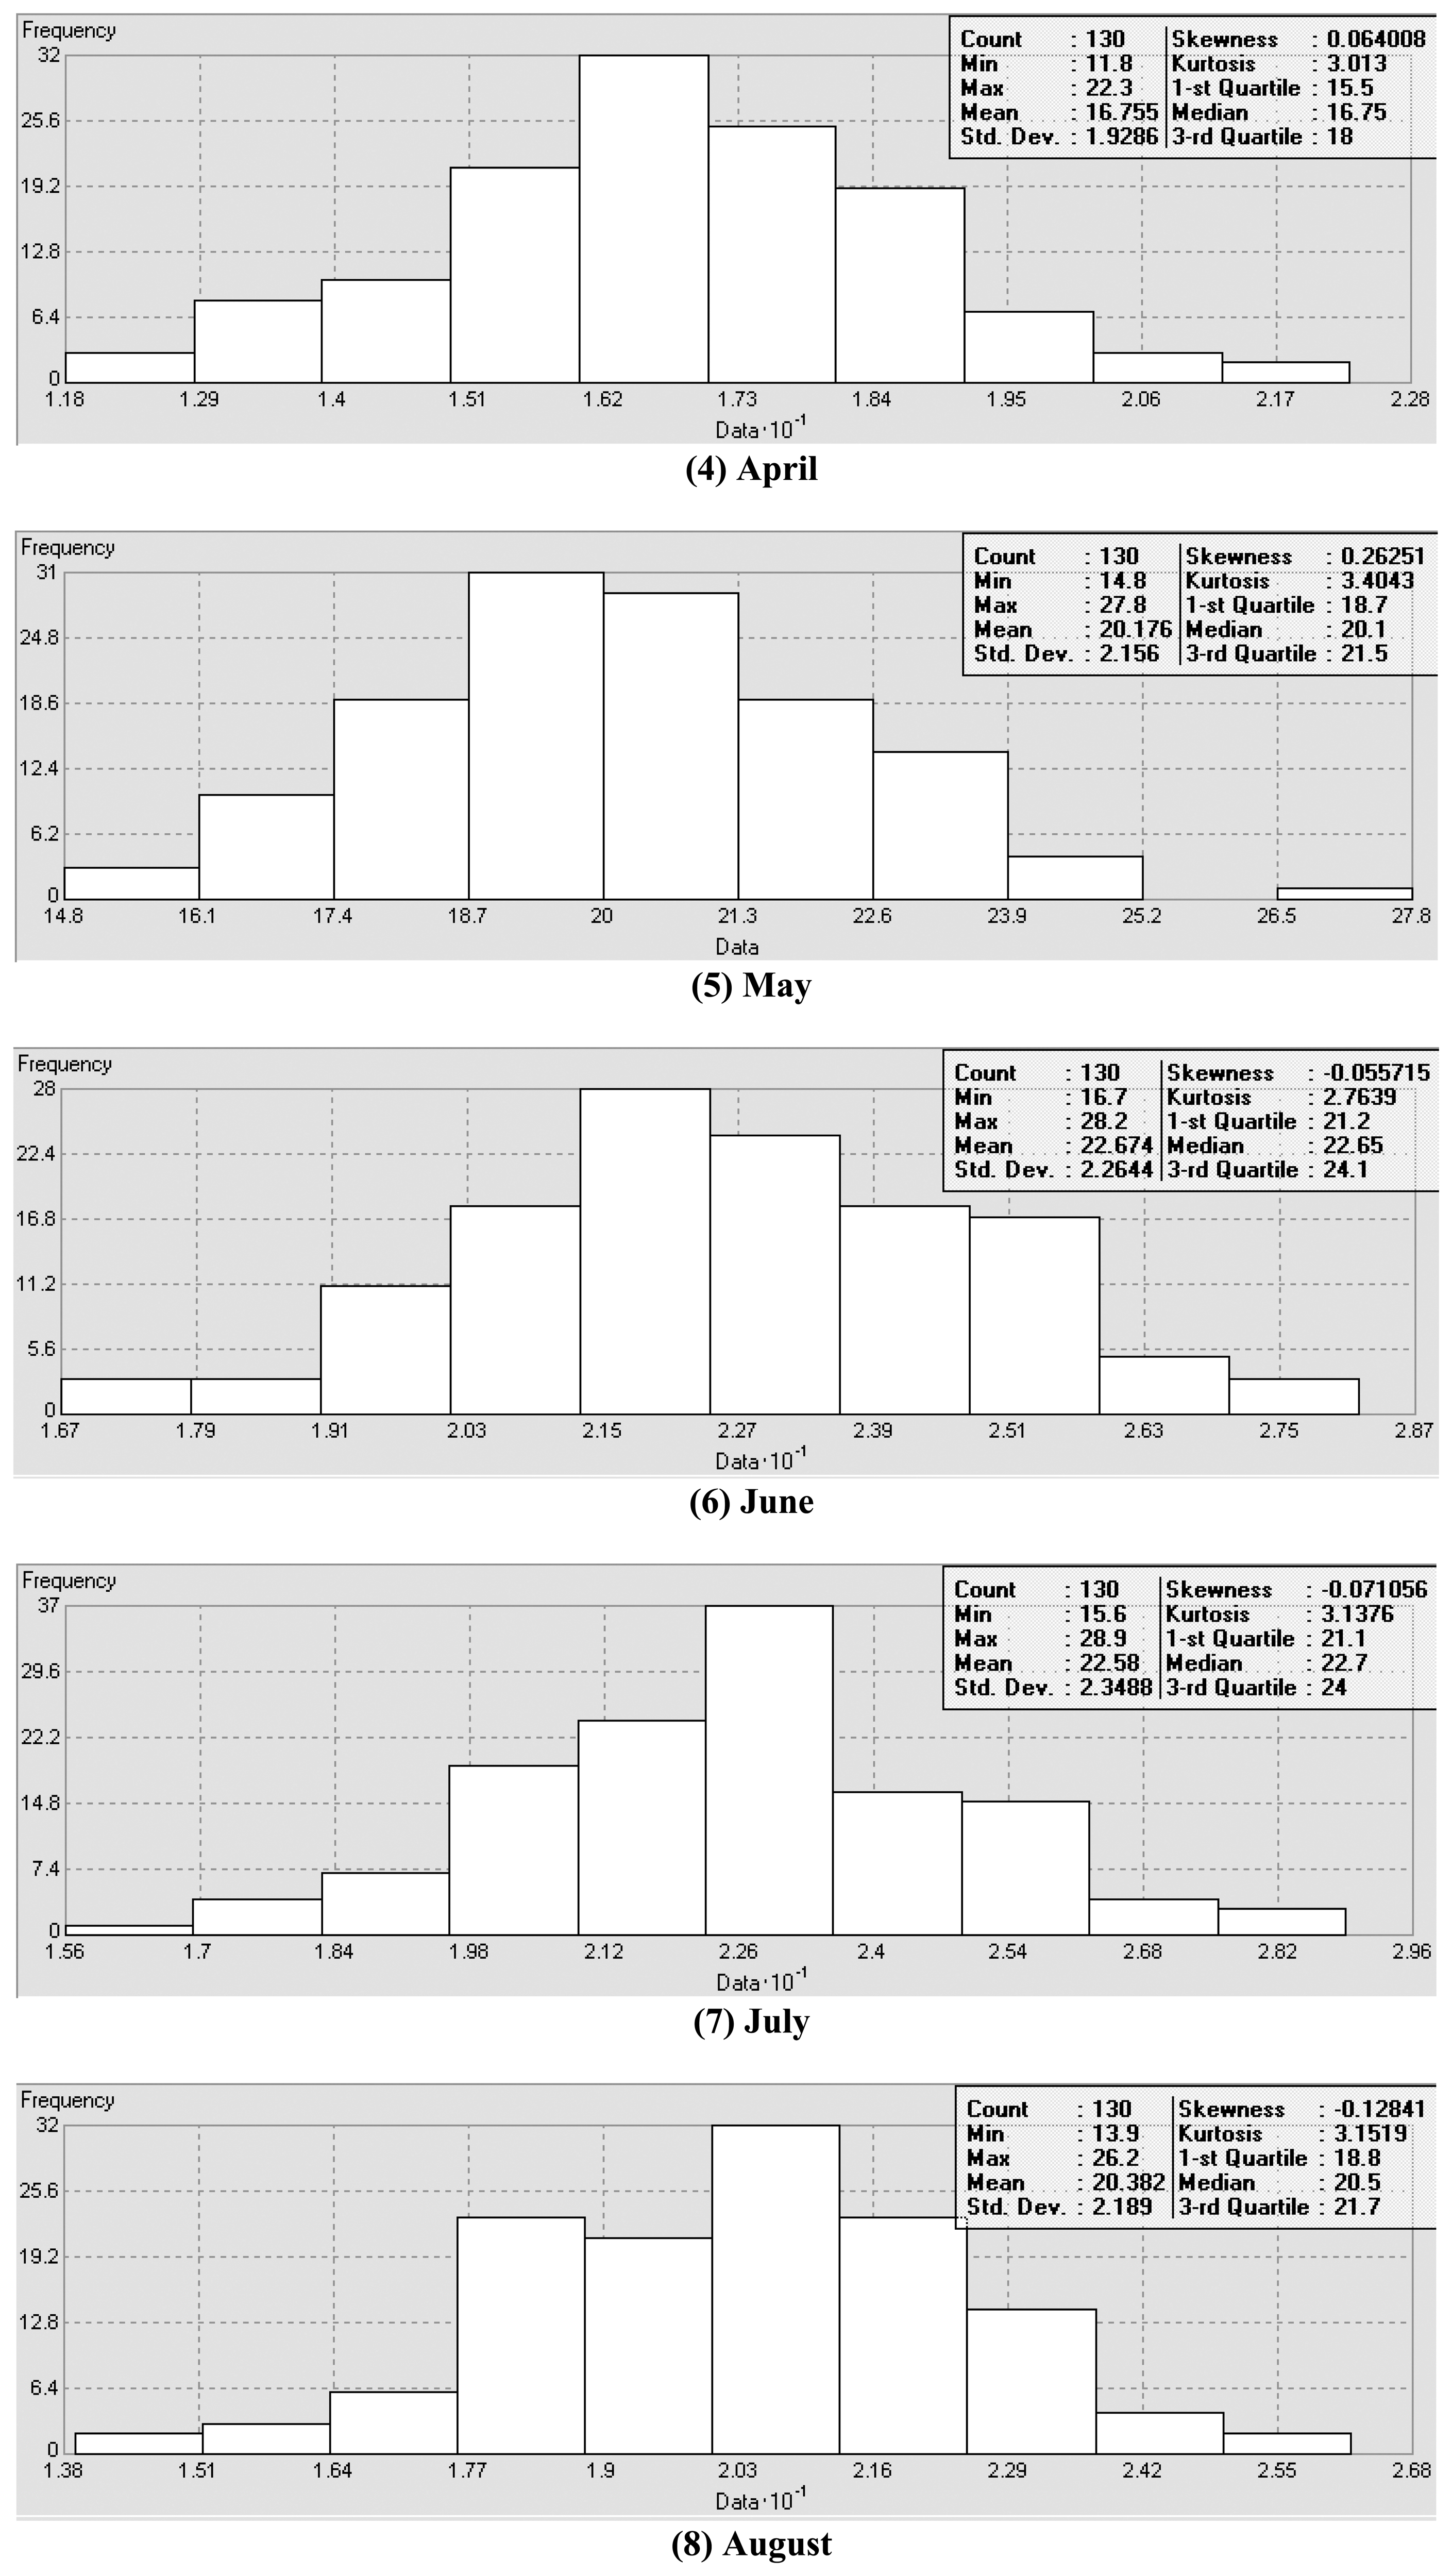
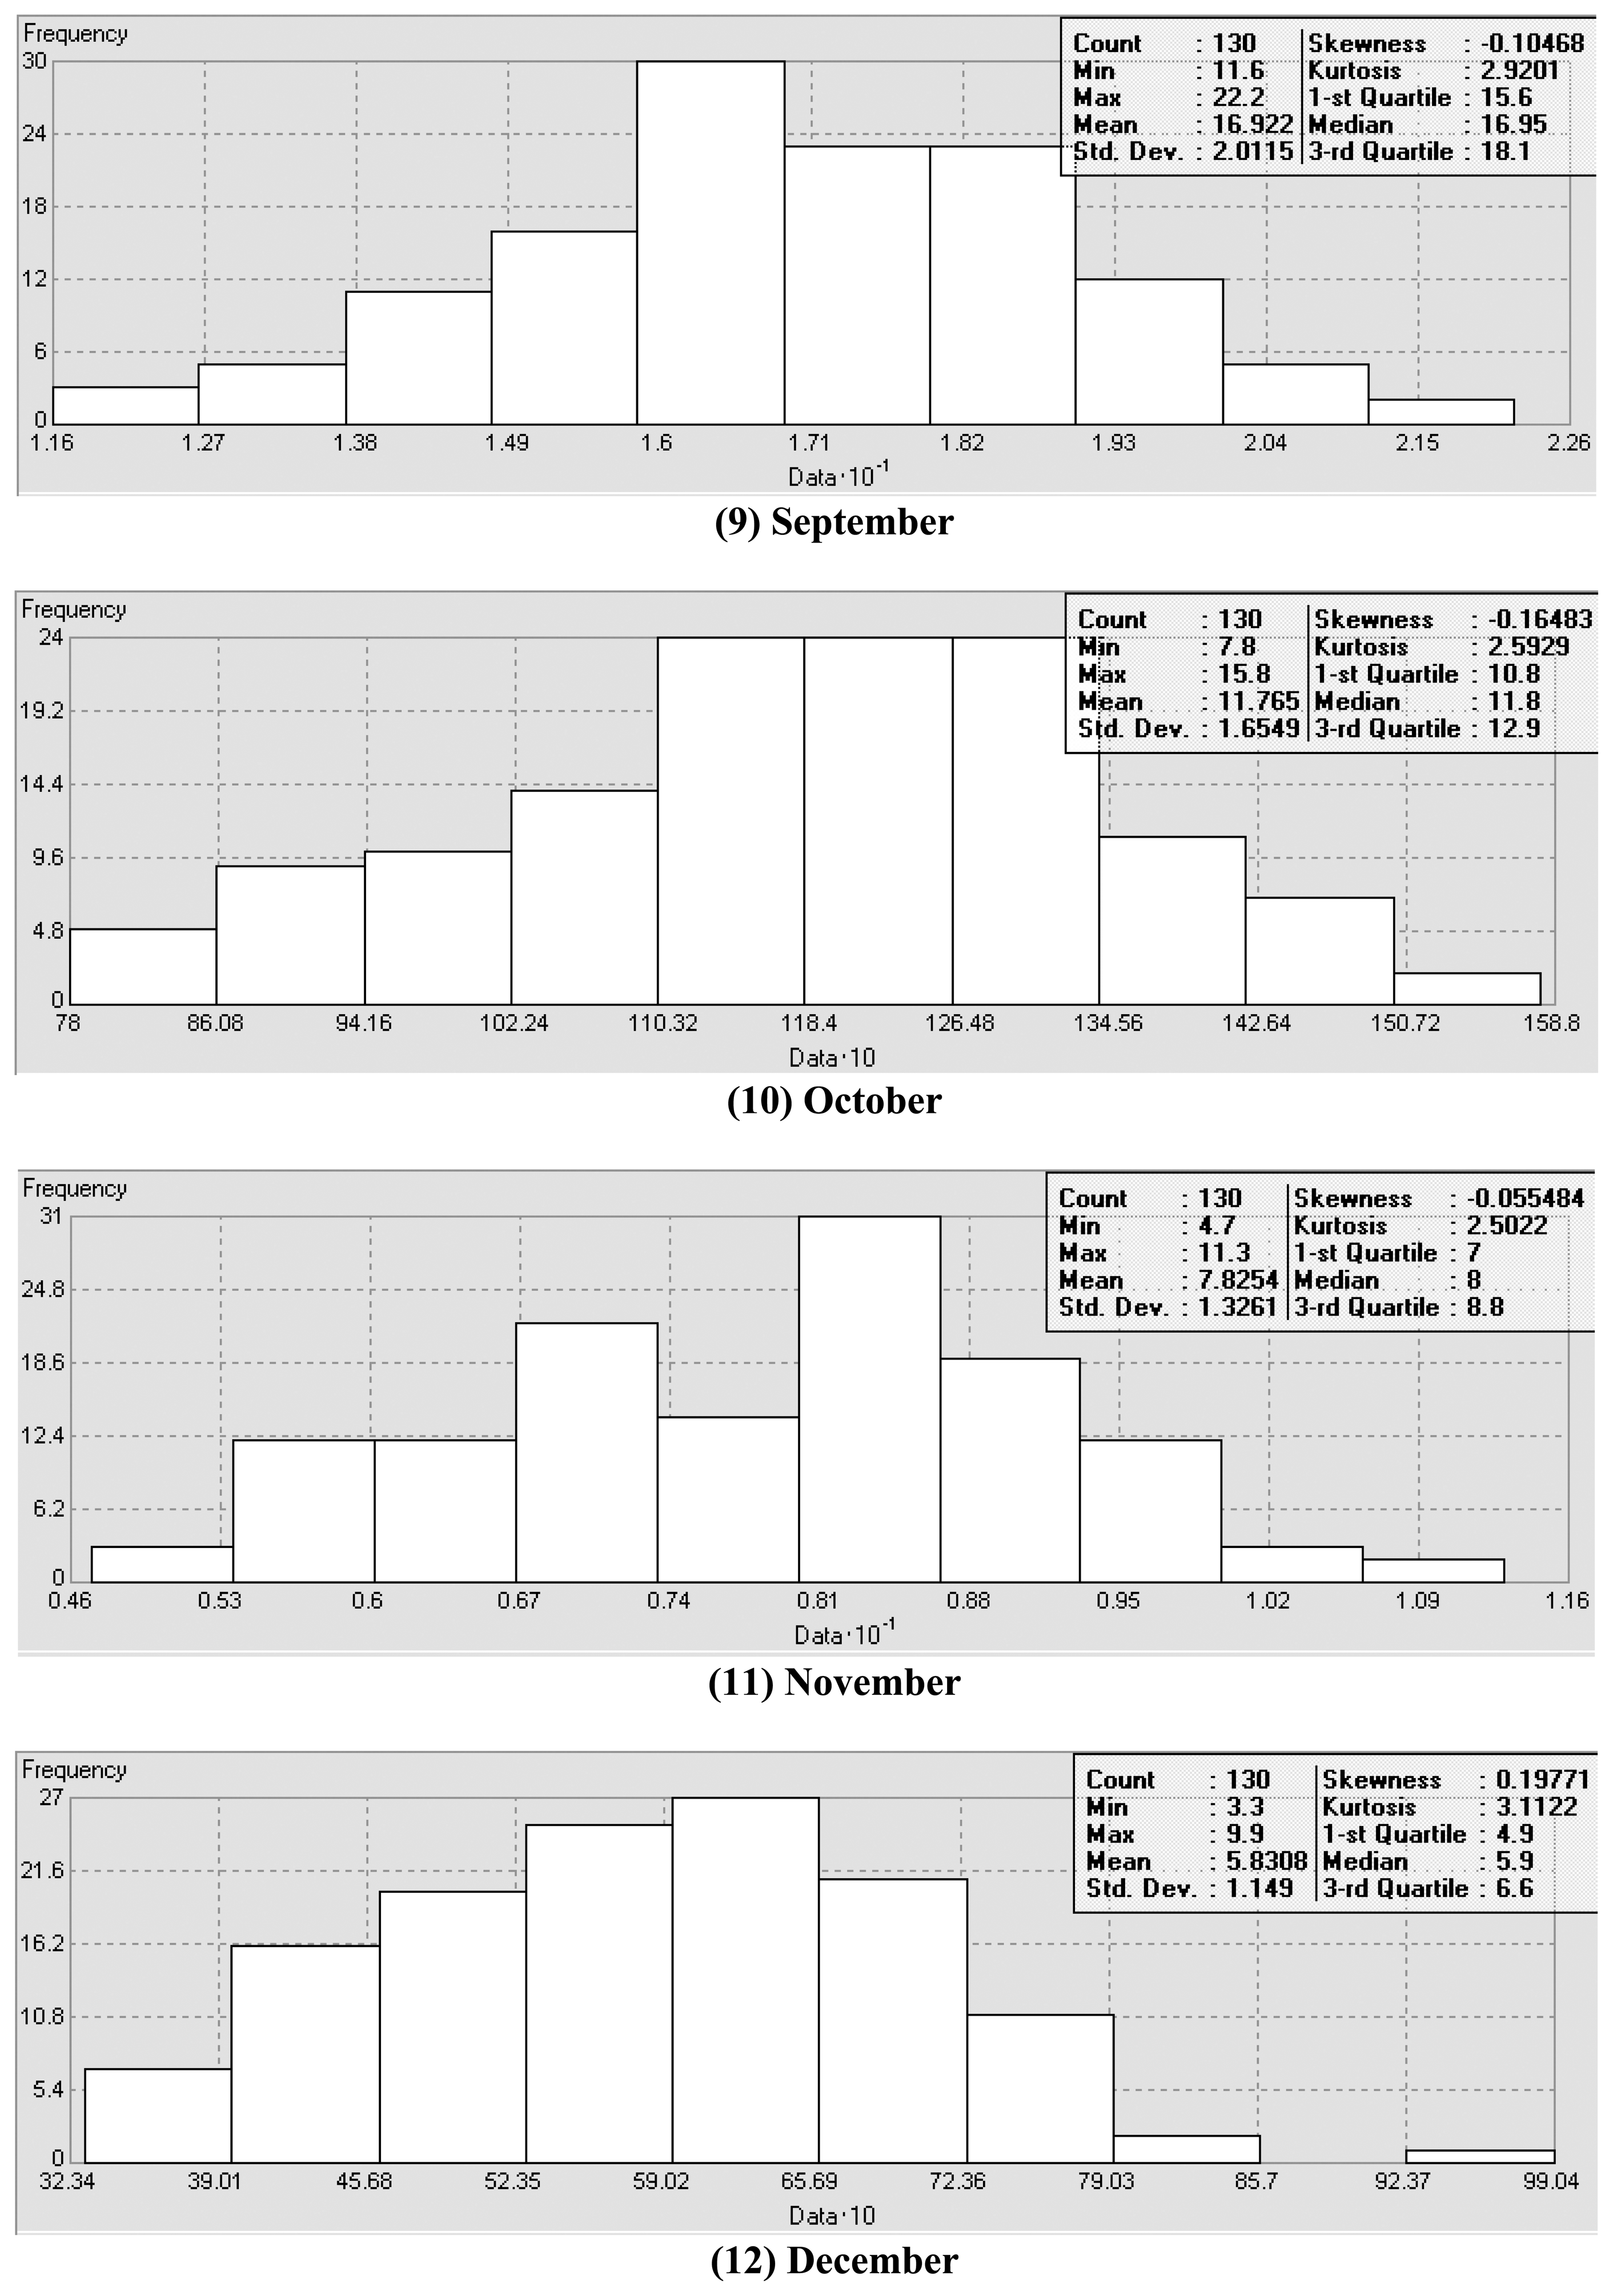
Monthly average daily solar radiation data for each month in Turkey were revealed to follow Gaussian distribution given their histogram plots and closeness of their mean and median values in Figure 2. On average, daily solar radiation ranged from 5.8 ± 1.1 MJ m-2 day-1 in December to 22.6 ± 2.2 MJ m-2 day-1 in June in Turkey. Three best-fit MLR models for each geographical region of Turkey, and their validation against the independent datasets were presented in Table 1. A total of the 20 regional MLR models resulted in R2adj values that accounted for 91.5% of variation in the solar radiation data for the Central Anatolia region and for 98.0% for the Southeast Anatolia region. Similarly, the RMSE values of the MLR models ranged from 0.89 in the Southeast Anatolia region to 1.86 in the Central Anatolia region.
The frequency of presence of the explanatory variables in the regional MLR models was found in decreasing order as follows: Ho(S/So) (100%), PET (55%), CLD (55%), ST (45%), S (40%), RHmax (25%), aspect (25%), PPT (15%), elevation (15%), Tmax (15%), RH (5%), RHmin (5%), DtS (5%), latitude (0%), longitude (0%), mean and minimum air temperature (0%), and time (month) (0%). Monthly PPT and Tmax played a significantly important role only in the MLR models of the Mediterranean and Aegean regions, respectively (P ≤ 0.001). Monthly RH, and elevation were found as the significant explanatory variables in the MLR model of the East Anatolia. Monthly RHmin, and DtS appeared to be significant only in the MLR models of the Southeast and Central Anatolia regions, respectively.
Comparisons of values observed from the climate stations versus values predicted by the best-fit MLR models for each region led to R2 values of 87.7% for the Mediterranean region to 98.5% for the Southeast Anatolia region. The validation of the regional MLR models revealed that the highest R2 values were obtained from the models as a function of seven variables—Ho(S/So), PET, ST, S, RHmax, RH, and elevation—for the East Anatolia region (95.9%); as a function of five variables—Ho(S/So), PET, CLD, ST, and Tmax—for the Aegean region (93.4%); as a function of four variables—Ho(S/So), CLD, ST, and PPT—for the Mediterranean region (91.3%); as a function of three variables—Ho(S/So), CLD, and aspect—for the Central Anatolia region (94.0%) and—Ho(S/So), PET, and S—for the Marmara region (94.3%); and as a function of two variables—Ho(S/So), and CLD—for the Southeast Anatolia region (98.5%) and—Ho(S/So), and S— for the Black Sea region (95.7%). The national MLR models elucidated about 93% of variation in monthly average daily solar radiation as a function of six to eight variables (Table 2). Validation of the national MLR models indicated that the MLR with the six explanatory variables of Ho(S/So), CLD, RHmax, elevation, aspect, and month performed best, with the R2 value of 93.3%.
The test of the assumption for spatial autocorrelation based on Moran's I showed that there is a significantly clustered pattern for the months of January to May and August to December (P < 0.01) and for June and July (P < 0.05) (Table 3). The degree of spatial dependence for the solar radiation data was also calculated as the ratio of nugget (c0) to sill (c0 + c), and the nugget-to-sill ratios were found to range from 54% in February to 87% in June (Table 3). As the values of the nugget-to-sill ratio increase, spatial dependence for the data is indicated to decrease.
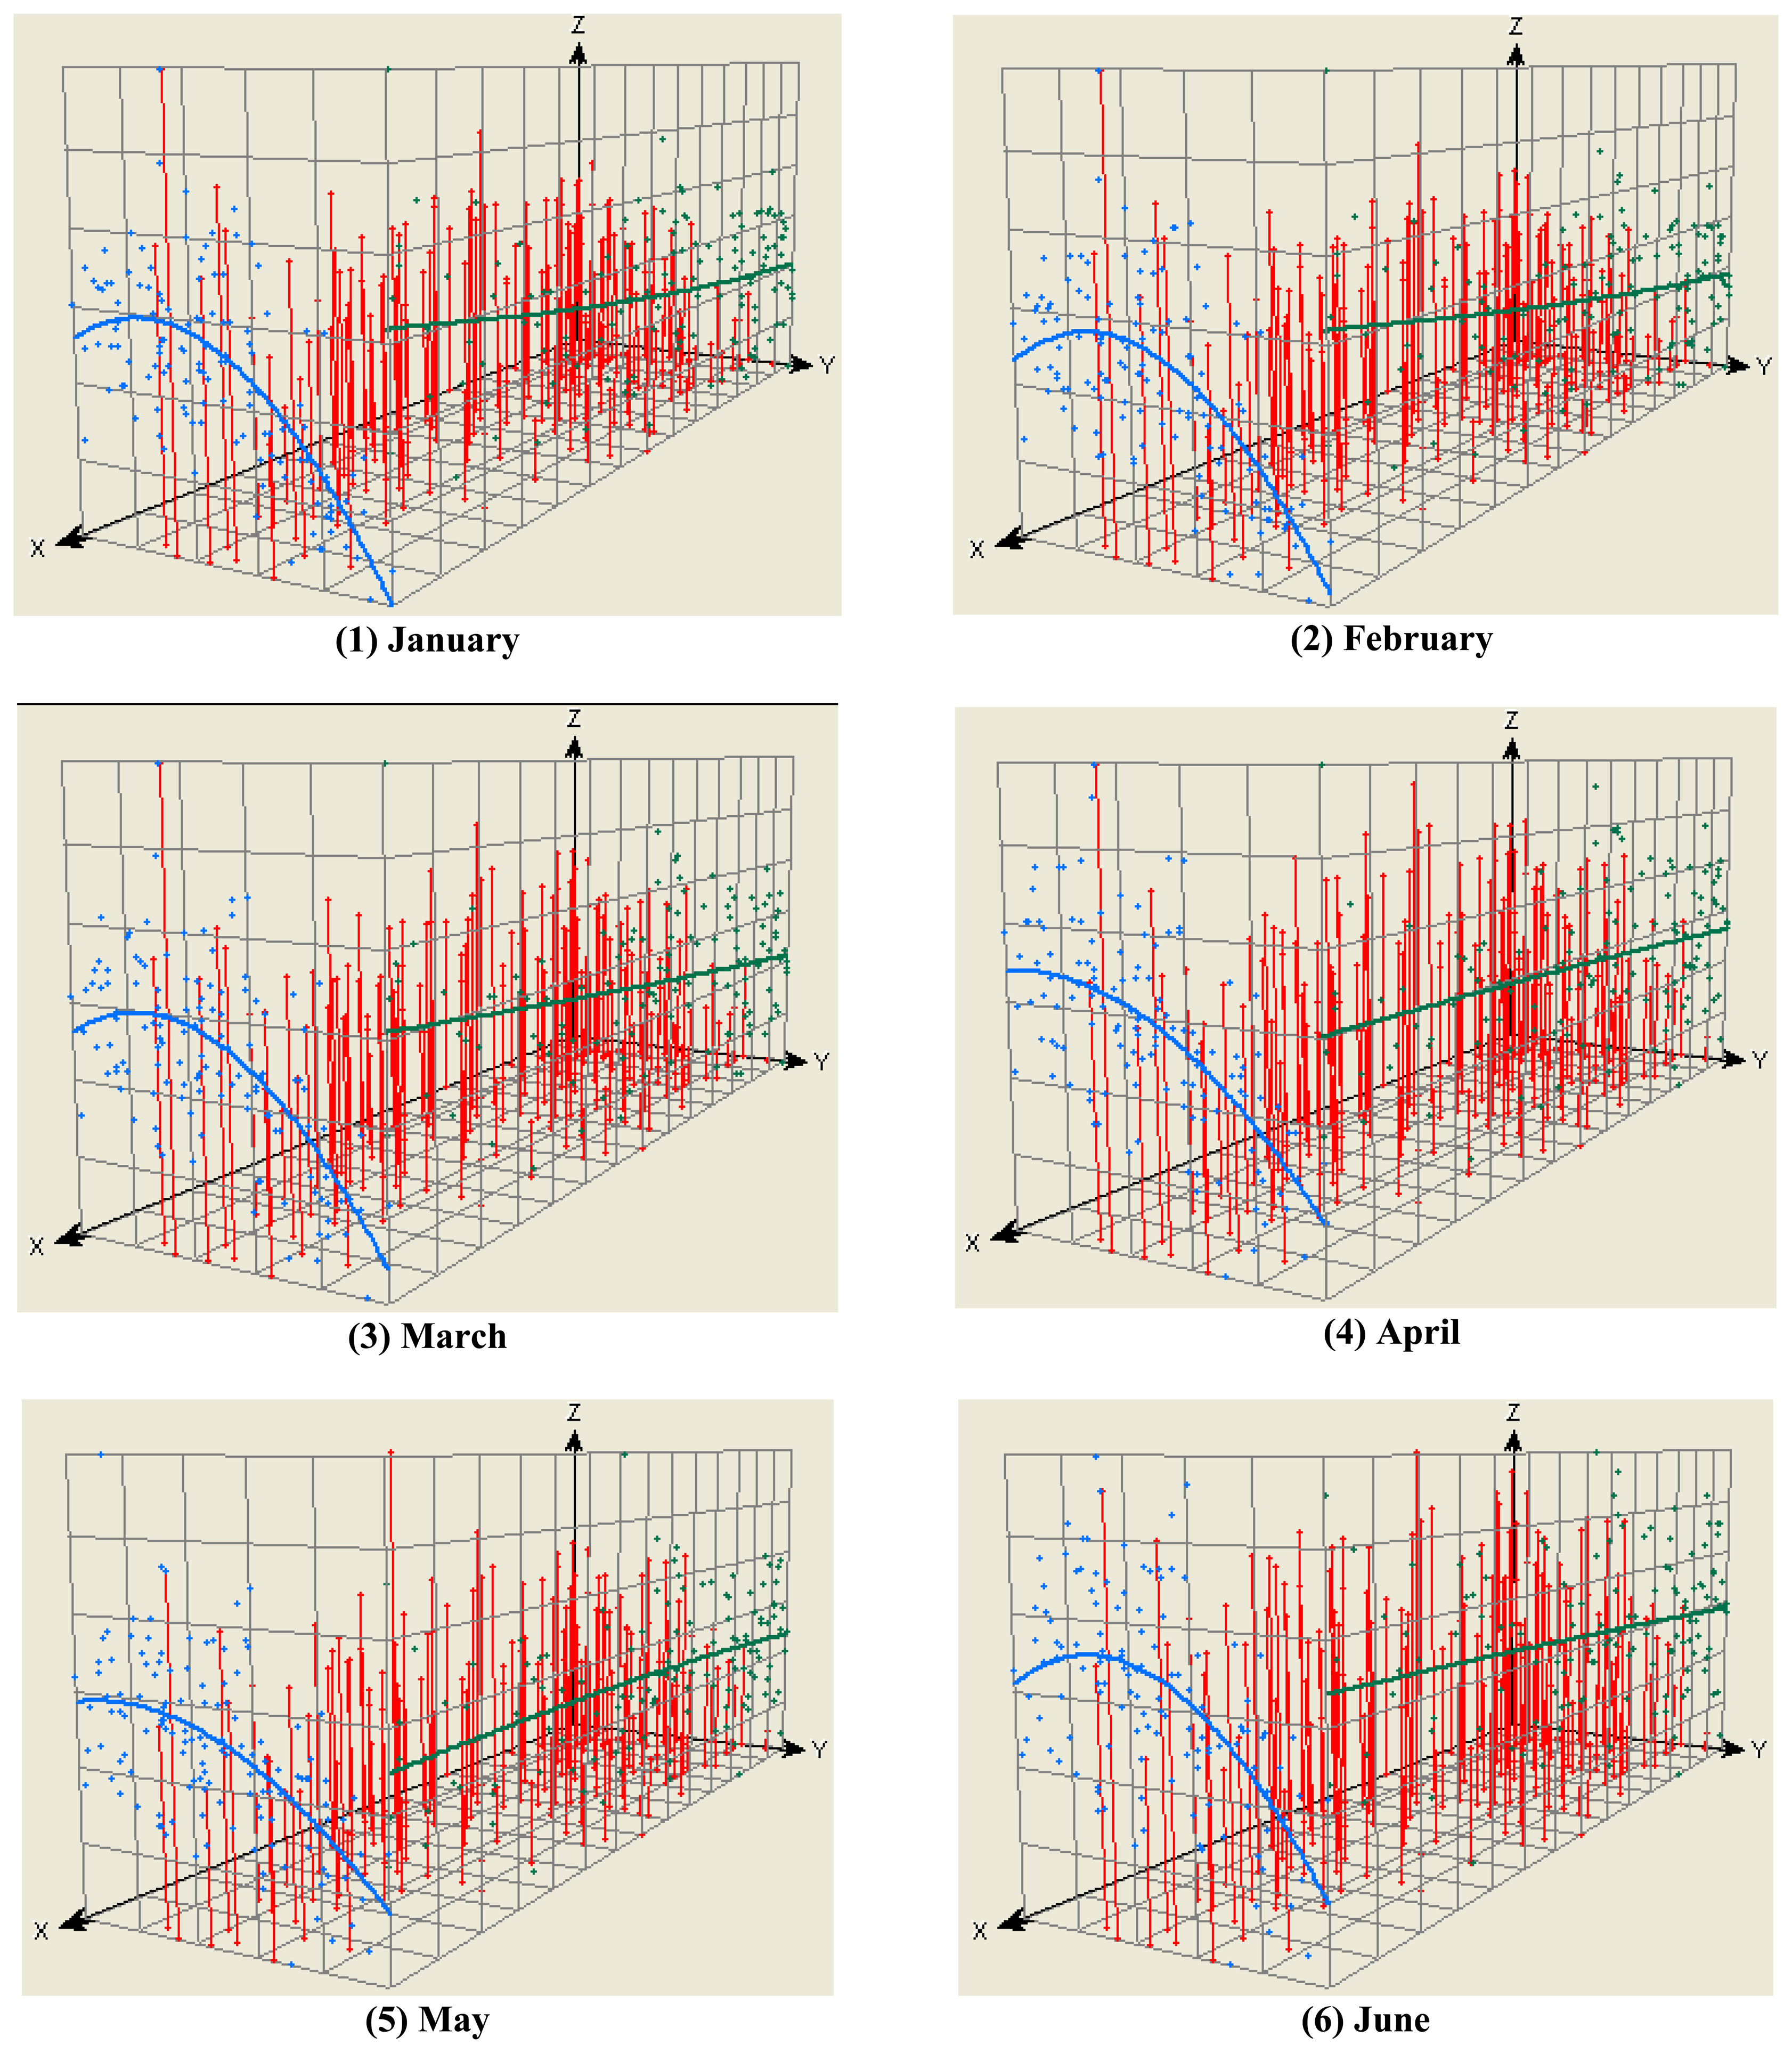
The global trend analysis indicated that there is an overriding trend in the solar radiation data in the south-to-north direction of Turkey (Figure 3). The first order of trend removal was performed before the implementation of universal kriging for the solar radiation data given the plots of the global trend analysis in Figure 3. An anisotropic spherical spatial correlation model was used due to significant anisotropy or nugget effect, generally attributed to small scale variability or measurement error. A large nugget effect for the solar radiation semi-variogram models means that the local scale spatial autocorrelation (spatial dependence) among observations weakens. The nugget was high relative to the sill, thus indicating that most of the fine-scale variability was not explained by the semivariogram models. Anisotropic spherical semi-variogram models performed best for the solar radiation data, with neighbors to include (at least) = 9(5), and number of lags = 12.
The specific parameters of the best-fit anisotropic semi-variogram models for universal kriging are presented in Table 3. The degree of bias in the monthly average daily model predictions was highest for June and lowest for January and February according to the MPE and MSPE values of the spatial one-leave-out cross-validation. Variability in the monthly average daily predictions of solar radiation was overestimated for January, April, May, June, September, October, and November and underestimated for the rest of the months according to the AKSE, RMSPE and RMSSPE values.
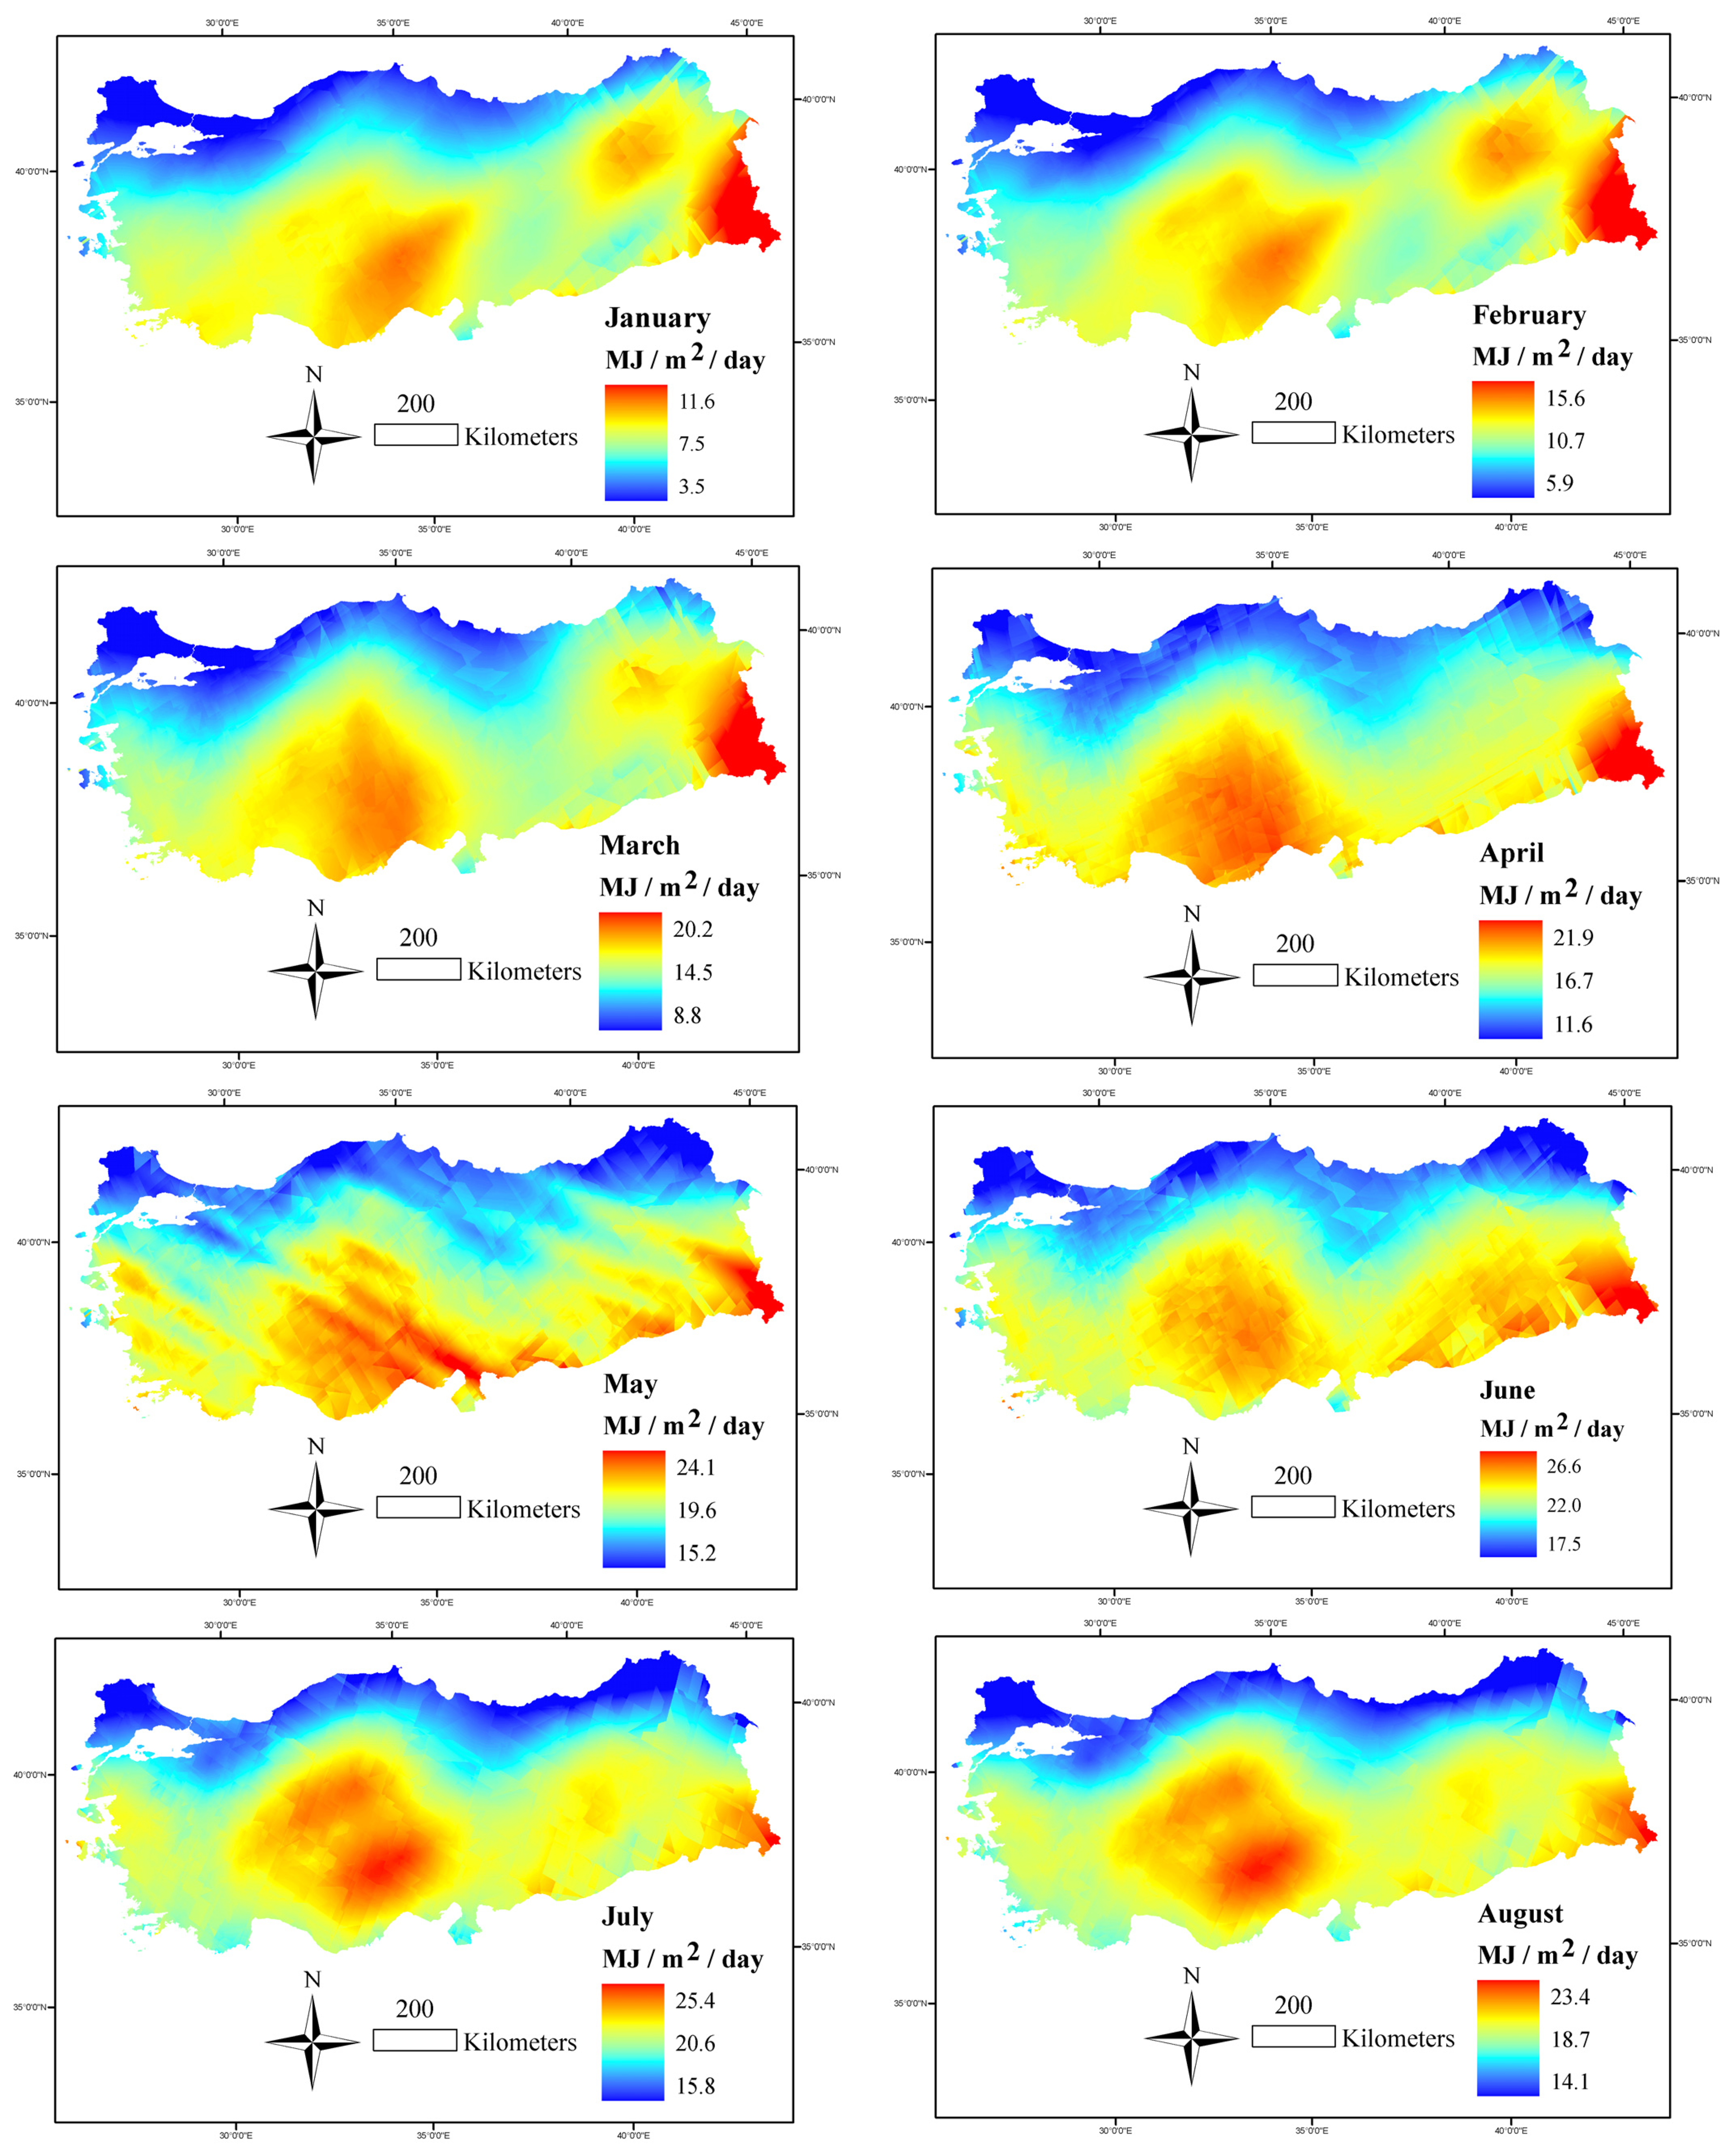
One-leave-out cross-validation of the monthly average daily solar radiation models revealed that R2 values for the comparisons of observed versus predicted solar radiation values ranged from 10.9% in July to 52.4% in November. Geostatistical models performed better for the months of October to March (R2 = 37.0 to 52.4%) than for those of April to September (10.9 to 28.8%) (Table 3). Surface maps of monthly average daily solar radiation over Turkey were generated with a grid resolution of 500 m × 500 m (Figure 4).
In this study, (1) the most robust generic MLR models of monthly average daily solar radiation, (2) their performance for predicting temporal variation, (3) spatial distribution of the solar radiation data interpolated by universal kriging, which discerns both stochastic and deterministic components of spatial variation, (4) jackknifing validation of temporal predictions, and (5) one-leave-out cross-validation of spatial predictions were quantified not only for the entire Turkey but also for its seven geographical regions differentiated by virtue of their specific geographical conditions, based on 130 climate stations.
Acknowledgments
We gratefully acknowledge the research project grant (KARIYER-TOVAG-104O550) from the Scientific and Technological Research Council (TUBITAK) of Turkey and the Research Project Administration Units of Abant Izzet Baysal University and Akdeniz University.
References
- Evrendilek, F.; Berberoglu, S.; Gulbeyaz, O.; Ertekin, C. Modeling potential distribution and carbon dynamics of natural terrestrial ecosystems: a case study of Turkey. Sensors 2007, 7(10), 2273–2296. [Google Scholar]
- Ertekin, C.; Evrendilek, F. Spatio-temporal modeling of global solar radiation dynamics as a function of sunshine duration for Turkey. Agricultural and Forest Meteorology 2007, 145, 36–47. [Google Scholar]
- Evrendilek, F.; Berberoglu, S. Quantifying spatial patterns of bioclimatic zones and controls in Turkey. Theoretical and Applied Climatology 2007, in press. [Google Scholar] [CrossRef]
- Ertekin, C.; Yaldız, O. Estimation of monthly average daily global radiation on horizontal surface for Antalya (Turkey). Renewable Energy 1999, 17, 95–102. [Google Scholar]
- Pereira, E.B.; Abreu, S.L.; Stuhlmann, R.; Rieland, M.; Colle, S. Survey of the incident solar radiation in Brazil by use of meteosat satellite data. Solar Energy 1996, 57(2), 125–132. [Google Scholar]
- Ineichen, P.; Perez, R. Derivation of cloud index from geostationary satellites and application to the production of solar irradiance and daylight illuminance data. Theoretical and Applied Climatology 1999, 64, 119–130. [Google Scholar]
- Tanahashi, S.; Kawamura, H.; Matsuura, T.; Takahashi, T.; Yusa, H. A system to distribute satellite incident solar radiation in real-time. Remote Sensing of Environment 2001, 75(3), 412–422. [Google Scholar]
- Wyser, K.; O'Hirox, W.; Gautier, C.; Jones, C. Remote sensing of surface solar irradiance with corrections for 3-D cloud effects. Remote Sensing of Environment 2002, 80, 272–284. [Google Scholar]
- Sandford, M.C.W.; Allan, P.M.; Caldwell, M.E.; Delderfield, J.; Oliver, M.B.; Sawyer, E.; Harries, J.E.; Ashmall, J.; Brindley, H.; Kellock, S.; Mossavati, R.; Wrigley, R.; Llewellyn-Jones, D.; Blake, O.; Butcher, G.; Cole, R.; Nelms, N.; DeWitte, S.; Gloesener, P.; Fabbrizzi, F. The geostationary Earth radiation budget (GERB) instrument on EUMETSAT's MSG satellite. Acta Astronautica 2003, 53(11), 909–915. [Google Scholar]
- Vignola, F.; Harlan, P.; Perez, R.; Kmiecik, M. Analysis of satellite derived beam and global solar radiation data. Solar Energy 2007, 81(6), 768–772. [Google Scholar]
- Gul, M.S.; Muneer, T.; Kambezidis, H.D. Models for obtaining solar radiation from other meteorological data. Solar Energy 1998, 64(1-3), 99–108. [Google Scholar]
- Iziomon, M.G.; Mayer, H. Performance of solar radiation models—a case study. Agricultural and Forest Meteorology 2001, 110(1), 1–11. [Google Scholar]
- Nijmeh, S.; Mamlook, R. Testing of two models for computing global solar radiation on tilted surfaces. Renewable Energy 2000, 20(1), 75–81. [Google Scholar]
- Kaplanis, S.N. New methodologies to estimate the hourly global solar radiation: comparisons with existing models. Renewable Energy 2006, 31(6), 781–790. [Google Scholar]
- Mallows, C.L. Some comments on Cp. Technometrics 1973, 15, 661–675. [Google Scholar]
- Hocking, R.R. The analysis and selection of variables in linear regression. Biometrics 1976, 32, 1–49. [Google Scholar]
- ESRI Inc. ArcGIS 8.2.; ESRI Inc.: Redlands, 2002. [Google Scholar]
- Moran, P.A.P. Notes on continuous stochastic phenomena. Biometrika 1950, 37, 17–23. [Google Scholar]
- Deutsch, C.V.; Journel, A.G. GSLIB: Geostatistical Software Library and User's Guide; Oxford University Press: Oxford, 1998; p. 369. [Google Scholar]
- Evrendilek, F.; Ertekin, C. Assessing solar radiation models using multiple variables over Turkey. Climate Dynamics 2008, in press. [Google Scholar] [CrossRef]
Figure 1.
Geographical and altitudinal distribution of 130 climate stations used in parameterization and validation of monthly average daily solar radiation models over Turkey.
Figure 1.
Geographical and altitudinal distribution of 130 climate stations used in parameterization and validation of monthly average daily solar radiation models over Turkey.

Figure 2.
Statistical distribution histograms of monthly average daily solar radiation data (MJ m-2 day-1) of January (1) to December (12).
Figure 2.
Statistical distribution histograms of monthly average daily solar radiation data (MJ m-2 day-1) of January (1) to December (12).


Figure 3.
Trend analyses of monthly average daily solar radiation data of January (1) to December (12) by three-dimensional plots of the dataset from 130 climate stations over Turkey. The locations of 130 climate stations are projected on the x-y plane with the red dots. Above climate station points, daily solar radiation values (MJ m-2 day-1) are shown by the height of the red sticks in the z dimension. Daily solar radiation values are projected onto the x-z (west) and y-z (north) planes as the green and blue dots of the scatter plots, respectively. Green and blue lines refer to regression lines fitted to the scatter plots on the x-z and y-z planes, respectively.


Figure 4.
Surface maps of monthly average daily solar radiation over Turkey based on anisotropic spherical semi-variogram models for universal kriging with a grid resolution of 500 m × 500 m.
Figure 4.
Surface maps of monthly average daily solar radiation over Turkey based on anisotropic spherical semi-variogram models for universal kriging with a grid resolution of 500 m × 500 m.


Table 1.
Best-fit stepwise multiple linear regression (MLR) models of monthly average daily solar radiation (MJ m-2 day-1) for seven geographical regions of Turkey.
| Region name | East Anatolia | Mediterranean | Aegean | Southeast Anatolia | Central Anatolia | Black Sea | Marmara | |||||||||||||
|---|---|---|---|---|---|---|---|---|---|---|---|---|---|---|---|---|---|---|---|---|
| Number of explanatory variables in MLR model | 5 | 6 | 7 | 4 | 5 | 6 | 5 | 6 | 7 | 1 | 2 | 3 | 3 | 4 | 5 | 1 | 2 | 2 | 3 | 4 |
| Intercept | -5.106 | -1.015 | 2.735 | -5.4 | 15 | 17.957 | -10.534 | -3.342 | -0.413 | 3.684 | -3.396 | -0.929 | -3.833 | -2.656 | -2.28 | 3.115 | 7.217 | 2.362 | 4.937 | 4.213 |
| Ho(S/So) (MJ m-2day-1) | 1.204 | 1.24 | 1.304 | 0.608 | 0.588 | 0.646 | 0.736 | 1.116 | 1.233 | 0.608 | 0.787 | 0.754 | 0.775 | 0.932 | 0.938 | 0.695 | 1.566 | 0.868 | 1.272 | 1.249 |
| PET (mm month-1) | -0.014 | -0.015 | -0.020 | 0.011 | 0.012 | 0.012 | -0.023 | -0.022 | -0.030 | -0.023 | -0.022 | |||||||||
| CLD (% month-1) | 0.181 | 0.197 | 0.205 | 0.132 | 0.064a | 0.021b | 0.107 | 0.127 | 0.113 | 0.074 | 0.084 | |||||||||
| ST (°C month-1) | -0.231 | -0.141 | -0.173 | 0.168 | 0.176 | 0.285 | -0.34 | -0.412 | -0.493 | |||||||||||
| S (h month-1) | -1.03 | -1.1 | -1.42 | -1.68 | -2.12 | -2.87 | -1.49 | -1.45 | ||||||||||||
| RHmax (% month-1) | 0.09 | 0.044 | 0.07 | -0.221 | -0.265 | |||||||||||||||
| Aspect (°) | 0.00328 | 0.0059 | 0.00665 | 0.00696 | 0.00375 | |||||||||||||||
| PPT (mm month-1) | -0.016 | -0.015 | -0.014 | |||||||||||||||||
| Elevation (m) | 0.00092 | 0.00113 | 0.00132 | |||||||||||||||||
| Tmax (°C month-1) | 0.418 | 0.49 | 0.514 | |||||||||||||||||
| RH (% month-1) | -0.08 | |||||||||||||||||||
| RHmin (% month-1) | -0.126 | |||||||||||||||||||
| DtS (km) | -0.0058 | |||||||||||||||||||
| RMSE | 1.16 | 1.11 | 1.07 | 1.42 | 1.33 | 1.27 | 1.37 | 1.33 | 1.3 | 1.35 | 0.969 | 0.896 | 1.86 | 1.75 | 1.71 | 1.45 | 1.1 | 1.61 | 1.53 | 1.46 |
| R2 (%) | 95.4 | 93.1 | ||||||||||||||||||
| R2adj (%) | 96.4 | 96.7 | 96.9 | 93.9 | 94.6 | 95.1 | 94.8 | 95.2 | 95.4 | 97.6 | 98.0 | 91.5 | 92.5 | 92.9 | 96.0 | 93.2 | 93.9 | 94.4 | ||
| Cp | 63.7 | 39.6 | 26.2 | 88 | 61.2 | 45.3 | 58.3 | 41.1 | 30.6 | 286.2 | 101.8 | 74 | 81.7 | 41.3 | 30 | 300.7 | 127.5 | 96 | 71.9 | 54.5 |
| V/P ratio (%) | 29 | 25 | 30 | 25 | 27 | 33 | 31 | |||||||||||||
| R2(%) for validation | 92.9 | 95.5 | 95.9 | 91.3 | 90.6 | 87.7 | 93.4 | 93.1 | 92.6 | 96.1 | 98.5 | 98.2 | 94.0 | 91.4 | 91.7 | 95.6 | 95.7 | 93.9 | 94.3 | 94.3 |
All the variables except for
aP < 0.01 and
bP > 0.05 are significant at P ≤ 0.001;
Ho: monthly average daily extraterrestrial solar radiation on a horizontal surface; S: day length; So: maximum possible sunshine duration; ST: soil temperature for a depth of 0 to 5 cm; RHmax: maximum relative humidity; PET: potential evapotranspiration; PPT: precipitation; RH: relative humidity; CLD: cloudiness; Tmax: maximum air temperature; RHmin: minimum relative humidity; DtS: distance to sea; RMSE: root mean square error; and V/P: ratio of number of stations of validation dataset to those of parameterization dataset.
Table 2.
Best-fit stepwise multiple linear regression (MLR) models of monthly average daily solar radiation (MJ m-2 day-1) for Turkey.
| Number of explanatory variables in MLR model | 6 | 7 | 8 |
|---|---|---|---|
| Intercept | -7.156 | -9.853 | -5.206 |
| Ho(S/So) (MJ m-2 day-1) | 0.760 | 0.762 | 0.776 |
| Cloudiness (% month-1) | 0.0834 | 0.0819 | 0.0939 |
| Elevation (m) | 0.00092 | 0.00063 | 0.00066 |
| Month | -0.095 | -0.095 | -0.080 |
| Aspect (compass degree) | 0.00228 | 0.00229 | 0.00248 |
| RHmax (% month-1) | 0.051 | 0.062 | 0.058 |
| Longitude (decimal degree) | 0.054 | 0.048 | |
| Latitude (decimal degree) | -0.126 | ||
| RMSE | 1.59 | 1.58 | 1.58 |
| R2adj (%) | 93.3 | 93.4 | 93.5 |
| Cp | 94.6 | 77.1 | 67.5 |
| V/P ratio (%) | 29 | ||
| R2 for validation (%) | 93.3 | 92.9 | 92.9 |
All the variables are significant at P ≤ 0.001; Ho: monthly average daily extraterrestrial solar radiation on a horizontal surface; S: day length; So: maximum possible sunshine duration; RHmax: maximum relative humidity; RMSE: root mean square error; and V/P: ratio of number of stations of validation dataset to those of parameterization dataset.
Table 3.
Parameters of semi-variogram models and error statistics of their one-leave-out cross-validation for monthly average daily solar radiation over Turkey.
| Parameters and error statistics | Month | |||||||||||
|---|---|---|---|---|---|---|---|---|---|---|---|---|
| 1 | 2 | 3 | 4 | 5 | 6 | 7 | 8 | 9 | 10 | 11 | 12 | |
| Moran's I | 0.12 | 0.12 | 0.1 | 0.07 | 0.03 | 0.03 | 0.02 | 0.04 | 0.06 | 0.1 | 0.13 | 0.12 |
| Major range (a) | 4.74 | 4.74 | 7.46 | 10.66 | 3.2 | 5.33 | 4.03 | 4.03 | 4.03 | 4.14 | 4.74 | 4.74 |
| Partial sill (c) | 0.42 | 0.86 | 1.1 | 0.45 | 0.86 | 0.59 | 1.48 | 1.42 | 0.76 | 0.37 | 0.21 | 0.22 |
| Nugget effect (c0) | 0.65 | 1.01 | 1.77 | 2.26 | 2.9 | 3.95 | 3.74 | 2.89 | 2.33 | 1.28 | 0.7 | 0.43 |
| Ratio of nugget to sill | 0.61 | 0.54 | 0.62 | 0.83 | 0.77 | 0.87 | 0.72 | 0.67 | 0.75 | 0.78 | 0.77 | 0.66 |
| Lag size | 0.4 | 0.4 | 0.63 | 0.9 | 0.27 | 0.45 | 0.34 | 0.34 | 0.34 | 0.35 | 0.4 | 0.4 |
| MPE | -0.04 | -0.04 | -0.12 | -0.09 | -0.1 | -0.17 | -0.13 | -0.1 | -0.1 | -0.08 | -0.07 | -0.04 |
| RMSPE | 0.96 | 1.25 | 1.54 | 1.64 | 1.95 | 2.12 | 2.25 | 2.0 | 1.71 | 1.21 | 0.91 | 0.81 |
| AKSE | 0.97 | 1.22 | 1.52 | 1.65 | 2.03 | 2.19 | 2.23 | 1.99 | 1.74 | 1.27 | 0.94 | 0.78 |
| MSPE | -0.04 | -0.03 | -0.08 | -0.06 | -0.05 | -0.08 | -0.06 | -0.06 | -0.06 | -0.07 | -0.07 | -0.06 |
| RMSSPE | 0.98 | 1.01 | 1.0 | 0.98 | 0.96 | 0.97 | 1.01 | 1.01 | 0.98 | 0.95 | 0.96 | 1.02 |
| R2 (%) for validation | 48.99 | 43.88 | 37.00 | 28.03 | 18.94 | 13.65 | 10.99 | 18.36 | 28.80 | 46.48 | 52.44 | 50.32 |
Ratio of nugget to sill: c0 / (c0 + c); MPE: mean prediction error; RMSPE: root mean square prediction error; AKSE: average kriging standard error; MSPE: mean standardized prediction error; RMSSPE: root mean square standardized prediction error.
© 2007 by MDPI ( http://www.mdpi.org). Reproduction is permitted for noncommercial purposes.
Share and Cite
MDPI and ACS Style
Evrendilek, F.; Ertekin, C. Statistical Modeling of Spatio-Temporal Variability in Monthly Average Daily Solar Radiation over Turkey. Sensors 2007, 7, 2763-2778. https://doi.org/10.3390/s7112763
AMA Style
Evrendilek F, Ertekin C. Statistical Modeling of Spatio-Temporal Variability in Monthly Average Daily Solar Radiation over Turkey. Sensors. 2007; 7(11):2763-2778. https://doi.org/10.3390/s7112763
Chicago/Turabian StyleEvrendilek, Fatih, and Can Ertekin. 2007. "Statistical Modeling of Spatio-Temporal Variability in Monthly Average Daily Solar Radiation over Turkey" Sensors 7, no. 11: 2763-2778. https://doi.org/10.3390/s7112763