Quantitative Accelerated Life Testing of MEMS Accelerometers
by
Marius Bâzu
1,*, 
Lucian Gălăţeanu
1,
Virgil Emil Ilian
1,
Jerome Loicq
2,
Serge Habraken
2 and
Jean-Paul Collette
2 1
National Institute for R&D in Microtechnologies –IMT-Bucharest, 126A, Erou Iancu Nicolae street, 077190, Bucharest, Romania
2
Centre Spatial de Liège - CSL (Université de Liège), Place du 20-Août, 9 à B-4000 Liège, Belgium
*
Author to whom correspondence should be addressed.
Sensors 2007, 7(11), 2846-2859; https://doi.org/10.3390/s7112846
Submission received: 27 September 2007
/
Accepted: 14 November 2007
/
Published: 20 November 2007
(This article belongs to the Special Issue Modeling, Testing and Reliability Issues in MEMS Engineering)
Abstract
:Quantitative Accelerated Life Testing (QALT) is a solution for assessing the reliability of Micro Electro Mechanical Systems (MEMS). A procedure for QALT is shown in this paper and an attempt to assess the reliability level for a batch of MEMS accelerometers is reported. The testing plan is application-driven and contains combined tests: thermal (high temperature) and mechanical stress. Two variants of mechanical stress are used: vibration (at a fixed frequency) and tilting. Original equipment for testing at tilting and high temperature is used. Tilting is appropriate as application-driven stress, because the tilt movement is a natural environment for devices used for automotive and aerospace applications. Also, tilting is used by MEMS accelerometers for anti-theft systems. The test results demonstrated the excellent reliability of the studied devices, the failure rate in the “worst case” being smaller than 10-7h-1.
1. Introduction
The Micro Electro Mechanical Systems (MEMS), with the new variant MOEMS (Micro Optical Electro Mechanical Systems), also known as microsystems, are relatively new devices, being developed at the end of 1970s, but not commercialized before the 1990s. Fabricated by Integrated Circuit (IC) compatible batch-processing techniques, they are integrating electrical, mechanical, optical, fluidic components. This mixture of components creates many new challenges about MEMS reliability:
- A microsystem (MEMS) contains, on a single chip, a sensor, an actuator (a mechanical component) and the electronics. The package should ensure the protection of the chip towards the environment (as for the “classical” microelectronic devices: transistors, ICs, etc.), but is also an interface between the sensor and an often harsh, demanding environment.
- The small dimensions of the mechanical elements of the actuator produce new failure mechanisms, not yet entirely studied, such as stiction, friction, wear, etc. As Bhushan reported in 2005: “Scaling effects in adhesion, friction, and wear have been measured and a comprehensive model for scale effects in friction and wear due to adhesion/deformation, and meniscus effects has been developed” [1]. Also, Ratzell emphasized in 2003 “Before microsystems can fulfil their promise, engineers have to understand that the macroscale rules don't necessarily apply” [2].
- The interactions between the mechanical, electrical and material reliability must be taken into account and the third dimension (the depth) of the structure cannot be ignored, as it happened for microelectronic devices, where all the simulations are basically 2-dimensional ones.
- Being new devices, MEMS do not have standardised processes and a “history” allowing designing appropriate accelerated tests.
The users of MEMS devices impose severe reliability requirements, comparable with those for ICs. Moreover, they are asking for a quantification of the reliability level, as shown by a recent document. In December 2003, the MEMS Industry Group – MIG (gathering more than 60 companies active in MEMS industry, such as: Honeywell, Intel, Texas Instruments, Samsung, Fairchild, etc.) issued their annual report – METRIC 2003, entitled “Focus on Reliability”. This report, based on a survey for 91 companies, has as conclusion the idea that “demonstration of reliability is required by customers” [3]. Consequently, the next MIG annual report - METRIC 2004, called “MEMS Accelerated Lifetime Testing” [4], was entirely focused on this subject.
If the subject “Reliability Assessment” is taken into account, there are two main types of accelerated tests:
- -
- Qualitative tests, which are not used for calculating a value for the reliability level, but for identifying design weaknesses and possible limits for all stress factors used for accelerating testing, i.e. the value at which new failure mechanisms arise (in spite of the fact that a maximum stress level is obtained, this is not a quantitative test from the reliability assessment point of view, because this maximum value has no significance against the reliability level);
- -
- Quantitative tests, used for quantifying reliability parameters, also named Quantitative Accelerated Life Testing – QALT. The value of a reliability parameter (e.g. failure rate or Mean Time Between Failures – MTBF) and / or the time & stress level dependence of this parameter are obtained.
QALT is a difficult task, especially for devices having low failure rates (the typical example is given by the ICs). In this case, long tests simulating the operational environment are needed in order to obtain significant results (enough failures for accurate statistical processing of data). The solution was developed for ICs and transistors: the usage of accelerated testing. This means to execute the reliability testing for the same type of stress as the operational one, but at higher stress level, in order to achieve time compression. But there is a limit for this stress level: one must have the same failure mechanisms at the high stress level and in normal operation. To be noted that this important condition of simulating the operational stresses is valid only for QALT, because the qualitative tests can use any type of stress and stress level, the only goal being to study the behaviour of the device in harsh environments with the aim to obtain the stress limits.
As a first conclusion, designing a QALT programme for any product is an application driven process, because one has to simulate the types of stress encountered in normal operation (which are different from one application to another), having previous information about the typical failure mechanisms and about the stress level producing new failure mechanisms. In principle, results of previous qualitative tests are used for designing QALT. Moreover, the programme must have a result (e.g. the failure rate of the batch of devices) in a relatively short time period, no longer than 1-2 months.
The accelerometers are among the “oldest” MEMS, but however, in the literature there are only a few attempts to assess their reliability (on the other hand, many qualitative tests were reported). Ron Denton [5] reported reliability results on MEMS accelerometers from field failure experience, the MTBF being around 2,000,000 hours (around 5.10-7h-1 for an exponential distribution of failures). Another assessment of the failure rate for MEMS accelerometers was made by Keller and Maudie [6], also for field failures, but without delivering a value for the reliability parameter.
A more detailed study, executed on five types of MEMS accelerometers is reported in 2002 by Ghaffarian et al. [7]. They were able to discriminate between five device types, manufactured by different companies, and fulfilled a top of the reliability level, but only a qualitative one, without quantifications. In 2004, Andover reported a failure rate of 1.75 ppm for MEMS accelerometers manufactured by MEMSIC [8]. All these results show that MEMS accelerometers are high reliability devices, with low failure rate.
In this paper, we describe the results obtained by a QALT approach for a batch of MEMS accelerometers manufactured by ST Microelectronics. First the working method is presented, which is based on previous procedures developed by the authors for “classical” devices [9], and adapted for MEMS. By describing the design of the testing programme, all the difficulties and risks of this operation are detailed. Furthermore, the results obtained for MEMS accelerometers are shown and commented.
2. Methodology and experiment
2.1. Methodology for QALT and role of the reliability engineer
The necessary steps to be followed for executing QALT are:
- Collecting batch history (material, process & monitoring characteristics), but also field data extracted from the operational life of the device;
- Designing and executing accelerated testing of items withdrawn randomly from the batch of devices (the significant acceleration factors must be chosen depending on the main application of the tested MEMS);
- Failure analysis of all devices failed during testing (electrical, physical & chemical methods, degradation & failure modelling, etc.);
- Statistical processing of data executed separately for each population affected by a failure mechanism: calculation of the activation energy and failure rate assessment for each failure mechanism (modelling vs. time & stress factors), the failure rate of the whole batch being obtained by summing the failure rates for each failure mechanism;
- Corrective actions for improving the reliability level of the subsequent batches (new design rules, processes, monitors, etc.);
- Prediction methods (new models) to be used in Design for Reliability methods.
The first step of this methodology is necessary to the reliability engineer in order to be able to propose eventually some corrective actions. Also, and even more important, the knowledge of the details about the manufacturing process is essential for the failure analysis, because the failure mechanisms depend strongly on process parameters.
In Table 1, a synthesis about the possible position of the reliability engineer vs. the reliability of the product and the quantity of information a priori known by the reliability engineer is shown.
The most desirable position for a reliability engineer is as member of the development or manufacturing team. There are two reasons for that: i) many failures during reliability tests (hence, good possibilities to study the failure mechanisms and to process statistically the data), and ii) significant a priori information about the device.
The most difficult position for a reliability engineer is to provide service for a product user: without a priori information about the history of the product and with a small possibility to get failures during reliability tests.
2.2. Design of the experiment
The work reported in this paper is an attempt to execute QALT in the most difficult case (see Table 1), i.e. simulating a service provided to a user of the product. The initial conditions of the experiment are:
- -
- QALT executed for a “mature” and high reliability device (already manufactured for more than two years), produced by a well-known company;
- -
- Only the information available to any user of the product is known: i.e. the data sheet of the product, including possible applications and also the device structure (obtained by decapsulating the device), but no information about the batch history and field data;
- -
- Information about the failure mechanisms and acceleration factors for this type of product, as obtained from literature, is available;
- -
- The reliability testing has to last for less than two months (a reasonable duration for an accelerated test).
Taking into account all these conditions, the challenge was to obtain in a short time period estimation about the reliability level of the product, based on a few failures or no failures at all. In this situation, the “engineering knowledge plays a critical role” [10].
After this presentation of the initial conditions of the experiment, the tested devices are described.
The experiments were executed on a MEMS inertial sensor, sensing the movements on 3-Axis: the linear accelerometers LIS3L02AS4, with accelerations in two ranges (±2g and ±6g), manufactured by ST Microelectronics (well-known manufacturer of MEMS). The LIS3L02AS4 is a low-power three axes linear accelerometer, including a sensing element (a polysilicon movable membrane) and an IC interface (manufactured by a standard CMOS process) able to take the information from the sensing element and to provide an analog signal to the external world. The accelerometer has a user selectable full scale of ±2g, ±6g and measures accelerations over a bandwidth of 1.5 KHz for all axes. The device is available in plastic SMD (Surface Mounted Devices) package SO24 type and it is specified over an extended temperature range of -40°C to +85°C. This accelerometer can be used for: mobile terminals, gaming and Virtual Reality input devices, free-fall detection for data protection, robotics and antitheft systems and inertial navigation. The product is already in fabrication since 2003, with a robust design and high reliability.
The critical element for designing any QALT is choosing the accelerating factors, because the tests must simulate (at higher stress levels) the environment and electrical conditions of the main applications of the devices, i.e. application-driven tests are needed. Based on previous results obtained from qualitative testing for MEMS accelerometers [7,11,12], the following stresses were considered the most appropriate:
- Mechanical stress, i.e.: shock, acceleration, vibration, tilting (used in anti-theft system, see before); we decided to use vibration and tilting, which are linked to the normal usage of the accelerometers;
- Thermal stress: temperature, thermal cycling [7], etc.; thermal cycling is not likely to occur during operational life, but high temperature is a common environment for many applications.
Moreover, in order to obtain a more significant acceleration, we chosen to use combined stresses, mechanical and thermal stress, in two variants:
- Vibration + high temperature (already used for accelerometer testing [13]);
- Tilting + temperature & electrical signal (a new approach).
Testing at vibration and high temperature is accelerated in temperature, being executed at a fixed frequency of 1500 Hz (for QALT, it is difficult to process data from two acceleration factors) and amplitude of 6 g. Acceleration in frequency will be taken into account in a future experiment.
The highest temperature chosen for accelerated testing is 145°C, well beyond the upper operational limit (+85°C), but closed to the value for High temperature life testing (+150°C), according to the data sheet. The company manufacturing the accelerometer uses this temperature for testing, and this means no new failure mechanisms are arisen up to +150°C.
Testing at tilting and high temperature & bias is a new variant of mechanical + thermal & electrical testing. Tilting was considered to be significant for an application-driven test, being the natural environment for the accelerometers used in automotive and aerospace applications. Also, tilting is used by MEMS accelerometers for anti-theft systems.
2.3. Experiment description
Testing at vibration and high temperature was executed by Centre Spatial de Liège - CSL (Université de Liège). The experimental set-up is shown in Figure 1. A board containing 10 devices, fixed on the shaker interface plate, forms the experimental setup (Figure 1a). Then, a heater (Figure 1b) was added on top of 9 devices (the 10th device being the temperature reference, held at room temperature – Ch5, in Figure 1a), with the temperature sensor taped on the bottom of the heater, and a top board is fixed to press the heater on the devices (Figure 1c).
The measurements of the accelerometers were performed electrically, according to the data sheet, and in situ, at the ambient temperature of the test.
Testing at tilting and high temperature & bias (electrical signal) was executed at National Institute for R&D in Microtechnologies (IMT-Bucharest) on original home made equipment (Figure 2). By superposing high temperature & bias, a combined accelerated stress was obtained.
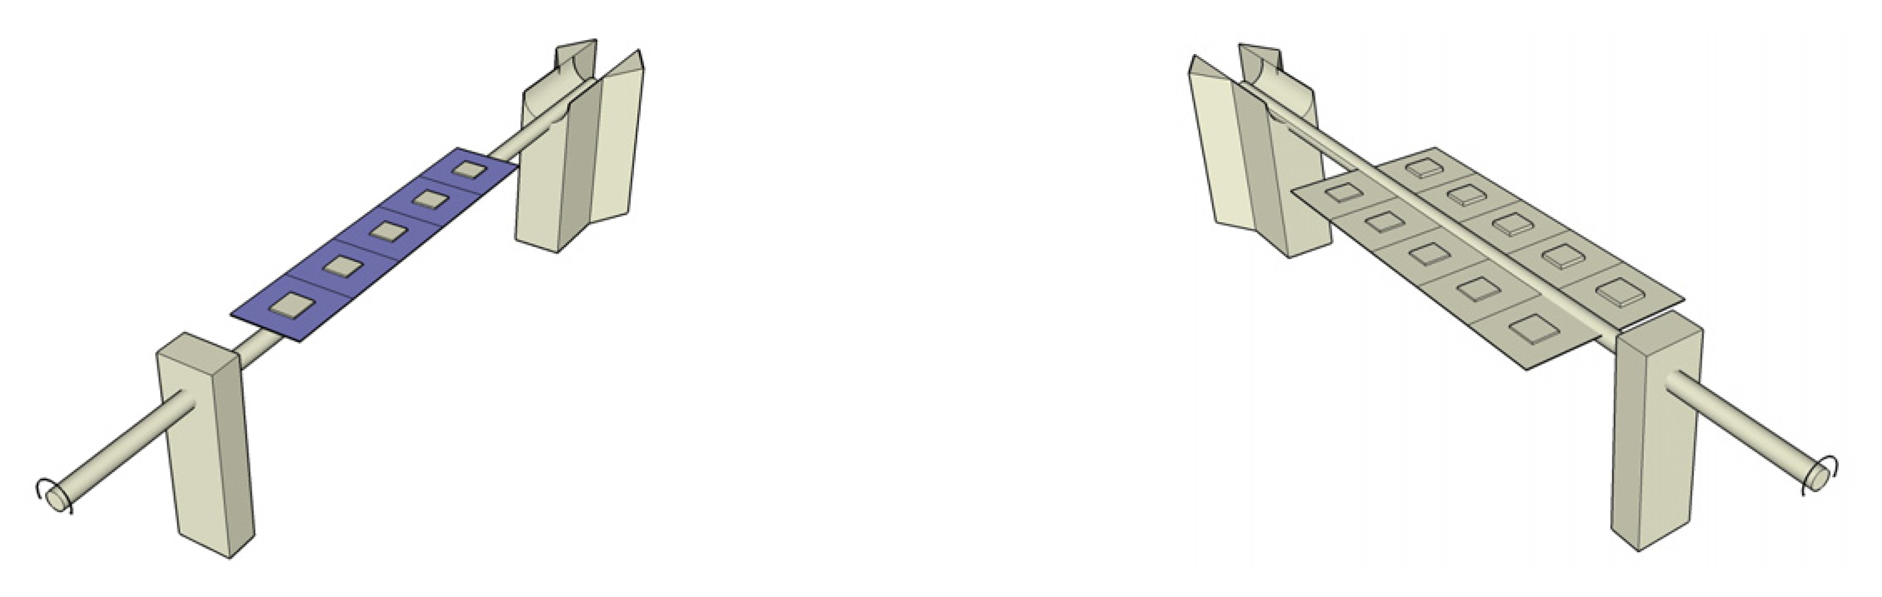
Two variants of tilting movement were used for testing: the axial type (the items are positioned on the axis of the equipment, simulating a device working in cars, trains or airplanes) and the wing type (the items are positioned at a certain distance from the axis, simulating a device placed on the wing of an airplane). In the second case, the movement of the tested device is more complex then the axial tilt. Both types are shown in Figure 3.
The electrical characterisation was executed initially, and at some moments (168h, 336h, 772h and 1000h) during testing, on devices removed from the tests. Devices on high temperature stress where cooled to 55 °C or lower before removing the bias. All specified electrical measurements were completed prior to any reheating of the devices. The measured electrical parameters are indicated at Section 2.4.
The test plan was designed for 36 MEMS accelerometers LIS3L02AS4, as follows (Table 2):
The test duration was chosen in order to fulfil the initial constraint of having an estimation of the reliability level after no longer than 2 months. To be noted that the two tests at vibration + temperature were performed one after another (the temperature for the second test being chosen based on the results of the first test), and the three tests at tilting + temperature were executed simultaneously.
2.4. Electrical characterisation
The electrical parameters measured during testing are presented in Table 3.
- Zero-g level (Voff) was selected because it describes the actual output signal in steady state, if there is no acceleration. Also it is a factory-calibrated parameter.
- Self test Output Voltage Change (Vt) is the result of an implemented function, simulating an input acceleration, and allowing testing the mechanical and electric part of the sensor. The seismic mass is moved by means of an electrostatic test-force. The Self Test function is off when the ST (Self Test) pin is connected to GND (ground, 0 V supply). If the ST pin is connected to Vdd (Power supply), a definite input acceleration is simulated, and the outputs will exhibit a voltage change of the DC levels, related to the selected full scale and depending on the supply voltage trough the device sensitivity.
- The supply current (Idd) describes the good electric functionality of the entire circuit; any disturbance related to this parameter has a correspondent in a malfunction of the circuit.
Supplementary to the above parameters, at the initial stage, the parameters mentioned in Table 4 where measured. All the parameters are specified at the following conditions: Vdd =3.3V, T=25°C, unless otherwise noted.
This is a group of parameters tested prior to accelerated tests to verify the functionality of the accelerometers through its principal mechanical characteristics:
- Acceleration Range (Ar) verifies the electrical selection of the full-scale acceleration range (Logic 0: 2g Full-scale; Logic 1: 6g Full-scale).
- Sensitivity (So) describes the gain of the sensor and can be determined by applying 1g acceleration to it.
- Non Linearity (NL) describes the best-fit straight line for full scale = 2g on each axis. This parameter is guaranteed by design.
- Cross-Axis represents the contribution to the measuring output of an inclination/acceleration along any perpendicular axis.
3. Results and Discussion
3.1. Results obtained by accelerated testing
a) Testing at vibration and temperature
First, testing at 85°C was executed (S1 in Table 2), in the following conditions: frequency - 1500 Hz, amplitude – 6g. No visible degradation in the performance of the accelerometers during the test was obtained.
Consequently, testing for S2 was executed at very high ambient temperature, i.e. 145°C. However, up to 200 hours no failures were obtained. Only very small performance degradation was noticed after around 100 hours of testing (see Figure 4). To be noted the small standard deviation of the whole batch of accelerometers: only one device shows slightly different values.
b) Testing at tilting and temperature & bias
The tests were executed in the conditions mentioned in Table 2 (samples S3-S5) with: mechanical stress applied by the described equipment (the frequency varied between 1 and 10 Hz, the tilting angle being ± 30°), thermal chambers (Tmax = 250°C) and power supplies (3.3V for the device under test and variable for mechanical stimulus).
Up to 1000 hours, there was no failure and no visible degradation in the performance of the accelerometers during the test. However, this combined test (tilting + temperature & bias) was considered significant and desirable by the manufacturer of the accelerometers. This is because a combined test, with two or more stress factors is always more difficult for the device than each test applied separately, because the possible synergy of the stress factors could produce higher effects than each stress factor.
3.2. Estimation of the reliability level
The results of the tests have shown the good reliability of the tested device for both variants: i) vibration at constant frequency at high temperature, and ii) tilting at high temperature & electrical signal, respectively. In spite of the fact that no failures were obtained, an estimation of the reliability level can be done, based on the “worst case” approach. This means we considered one failure could arise immediately after the last moment of the test and this approach is applied for the test at the higher stress level.
In this case, the hardest test is at vibration and 145°C, for 200 hours. The slight parameter drift (see Figure.4, the dark blue line), showing an incipient fatigue fracture of the moving part of the accelerometer, gives an indication about this after the first 100 hours. Hence, we have considered the “worst case” as follows: one device will fail after 201 hours at testing at vibration and 145°C. We did not continue the test beyond the designed 200 hours in order to observe one of the initial conditions: obtaining an estimation of the reliability level in the shortest period of time. Due to the “worst case” method, estimation was obtained.
The most likely failure mechanism in this case [14] is the fatigue fracture of the moving part of the accelerometer due to mechanical vibration and temperature: the polysilicon structure of the moving part has a weak point which concentrates the stress and, if a crack appears, it propagates and reduces the lifetime of the device. Eventually, a failure by fracture takes place [15]. Also, this failure mechanism could be responsible for the slight drift of the electrical parameters after the first 100 hours. There are evidences that the fatigue fracture is accelerated by the high temperature, especially if humidity is present at the chip level, diffusing from outside through the plastic package [16]. The fatigue damage of a movable membrane is accumulated over mechanical fatigue cycles to failure, produced by vibration and enhanced by high temperature [17,18].
The model for temperature acceleration of the fatigue was presumed to be the Arrhenius law, which is used in most of the cases for describing the temperature acceleration of the failure mechanisms of semiconductor devices [9]. Currently, no values of the activation energies for accelerating MEMS tests are reported. However, for this failure mechanism, we have typical values between 0.8 and 1.0 eV [9], obtained for CMOS technology, which was used for manufacturing the studied devices.
Based on these assumptions, we have calculated a “worst case” level of the failure rate, by using, for parameter estimation, a graphical method. The steps executed for estimating the failure rate in this case are described in the following:
- a)
- As stated before, the initial conditions (“worst case”) are: 9 devices were tested at 145°C and vibration, and one failure was obtained after 201 hours (the failure percentage being 11.1%).
- b)
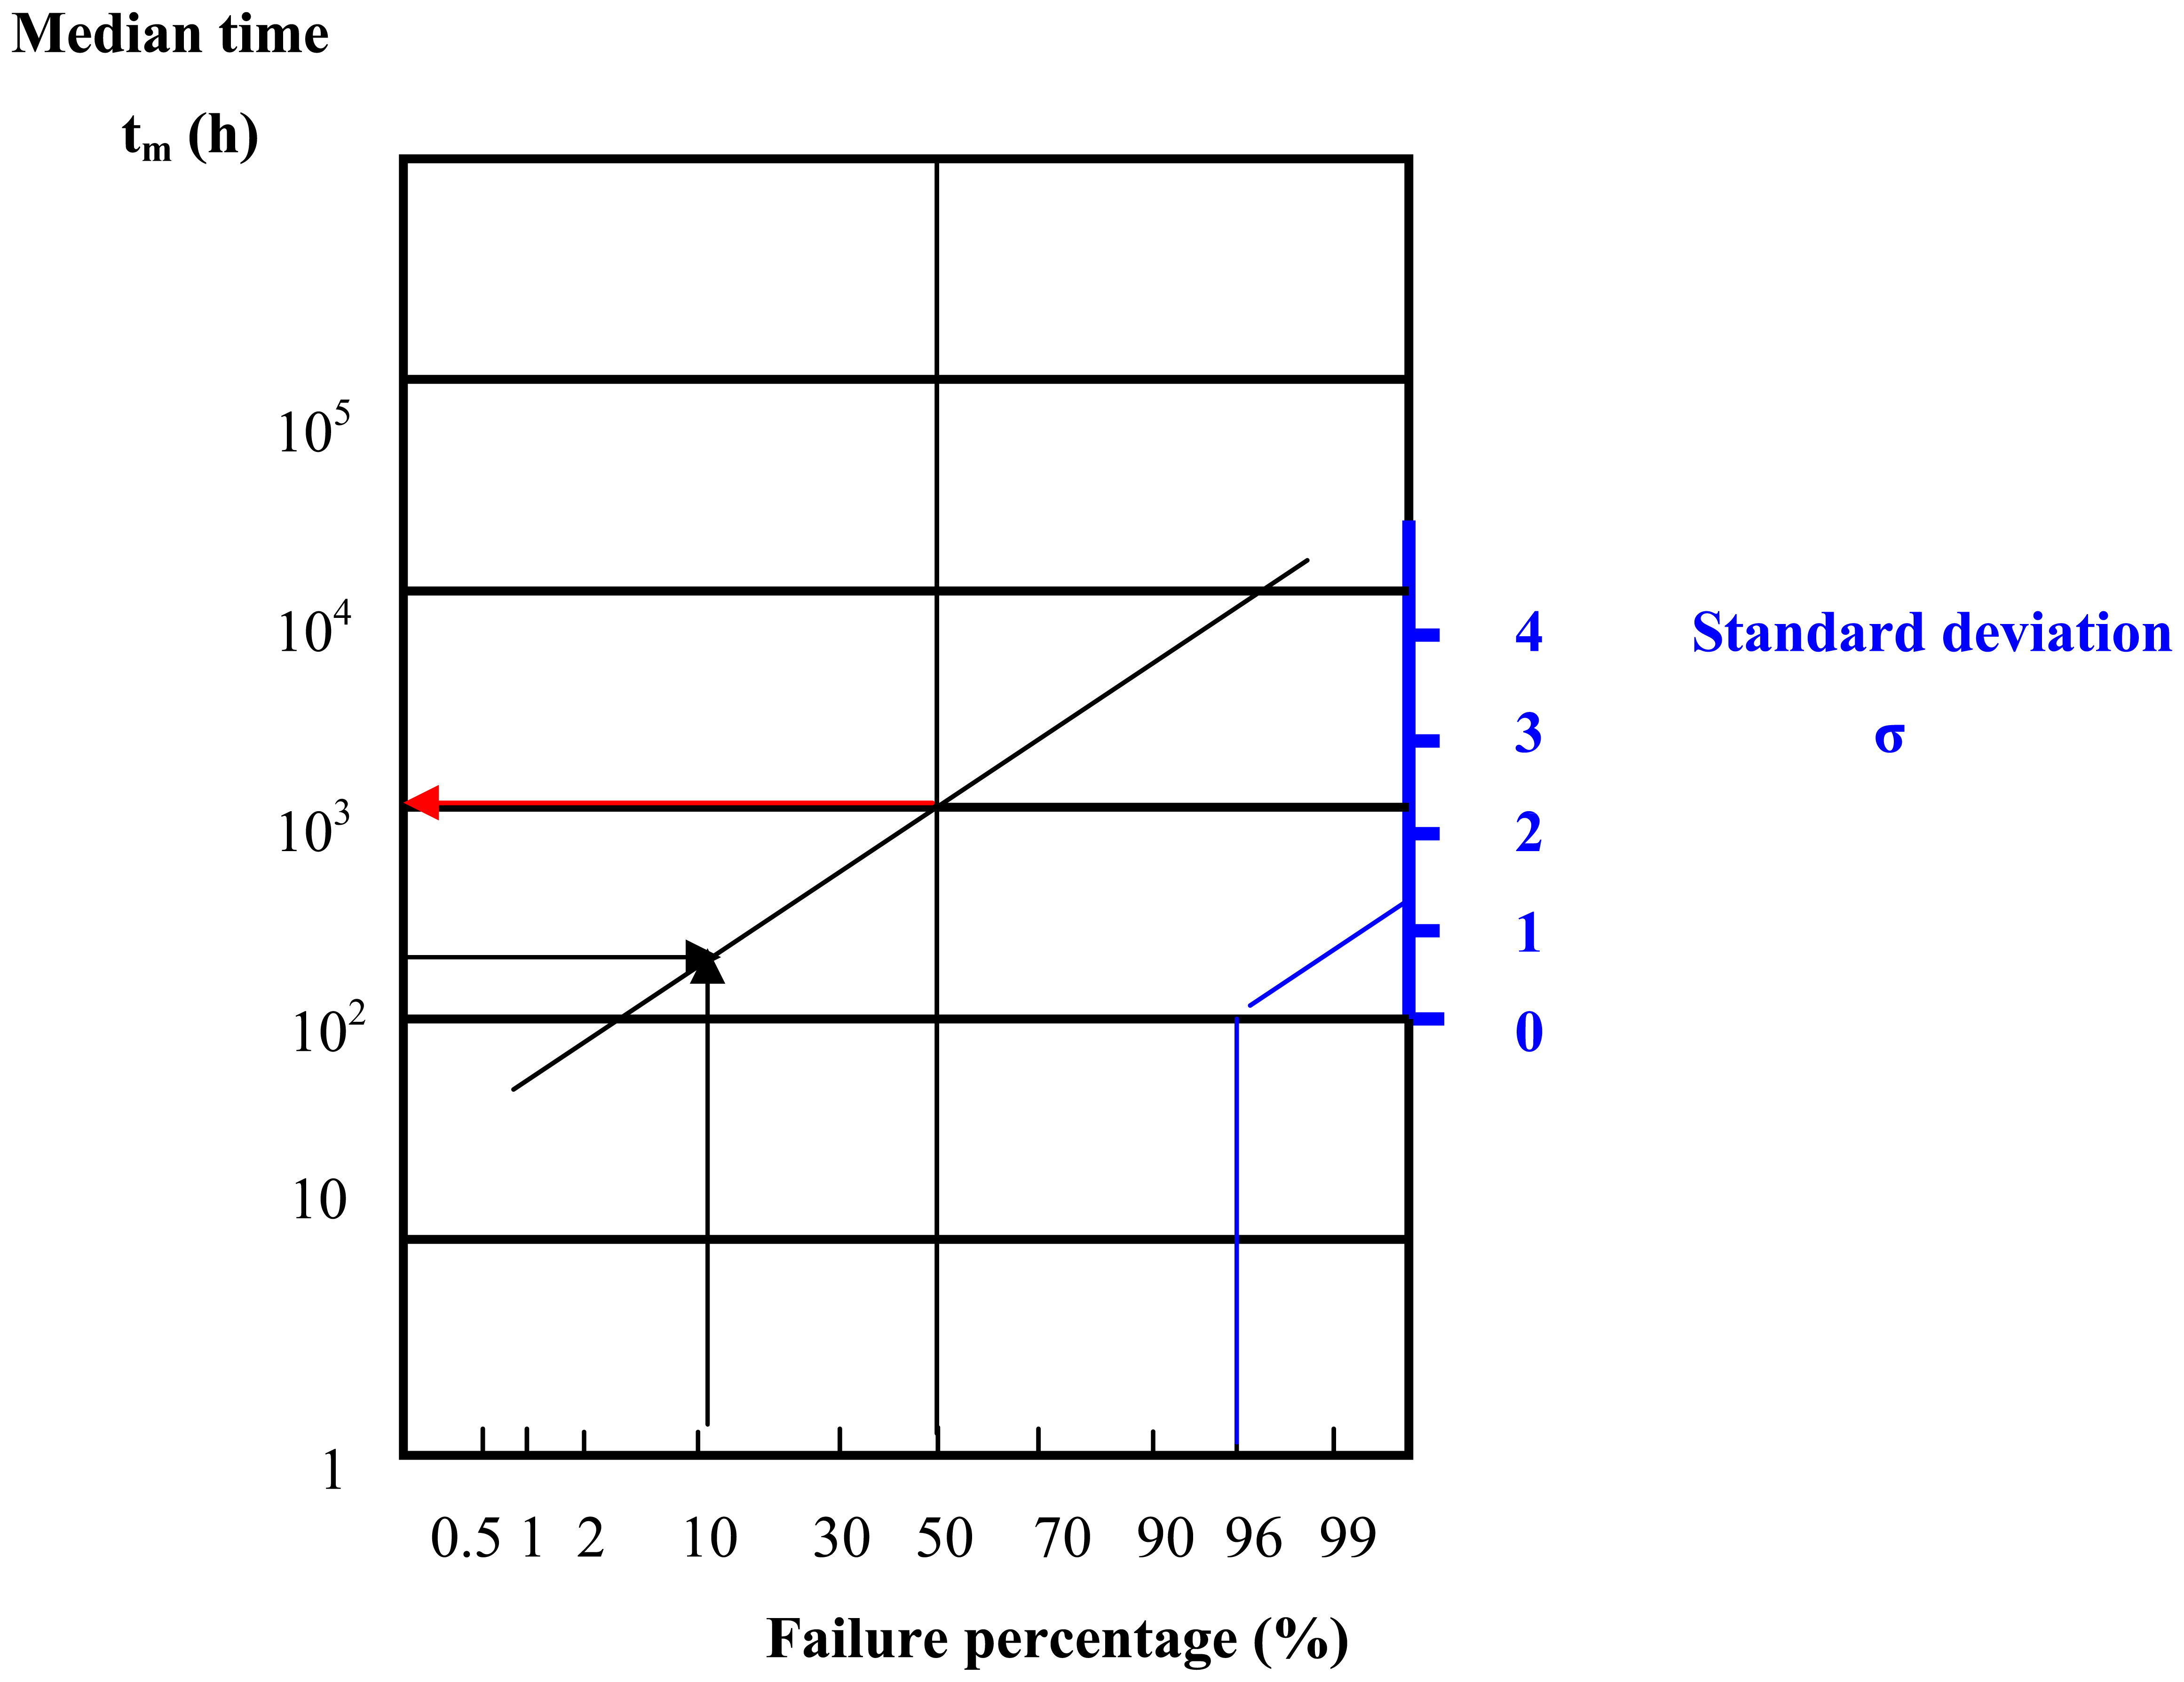
- Based on previous experiments on CMOS devices affected by fatigue fracture, a lognormal distribution of the failures was considered, with values of the standard deviation σ = 1.2 … 2 [9]). In the following, first, the calculus will be done for σ = 1.2, then the possible implications of the increase towards σ = 2 will be discussed.
- c)
- On the lognormal probabilistic paper (Figure 5), the standard deviation is proportional with the slope of the line drawn between the point (96%,100h) and the standard deviation value on the scale marked in blue. Hence, the model describing Median time vs. Failure percentage must have the same slope with this blue line. Consequently, for obtaining this model, the point (11.1%;201h) is represented and a straight line, parallel with the standard deviation line (the blue line) is drawn. The intersect of this straight line with the 50% line gives the time moment for the failure of 50% of the sample S2 (see Table 2), i.e. the median time of this distribution, which is 1000 h (see red arrow).
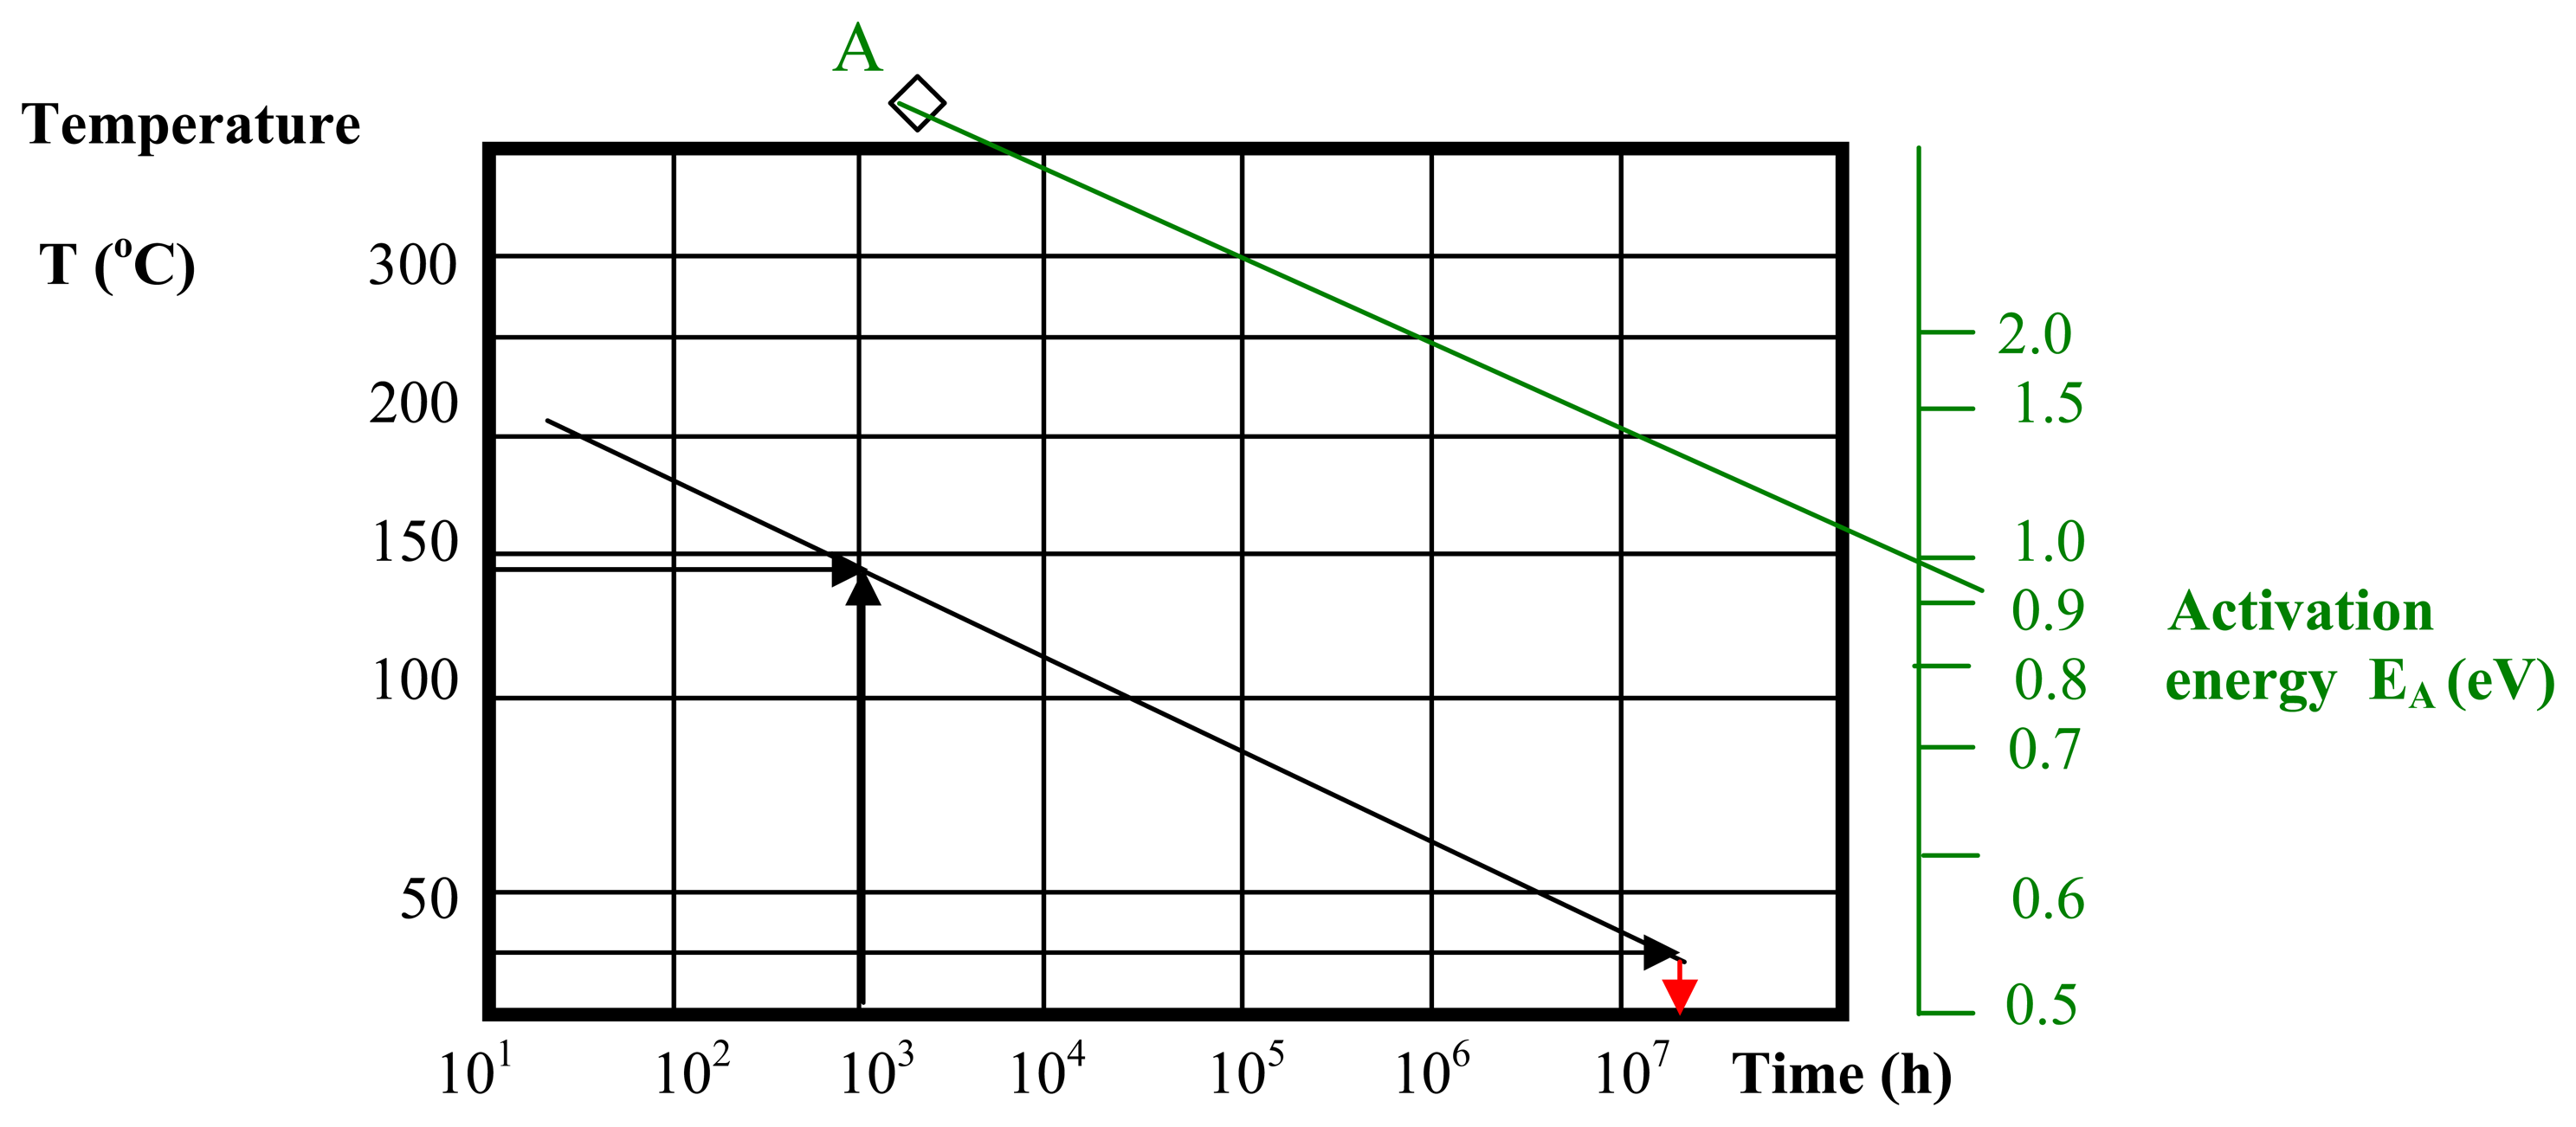
- d)
- First, the calculus is executed for the activation energy of 1 eV, and then the modifications induced by a smaller value of the activation energy (0.8 eV) will be discussed. On the Arrhenius plot (Figure 6), the line corresponding to the activation energy of 1eV (green line) is drawn by the point A and the corresponding value on the scale with activation energy. A line parallel with this one (having the same slope), drawn by the point calculated at the previous step (1000h;145°C), describes the acceleration induced by the temperature to the failure mechanism. The intersect of this line with the ordinate of 25°C defines in the abscissa the median time for the distribution of failure rates at room temperature (25°C) of the batch affected by this failure mechanism, which is 2 × 10⁷ h (see red line).
- e)
- As a conclusion, the failure rate vs. time for the whole batch is described by a lognormal distribution with tm = 2 × 10⁷ h and σ = 1.2. The time variation of the failure rate was calculated [9] and a maximum value of 3.5 × 10⁻⁸, at 1.5 × 10⁷ hours was obtained.
- f)
- As mentioned before, the procedure described by the above steps (a…e) was repeated for different values of σ and EA, in order to find out how much the estimation depends on the chosen values. The results are shown in Table 5.
The most likely case is the variant 1. Consequently, we may say the maximum value of the failure rate (in the “worst case”) this batch of accelerometers is 3.5.10-8h-1. The four variants shown in Table 5, depending on the values of the standard deviation for the lognormal distribution and on the temperature activation energy) furnished values of the failure rate which are (with one exception) below 10-7 h-1.
We must emphasize again: this are NOT the real values of the failure rate, but a rough assessment of the worst case, showing a very good reliability of the studied devices. However, this estimation represents an important result, being one of the few reports about the reliability level of MEMS accelerometers. In fact, the obtained value is closed to previous reports (see Section 1).
Conclusions
We have built a programme of Quantitative Accelerated Life Testing (QALT) for MEMS accelerometers, designed to obtain significant results in maximum two months.
In parallel with the “classical” test for calculating the failure rate of MEMS accelerometers (vibration at high temperature, 200 hours, executed by CSL), an original combined stress test, simulating the normal operation in automotive and aerospace applications (tilting at high temperature and electrical signal, 1000 hours), was conceived and executed by IMT.
No failures were obtained during tests. However, based on a “worst case” approach, an estimation of the failure rate was made for this batch of devices, showing values below 10-7h-1.
Acknowledgments
Special acknowledgements to the company ST Microelectronics for the free samples of MEMS accelerometers offered for reliability testing.
The researches reported in this paper were supported by the European project (FP6/IST) “Design for Micro and Nano Manufacture - Patent-DfMM” (NoE, 2004-2008) and by the Romanian grant “Technologies at nanometric scale: time degradation phenomena” (CNCSIS, 2006-2008).
References and Notes
- Bhushan, B. Nanotribology and Nanomechanics of MEMS/NEMS and BioMEMS/NEMS Materials and Devices. In Mechatronics Seminar on Nanosystems; ETH-Zentrum: Zurich, April 5 2005. [Google Scholar]
- Ratzell, A.C. MEMS from the nanoscale up. Mechanical Engineer – Magazine on line 2007. [Google Scholar]
- MEMS Industry Group METRIC 2003 Report. Focus on Reliability 2003.
- MEMS Industry Group METRIC 2004 Report. MEMS Accelerated Lifetime Testing 2004.
- Denton, R. Sensor reliability impact on predictive maintenance program costs. Wilcoxon Research Report. http://www.wilcoxon.com/knowdesk/WPMTBF.pdf.
- Keller, J.; Maudie, T. Accelerometer lifetime prediction modeling based on field failures. Reliasoft 2001, 2, 3. [Google Scholar]
- Ghaffarian, R.; Sutton, D.G.; Chafee, P.; Marquez, N.; Sharma, A.K.; Teverovski, A. Thermal and mechanical reliability of five COTS MEMS accelerometers. In EEE Links, NASA Electronic Parts and Packaging Program.; February 2002. [Google Scholar]
- Andover, N. DS. Ingegneria selects MEMSIC's thermal accelerometer for use in their OEM vehicle anti-theft systems. Broadband Technology Ltd. report 2004. [Google Scholar]
- Bajenescu, T.; Bazu, M. Reliability of Electronic Components; Springer Verlag: Heidelberg, 1999. [Google Scholar]
- Reliasoft. You have a small data set: what do you do? Reliability HotWire 2007, (Issue 72). [Google Scholar]
- Tanner, D.; Walraven, J.; Helgesen, K.; Irwin, L.; Gregory, D.; Stake, J.; Smith, N. MEMS reliability in a vibration environment. Proceedings of IEEE International Reliability Physics Symposium, San Jose, CA, Apr 10-13, 2000; pp. 139–145.
- Sharma, A.; Teverovski, A. Evaluation of Thermo-Mechanical Stability of COTS Dual-Axis MEMS Accelerometers for Space Applications. In Report about Component Technologies and Radiation Effects (Code 562); Electrical Systems Center, August 2000. [Google Scholar]
- Shea, H. Reliability of MEMS for space applications. Proc. of SPIE 2006, 6111, 61110A–1. [Google Scholar]
- Hsu, T-R. Reliability in MEMS packaging. 44th International Reliability Physics Symposium, San Jose, CA, March 26-30, 2006.
- Walraven, J. Failure mechanisms in MEMS. ITC International Test Conference Paper 33.1. 2003. [Google Scholar]
- Muhlstein, C.; Brown, C. Reliability and fatigue testing of MEMS. NSF / AFOSR / ASME Workshop Tribology Issues and Opportunities in MEMS 1997. [Google Scholar]
- Bâzu, M.; Tibeică, C.; Gălăţeanu, L.; Ilian, V. Reliability assessment by virtual prototyping of MEMS tunable Faby-Perrot optical cavity. Proc. IEEE 04TH8748 2004 (CAS); pp. 249–253.
- Muhlstein, C.; Ritchie, R.O. High-cycle fatigue of micron-scale polycrystalline silicon films: fracture mechanics analyses of the role of the silica/silicon interface. International Journal of Fracture 2003, 119/120, 449–474. [Google Scholar]
Figure 1.
Experimental set-up for testing at vibration and temperature
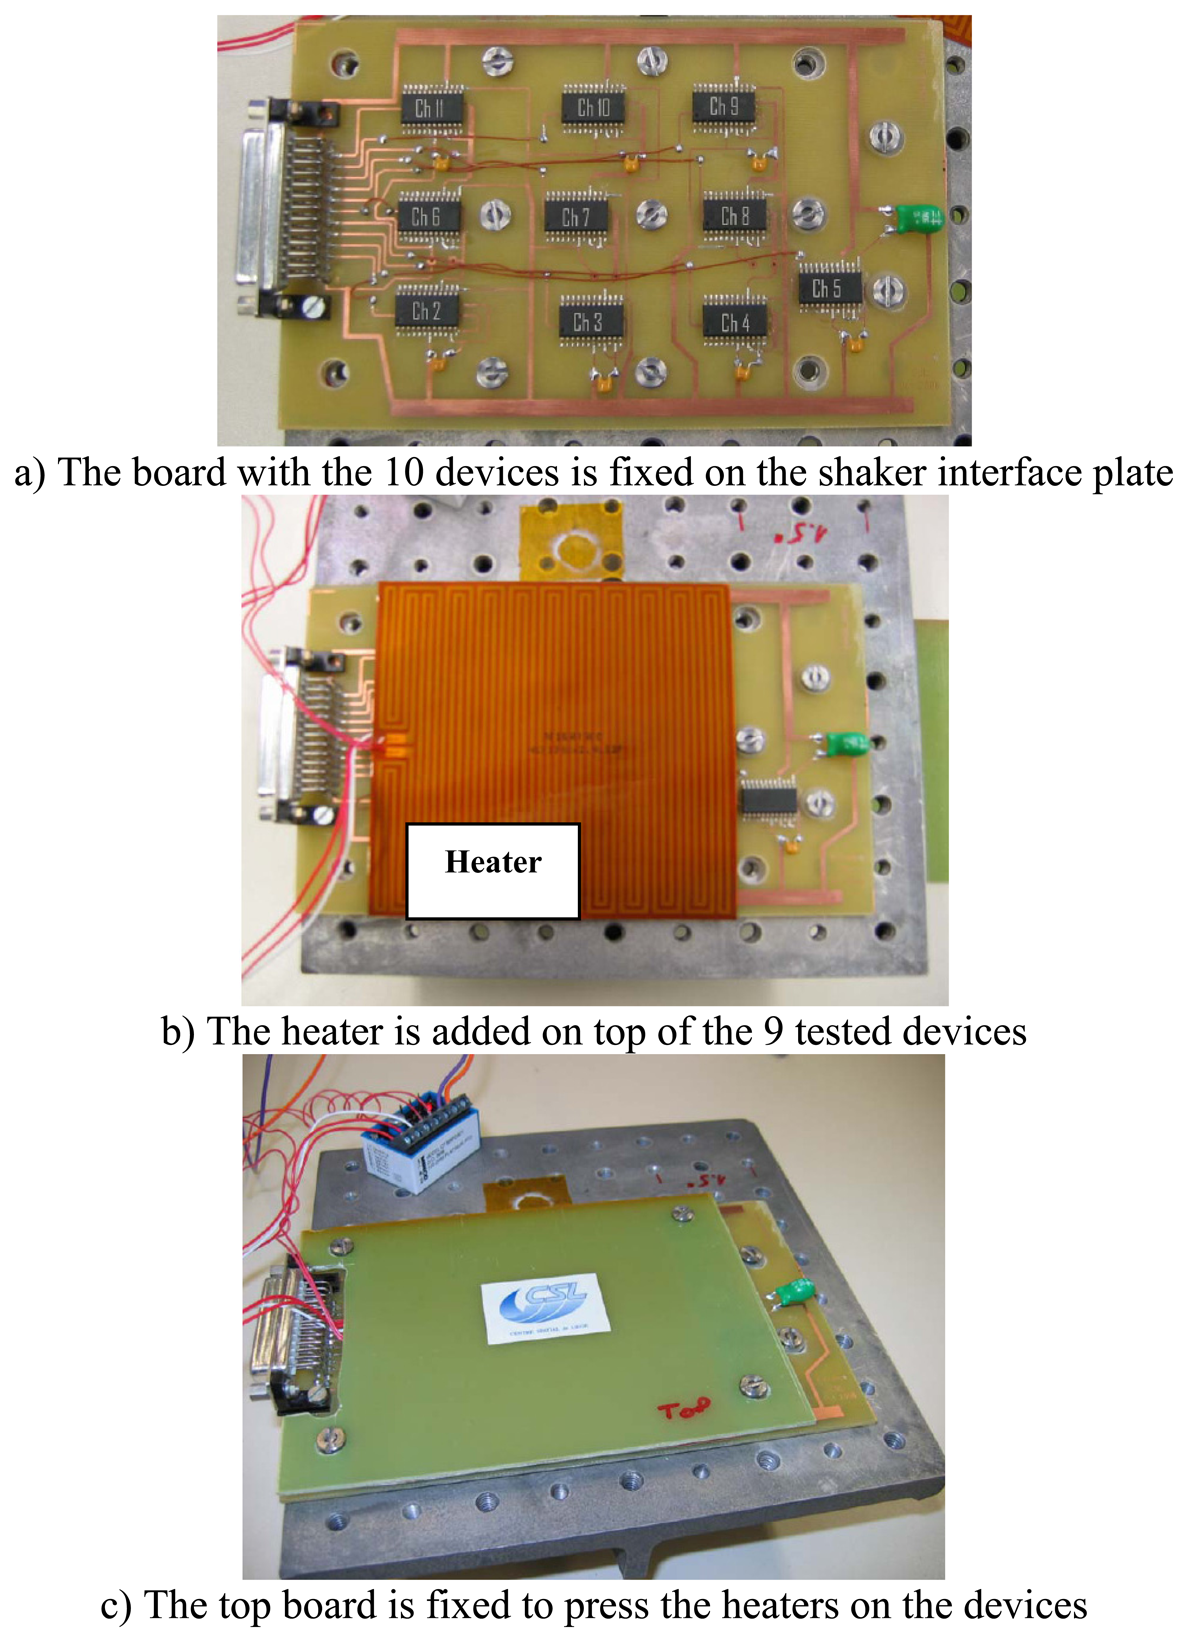
Figure 2.
Equipment for tilting at temperature.
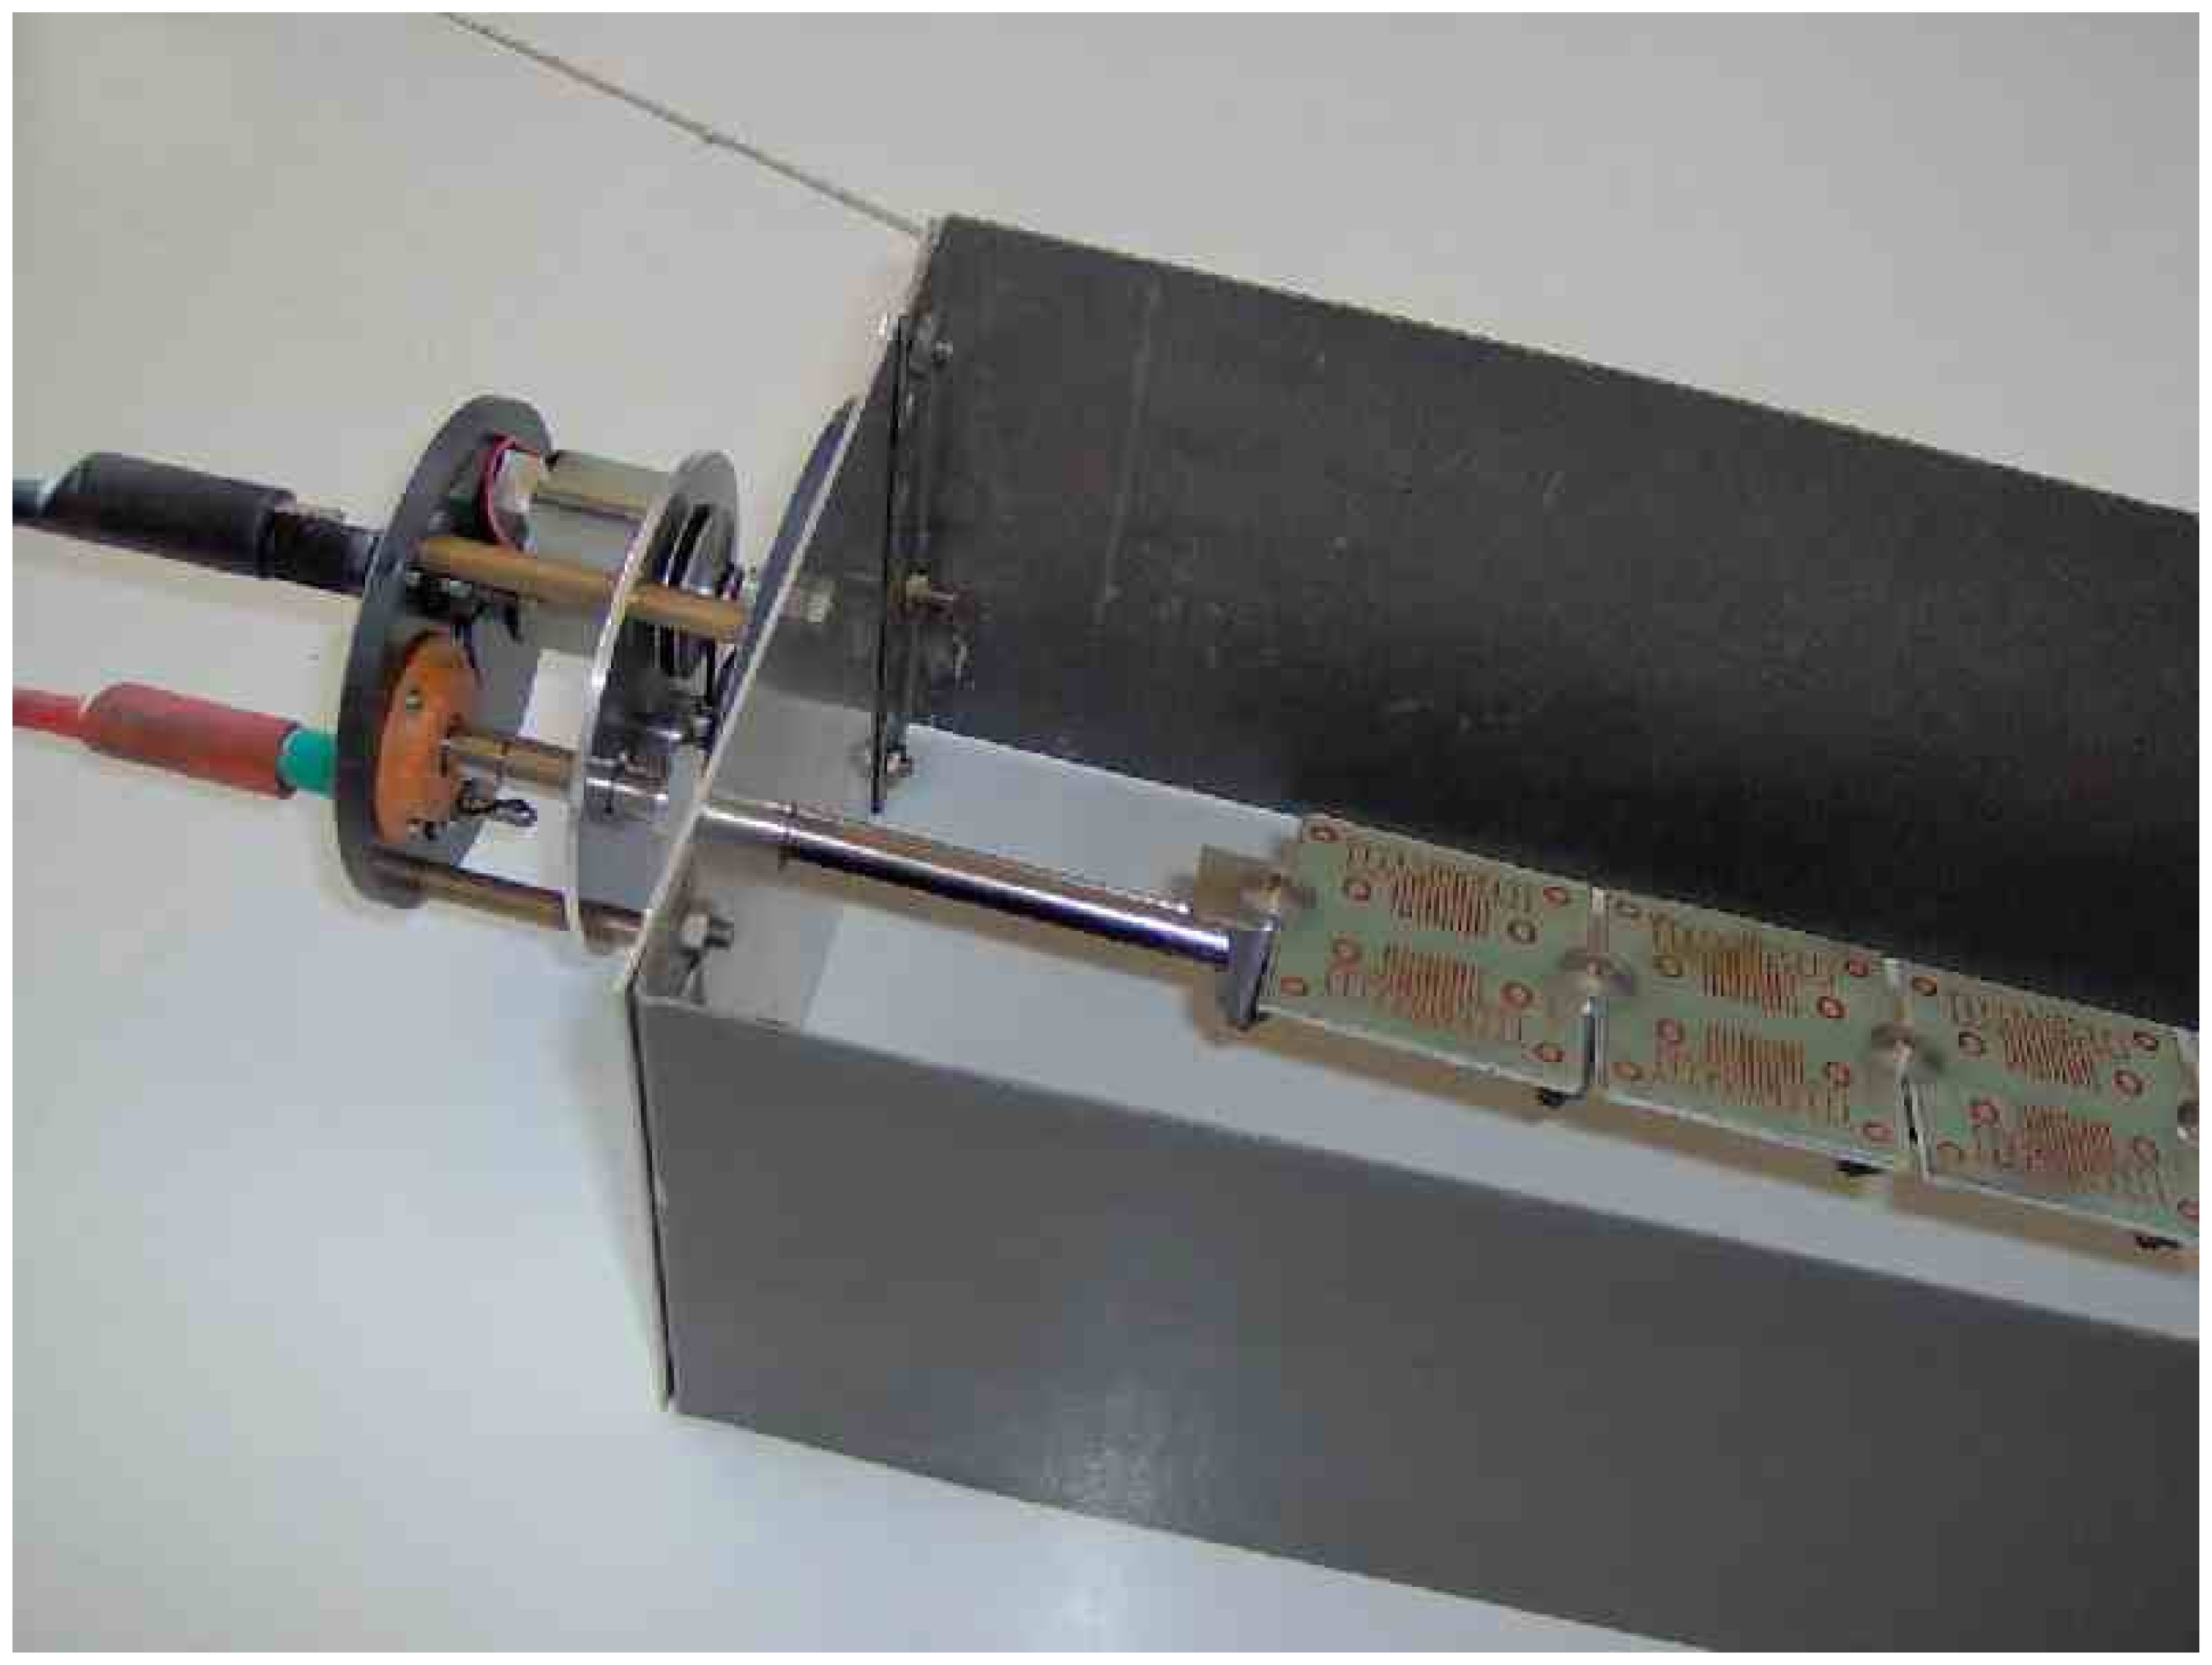
Figure 3.
Tilting variants: the axial type (left) and the wing type (right).

Figure 4.
Time behaviour of the accelerometers tested at vibration and 145°C
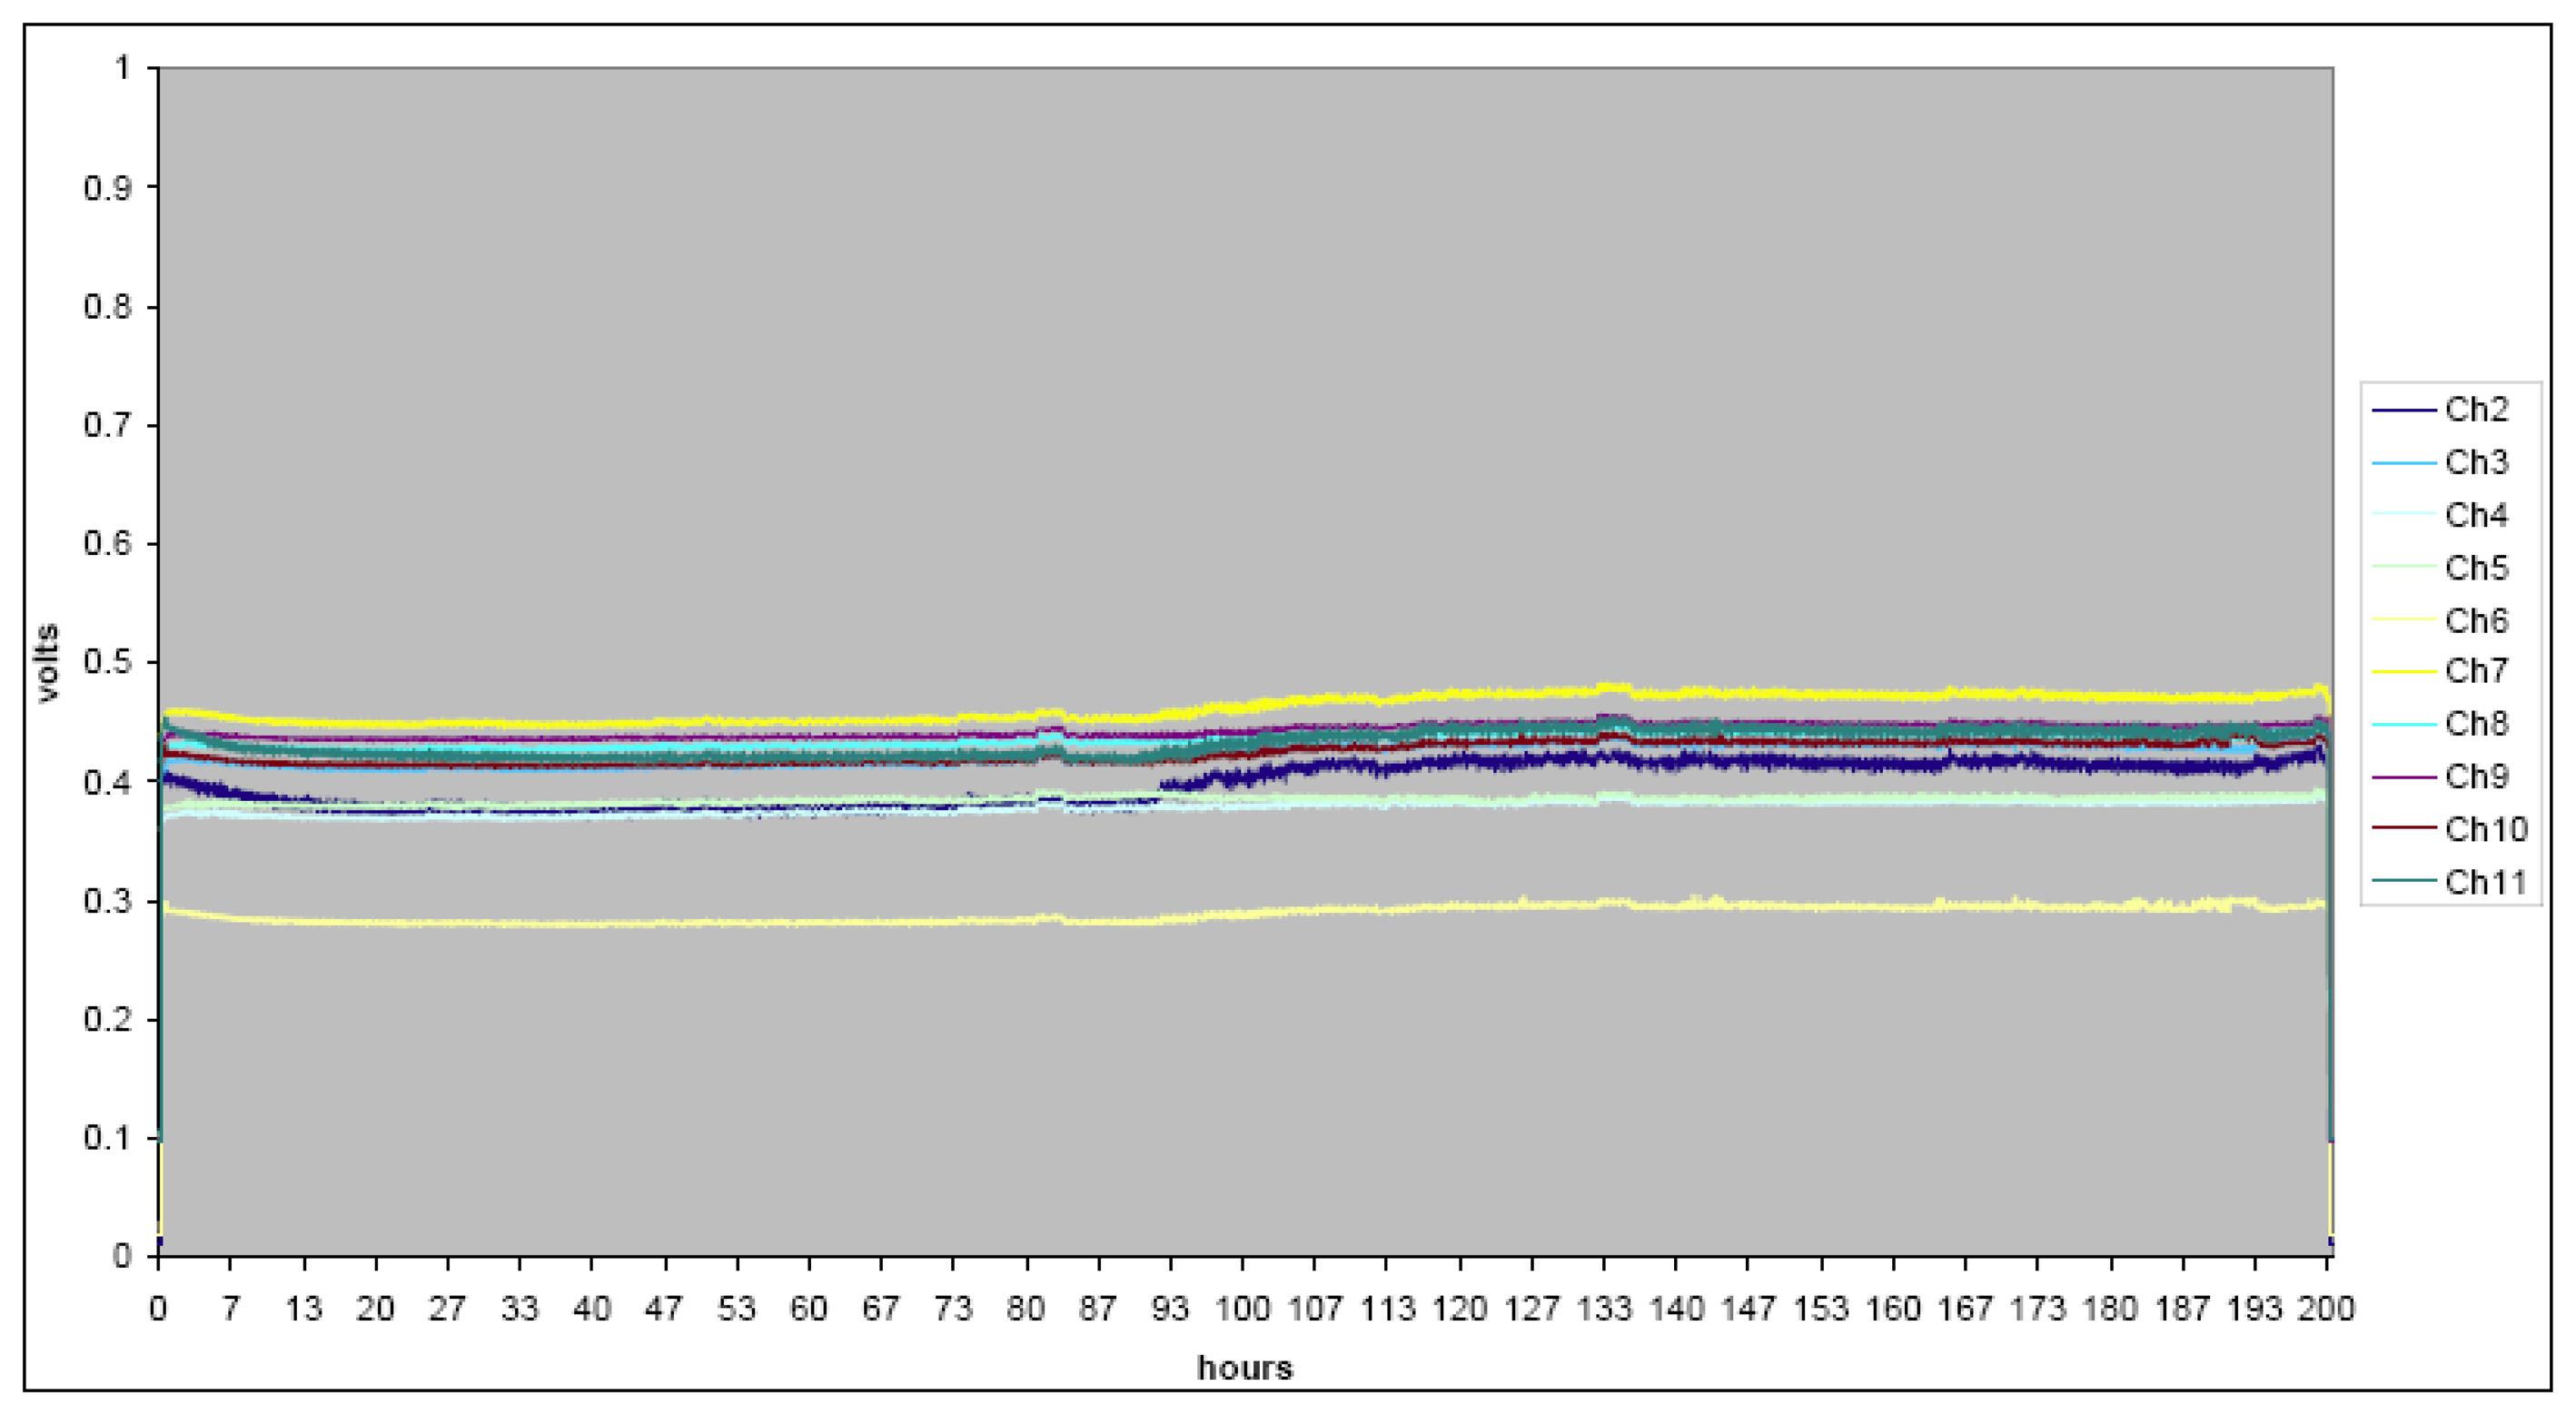
Figure 5.
Lognormal probabilistic paper for calculating the median time of the failure distribution for fatigue fracture.
Figure 5.
Lognormal probabilistic paper for calculating the median time of the failure distribution for fatigue fracture.

Figure 6.
Arrhenius plot for calculating the median life of the failure rate distribution at 25°C, for the batch of MEMS accelerometers affected by fatigue fracture.
Figure 6.
Arrhenius plot for calculating the median life of the failure rate distribution at 25°C, for the batch of MEMS accelerometers affected by fatigue fracture.


Table 1.
Possible role of the reliability engineer vs. product reliability and a priori known information
| Position of the reliability engineer | Product reliability | A priori known Information |
|---|---|---|
| Member of the development team | Low reliability, many failures in reliability tests | Batch history, application environment |
| Member of the manufacturing team | Good reliability, a few failures in reliability tests | Batch history, application environment, weak points of the design, field data |
| Providing a service for a product user | High reliability, no (very few) failures in reliability tests | Data sheet of the product |
| Sample (no. of items) | Ambient Temp. | Mechanical Stress / Electrical Stress | Duration |
|---|---|---|---|
| S1 (9) | 85°C | Frequency: 1500 Hz, Amplitude: 6 g | 200 h |
| S2 (9) | 145°C | Frequency: 1500 Hz, Amplitude: 6 g | 200 h |
| S3 (6) | 25°C | Tilting (wing) / Bias | 1000 h |
| S4 (6) | 100°C | Tilting (axial) / Bias | 1000 h |
| S5 (6) | 125°C | Tilting (axial) / Bias | 1000 h |
| Parameter | Test Condition | Min. | Max. |
|---|---|---|---|
| Zero-g Level (Voff) | T = 25°C | Vdd/2-10% | Vdd/2+10% |
| Self test Output Voltage Change (Vt) | T = 25°C; Vdd=3.3V Full-scale = 2g; X axis | -20mV | -100mV |
| T = 25°C; Vdd=3.3V Full-scale = 2g; Y axis | 20mV | 100mV | |
| T = 25°C; Vdd=3.3V Full-scale = 2g; Z axis | 20mV | 100mV | |
| Supply Current (Idd) | Mean value Power down (PD) pin connected to GND | 1.5mA |
| Parameter | Test Condition | Min. | Max. |
|---|---|---|---|
| Acceleration Range (Ar) | Full-scale (FS) pin connected to GND | ±1.8 | |
| Full-scale pin connected to Vdd | ±5.4 | ||
| Sensitivity (So) | Full-scale = 2g | Vdd/5–10% | Vdd/5+10% |
| Full-scale = 6g | Vdd/15–10% | Vdd/15+10% | |
| Non Linearity (NL) | Best fit straight line Full-scale = 2g; X, Y axis | ±1.5% FS | |
| Best fit straight line Full-scale = 2g; Z axis | ±2% FS | ||
| Cross-Axis | ±4% |
Table 5.
Maximum value of the failure rate vs. parameters of the lognormal distribution and activation energy
| Variant | Median time of the lognormal distribution tm(h) | Standard deviation of the lognormal distribution σ | Activation energy with temperature of the failure mechanism EA(eV) | Maximum value of the failure rate λ (h-1) | Time moment of the maximum value for the failure rate (h) |
|---|---|---|---|---|---|
| 1 | 2 × 10⁷ | 1.2 | 1.0 | 3.5 × 10⁻⁸ | 1.5 × 10⁷ |
| 2 | 6 × 10⁷ | 2.0 | 1.0 | 10-8 | 107 |
| 3 | 2 × 10⁶ | 1.2 | 0.8 | 3.5 × 10⁻⁷ | 1.5 × 10⁶ |
| 4 | 8 × 10⁶ | 2.0 | 0.8 | 8 × 10⁻⁸ | 2 × 10⁶ |
© 2007 by MDPI ( http://www.mdpi.org). Reproduction is permitted for noncommercial purposes.
Share and Cite
MDPI and ACS Style
Bâzu, M.; Gălăţeanu, L.; Ilian, V.E.; Loicq, J.; Habraken, S.; Collette, J.-P. Quantitative Accelerated Life Testing of MEMS Accelerometers. Sensors 2007, 7, 2846-2859. https://doi.org/10.3390/s7112846
AMA Style
Bâzu M, Gălăţeanu L, Ilian VE, Loicq J, Habraken S, Collette J-P. Quantitative Accelerated Life Testing of MEMS Accelerometers. Sensors. 2007; 7(11):2846-2859. https://doi.org/10.3390/s7112846
Chicago/Turabian StyleBâzu, Marius, Lucian Gălăţeanu, Virgil Emil Ilian, Jerome Loicq, Serge Habraken, and Jean-Paul Collette. 2007. "Quantitative Accelerated Life Testing of MEMS Accelerometers" Sensors 7, no. 11: 2846-2859. https://doi.org/10.3390/s7112846