Object-Based Classification of Ikonos Imagery for Mapping Large-Scale Vegetation Communities in Urban Areas

1
Spatial Ecology Research Facility, School of Surveying, University of Otago, PO Box 56, Dunedin, New Zealand
2
Earth Observation Research Group, Natural Resources & Environment, CSIR, PO Box 395, Pretoria 0001, South Africa
3
Centre for Advanced Computational Solutions, Lincoln University, PO Box 84, Lincoln, New Zealand
*
Author to whom correspondence should be addressed.
Sensors 2007, 7(11), 2860-2880; https://doi.org/10.3390/s7112860
Submission received: 13 September 2007
/
Accepted: 19 November 2007
/
Published: 20 November 2007
(This article belongs to the Special Issue Sensors for Urban Environmental Monitoring)
Abstract
:Effective assessment of biodiversity in cities requires detailed vegetation maps. To date, most remote sensing of urban vegetation has focused on thematically coarse land cover products. Detailed habitat maps are created by manual interpretation of aerial photographs, but this is time consuming and costly at large scale. To address this issue, we tested the effectiveness of object-based classifications that use automated image segmentation to extract meaningful ground features from imagery. We applied these techniques to very high resolution multispectral Ikonos images to produce vegetation community maps in Dunedin City, New Zealand. An Ikonos image was orthorectified and a multi-scale segmentation algorithm used to produce a hierarchical network of image objects. The upper level included four coarse strata: industrial/commercial (commercial buildings), residential (houses and backyard private gardens), vegetation (vegetation patches larger than 0.8/1ha), and water. We focused on the vegetation stratum that was segmented at more detailed level to extract and classify fifteen classes of vegetation communities. The first classification yielded a moderate overall classification accuracy (64%, κ = 0.52), which led us to consider a simplified classification with ten vegetation classes. The overall classification accuracy from the simplified classification was 77% with a κ value close to the excellent range (κ = 0.74). These results compared favourably with similar studies in other environments. We conclude that this approach does not provide maps as detailed as those produced by manually interpreting aerial photographs, but it can still extract ecologically significant classes. It is an efficient way to generate accurate and detailed maps in significantly shorter time. The final map accuracy could be improved by integrating segmentation, automated and manual classification in the mapping process, especially when considering important vegetation classes with limited spectral contrast.
1. Introduction
Green space plays a major role in providing satisfactory environmental conditions for urban dwellers. Vegetation is a vital component as it affects key environmental processes: e.g. air filtering, micro climate regulation, and rainwater drainage (Bolund and Hunhammar 1999). In recent years there has been an increasing awareness both in the importance of urban ecosystems as a source of biodiversity (Cornelis and Hermy 2004; Sandstrom et al. 2006; Smith et al. 2006), and in the need to inventory, restore, or enhance biodiversity in cities (Savard et al. 2000). Changes of species arrangement may alter the capability of vegetated areas to provide ecosystem services (Andersson 2006). Further, it is suggested that the future of global nature conservation may rely increasingly on conservation of biodiversity in cities. As more and more humans become city dwellers, their willingness to protect biodiversity may depend on their day to day experience of nature in cities (Savard et al. 2000; Dunn et al. 2006).
The conservation and enhancement of vegetation communities by urban planners and ecologists requires a detailed and updated knowledge of their nature and distribution (Millington and Alexander 2000; Breuste 2004). Aerial photographs are primary data sources for detailed mapping of urban vegetation (Seidling 1998; Freeman and Buck 2003). The mapping process is generally based on photo-interpretation and manual digitizing of thematic units using a combination of spatial image properties (size, shape, texture, pattern) and spectral properties (tone, colour). Heavy reliance on the interpreter's expertise is both the strength and weakness of this approach; such maps are richly detailed but the process is time consuming (Freeman and Buck 2003). Automatic or semi-automatic delineation of vegetation units may provide an important time saving technique.
Earlier satellite sensors (Landsat MSS, TM), having a spectral band in the near infrared part of the spectrum, had good spectral resolution however, they had too coarse a spatial resolution to produce detailed maps in urban areas. Today very high resolution (VHR) satellites are capable of providing spatial details compatible with urban mapping (Thomas et al. 2003; Nichol and Lee 2005). Ikonos or Quickbird images (4 to 2.5 meter pixel size) have been used for mapping urban impervious surfaces, roads, and buildings (Sawaya et al. 2003; Péteri et al. 2004). With regards to vegetation, some researchers have dealt with vegetation density and abundance (Small 2003; Nichol and Lee 2005), and others with vegetation condition (Stow et al. 2003). Still others focused on the production of land use/land cover maps, but these generally include only two or three vegetation classes (Herold et al. 2003; Jain and Jain 2006; Carleer and Wolff 2006). Such data is very useful for understanding a wide range of environmental and socio-economic issues such as urban micro-climate and heat island effects, air quality and human health, and housing values. However, the thematic precision of past studies is generally insufficient for studying urban ecological processes and assessing biodiversity resources. Habitat studies, for example, often require more detailed inventories due to the fact that differences in vegetative structure and species composition (e.g. native versus exotic), are often critical for wildlife (Hostetler 1999; Cunningham 2006; Johnson et al. 2007).
Conventional classification methods use per pixel approaches (Bayesian theory or artificial neural networks) that rely only on the spectral information or colours contained in the image. As the spatial resolution increases, between-class spectral confusion and within-class spectral variation increases. This is especially true in urban environments that typically consist of mosaics of small features made up of different materials. Consequently, spatial information such as texture and context must receive greater attention in the classification process to produce more accurate maps (Blaschke and Strobl 2001; Shackelford and Davis 2003).
Different approaches have been developed to deal with the complexity of urban environments. These include: kernel based reclassification (Zhang and Wang 2003), texture analysis and expert systems (Stefanov et al. 2001; Herold et al. 2003), and lacunarity and fractal approaches (Myint and Lam 2005). Object-based classification techniques provide another alternative that have already demonstrated the potential for improving the automatic extraction of information from VHR imagery (Giada et al. 2003; Benz et al. 2004). Object-based techniques recognize that important semantic information is not always represented in single pixels but in meaningful image objects and in their contextual relations. For example, it is more likely that a pixel adjacent to a private garden should be classified house, road or private garden rather than forest. Object-based classification comprises two steps: image segmentation and object classification. Image segmentation subdivides the image into groups of contiguous pixels called objects or segments that correspond to meaningful features or targets in the field (Blaschke and Strobl 2001). These objects might be roads, houses, water bodies, pine plantation, native forest, and so on. The images are segmented into homogeneous objects based on the spectral information and local patterns or textural information that are included in groups of neighbouring pixels. Object-based classifications can consider a wide range of variables, e.g. reflectance, texture, shape, size of objects, and can potentially produce more accurate and detailed maps than conventional classification strategies.
Urban ecosystems have received little attention in New Zealand compared to rural or protected ecosystems (Freeman 1999). The first detailed ecological map of a New Zealand city, Dunedin, was produced by manually digitizing and interpreting vegetation units from colour aerial photographs and field based ecological surveys (Freeman and Buck 2003). In their study, Freeman and Buck proposed an original habitat classification hierarchy applicable to New Zealand cities. The technique, useful for detailed mapping, has proven to be time consuming, thus introducing significant limitations for its future extension and development. In this paper we undertook to assess the suitability of an alternative method. This method combined very high resolution multispectral Ikonos images and object-based classifications in the automated production of large-scale maps of vegetation communities in urban environments.
2. Study Area
The study area includes the core urban sector of Dunedin City and the immediate surrounding rural areas. Dunedin is located on the south-east coast of the South Island of New Zealand. It is a medium-sized city by New Zealand standards with a population of approximately 114,000 people (Statistics New Zealand 2005). The Central Business District (CBD) is located on flat terrain near the harbour while the residential areas are distributed in the surrounding hills located north, west and south-east of the CBD. Situated at 170°30′ East and 45°52′ South, Dunedin has a cool temperate, sub-humid maritime climate. It harbours a wide range of vegetation types, including native remnants, exotic plantations, pasture lands, indigenous tussock, flax vegetation, and regenerating scrubs and bushes. It also includes recreation parks, sports pitches, three cemeteries, and a large Botanic Garden (Freeman and Buck 2003). The topography is gentle to moderately rolling (slopes between 8 and 25 degrees) with elevations ranging from sea level to approximately 400 metres.
3. Data and Methods
3.1. Ikonos images and preprocessing
One in-track panchromatic Ikonos stereo pair (one meter spatial resolution) was acquired on the 20th of February 2005 and used to generate an accurate Digital Surface Model (DSM). One multispectral Ikonos image (100 km2) was programmed on the same mid-summer day to map the vegetation communities. The multispectral image had a spatial resolution of four metres and included four spectral bands (blue, green, red, and near infra-red). The images were provided with rational polynomial coefficients to enable users to orthorectify the imagery (Dial et al. 2003). PCI Geomatica Orthoengine V9.0 was used with the DSM for orthorectifying the multispectral Ikonos image. The validation of the orthorectified product with sixteen independent and well distributed control points yielded an average and maximum geolocation error of 1.4 and 3.1 metres, respectively.
3.2. Multi-scale image segmentation and classification
3.2.1. Image segmentation
The object-based classification software used in this research was eCognition Professional 4.0 (Definiens). eCognition uses a multi-resolution segmentation approach which is a bottom-up region-merging technique starting with one-pixel objects. In numerous iterative steps, smaller image objects are merged into bigger ones (Baatz et al. 2004). The outcome of the segmentation algorithm is controlled by a scale factor and a heterogeneity criterion. The scale factor is indirectly related to the average size of the objects to be detected (see example Figure 1). The heterogeneity criterion controls the merging decision process, and is computed using spectral layers (e.g. multispectral images) or non-spectral layers (e.g. thematic data such as elevation). The heterogeneity criterion includes two mutually exclusive properties: colour and shape. Colour refers to the spectral homogeneity whereas shape considers the semantic characteristics of the objects. Shape is divided into two equally exclusive properties: smoothness and compactness (Baatz et al. 2004).
The optimum segmentation parameters depend on the scale and nature of the features to be detected. These were determined using a systematic trial and error approach validated by the visual inspection of the quality of the output image objects, i.e. how well the image objects matched feature boundaries in the image. Once an appropriate scale factor was identified, the colour and shape criterion were modified to refine the shape of the image objects. Most published works have found that more meaningful objects are extracted with a higher weight for the colour criterion (Herold et al. 2002; Laliberte et al. 2004). In this application the colour criterion was assigned a weight of 0.7, whereas the shape received the remaining weight of 0.3 (compactness 0.5 and smoothness 0.5). Two key hierarchical scale levels were identified. A first level was used to stratify the urban areas and a second, more detailed level, was created to map vegetation communities within the vegetation-dominated strata.
3.2.2. Stratification of urban areas
A 125-scale segmentation layer was created to stratify the study area according to four broad classes or strata: industrial / commercial (low vegetation density), residential (intermediate vegetation density), vegetation (high vegetation density), and water (Figure 2). The four classes were classified with the nearest neighbour (NN) classifier. The NN classifier allows quick and straightforward classification and can use a variety of variables related to spectral, textural, shape and/or contextual properties of the image objects (Baatz et al. 2004). At this level we used the mean features of the four spectral bands, as these (especially the NIR) are good representations of the variation of vegetation density between classes. A few wrongly-classified image objects were reassigned manually to the correct classes based on local knowledge and the Ikonos image. A similar technique was used to refine some boundaries between strata. The industrial / commercial stratum consisted of the CBD and other significant peripheral industrial / commercial sectors. These included mainly commercial and industrial buildings with only few small vegetation patches such as amenity pastures and tree groups. Residential blocks consisted essentially of well structured patterns intermixing roads, single or double storey individual houses, and private backyard gardens of various size and density. The extraction of private gardens from the residential strata is detailed in Mathieu et al. (2007). Any vegetation communities or patches larger than 0.8/1 ha (e.g. plantation, native scrub, forest, dune grassland) were automatically classified into the vegetation stratum. In this paper, we focus on the vegetation stratum where the vegetation patches are believed to be of sufficient size to have functional ecological processes and to host some self-sustainable plant and animal populations.
3.2.3. Fine scale vegetation mapping
A smaller scale factor (40) was found appropriate to extract the vegetation communities from the vegetation stratum. We used a classification scheme adapted from the habitat classification systems developed by Freeman and Buck (2003) and adapted to the New Zealand urban environment (Table 1). This is a hierarchical system based on physiognomic vegetation units and derived from previous classification systems (Atkinson 1985). The first level starts with broad structural categories such as tree habitats or shrubland; the second level introduces finer categories where species arrangement and canopy cover are included. The third level (not shown) generally concerns more detailed species-based class differentiation, and is used especially for woody habitats. Native shrublands, for example, are classified as broadleaf shrublands, tea-tree shrublands, grey shrublands or mixed native shrublands. We restricted our classification to the first two levels of Freeman and Buck's classification system. Some marginal classes (small and/or localized in the city or at close proximity) were not considered in our classification as it would have been impossible to collect appropriate samples to train the classifier and to assess the final map accuracy (e.g. saline wetland, indigenous fernland).
A total of 280 image objects were selected and surveyed in the field to serve as training samples for the classification. The study area was divided into four quadrants of equal size. The number of training samples selected for each class was proportional to its importance in terms of area covered, with a minimum of one sample per quadrant for the smallest classes. The samples were originally selected using the earlier habitat map produced by Freeman and Buck (2003) and were checked in the field during the autumn 2005. A series of data was collected to assist the classification: site dimension, habitat type, land use type, slope, aspect, elevation, dominant species, and vegetation density and structure (tree, shrub, and grass). The habitat and land use classes of the surrounding image objects were also recorded when possible. The classification of the vegetation stratum was also performed using the nearest neighbour (NN) algorithm. Thirteen variables were considered to build the NN feature space:
- Mean spectral value of image objects,
- Standard deviation of spectral values of image objects,
- Ratio of mean spectral value to sum of all spectral layer mean values of image objects,
- Compactness of image objects (length x width / number of pixels).
The three first above-mentioned variables were computed for each of the four spectral bands of the Ikonos image. An optimised feature space was finally selected by observing the best separation distance between vegetation communities. The classification output was refined by implementing simple expert rules. The rules were implemented by assigning crisp membership functions. The membership function receives a value 1 (yes) if the rule is observed (e.g. plantation larger than one ha) or a value 0 (no) if the rule is not observed (e.g. plantation smaller than one ha). If the rule is observed an action is undertaken. The following rules were applied:
- If plantation smaller than one hectare then reclassify as tree group.
- If forest smaller than one hectare then reclassify as tree group.
- If tree group larger than one hectare then reclassify as second best class.
3.3. Accuracy assessment
The accuracy assessment focused on the vegetation communities within, or at close proximity, to the city. A total of 370 validation polygons were surveyed in the field to define their membership to one of the categories of vegetation communities. Sixteen validation polygons were discarded as they could not be accessed or were found to include two or more vegetation classes on the ground. The total sample consisted of 1.3% of the vegetation strata which is above the one percent generally recommended (Congalton 1991). Typical confusion matrices were built to assess the accuracy of the vegetation classifications (Congalton 1991). Classes predicted by the NN classifier were compared to classes observed in the field. The confusion matrices were built using the polygons as validation units. These are the basic spatial units of the vegetation maps, and thus are believed to be more appropriate to assess the classification than individual pixels. Although the polygons have various size (including many pixels) each of these is assumed to correspond to a single and coherent vegetation patch. In our opinion, individual pixels cannot be considered as independent objects (because of autocorrelation effects) and could potentially bias the classification assessment.
Descriptive statistics (user's accuracy, producer's accuracy, overall accuracy) as well as kappa statistics (κ) were computed and analyzed (Congalton 1991). The κ statistic measures the accuracy of the whole confusion matrix considering the actual agreement in relation with chance agreement. It provides an indicator showing whether the classification is better than a random classification. Test statistic values (Z-statistic) were compared with the critical value 2.57 (Zα/2) to determine the significance of the classification accuracies at 99% confidence interval (Congalton and Green 1999). We also used the categories proposed by Landis and Koch (1977) to assess the performance of the statistics: poor (< 0.41), moderate (0.41 to 0.61), good (0.61 to 0.81), and excellent (> 0.81). Although these categories are arbitrary they provide useful qualitative benchmarks.
4. Results
Table 2 presents the confusion matrix of the vegetation community map with fifteen classes. Confusion occurred between amenity grass (14%) and pasture grass (13%). Rough grass was confused mainly with exotic shrub (16%) and with mixed shrub (12%). Dune grass was confused with native shrub (33%) and rough grass (17%). Forest was mainly confused with vineland (14%) whereas park/woodland was confused with forest (33%) and tree group (17%). Tree group was confused with park/woodland (27%). Strong confusion occurred between the scrub and shrub vegetation communities, and also with vineland and park/woodland. The overall accuracy of the classification was a moderate 63.6% (Figure 3). Dune grass and plantation had 100% user's accuracy. Pasture grass, rough grass, forest, and exotic scrub user's accuracy were higher than 80%. Poor user's accuracy was obtained for vineland (10%), park/woodland (15%), native shrub (21.7%), exotic shrub (32.5%), and mixed shrub (39.1%). Most vegetation community classes had higher user's accuracy than producer's accuracy.
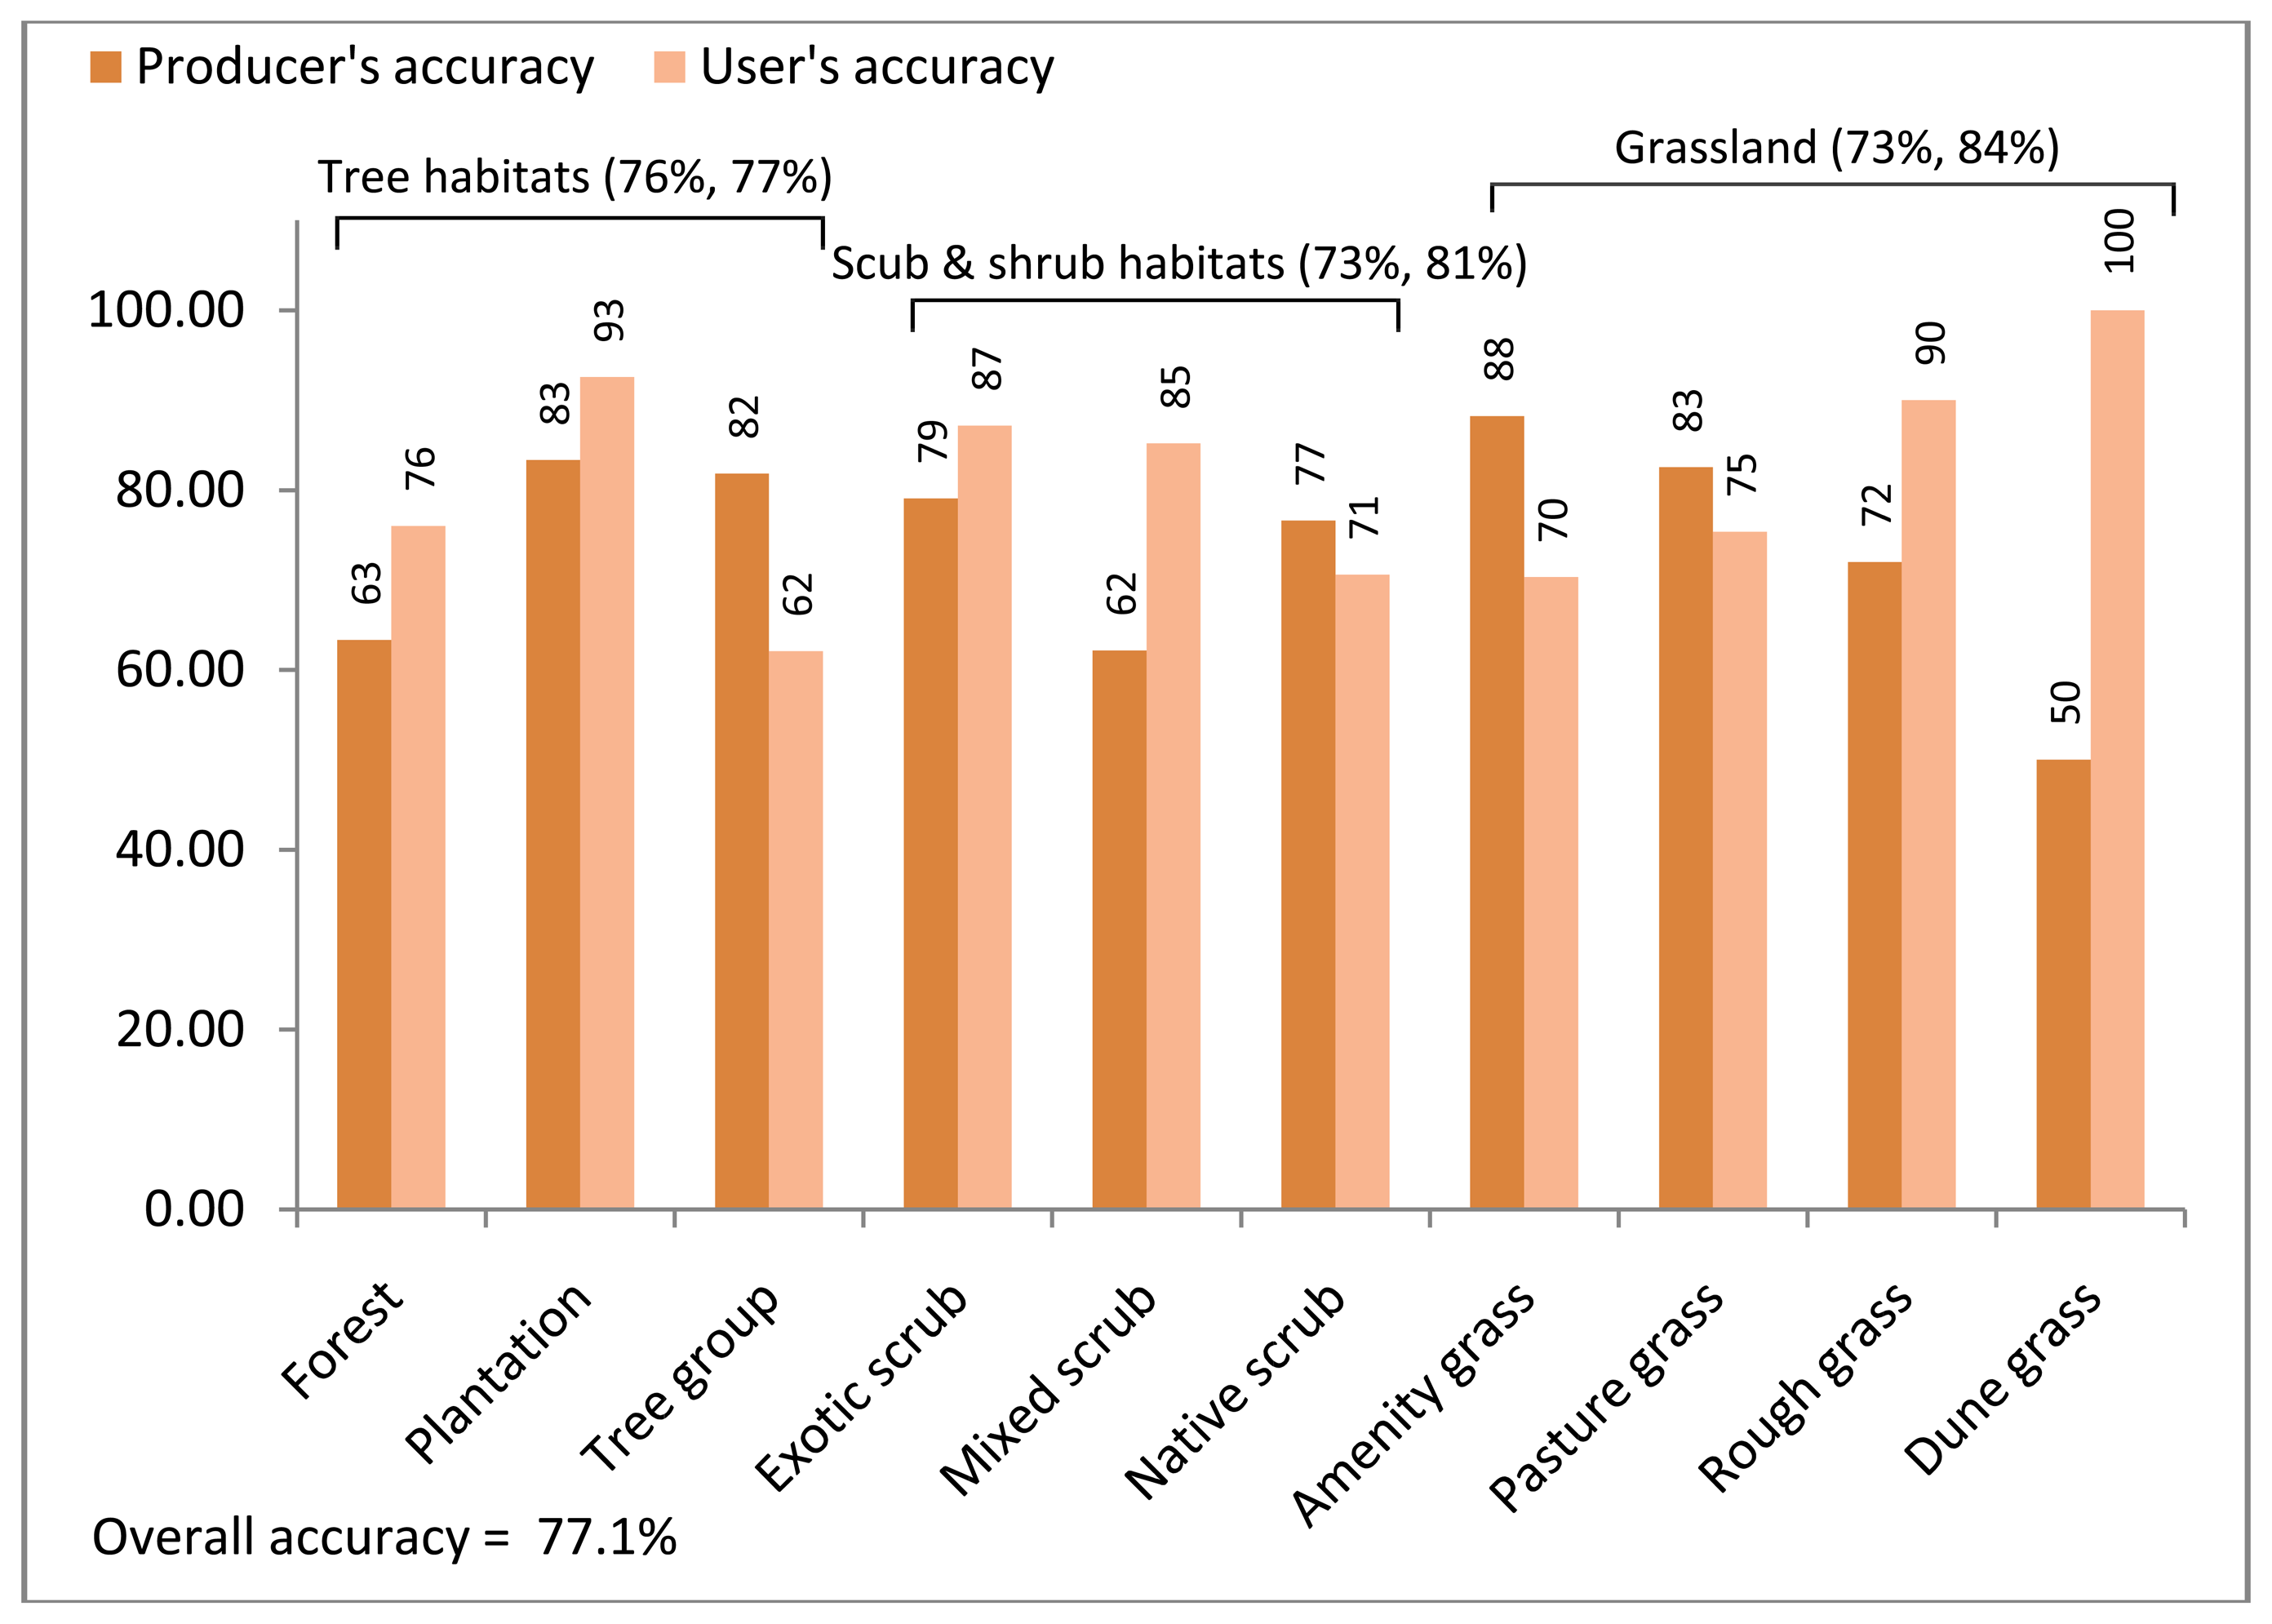
The confusion in classification noted above led to a regrouping of classes and the creation of a simplified classification scheme. The highest levels of confusion were found in the following classes: vineland, park/woodland, scrub, and shrub communities. Vineland and park/woodland only cover a small percentage of the total land area in Dunedin City, 0.1% and 2.4% of the vegetated areas respectively (Freeman and Buck 2003), and were discarded. The six scrub and shrub classes were merged to create three classes: exotic scrub, mixed scrub, and native scrub. The simplified classification scheme consisted of four grass classes (amenity grass, pasture grass, rough grass, and dune grass), three tree classes (forest, plantation, and tree group), and three scrub classes (exotic scrub, mixed scrub, and native scrub). Table 3 presents the confusion matrix of the vegetation community map with ten rather than fifteen classes. Some confusion persisted, although generally to a much lesser extent. Dune grass was confused with amenity grass (17%), rough grass (17%), and native scrub (17%). Forest was mainly confused with tree group (17%) and native scrub (13%). Tree group was confused mainly with amenity grass (14%). The main confusion of mixed scrub was that with amenity grass (8%), forest (8%), and native scrub (8%). Native scrub was also confused with pasture grass (9%). The overall accuracy of the simplified classification was good at 77.1% (Figure 4). All classes had more than 60% user's accuracy. Out of ten classes five had more than 85% user's accuracy and three had between 75% and 85% user's accuracy.
Both classifications were found to be statistically significant and better than random classifications:
- Classification fifteen classes: κ = 0.52, Z-statistic = 17.5
- Classification ten classes: κ = 0.74, Z-statistics = 25.2
The κ value of the original classification (15 classes) was in the mid section of the “moderate” range while the κ value of the simplified classification (10 classes) was close to the “excellent” range. Conditional κ values were also computed for each vegetation class of the simplified classification (Congalton and Green 1999). Excellent agreement or good agreement was found for five and four classes respectively. Only the tree group class had a moderate agreement, although very close to the good range (Table 4). The classification results were considered satisfactory for the classes having a good or excellent agreement to their reference category.
The areas of the vegetation communities and other habitat types (built-up areas, bare ground, water, and sand) were computed for the whole city (Table 5). The urban area was delineated by creating a buffer of 200 meters outside the main settlements (including the residential stratum and the industrial / commercial stratum). The city included 1884 ha (57.8%) of vegetation communities (excluding the private gardens within the residential area), while 1385 ha (42.2%) consisted of non-vegetated habitat types. The most represented vegetation class was amenity grass with 502 ha (15.4%) and the least represented class was dune grass at 7 ha (0.2%).
5. Discussion
5.1. Classification accuracy
Vegetation communities found in urban areas share many similarities with the communities of more natural or agricultural environments, but they also present some substantial differences. Vegetation fragmentation is high in cities, and can be extreme, with patches of various sizes, generally fairly small, isolated within a harsh matrix of mostly impervious materials. In this highly modified and landscaped environment vegetation associations tend to be complex and heterogeneous, from a point of view of structure (e.g. mixes of trees, shrubs, and lawn patches in recreational parks) or of species association (e.g. various mixes of indigenous and exotic vegetation). Finally, some communities are more typically associated with the built environments and are essential components of urban ecology (Meurk and Hall 2000), for instance amenity pastures (e.g. sports fields), recreational parks (e.g. botanical gardens), or private gardens. The high heterogeneity and small patch size of urban vegetation has limited the earlier use of satellite imagery for detailed ecological mapping in cities. This has become technically feasible in the recent years with the availability of very high resolution satellite imagery (Nichol al. 2007), although the data processing is not fundamentally different from what would be implemented in a more natural setting. The availability of appropriate datasets has matched an increase of interest in urban ecology as well as an increase of attention given to the quality of life in cities. Emerging techniques such as object-based classification techniques are also well suited to urban mapping in their capacity of handling higher level of data heterogeneity and more complex spatial patterns. While examples of thematically detailed vegetation mapping using satellite imagery are numerous at medium and fine scales in natural environments (Rutchey and Vilcheck 1994; Mickelson et al. 1998; Thenkabail et al. 2004; Bock et al. 2005; Yu et al. 2006), few examples have been reported in urban areas. This research intended to contribute to fill this gap.
The two classifications of urban vegetation presented in this research have overall accuracies ranging from 63.6% to 77.1% (κ value from 0.52 to 0.74) for fifteen and ten classes, respectively. Classification accuracy is largely dependent on the number of classes considered, i.e. the accuracy generally increases when the number of classes decreases. However, the spectral contrast between classes, class heterogeneity, and the purity of collected samples (both for training and validation), play a vital role in increasing or decreasing the overall accuracy. Similar accuracy results were reported in fine-scale habitat mapping with very high resolution satellite imagery. Keramitsoglou et al. (2005), for example, used a kernel based re-classification method for mapping five habitat classes (Lake Kerkini, Greece) and obtained 71% overall accuracy. Bock et al. (2005) using an object-based classification system extracted eight vegetation classes with 81% overall accuracy from a Quickbird image (Wye Downs, UK). Thenkabail et al. (2004) reported an overall accuracy of 48% for nine vegetation classes in tropical rainforests (Akok, Cameroon). Yu et al. (2006) implemented an ambitious species-based vegetation classification of very high resolution airborne imagery. They obtained an average accuracy of 48.2% for 43 vegetation classes with a large variation between classes (from 4 to 100%, standard deviation = 21.2%). Most of these projects dealt with protected or rural environments. In urban areas Zhang and Feng (2005) achieved 97% overall accuracy, but only considered two vegetation classes, i.e. tree and grass.
The accuracy assessment of the original classification (fifteen classes) showed that classes such as vineland; park/woodland; scrub communities, and shrub communities yielded low user's and producer's accuracies. The discrimination of urban vegetation communities at such a detailed level produced a map with limited reliability. Difficulty arises from similarities in spectral reflectance and hence in spectral signatures among some classes. Vineland is a scrubby habitat heavily covered by woody vines and was confused with other scrub and shrub classes. Although ecologically significant, vineland is also one of the least represented habitats in the city. Similarly, it was difficult to automatically classify park/woodland as this class appears to lack a unique character. Park/woodland is an anthropogenic habitat characterized by clumped trees/shrubs scattered over exotic grassland. The heterogeneous nature of park/woodland makes it often difficult for the segmentation process to identify the boundaries of this vegetation community. A high level of confusion also occurred between native, exotic, and mixed shrublands and scrub habitats. This confusion occurred for several reasons. Shrublands differ from scrubs by having a lower density of woody materials and generally being more open vegetation communities. The change from scrub to shrubland is a natural continuum, thus a subjective decision is required to establish the boundary. The decision whether an object is in one class or another can be based on small density differences. Further, mixtures of native and/or exotic plant species often produce canopies with very close structure and colour. However, scrub habitats dominated by a single species were an exception in the sense that they tended to be easier to detect; for example, gorse-dominated (Ulex europaeus) vegetation communities exhibit typical canopies with yellow flowers. For similar reasons complex arrangements of native and exotic species were also not easily recognizable from detailed colour aerial photographs in Freeman and Buck's project (Claire Freeman, Pers. Comm.). A high accuracy in the classification of these complex habitats was found to require intensive field checks. This relied upon experienced field ecologists capable of identifying a large number of plant species. Moreover, boundaries between natural (e.g. native habitat) and semi-natural plant communities (e.g. mixed habitats) are typically gradual and diffuse as compared to the sharp boundaries of anthropogenic habitats such as pine plantation or amenity grass. This creates subjectivity or uncertainty in boundary detection, which in turn generates classification inaccuracies.
5.2. Object-based approach and urban ecological mapping
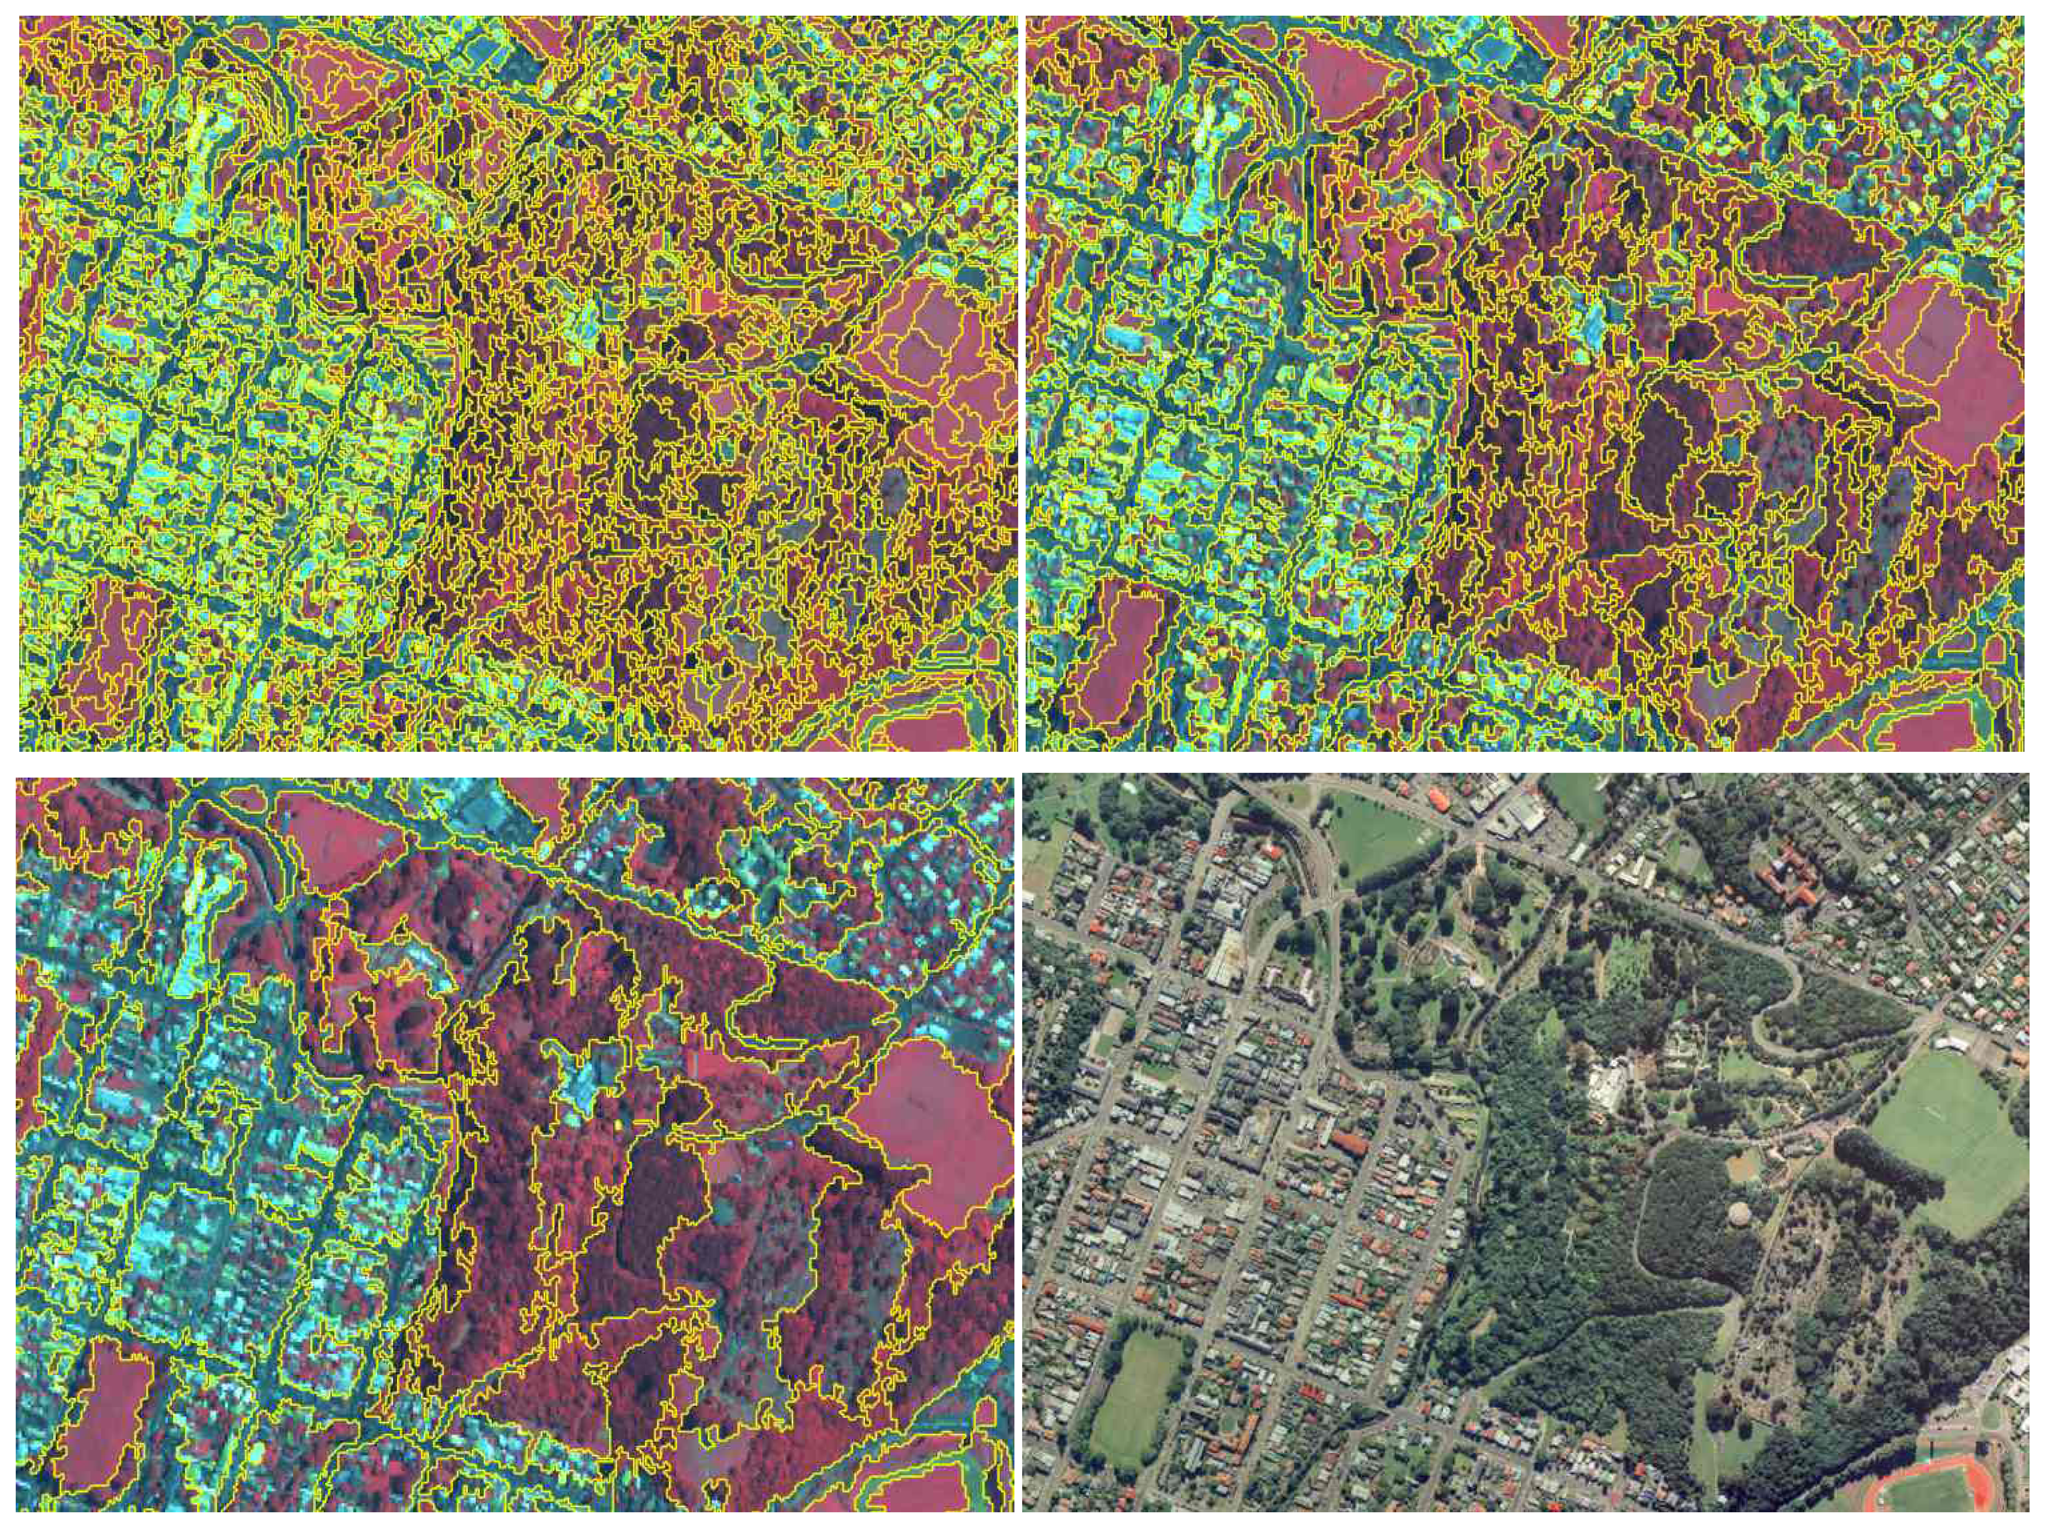
Classifications produced with object-based techniques are readily available in vector format and can be directly imported and analyzed in a vector-based GIS package (e.g. ArcGIS). This is a significant advantage over traditional per-pixel classification techniques which produce raster-based maps. No post processing operation is required to clean up individual misclassified pixels, i.e. salt and pepper effect. Object-based classifications use a segmentation process to identify and delineate meaningful targets in digital images. An important point is that the segmentation process can be seen as an automated digitizing of target boundaries. Figure 1 shows that the scale 40 delineates vegetation units such as amenity grass, tree groups, park/woodland, bush and forest quite well in the Botanical Garden of Dunedin. This automated extraction of objects is by itself very cost-effective as it reduces the necessity for laborious on-screen digitizing, which is by far the most time-consuming task of the standard photo-interpretation process (Freeman and Buck 2003). More research is required to assess or validate the quality or geometric accuracy of the objects generated by the segmentation. For instance, Moller et al. (2007) proposed a comparison index to support the selection of an optimal segmentation scale. However, Baatz et al. (2004) suggested that beyond quantitative evaluation of segmentation procedures, no segmentation result is fully convincing if it does not satisfy the human eye.
In contrast to pixel-based classification, the manual reclassification of wrongly classified objects or polygons is technically feasible, although it may be time consuming, thus cancelling the relative advantages of the exercise. In this research, manual reclassification was successfully used to correct some obvious confusion, such as the confusion of plantation or amenity grass with other classes. The decision to reclassify an object was only based on the photo-interpretation of the Ikonos image which is the main source of decision support for the classification. Further, we believe that a combination of strategies, including automated segmentation and classification, as well as manual classification, could be the most appropriate approach when a large amount of thematic and geometric details are required to map vegetation communities or habitats in urban environment.
The manual digitising and photo-interpretation of vegetation units from colour aerial photographs produced semantically more detailed vegetation maps than those we produced (Freeman and Buck 2003). However, in Freeman and Buck's study a significant fieldwork component was still required to ensure the most accurate distinction between some vegetation communities (e.g. mixes of native and exotic habitats). Manual digitising of vegetation units is a valid option in the case of small- and medium-sized cities, although cost issues may limit the mapping exercise to large vegetation patches such as remnants and indigenous habitats. For a city the size of Dunedin, a vegetation community map took a single researcher approximately a year to complete (Claire Freeman, Pers. Comm.). The manual approach becomes more difficult in large cities, especially if smaller vegetation patches have to be extracted. In this case, automated segmentation and object-based classification with Ikonos imagery is more cost effective, but has the semantic limitations shown in this research. To cater for these deficiencies a third option would be to make greater use of manual classification and to undertake more systematic field checks, both for the most difficult classes (e.g. scrub and shrublands), and also in areas where there is a high diversity of habitats. The discrimination of certain vegetation communities, e.g. dense vs. more open habitats, may be improved by applying object-based techniques to higher multi-resolution image products such as fused panchromatic and multispectral images. Fusion techniques are available, which merge into one unique dataset the high spectral quality of multispectral images and the high spatial quality of their panchromatic counterparts, e.g. Ikonos, multispectral 4 meters and panchromatic 1 meter (Ranchin et al., 2000). A third level of scale could be investigated by applying object-based classification techniques to digital aerial photographs. This could include the near infrared band which is the most sensitive part of the spectrum to vegetation types and density (Guyot, 1990). With a potential ground pixel size anywhere between 5 and 50 centimetres, micro-scale vegetation or biodiversity features, such as individual trees in the streets or small shrubs and ponds in private gardens, could be correctly identified and inventoried using these methods.
Dunedin City is a medium-sized city by New Zealand standards (fifth city in term of population after Auckland, Wellington, Christchurch, and Hamilton), and a small city by international standards; similar cities are ranked around 200 in the USA and above 500 in Europe (City Mayors Statistics, 2007). The replication of this work in larger cities of New Zealand would most likely require minor adaptation as vegetation communities and city structure (CBD, residential areas) are quite similar to Dunedin, although the size of the city may induce some limitations such as those discussed above. However, the mapping of vegetation community in other world cities would require at least the modification of the classification scheme as to reflect the local topo-climatic conditions and urban eco-history. Although the highest hierarchical levels are likely to be quite similar to the one found in New Zealand, many local differences and specificities may be required at the lowest hierarchical levels (e.g. species associations). Further, the stratification process may need to be adapted in areas where urban development is less planned and formal (e.g. developing countries) and / or where the boundaries between built-up and vegetated areas are less defined.
6. Conclusion
Detailed urban habitat maps are usually created by manual interpretation of aerial photographs, but this is time-consuming at large scales. To address this issue, we applied object-based classification techniques to very high resolution multispectral Ikonos images to produce a map of vegetation communities in Dunedin City, New Zealand. A vegetation stratum (including vegetation patches larger than 0.8/1ha) was segmented at a detailed scale to extract and classify fifteen classes of vegetation community. The first classification yielded a moderate overall classification accuracy (64%, κ= 0.52), mainly because of confusion between scrub habitats, shrublands, vineland and park/woodland. This led us to consider a simplified classification with ten vegetation classes. The overall classification was 77% with a κ value close to the excellent range (κ= 0.74). This approach did not provide maps at the same level of semantic detail as those produced by manually interpreting aerial photographs, but it was still possible to extract a number of ecologically significant vegetation classes. Object-based classification of Ikonos imagery was found to be an efficient way to generate accurate and detailed vegetation maps in significantly shorter time than with previous methods. The final map accuracy could be improved by integrating segmentation, automated and manual classification in the mapping process, especially when considering important vegetation classes with limited spectral contrast. Ultimately the application of either of these techniques, manual photo-interpretation vs. object-based classification, or a combination of both, to other cities will provide enhanced biodiversity understanding in the urban environment. However, the final choice of mapping technique will depend on the objectives (e.g. identifying minimum patch size, thematic accuracy) and the resources available.
Acknowledgments
The authors wish to thank the University of Otago and Paterson Pitts Partners Ltd (New Zealand) for providing research scholarships to Jagannath Aryal. We also thank Dr. Claire Freeman (University of Otago) for helping with technical advices on vegetation mapping and vegetation communities in New Zealand. Pascal Sirguey, Peter Knight, and Dr. John Hannah (University of Otago) are acknowledged for providing useful suggestions to the manuscript.
References and Notes
- Andersson, E. Urban landscapes and sustainable cities. Ecology and Society 2006, 11(1), 34. [Google Scholar]
- Atkinson, I.A.E. Derivation of vegetation mapping units for an ecological survey of Tongariro-National Park, North Island, New Zealand. New Zealand Journal of Botany 1985, 23(3), 361–378. [Google Scholar]
- Baatz, M.; Benz, U.; Dehghani, S.; Heynen, M.; Höltje, A.; Hofmann, P.; Lingenfelder, I.; Mimler, M.; Sohlbach, M.; Weber, M.; Willhauck, G. eCognition professional user guide.; Definiens Imaging GmbH: München, Germany, 2004. [Google Scholar]
- Benz, U.C.; Hofmann, P.; Willhauck, G.; Lingenfelder, I.; Heynen, M. Multi-resolution, object-oriented fuzzy analysis of remote sensing data for GIS-ready information. ISPRS Journal of Photogrammetry and Remote Sensing 2004, 58, 239–258. [Google Scholar]
- Blaschke, T.; Strobl, J. What's wrong with pixels? Some recent developments interfacing remote sensing and GIS. GIS 2001, 6, 12–17. [Google Scholar]
- Bock, M.; Xofis, P.; Mitchley, J.; Rossner, G.; Wissen, M. Object-oriented methods for habitat mapping at multiple scales– Case studies from Northern Germany and Wye Downs, UK. Journal for Nature Conservation 2005, 13, 75–89. [Google Scholar]
- Bolund, P.; Hunhammar, S. Ecosystem services in urban areas. Ecological Economics 1999, 29(2), 293–301. [Google Scholar]
- Breuste, J.H. Decision making, planning and design for the conservation of indigenous vegetation within urban development. Landscape and Urban Planning 2004, 68(4), 439–452. [Google Scholar]
- Carleer, A.P.; Wolff, E. Urban land cover multi-level region-based classification of VHR data by selecting relevant features. International Journal of Remote Sensing 2006, 27(5-6), 1035–1051. [Google Scholar]
- City Mayors Statistics. world's largest cities and urban areas in 2006 and 2020. Retrieved the 13thof November 2007 from http://www.citymayors.com/statistics/urban_intro.html.
- Congalton, R.G. A review of assessing the accuracy of classifications of remotely-sensed data. Remote Sensing of Environment 1991, 37, 35–46. [Google Scholar]
- Congalton, R.G.; Green, K. Assessing the accuracy of remotely sensed data: Principles and practices.; CRC/Lewis Press: Boca Raton, FL, 1999. [Google Scholar]
- Cornelis, J.; Hermy, M. Biodiversity relationships in urban and suburban parks in Flanders. Landscape and Urban Planning 2004, 69(4), 385–401. [Google Scholar]
- Cunningham, M.A. Accuracy assessment of digitized and classified land cover data for wildlife habitat. Landscape and Urban Planning 2006, 78(3), 217–228. [Google Scholar]
- Dial, G.; Bowen, H.; Gerlach, F.; Grodecki, J.; Oleszczuk, R. IKONOS satellite, imagery, and products. Remote sensing of Environment 2003, 88, 23–36. [Google Scholar]
- Dunn, R.R.; Gavin, M.C.; Sanchez, M.C.; Solomon, J.N. The pigeon paradox: Dependence of global conservation on urban nature. Conservation Biology 2006, 20(6), 1814–1816. [Google Scholar]
- Freeman, C. Geographic Information Systems and the conservation of urban biodiversity. Urban Policy and Research 1999, 17(1), 51–61. [Google Scholar]
- Freeman, C.; Buck, O. Development of an ecological mapping methodology for urban areas in New Zealand. Landscape and Urban Planning 2003, 63(3), 161–173. [Google Scholar]
- Giada, S.; De Groeve, T.; Ehrlich, D.; Soille, P. Information extraction from very-high resolution satellite imagery over Lukole refugee camp, Tanzania. International Journal of Remote sensing 2003, 24(22), 4251–4266. [Google Scholar]
- Guyot, G. Optical properties of vegetation canopies. In Applications of Remote Sensing in Agriculture; Steven, M.D., Clark, J.A., Eds.; Butterworth: London, 1990; pp. 19–43. [Google Scholar]
- Herold, M.; Liu, X.H.; Clarke, K.C. Spatial metrics and image texture for mapping urban land use. Photogrammetric Engineering and Remote Sensing 2003, 69(9), 991–1001. [Google Scholar]
- Herold, M.; Scepan, J.; Muller, A.; Gunther, S. Object-oriented mapping and analysis of urban land use/cover using IKONOS data. Proceedings of the 22nd EARSEL Symposium ‘Geoinformation for European Wide Integration’, Prague, Czech Republic, Jun 4-6, 2002.
- Hostetler, M. Scale, birds and human decisions: a potential for integrative research in urban ecosystems. Landscape and Urban Planning 1999, 45, 15–19. [Google Scholar]
- Jain, S.; Jain, R.K. A remote sensing approach to establish relationships among different land covers at the micro level. International Journal of Remote Sensing 2006, 27(13), 2667–2682. [Google Scholar]
- Johnson, M.; Reich, P.; Mac Nally, R. Bird assemblages of a fragmented agricultural landscape and the relative importance of vegetation structure and landscape pattern. Wildlife Research 2007, 34(3), 185–193. [Google Scholar]
- Keramitsoglou, I.; Kontoes, C.; Sifakis, N.; Mitchley, J.; Xofis, P. Kernel based re-classification of Earth observation data for fine scale habitat mapping. Journal for Nature Conservation 2005, 13, 91–99. [Google Scholar]
- Laliberte, A.S.; Rango, A.; Havstad, K.M.; Paris, J.F.; Beck, R.F.; McNeely, R.; Gonzalez, A.L. Object-oriented image analysis for mapping shrub encroachment from 1937 to 2003 in southern New Mexico. Remote Sensing of Environment 2004, 93, 198–210. [Google Scholar]
- Landis, J.R.; Kock, G.C. The measurement of observer agreement for categorical data. Biometrics 1977, 33, 159–174. [Google Scholar]
- Mathieu, R.; Freeman, C.; Aryal, J. Mapping private gardens in urban areas using object-oriented techniques and very high resolution satellite imagery. Landscape and Urban Planning 2007, 81(3), 179–192. [Google Scholar]
- Mickelson, J.G.; Civco, D.L.; Silander, J.A. Delineating forest canopy species in the north-eastern United States using multi-temporal TM imagery. Photogrammetric Engineering and Remote Sensing 1998, 64(9), 891–904. [Google Scholar]
- Millington, A.C.; Alexander, R.W. Vegetation mapping in the last three decades of the twentieth century. In Vegetation Mapping: from Patch to Planet; Millington, A.C., Alexander, R.W., Eds.; John Wiley and Sons: Chichester, 2000; pp. 321–329. [Google Scholar]
- Moller, M.; Lymburner, L.; Volk, M. The comparison index: A tool for assessing the accuracy of image segmentation. International Journal of Applied Earth Observation and Geoinformation 2007, 9, 311–321. [Google Scholar]
- Myint, S.W.; Lam, N. Examining lacunarity approaches in comparison with fractal and spatial autocorrelation techniques for urban mapping. Photogrammetric Engineering and Remote Sensing 2005, 71(8), 927–937. [Google Scholar]
- Nichol, J.; Lee, C.M. Urban vegetation monitoring in Hong Kong using high resolution multi-spectral images. International Journal of Remote Sensing 2005, 26(5), 903–918. [Google Scholar]
- Nichol, J.; King, B.; Quattrochi, D.; Dowman, I.; Ehlers, M.; Ding, X.L. Earth Observation for urban planning and management - State of the art and recommendations for application of Earth Observation in urban planning. Photogrammetric Engineering and Remote Sensing 2007, 73(9), 973–979. [Google Scholar]
- Péteri, R.; Couloigner, I.; Ranchin, T. Quantitatively assessing roads extracted from high-resolution imagery. Photogrammetric Engineering and Remote Sensing 2004, 70(12), 1449–1456. [Google Scholar]
- Ranchin, T.; Wald, L. Fusion of high spatial and spectral resolution images: The ARSIS concept and its implementation. Photogrammetric Engineering and Remote Sensing 2000, 66(1), 49–61. [Google Scholar]
- Rutchey, K.; Vilcheck, L. Development of an Everglades vegetation map using a SPOT image and the Global Positioning System. Photogrammetric Engineering and Remote Sensing 1994, 60(6), 767–775. [Google Scholar]
- Sandstrom, U.G.; Angelstam, P.; Mikusinski, G. Ecological diversity of birds in relation to the structure of urban green space. Landscape and Urban Planning 2006, 77(1-2), 39–53. [Google Scholar]
- Savard, J-P.L.; Clergeau, P.; Mennechez, G. Biodiversity concepts and urban ecosystems. Landscape and Urban Planning 2000, 48(3-4), 131–142. [Google Scholar]
- Sawaya, K.E.; Olmanson, L.G.; Heinert, N.J.; Brezonik, P.L.; Bauer, M.E. Extending satellite remote sensing to local scales: Land and water resource monitoring using high-resolution imagery. Remote Sensing of Environment 2003, 88(1-2), 144–156. [Google Scholar]
- Seidling, W. Derived vegetation map of Berlin. In Urban Ecology; Breuste, J., Feldmann, H., Uhlmann, O., Eds.; Springer-Verlag: Berlin, Germany, 1998; pp. 648–652. [Google Scholar]
- Smith, R.M.; Thompson, K.; Warren, P.H.; Gaston, K.J. Urban domestic gardens (IX): composition and richness of vascular plant flora, and implications for native biodiversity. Biological Conservation 2006, 129, 312–322. [Google Scholar]
- Statistics New Zealand. Dunedin City community profile. Retrieved the 25thof November 2005 from http://www2.stats.govt.nz/domino/external/web/CommProfiles.nsf/FindInfobyArea/071-ta.
- Shackelford, A.K.; Davis, C.H. A combined fuzzy pixel-based and object-based approach for classification of high-resolution multispectral data over urban areas. IEEE Transactions on Geoscience and Remote Sensing 2003, 41(10), 2354–2363. [Google Scholar]
- Small, C. High spatial resolution spectral mixture analysis of urban reflectance. Remote Sensing of Environment 2003, 88(1-2), 170–186. [Google Scholar]
- Stefanov, W.L.; Ramsey, M.S.; Christensen, P.R. Monitoring urban land cover change: An expert system approach to land cover classification of semiarid to arid urban centers. Remote Sensing of Environment 2001, 77(2), 173–185. [Google Scholar]
- Stow, D.; Coulter, L.; Kaiser, J.; Hope, A.; Service, D.; Schutte, K.; Walters, A. Irrigated vegetation assessment for urban environments. Photogrammetric Engineering and Remote Sensing 2003, 69(4), 381–390. [Google Scholar]
- Thenkabail, P.S.; Enclona, E.A.; Ashton, M.S.; Legg, C.; Dedieu, M.J. Hyperion, IKONOS, ALI, and ETM+ sensors in the study of African rainforests. Remote Sensing of Environment 2004, 90(1), 23–43. [Google Scholar]
- Thomas, N.; Hendrix, C.; Congalton, R.G. A comparison of urban mapping methods using high-resolution digital imagery. Photogrammetric Engineering and Remote Sensing 2003, 69(9), 963–972. [Google Scholar]
- Yu, Q.; Gong, P.; Clinton, N.; Biging, G.; Kelly, M.; Schirokauer, D. Object-based detailed vegetation classification with airborne high spatial resolution remote sensing imagery. Photogrammetric Engineering and Remote Sensing 2006, 72(7), 799–811. [Google Scholar]
- Zhang, Q.; Wang, J. A rule-based urban land use inferring method for fine-resolution multispectral imagery. Canadian Journal of Remote Sensing 2003, 29(1), 1–13. [Google Scholar]
- Zhang, X.; Feng, X. Detecting urban vegetation from IKONOS data using an object oriented approach. Proceedings of IGARSS 2005, Seoul, Korea, Jul 25-29, 2005.
Figure 1.
Segmentation of the Ikonos image at the scale of 22 (upper left), 40 (upper right), 125 (lower left), and colour aerial photograph (lower right). Yellow lines delineate the image objects. The Ikonos image is displayed as a false colour composite, red channel = near infrared, green channel = red, blue channel = green. The vegetated area shown in the image is the Dunedin Botanical Garden, one of the significant ecological entities located within the city.

Figure 2.
Vegetation, industrial / commercial, residential, and water strata of Dunedin City, New Zealand, extracted from the multispectral Ikonos image.
Figure 2.
Vegetation, industrial / commercial, residential, and water strata of Dunedin City, New Zealand, extracted from the multispectral Ikonos image.
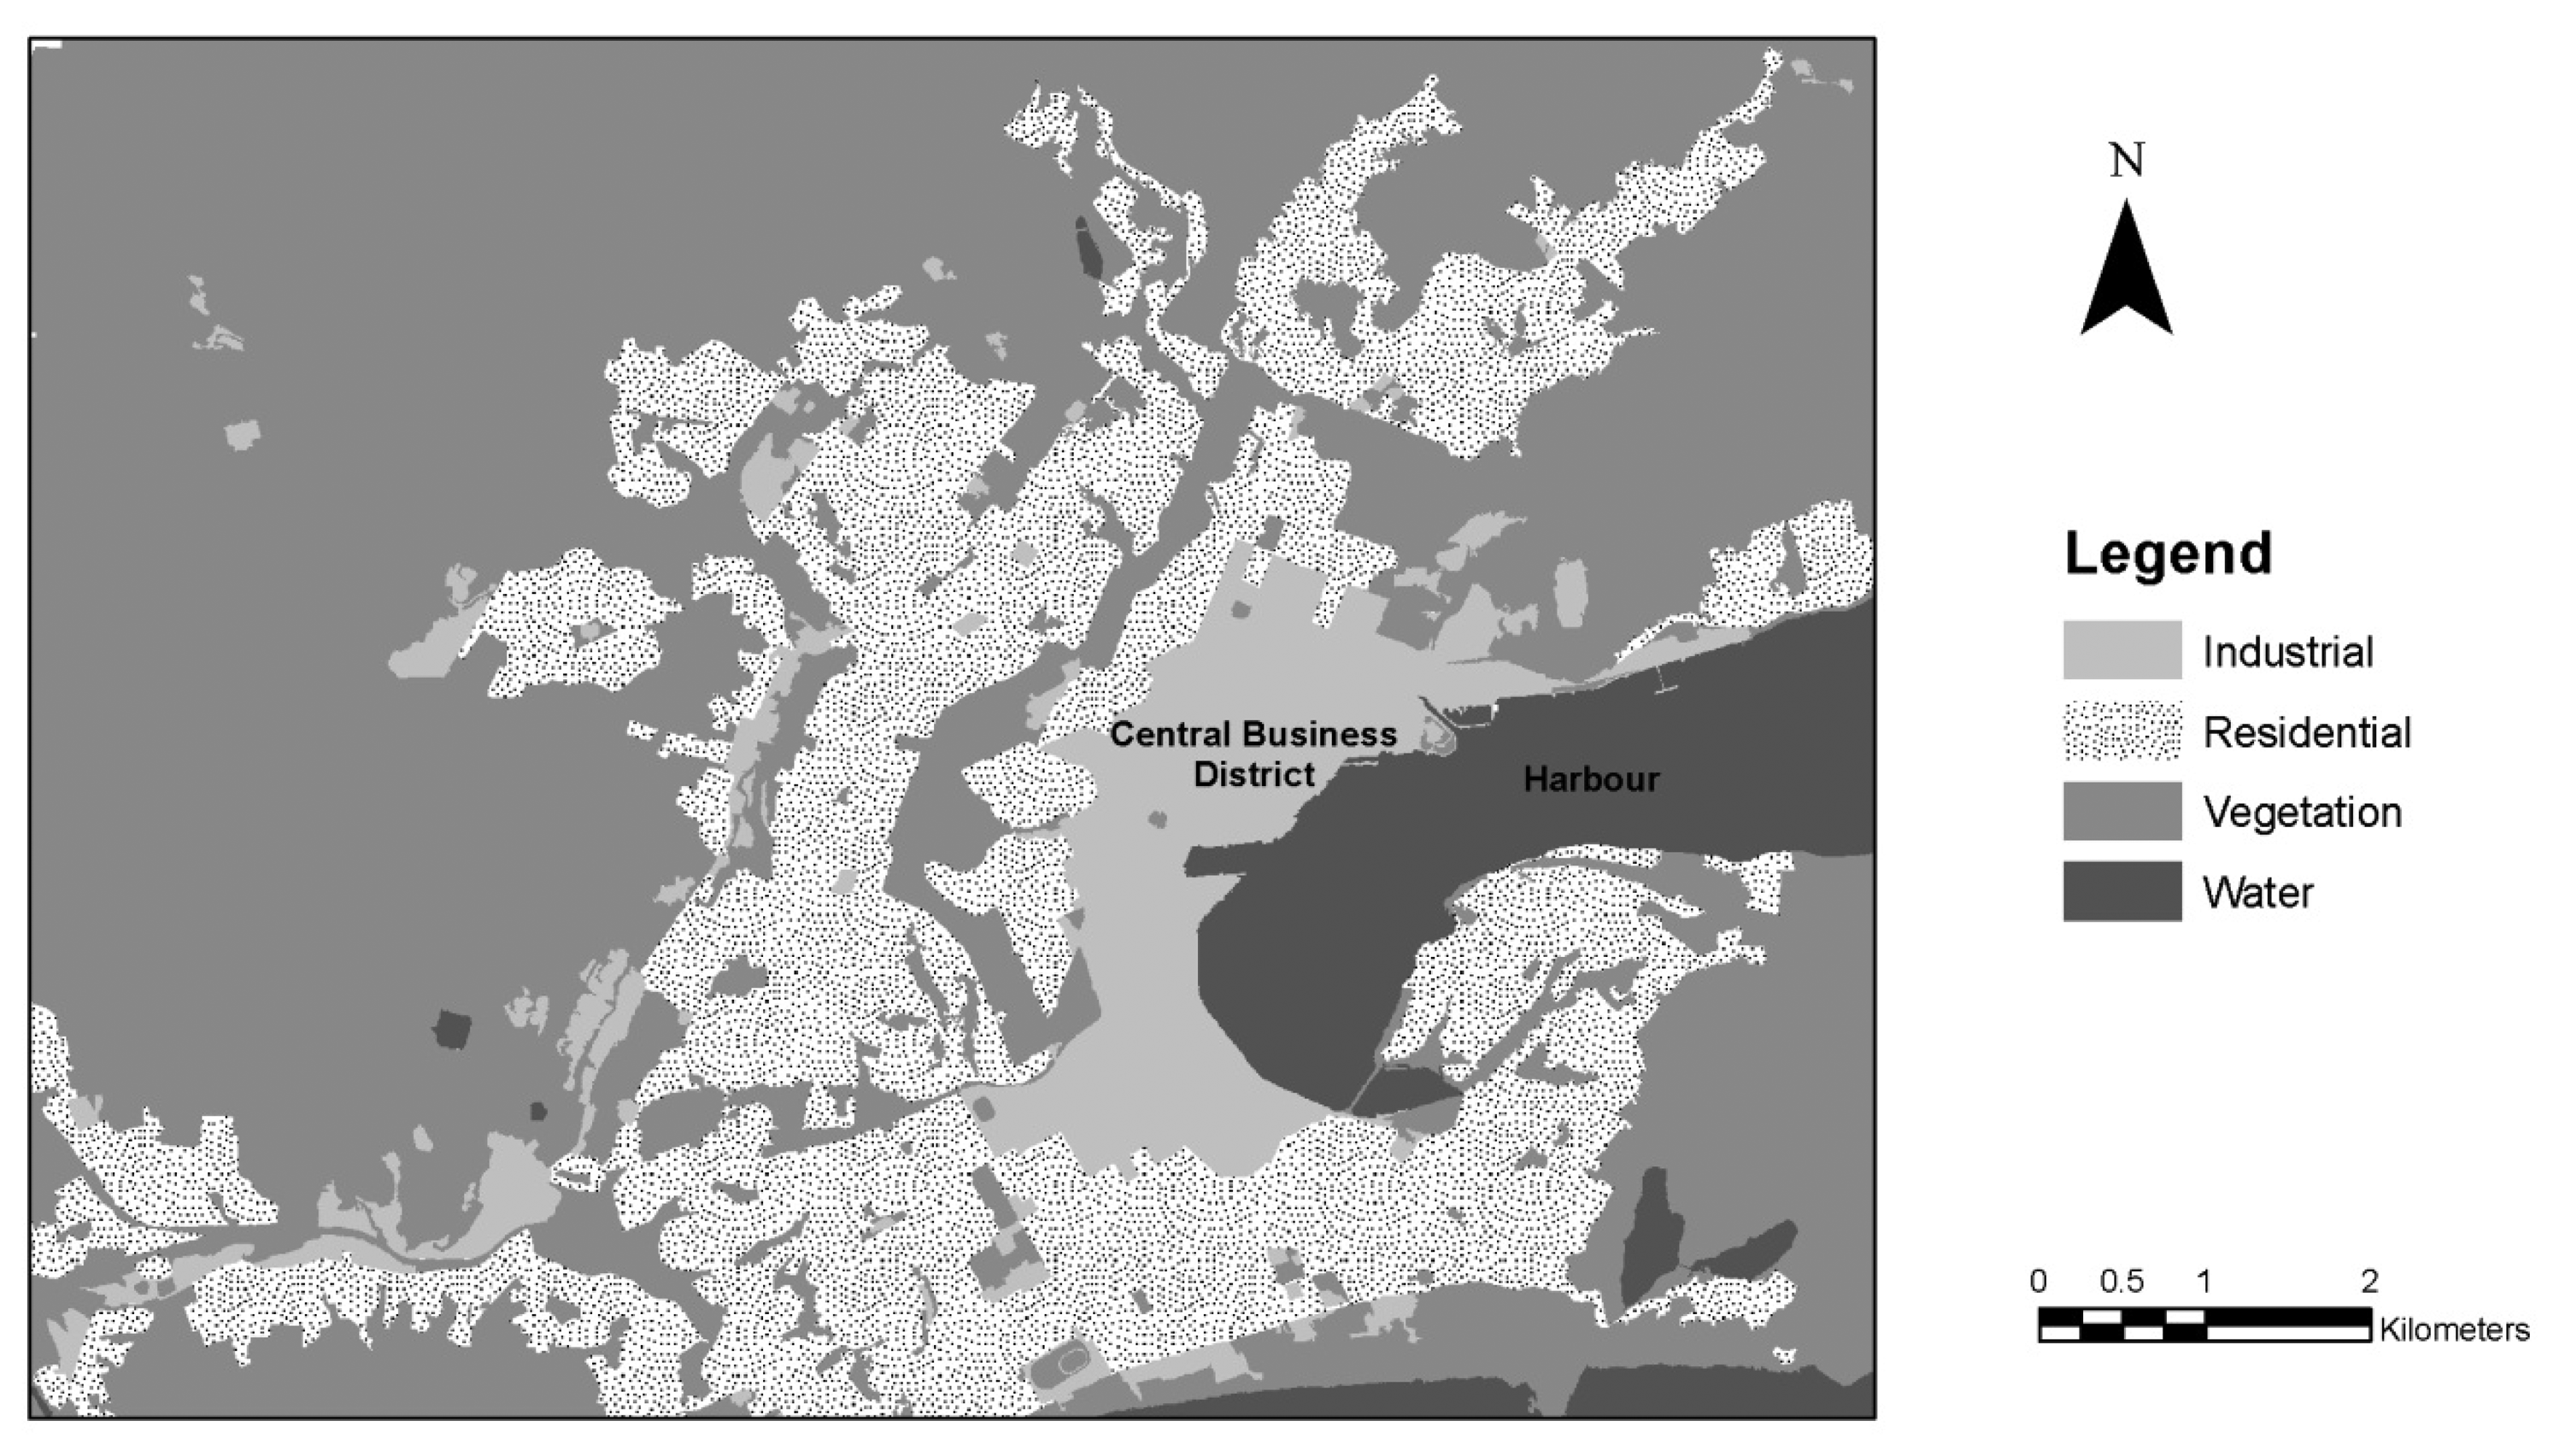
Figure 3.
Producer's accuracies, user's accuracies, and overall accuracy of the classification of vegetation communities using fifteen classes, Dunedin City, New Zealand. Mean producer's and user's accuracy (in parenthesis) are given for level 1 habitat types (see Table 1).
Figure 3.
Producer's accuracies, user's accuracies, and overall accuracy of the classification of vegetation communities using fifteen classes, Dunedin City, New Zealand. Mean producer's and user's accuracy (in parenthesis) are given for level 1 habitat types (see Table 1).
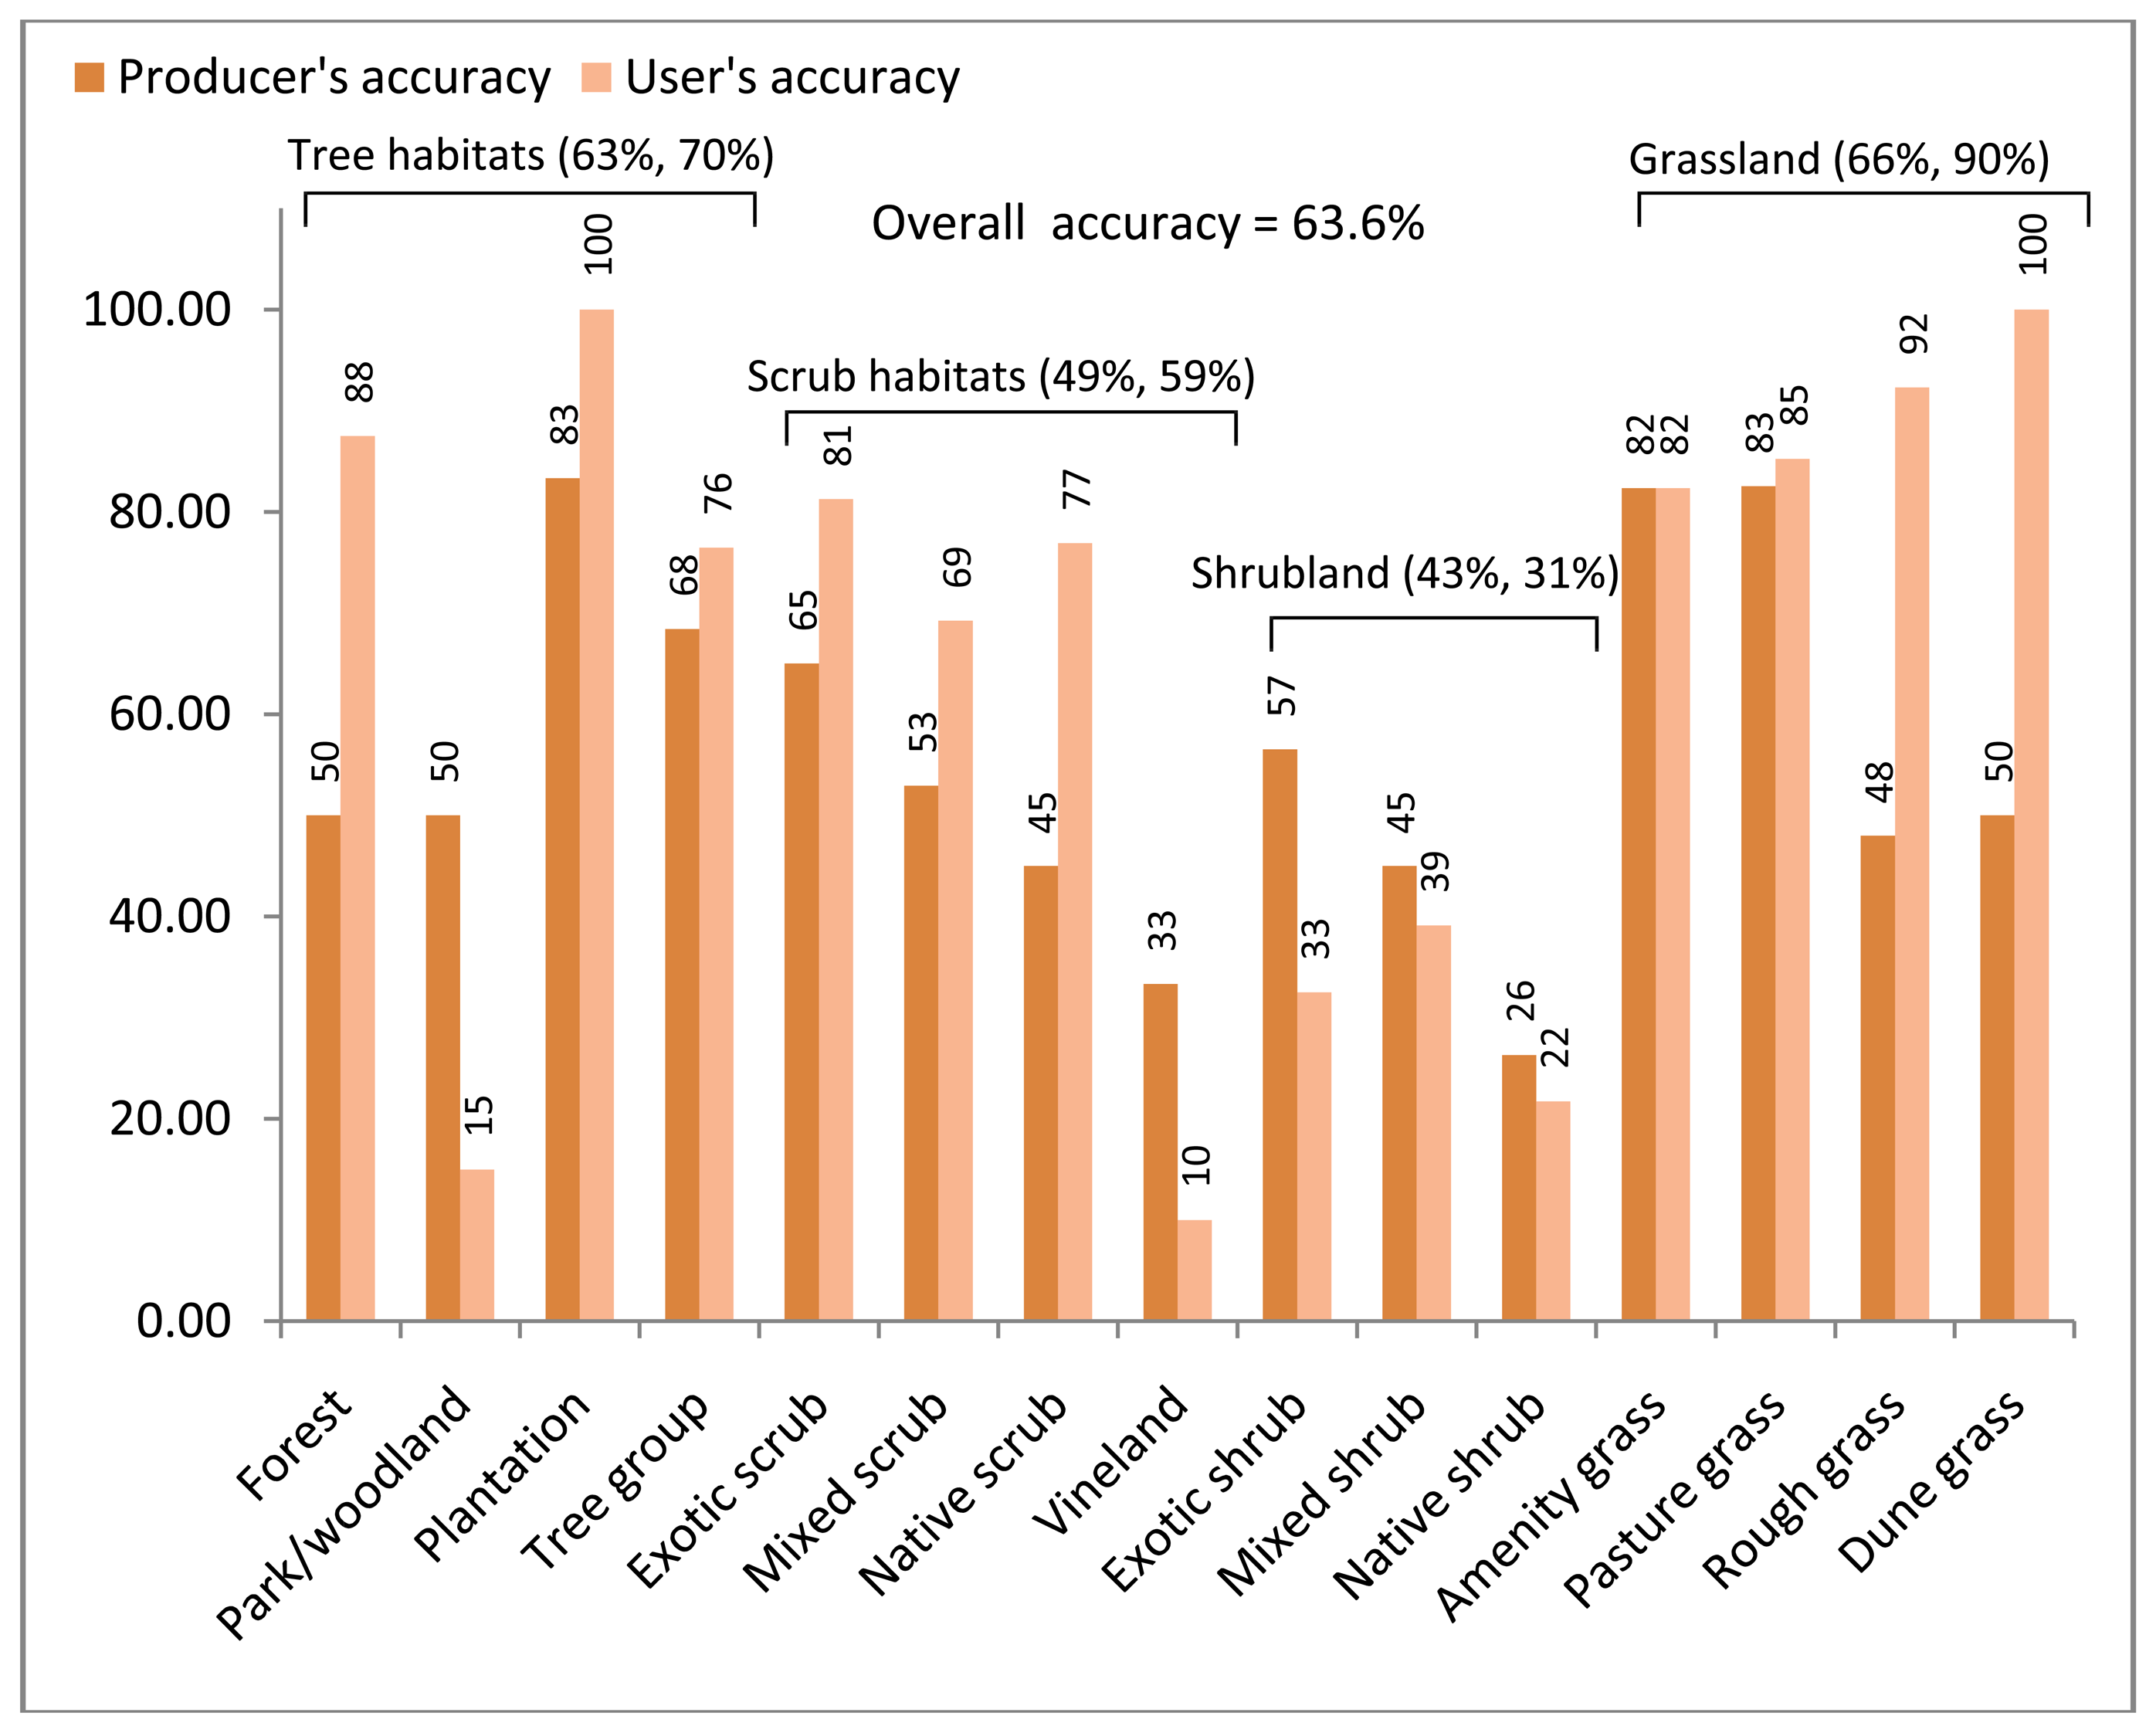
Figure 4.
Producer's accuracies, user's accuracies, and overall accuracy of the classification of vegetation communities using ten classes, Dunedin City, New Zealand. Mean producer's and user's accuracy (in parenthesis) are given for level 1 habitat types (see Table 1).
Figure 4.
Producer's accuracies, user's accuracies, and overall accuracy of the classification of vegetation communities using ten classes, Dunedin City, New Zealand. Mean producer's and user's accuracy (in parenthesis) are given for level 1 habitat types (see Table 1).

Table 1.
Classification scheme for the vegetation community classes and other habitats in Dunedin City, New Zealand (adapted and modified from Freeman and Buck, 2003).
| Level I - habitat type | Level II - class | Description |
|---|---|---|
| Tree habitats (avg. stem dbh > 0.1 m) | Bush and forest | Structure-rich tree stands, height > five meters |
| Plantation | Exotic tree stands of uniform age, incl. shelterbelts | |
| Park/woodland | Scattered trees over grassland or scrub | |
| Tree group | Isolated group of trees, native and/or exotic, < one ha | |
| Scrub habitats (avg. stem dbh < 0.1 m) | Exotic scrub | Closed canopy, non-native species |
| Mixed scrub | Closed canopy, mixture of non-native & native species | |
| Native scrub | Closed canopy, native species | |
| Vineland | Scrub vegetation heavily covered by woody vines | |
| Shrubland (avg. stem dbh < 0.1 m) | Exotic shrub | Open canopy, non-native species |
| Mixed shrub | Open canopy, mixture of non-native & native species | |
| Native shrub | Open canopy, native species | |
| Grassland | Amenity grassland | Intensively managed and regularly mown pasture |
| Pasture grassland | Intensively managed and regularly grazed pasture | |
| Rough grassland | Irregularly managed grassland, including tussocks | |
| Dune grassland | Grassland on consolidated dunes | |
| Non vegetation | House | Including farms (> 0.25 ha) |
| Bare ground | Inclusive bare soil, gravel, quarry, sand | |
| Road, sealed surface | Concrete (e.g. parking) | |
| Coastal water | ||
| Standing water | ||
Table 2.
Confusion matrix of the classification of vegetation communities using fifteen classes, Dunedin City, New Zealand (total number of validation objects = 354).
| Ground references | Tree habitats | Scrub habitats | Shrubland | Grassland | |||||||||||||
|---|---|---|---|---|---|---|---|---|---|---|---|---|---|---|---|---|---|
| Classification | |||||||||||||||||
| For | Par | Pla | Tre | Exo | Mix | Nat | Vin | Exo | Mix | Nat | Am | Past | Rou | Du | R | ||
| Tree Habitats | Forest | 14 (50) | 2 (33) | 16 | |||||||||||||
| Park/woodland | 2 (7) | 3 (50) | 2 (7) | 5 (27) | 1 (5) | 1 (6) | 1 (17) | 2 (10) | 1 (5) | 2 (8) | 20 | ||||||
| Plantation | 25 (83) | 25 | |||||||||||||||
| Tree group | 3 (11) | 1 (17) | 13 (68) | 17 | |||||||||||||
| Scrub habitats | Exotic scrub | 13 (65) | 2 (9) | 1 (5) | 16 | ||||||||||||
| Mixed scrub | 9 (53) | 4 (20) | 13 | ||||||||||||||
| Native scrub | 2 (12) | 10 (45) | 1 (17) | 13 | |||||||||||||
| Vineland | 4 (14) | 2 (10) | 2 (12) | 7 (33) | 2 (33) | 1 (4) | 1 (5) | 1 (5) | 20 | ||||||||
| Shrubland | Exotic shrub | 1 (4) | 2 (7) | 3 (15) | 1 (6) | 1 (17) | 13 (57) | 2 (10) | 10 (52) | 1 (2) | 2 (3) | 4 (16) | 40 | ||||
| Mixed shrub | 3 (10) | 1 (3) | 1 (5) | 1 (5) | 2 (9) | 9 (45) | 2 (10) | 1 (2) | 3 (12) | 23 | |||||||
| Native shrub | 1 (4) | 2 (12) | 3 (14) | 1 (17) | 5 (21) | 1 (5) | 5 (26) | 1 (2) | 2 (8) | 2 (33) | 23 | ||||||
| Grassland | Amenity grass | 1 (6) | 42 (82) | 8 (13) | 51 | ||||||||||||
| Pasture grass | 7 (14) | 52 (83) | 2 (8) | 61 | |||||||||||||
| Rough grass | 12 (48) | 1 (17) | 13 | ||||||||||||||
| Dune grass | 3 (50) | 3 | |||||||||||||||
| Column Total | 28 | 6 | 30 | 19 | 20 | 17 | 21 | 6 | 23 | 20 | 19 | 51 | 63 | 25 | 6 | 354 | |
Values are given in number of image objects, values in parenthesis are percentages given in relation to the column total.
Table 3.
Confusion matrix of the classification of vegetation communities using ten classes, Dunedin City, New Zealand (total number of validation objects = 354).
| Ground references | Tree habitats | Scrub & shrub habitats | Grassland | |||||||||
|---|---|---|---|---|---|---|---|---|---|---|---|---|
| Classification | ||||||||||||
| Forest | Plantation | Tree group | Exotic scrub | Mixed scrub | Native scrub | Amenity grass | Pasture grass | Rough grass | Dune grass | Row Total | ||
| Tree habitats | Forest | 19 (63) | 1 (4) | 1 (2) | 3 (8) | 1 (2) | 25 | |||||
| Plantation | 25 (83) | 2 (5) | 27 | |||||||||
| Tree group | 5 (17) | 18 (82) | 1 (2) | 1 (3) | 2 (4) | 2 (8) | 29 | |||||
| Scrub & shrub habitats | Exotic scrub | 1 (3) | 34 (79) | 1 (3) | 2 (4) | 1 (2) | 39 | |||||
| Mixed scrub | 2 (7) | 1 (3) | 23 (62) | 1 (2) | 27 | |||||||
| Native scrub | 4 (13) | 2 (7) | 3 (7) | 3 (8) | 36 (77) | 2 (8) | 1 (17) | 51 | ||||
| Grassland | Amenity grass | 3 (14) | 3 (8) | 1 (2) | 45 (88) | 10 (16) | 1 (4) | 1 (17) | 64 | |||
| Pasture grass | 1 (3) | 2 (5) | 2 (5) | 4 (9) | 6 (12) | 52 (83) | 2 (8) | 69 | ||||
| Rough grass | 1 (3) | 18 (72) | 1 (17) | 20 | ||||||||
| Dune grass | 3 (50) | 3 | ||||||||||
| Column Total | 30 | 30 | 22 | 43 | 37 | 47 | 51 | 63 | 25 | 6 | 354 | |
Values are given in number of image objects, values in parenthesis are percentages given in relation to the column total.
Table 4.
Conditional kappa value (κ) for the ten vegetation communities classes of the simplified classification (computed after Congalton and Green 1999).
| Level I – habitat type | Level II - class | Conditional κvalue | Range * |
|---|---|---|---|
| Tree habitats | Forest | 0.74 | good |
| Plantation | 0.92 | excellent | |
| Tree group | 0.6 | moderate | |
| Scrub & shrub habitats | Exotic scrub | 0.85 | excellent |
| Mixed scrub | 0.83 | excellent | |
| Native scrub | 0.66 | good | |
| Grassland | Amenity grass | 0.65 | good |
| Pasture grass | 0.70 | good | |
| Rough grass | 0.89 | excellent | |
| Dune grass | 1 | excellent | |
*Classification after Landis & Koch (1977)
| Level I – habitat type | Level II - class | Area (ha) | Percent (%) |
|---|---|---|---|
| Tree habitats | Forest | 77.5 | 2.4 |
| Plantation | 40.0 | 1.2 | |
| Tree group | 281.1 | 8.6 | |
| Scrub & shrub habitats | Exotic scrub | 57.8 | 1.8 |
| Mixed scrub | 112.6 | 3.5 | |
| Native scrub | 385.2 | 11.8 | |
| Grassland | Amenity grass | 502.2 | 15.4 |
| Pasture grass | 390.4 | 11.9 | |
| Rough grass | 31.2 | 1.0 | |
| Dune grass | 6.6 | 0.2 | |
| Total area vegetation (a) | 1884.6 | 57.6 | |
| Non vegetation | Built | 1,204.8 | 36.8 |
| Bare ground (Bare soil) | 3.6 | 0.1 | |
| Bare ground (Quarry, Gravel) | 43.7 | 1.3 | |
| Water | 131.8 | 4.0 | |
| Sand | 1.1 | 0.0 | |
| Total area other habitats (b) | 1385.0 | 42.4 | |
| TOTAL AREA (a) + (b) | 3269.6 | 100.0 | |
© 2007 by MDPI ( http://www.mdpi.org). Reproduction is permitted for noncommercial purposes.
Share and Cite
MDPI and ACS Style
Mathieu, R.; Aryal, J.; Chong, A.K. Object-Based Classification of Ikonos Imagery for Mapping Large-Scale Vegetation Communities in Urban Areas. Sensors 2007, 7, 2860-2880. https://doi.org/10.3390/s7112860
AMA Style
Mathieu R, Aryal J, Chong AK. Object-Based Classification of Ikonos Imagery for Mapping Large-Scale Vegetation Communities in Urban Areas. Sensors. 2007; 7(11):2860-2880. https://doi.org/10.3390/s7112860
Chicago/Turabian StyleMathieu, Renaud, Jagannath Aryal, and Albert K. Chong. 2007. "Object-Based Classification of Ikonos Imagery for Mapping Large-Scale Vegetation Communities in Urban Areas" Sensors 7, no. 11: 2860-2880. https://doi.org/10.3390/s7112860